Abstract
Distributed generation strengthens distribution network reliability by placing generators close to load centers. The integration of electric vehicle charging stations (EVCSs) with PV systems mitigates the effects of EV charging burden. In this research, the objective is to combineEVCSs with distributed generation (DG) units in the Puducherry smart grid system to obtain optimized locations and enhance their reliability. To determine the right nodes for DGs and EVCSs in an uneven distribution network, the modified decision-making (MDM) algorithm and the model predictive control (MPC) approach are used. The Indian utility 29-node distribution network (IN29NDN), which is an unbalanced network, is used for testing. The effects of PV systems and EVCS units are studied in several settings and at various saturation levels. This study validates the correctness of its findings by evaluating the outcomes of proposed methodological approaches. DIgSILENT Power Factory is used to conduct the simulation experiments. The results show that optimizing the location of the DG unit and the size of the PV system can significantly minimize power losses and make a distribution network (DN) more reliable.
1. Introduction
The analysis of power system reliability is an important part of the planning, design, and management of power system operations. Assessment findings provide significant reference values for the design and operation of power systems. It is essential for a power system to be reliable, since its functioning guarantees a continuous supply of electricity to end users and ensures that consumers are satisfied. Failures in the distribution network, which are responsible for 80–90% of power outages, are the main reason for reliability issues in power systems. DN operators and power utility corporations are always worried about the reliability of DNs [1].
The presence of faults in these networks may make it impossible for electricity to flow smoothly, which can result in significant financial losses, cause customers to experience discomfort, and, in some circumstances, put people’s lives and property at risk. Among these faults, incipient faults, which are faults that are in the early stages of development and often exhibit subtle symptoms, pose a particular challenge for timely detection and mitigation. Because more and more people want a steady power supply, ensuring that early faults are quickly found and fixed is becoming very important in making sure that power distribution networks keep working well. The reliability evaluation approach generates insights in the form of indices, which are then used as the bases for conducting reliability studies on power distribution networks. This technique is used together with descriptive statistical analysis of the data around a system to reorganize its electrical distribution network and boost network reliability [2].
In accordance with the Weibull probability distribution function model, it is suggested that the failure rate (λ) of homologous components goes through a period of temporal variations. The three trend lines shown by the Weibull probability distribution function back up the assumptions that were made for the time-to-failure dataset. These trend lines offer a foundation for the assumptions that were made. The bathtub curve describes the failure rate of a product over its entire lifespan. In addition to the prediction of reliability, it is possible that this might also be advantageous for condition-based reliability managementas well as reliability in other engineering disciplines [3].
The assessment of a DN’s reliability can serveas the foundation for system management and planning, which in turn has an impact on the level of investment and the price of power in a DN. In addition, reliability analyses assistin determining the efficiency of a DN and offersuggestions for additional DN components that are required to improve the reliability of the system. In order to decrease the length and frequency of system disturbances and offer end users a steady supply of power, further research has to be undertaken on the power losses and reliability of a DN that uses DG sources [4]. According to the authors, reliability might be increased by a single DG injection at the load point or at the far end of a feeder, and reliability could be further increased by several DG unit injections at various locations. Conversely, conducting multiple DG unit injections at a single location compromises a system’s reliability. Changing the size of a DG is recommended to prevent the system’s reliability from being compromised.
The road transportation industry is one of the most significant contributors to total greenhouse gas emissions. Internal-combustion-engine-powered automobiles are not as environmentally beneficial as EVs. On the other hand, the broad adoption of electric cars may pose significant issues for the electrical grid due to the increased and variable power demand of EVCSs. The improper placement of charging stations for electric vehicles within the DN of an electric power company causes a decreased voltage stability and reliability indices, a drop in reserve margin, and an increase in power losses [5].
It is possible that the introduction of distributed generation and EVCSs into distribution networks will result in issues that have the potential to significantly impact DN reliability. When it comes to maintaining reliability parameters within manageable bounds and ensuring that customers have access to an uninterrupted electrical supply, it is of the utmost importance to take the necessary procedures. The aim of this paper is to minimize the active power losses and increase distribution network reliability by optimizing the number of DGs and EVCS units, as well as their sizes and positions.
Literature Survey
The study by Matheus Montanini et al. verifies the creation and validation of a graph-based reliability analysis technique for the decentralized architectures of distribution networks. By employing a sequential Monte Carlo simulation method combined with flow network graphs, the system can accurately represent energy storage, distributors, sources, loads, and multistate operations. This allows for the bidirectional power flows and a variety of network designs to be implemented. The framework is especially beneficial for early-stage system design and the study of contemporary, decentralized power systems like microgrids since it allows for variable system parameter modification and offers important reliability metrics [6]. The study by Jiaxin Zhang et al. suggests a hybrid data-driven approach for quickly evaluating the reliability of the power grid. This is achieved by combining explicit analytical expressions with convolutional neural networks. This approach eliminates the computational burden of repetitive Monte Carlo simulations, enabling the rapid online evaluation of reliability indices. Using the improved RTS-79 system, we can see that the method works [7]. The study by Farzaneh et al. demonstrates that the Chimp Optimization Algorithm effectively optimizes DG placement in 119-bus RDNs, achieving a 61.70% reliability improvement and thereby improving voltage stability and lowering power losses [8]. The purpose of the proposal by Shuai Zhang et al. is to present a paradigm for evaluating the reliability of distribution networks that takes into consideration the impact of uncertainty caused by renewable energy. The study uses an IEEE 123-bus system with PV access and a controllable CWGAN model to make realistic scenarios for renewable energy that do not use predefined probability distributions. This method improves the assessment of reliability by including statistical information about DG output power. It also shows how the characteristics of renewable energy affect system performance [9]. Sanaullah Ahmad et al. show that DG is most reliable when placed correctly in distribution networks, especially when installed near load centers. Reliability improvements include a reduction in SAIFI, SAIDI, and EENS after DG integration [10].
Walied Alfraidi et al. incorporate a distribution network performance that can be improved by integrating EV charging stations that possess varying levels of flexibility; this leads to effective power loss mitigation, enhanced renewable energy utilization, and better peak load management. The growth of electric mobility is supported by the proposed energy hub framework, in addition to the broader goals of energy transition and sustainability [11]. Saumya Singh et al. review EV technologies, converter challenges, and grid integration impacts. Their study looks at charging infrastructures and the problems with reliability in G2V and V2G, and they investigate the way in which the rise of electric vehicles affects distribution networksas well as converter inefficiencies, synchronization problems, and reliability issues [12]. The research by A. Moradi Amani et al. investigates the equilibrium that exists between PVs and the distribution grid, which is subject to unregulated charging, including electric vehicles and battery energy storage systems. The findings indicate that the pre-balancing of these technologies requires minimal control. DNOs should proactively balance PV and BESS before widespread EV adoption to enhance grid stability and demand-side management efficiency [13].
Fulu Yan et al. established a novel bidding space model that they constructed for photovoltaic storage charging stations (PSCSs), within which electric vehicles, photovoltaic generation, and energy storage are dynamically integrated. A two-stage bidding strategy for multiple PSCSs is also established; in its first stage, they aim to achieve the lowest cost for power purchased by a PSCS, to optimize of power generation and planning; in its second stage, they pursue the lowest cost of the grid operator power purchase, to optimize of the system’s power balance [14]. Mohd Bilal et al. explore the way in which integrating EV charging stations with distributed generation can mitigate the grid challenges that arise from EV adoption. A hybrid AI approach is proposed for optimal EVCS and DG placement in balanced distribution systems. The findings provide better voltage stability, lower power losses, and increased grid reliability compared to conventional approaches [15]. Sandeep et al. analyzes the addition of EVs and photovoltaic systems into the grid, which is crucial for promoting sustainable transportation and redefining the energy market. To accomplish a seamless integration of PV solar systems with electric vehicles, it is necessary to enhance the power quality and the stability of electric vehicle charging stations. Ongoing research and development are essential for guaranteeing a sustainable and resilient energy future [16]. This study points out the importance of advanced tools in reliability assessment and DG placement. However, existing works generally present segmented solutions, focusing on either evaluation methods or optimizing single DER types. Crucially, none of these directly address the simultaneous optimal placement and sizing of a heterogeneous mix of PVs, EVCSs, and BESS within a single, unified optimization framework in complex, unbalanced, real-world distribution networks. This study introduces the MDM algorithm and MPC approach, which provide a flexible and tested solution that addresses multiple goals for planning and operating modern, complex smart grids.
Further work will be carried out to complete the contributions presented in this paper. The rest of this paper is structured as follows: Section 2 provides a mathematical definition of the issue and its intended functions. Section 3 details the proposed optimization process. Section 4 investigates the influence of the integration of PV systems and EVCSs. The responses and the outcomes are provided in Section 5. Lastly, Section 6 comprises the concluding observations.
2. Materials and Methods
Finding ideal locations and sizes within the scope of optimal DG and EVCS allocation planning is difficult due to variable load situations. As a result, many essential assumptions are prepared here, including constant load over the planning period, aggregated fixed EV charging demand, balanced network operation, and peak load management. The above assumptions contribute to a solid and trustworthy planning process. To ensure that the ideal DG position and capacity are reached without violating the system constraint, load flow analysis must be performed at each step. The primary functions that are being investigated are active power losses, voltage profile improvement, and reliability improvements.
2.1. Direct Approach Method for Load Flow Analysis
In this work, power losses and voltage levels in distribution systems with high R/X ratios are analyzed using the load flow method. To improve system performance, EV charging stations and distributed generation based on PV systems are planned as efficiently as possible. This research ensures the successful integration of PVs and EVCSs while resolving the disadvantages of conventional power flow methodologies. Figure 1 shows a classic distribution network diagram with these connections. This diagram also displays the present load and the EVCS load, a specific area of the distribution network (DN) defined by parameters such as admittance. The sending and receiving end nodes of the distribution network are referred to as i and j, respectively. Accordingly, the diagram represents the voltages at these nodes, i and j. Particularly, real power usage rises solely when EVCSs are installed at any specific node in the distribution network. By positioning the PV system in the DN, the power loss can be reduced [17]. Therefore, the optimal location for PV/EVCS is the node with the lowest branch current. Effective power distribution and system efficiency are enhanced by this strategic placement, which guarantees ideal integration.
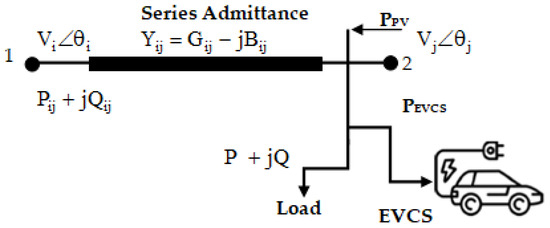
Figure 1.
Distribution network model with PV and EVCS.
The single-line model obtains the following simplified system of recursive equations. These equations are used to compute power flows. The following equation determines an indication of the magnitude of the voltage at node j.
In Equation (1), denotes the voltage at node j, whereas represents the voltage at node i. Admittance, , is a combination of conductivity () and the susceptibility () of the line connecting nodes i and j, respectively.
The injected current at node j, indicated by in Equation (2), is calculated as a complex conjugate of the apparent power, , by the voltage, , at node i, divided by the total. At node j, the actual power load is denoted by , while the reactive power load is denoted by .
To determine the reactive and real power losses in the system, one uses the following equation. The actual power loss between nodes i and j is found using the expression in Equation (3).
Furthermore, Equation (4) calculates the reactive power dissipation between nodes i and j.
In this case, indicates the passage of reactive power along the same line, which reflects the actual power flow in the line connected between nodes i and j. It is possible to determine the overall power losses of the system by calculating the power losses associated with each branch separately.
2.2. Modeling of EVCS Load for IU29NDN
The additional strain that EVCSs place on the DN increases its total load. After EVCSs are integrated, the equation may be used to evaluate the overall load on the distribution network [18]. This computation is represented by Equation (5), where Nn is the total number of nodes in the system.
PAvailable (j) indicates the load that already exists on the ith node, PLoad symbolizes the total load, and PEVCS (j) represents the load from an EVCS connected to the jth node in the previous equation. Equations (6) and (7) provide the information that is necessary to generate a calculation for the quantity of energy that is required for charging the battery. The evolution of the EVCS model is as follows:
The term PEVCS refers to the total power requirements of an EVCS. In the context of battery state of charge (SOC), the SC indicates the necessary charging amount and the BC indicates the battery rating. The SOCPS provides information on the present status of the SOC, while the NEVCS and NT values illustrate the total number of electric vehicles linked to DN and the number of electric vehicles that are currently connected to the network, respectively.
2.3. Objective Function
Finding the ideal locations for PV–EVCSs within the IU29NDN is the main goal of this work. As a result of the connection of EVCSs to the electrical grid, there is an increase in the amount of power that is lost and the quality of the voltage at the node is degraded. To resolve these challenges, PV systems are strategically installed at nearly all best possible nodes in the DN. This allocation technique maintains adequate voltage levels across the system [19]. The goal of the objective function is to minimize power loss in the DN while adhering to the defined parameters [20]. This ensures that the voltage stability is maximized, that the entire voltage profile is enhanced, and that the total reliability of the system is significantly improved. The mathematical formulation of the objective function is shown in Equation (8).
where STL is the total power loss of the IU29NDN z.
Minimize (F) = Min (STL)
2.4. Constraints
Regarding the IU29NDN optimizing procedure, the MDM algorithm and MPC approach are used to figure out how to best distribute PV systems and EVCSs. This optimization process ensures that there are no violations of the specified equality and inequality requirements in the placement of PV systems and EVCS units. These limitations are essential to ensuring the optimized distribution network’ssustainability, stability, and efficiency.
Power balance requirements are expressed as equality constraints in the following Equation (9):
The term PD represents the power requirement at two distinct node positions, represented by i. Similar to this, PPV represents the power that PV generates, whereas PEVCS represents the power that the EVCS is responsible for consuming. PL and PSS indicate the power loss in a line and the power provided by a substation, respectively. The lowest voltage limitations for nodes are designated as Vi,min, although their maximum voltage requirements are indicated in Equation (10) as Vi,max.
The active power restrictions in Equation (11) may be described as the total amount of injected power at different node locations, which must stay within their acceptable ranges.
—Net injected power at node i;
—Power generated (or supplied) by DG at node i;
—Power that is utilized by the EVCS at the node i.
Equations (12) and (13) ensure that the active and reactive powers that are injected do not exceed the limits that have been permitted for the node capacity limit.
3. The Proposed Methods for Reliability Evaluation
In this research, the reliability evaluation methods for distribution networks (DNs) are based on the usage of life cycle failure rates in bathtub curves. Discrete bus numbers are linked to the EVCS and PV system allocation issue, while operational restrictions determine the PV system’s capacity. The uncertain behavior of the challenge would result in the MDM algorithm and MPC technique not yielding the same results.
3.1. Modified Decision-Making Algorithm
A new decision-making method has been created to determine the best size and placement of photovoltaic systems on the load side, following a study that found voltage issues at certain points. In comparison to other algorithms, this one is relatively simple and open to tweaks. A load priority index enables the network to organize the different types of loads in a structured manner [21]. The proposed MDM algorithm’s step-by-step flowchart is shown in Figure 2.
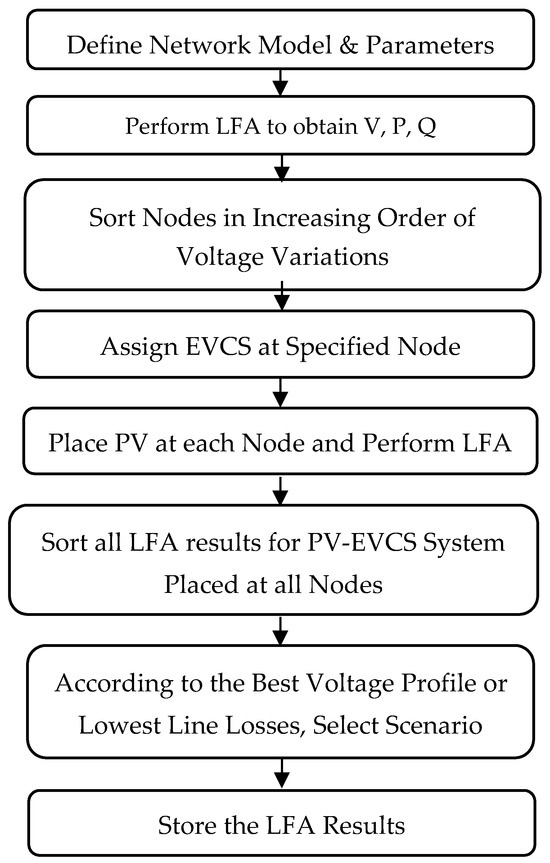
Figure 2.
Steps for the suggested decision-making algorithm.
The algorithm commences by initializing parameters, which involves setting the initial network configuration, defining simulation specifics, like a 24 h horizon, and preparing an empty set to store placed devices. It then enters an iterative placement and sizing loop, continuing until a stopping criterion is met, such as reaching a maximum number of devices or achieving objective convergence. Within this loop, the candidate selection phase first evaluates each potential node in the IU29NDN for its suitability for placing a DG or EVCS, leveraging initial network conditions like voltage stability and power loss sensitivity.
The device sizing and evaluation phase systematically processes each top-ranked candidate node and device type. In this step, it runs a load flow analysis to model how power moves over a full day, taking into account the changing energy demands and solar power generation to determine specific power flow details. The algorithm then calculates various objective functions, evaluating total power losses, voltage deviations from nominal, and a suite of reliability indices, while explicitly considering bidirectional power flows. These calculated objectives are then aggregated into a combined fitness score, where predefined weights and the load priority implicitly or explicitly influence the scoring.
The decision-making and update phase selects the optimal placement and sizing combination from the evaluated candidates based on the highest combined fitness score. It then integrates this EVCS–PV into the IU29NDN and updates the network parameters, such as the voltage profiles and power losses, for the subsequent iteration. It can remove the selected node from further consideration for that device type if a single placement per node is desired. Upon completion of the main loop, the refinement and validation phase performs a final, detailed load flow analysis on the newly optimized network. This final step calculates and presents all reliability indices, power losses, and voltage profiles, allowing for a direct comparison with initial network conditions to demonstrate the achieved improvements.
3.2. Model Predictive Control Technique
MPC improves efficiency and flexibility by continuously optimizing power flow during measurement intervals and periodically revising predictions using data from the system in realtime. Using this MPC approach for the system that is being suggested enhances the capacity for load sharing and PV sharing, respectively. Both of these have the potential to be greatly expanded without relying on signals from the grid operator that come from the outside inward [22].
This step-by-step MPC technique is shown in Figure 3, which is a flowchart that shows each phase in sequential order. This technique increases the use of EVCSs to maximize the time peaks in PV energy, and load demand is reduced.
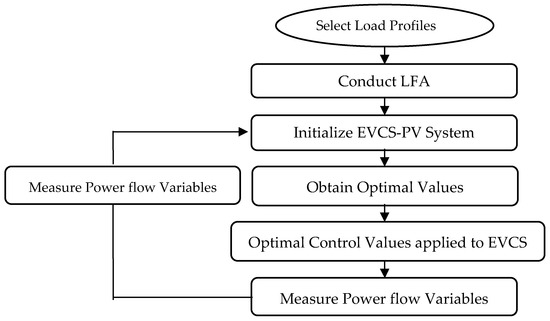
Figure 3.
Steps for proposed model predictive control technique.
The MPC technique explicitly handles various system constraints within its optimization problem, ensuring that control actions and system states remain within acceptable physical and operational limits. These common constraints include input constraints, which set maximum and minimum values for control inputs like BESS charge/discharge power and EVCS charging rates across control origin. State constraints or internal states limit internal system variables, such as battery SOC for EVCSs.
MPC derives its control law by solving an optimization problem at each time step, typically through a quadratic program. Explicit MPC, a key advancement, pre-computes this complex solution offline, transforming online computations into simple function evaluations. This control law manifests as a piecewise affine function, with the control action determined by the current state of the system within specific critical regions. The underlying optimization minimizes a cost function that balances predicted output errors against reference points and control input changes. It operates under strict physical and operational constraints, including limits on control inputs, their rates of change, system outputs like voltage and reliability, and internal states such as battery SOC. The prediction horizon and control horizon define the look-ahead period for optimization. The controller quickly figures out where the current state is and uses a ready-made control method, which greatly lessens the amount of computing needed for fast, real-time tasks.
4. Impact of PV Systems and EVCSs on Reliability of IU29NDN
The analysis of reliability in electrical distribution networks has become a challenging field of study. Reliability is the potential that, under a given set of operational conditions, a system will function well for a certain amount of time. The reliability of distribution, transmission, and generation are the primary areas of attention in studies of DN reliability. The reliability of DNs is strongly associated with the level of consumer satisfaction. Quantitative data on the average outage duration, failure rate, repair rate, and number of users at load points are required to evaluate a DN’s reliability indices. The reliability of these power systems is frequently evaluated using a range of reliability metrics. This study also utilizes these metrics to evaluate the reliability of DNs. To conduct an assessment of reliability, it is necessary to choose a suitable collection of indices that are in compliance with the application [23,24]. The technique of modeling and assessing reliability was founded on component and network modeling, as will be explained in the sections that follow.
4.1. The Modeling of Components
The frequency of interruptions, denoted by L, varies for each component of the distribution network. L is created by adding the active failures (Laf) and passive failures (Lpf) presented in Equation (14), given below:
Short circuits and adverse weather are the main causes of component failure rates. After the component is repaired or replaced, any defects or failures are corrected. Passive failures, on the other hand, include factors like open-circuit problems or scheduled maintenance [25,26].
4.2. Calculating Reliability Indices at Different Load Points
Statistical components like the failure rate repair rate and average outage time have a significant influence on reliability indices. At various load points, the reliability parameters may be computed, for the jth load point, as follows:
- Average failure rate: failure/year.
- Annual outage duration: hour/year.
- Average outage duration: hour.
Here, is the average failure rate of load point j, is the average failure rate of the ith element, denotes the number of ith elements in the distribution system, is the average failure rate at the jth load point and denotes the annual outage duration at the jth load point.
4.3. Consumer-Oriented Indices
Power system reliability has been enhanced by the use of these indices (Equations (15)–(20)), which have led to better consumer or load facilities.
4.3.1. System Average Interruption Frequency Index
When the failure rate is denoted by λi and the number of customers belonging to load point i is denoted by ,
4.3.2. Consumer Average Interruption Frequency Index
Many consumers will have perfect continuity of supply in any given calendar year and not all consumers will be impacted; therefore, this index, which varies from SAIFI only in the denominator value, is especially advantageous when comparing a given calendar year with subsequent calendar years. Therefore, the CAIFI value is particularly helpful in identifying time-related patterns in a distribution system’s reliability. Regardless of how many disruptions they may have had during the year, the impacted consumers should only be considered once when this index is applied.
4.3.3. System Average Interruption Duration Index
In this Equation (17), represents the yearly outage time.
4.3.4. Consumer Average Interruption Duration Index
4.3.5. Average Service Availability Index
4.3.6. Average Service Unavailability Index
4.4. Load-Orientated Indices
During the process of evaluating load- and energy-oriented indices (Equations (21)–(24)), the average load at each loadpoint is one of the essential characteristics that must be specified. The formula for calculating the average load La is as follows:
where, Lp is peak load demand, f is load factor, is total energy demand in a year, and t is period of year.
4.4.1. Index for Energy Not Supplied
4.4.2. Average System Curtailment Index
4.4.3. Average Consumer Curtailment Index
The conduction of a reliability analysis typically depends on knowing how often faults or failures occur, allowing one to figure out how well a system performs and how reliable it is [27]. However, conducting a full reliability analysis can be challenging when this information is unavailable. Figure 4 examines its individual components to identify potential reliability problems. Figure 5 provides the system’s design and its architecture.
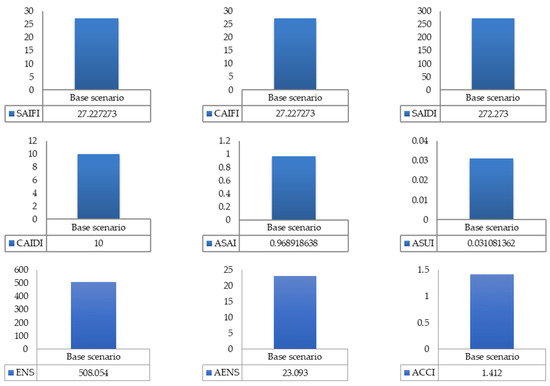
Figure 4.
Reliability indices for the IU29NDN without failure data.
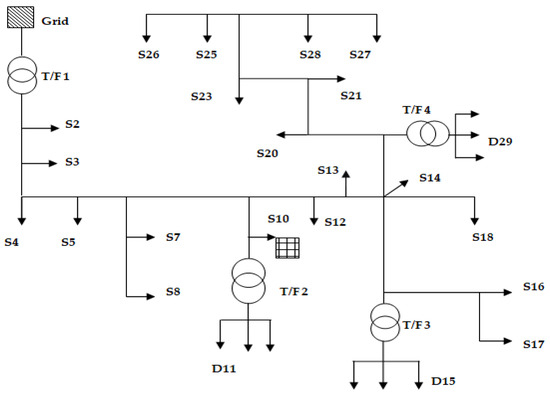
Figure 5.
Block diagram of the IU29NDN system.
5. Results and Discussion
A load flow study was achieved on a practical 29-node Indian feeder network, as illustrated in Figure 5. This Indian node feeder system includes both spot and distribution loads. Several spot loads with an 11 kV source voltage are regarded as sensitive loads and heavy day loads. The source voltage for distributed loads is 0.44 kV. Figure 6 displays the daily load profile that IU29NDN uses for spot loads in its simulation analysis. A 24 h load flow study with a 15 min step size was conducted. Base load conditions or off-peak hours are the minimum level of power demand that continuously flows through the system, usually occurring during late night/early morning hours. Morning peaks cause a gradual rise in demand as people wake up, prepare for the day, and industries begin operation. Daytime demand often remains relatively high or plateaus during working hours. The evening peak is typically the highest demand period of the day. Late at night, a gradual decrease in demand occurs after the evening peak, as most non-essential activities cease.
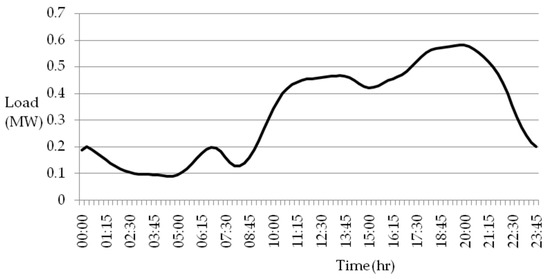
Figure 6.
Daily load profile used at node 10.
For each load performance linked to the node system, the active and reactive powers can be seen in Figure 7, Figure 8 and Figure 9. The IU29NDN has fewer numbers of overhead lines. The base-case power loss is much less than its real power demand. The active and reactive power profiles at all these nodes can be observed. The network’s total installed capacity is 3.405 megawatts, with a peak load of 2.950 MW. The literature provides thorough information on each component’s yearly load curve and reliability metrics.
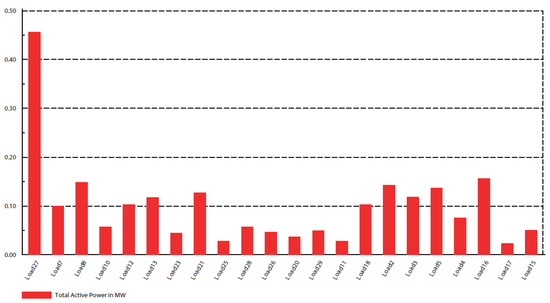
Figure 7.
Profiles of active power of the IU29NDN.
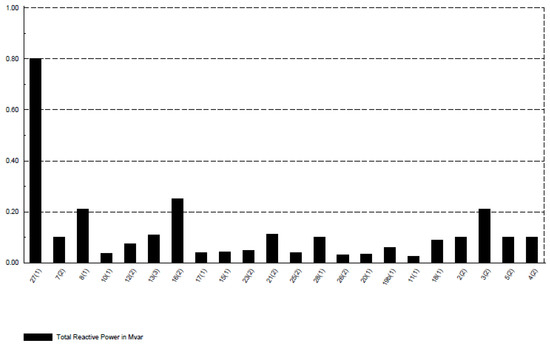
Figure 8.
Profiles of Reactive power of the IU29NDN.
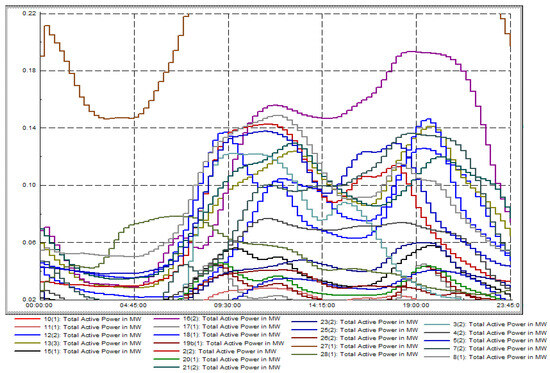
Figure 9.
Complete active power profiles of IU29NDN.
Additionally, nodes are being used in the building of solar power plants to test the proposed approach under high-renewable-energy conditions. Simulations for reliability evaluations were produced, employing the software DIgSILENT Power Factory 15.1.7. The specifications of the IU29NDN are given in Table 1, Table 2 and Table 3.

Table 1.
Profiles of distributed load for the IU29NDN.

Table 2.
Profiles of spot load for the IU29NDN.

Table 3.
Details ofline length of the IU29NDN.
5.1. Proposed Methods on IU29NDN
The suggested MDM and MPC approaches are first used on IU29NDN to determine the position and size of the EVCSs and DG units. Table 4 and Table 5 show the sizes and placements of PVs and EVCSs. Table 6 provides all the specifics of these functions and their results. It is possible to compare the results of the single objective function that corresponds to MDM and MPC by using these three methods:

Table 4.
PV system rating in the IU29NDN.

Table 5.
EVCS rating in the IU29NDN.

Table 6.
Average power losses at IU29NDN.
- (1)
- Active power loss reduction;
- (2)
- Reducing voltage fluctuations;
- (3)
- The highest possible reliability indices.
The IU29NDN’s power loss in the base case scenario is computed. If an EVCS is optimally located at node 11, then an active power loss occurs. The results obtained with the inclusion of EVCS placement voltage profiles at node 10 with and without a PV system for the whole day are presented in Figure 10.
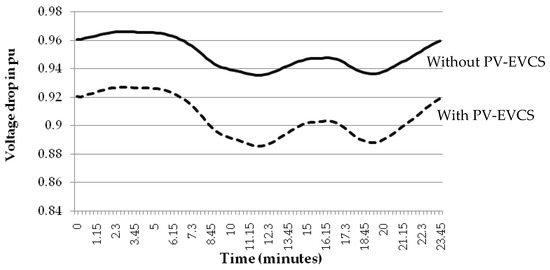
Figure 10.
Improved voltage profiles.
The placement of an EVCS–PV system improves its voltage profile. The LFA was carried out in the feeder with and without PV systems, accounting for the voltage profiles after LFA for different load categories for a 24 h load cycle. It is observed that the installation of a PV system improves the voltage profiles of the above nodes.
5.2. Impact of the Integration of PVs and EVCSs on Reliability
The major objective of the following part is to provide an extensive investigation of the effects that the placements of PV and EV charging stations have on the reliability of the IU29NDN. All of the scenarios stated above had their reliability indices assessed. Following the implementation of EVCSs, both consumer- and load (energy)-orientated indicators decline. Both types of reliability indices, however, are improved when PV devices are included in the distribution system.
5.2.1. Case1: Reliability Evaluation of Proposed MPC Technique on IU29NDN
The proposed MPC technique is first applied to IU29NDN. The outcomes of every elements are presented in Figure 11. The performance of the MPC technique was compared with that of the base scenario, that of a single-EVCS–PV system, and that of a multi-EVCS–PV system.
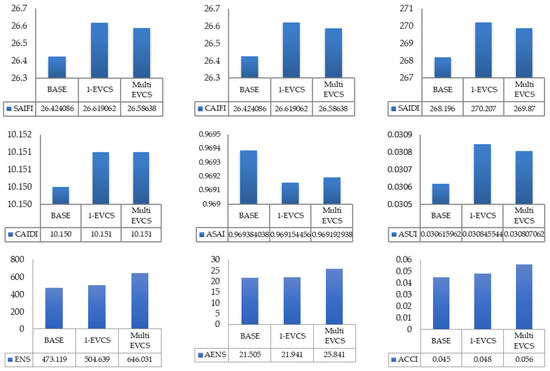
Figure 11.
Reliability indices between a base case, single-EVCS–PV system, and a multiple-EVCS–PV system for MPC technique.
5.2.2. Case 2: Reliability Evaluation of Proposed MDM Algorithm on IU29NDN
The suggested MDM algorithm is then employed in the IU29NDN. The outcomes of every elements are presented in Figure 12. The implementation of the MDM algorithm was compared along with the base scenario, a single-EVCS–PV system, and a multi-EVCS–PV system. The SAIFIvalue prior to the implementation of the EVCS–PV system, or the basic scenario, was 26.424086 failures per consumer-year. The SAIFI increased to 26.58638 and 26.60204 for MPC and MDM (respectively) failures per consumer-year, following the installation of a single charging station at node 11. Additionally, SAIDI and CAIDI values increased.

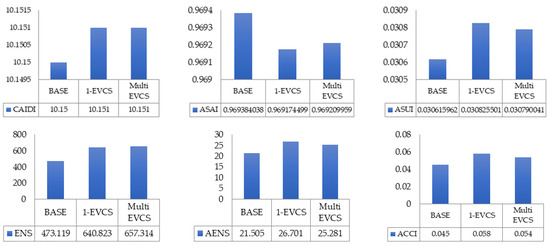
Figure 12.
Reliability indices between a base case, single-EVCS–PV system, and multiple-EVCS–PV system for MDM algorithm.
The location of a single charging station also exhibits EENS and AENS deficiencies. On an annual basis, the AENS has a base value of 21.505 MWh per customer. With the addition of one electric vehicle charging station, its value climbed to 25.841 megawatt hours per user per year. The placement of multiple EVCS–PV systems in the DN provides 25.841 and 25.281 MWh per customer for MPC and MDM, respectively. Furthermore, the integration of charging loads causes a decline in the value of ASAI. It describes the situation when charging loads grow and power availability decreases.
6. Conclusions
Reliability indices such as SAIFI, CAIFI, SAIDI, CAIDI, ASAI, ASUI, ACCI, EENS and AENS are necessary metrics for evaluating the performance and reliability of electrical DNs. By understanding and optimizing these indices, utilities and distribution network operators can develop the reliability and efficiency of DNs, reducing the impact of outages on customers. To achieve this, it is crucial to decrease interruption frequency and duration, minimize energy not served, and improve system availability. By reducing SAIFI, CAIFI, SAIDI, CAIDI, EENS, AENS, ASUI, and ACCI and increasing ASAI, utilities can provide a more reliable electricity supply, leading to higher customer satisfaction and reduced economic losses. Ultimately, optimizing these reliability indices can lead to more efficient system operation and maintenance, providing better service to customers and supporting economic growth and development.
This study employs reliability analysis concepts in power distribution networks, examining the impact of EVCS on the practical distribution network in India through a direct load flow analysis. EVCS reduces network reliability, increases power losses and requires more power from the grid. Therefore, to counteract the anomalies caused by EVCS, a PV system ought to be used. The MDM algorithm and MPC method are used to find the best place and size for the PV system by considering the reliability of the distribution network. The 29-node distribution network of the Indian utility is the primary object of this investigation. The PV–EVCS allocation technique improves the DN by reducing losses and maintaining acceptable voltage levels.
The MDM algorithm and MPC method were assessed for how well they place PV systems and EVCS in the distribution network, taking into account different time periods and limitations. It was found that the MDM algorithm significantly reduces system losses, more than the MPC technique for IU29NDN. All the reliability indicators were investigated under various circumstances. The deployment of EVCS has been observed to improve the network reliability indices. The results reveal that the integration of PV–EVCS improves the reliability indices. It has been shown that the allocation of several PV systems with EVCSs offers benefits by decreasing power loss and improving distribution network performance. Reducing the impact of EVCSs on DNs is an important consideration; DG integration is a reliable and long-term solution.
Future research should look into ways of changing network setups dynamically to improve reliability and resilience against problems like high electric vehicle loads or inconsistent solar power generation, building on the best static placements found in current studies. It is important to focus on using hybrid and multi-criteria optimization algorithms, along with reinforcement learning and adaptive control algorithms, to effectively manage the placement and sizing of solar panels, electric vehicle charging stations, battery energy storage systems, and other distributed energy resources; meanwhile, we mustbalance reliability, power quality, and costs. Creating decentralized and distributed optimization algorithms will help these systems to work better together and to be more adaptable in large distribution networks. Researchers should focus on hybrid and multi-criteria optimization algorithms, as well as reinforcement learning and adaptive control algorithms, to holistically address the simultaneous placement and sizing of PVs, EVCSs, BESS, and other DERs while navigating complex trade-offs in reliability, power quality, and economics. Creating decentralized and distributed optimization algorithms will make it easier to scale up and strengthen the integration and coordinated operation of many DERs in large distribution networks.
Author Contributions
Conceptualization, M.A.S.B. and M.S.; Methodology, M.A.S.B., V.S.S. and S.D.; Software, M.A.S.B., V.S.S. and S.D.; Validation, S.D.; Formal analysis, M.S., V.S.S. and S.D.; Data curation, M.A.S.B.; Writing—original draft, M.A.S.B., M.S., V.S.S. and S.D.; Writing—review and editing, M.S., V.S.S. and S.D. All authors have read and agreed to the published version of the manuscript.
Funding
This research received no external funding.
Data Availability Statement
The original contributions presented in this study are included in the article. Further inquiries can be directed to the corresponding author.
Acknowledgments
The authors express their gratitude to the administrators of Puducherry Technological University in Puducherry, India, for providing the resources required to complete this work.
Conflicts of Interest
The authors declare no conflicts of interest.
Abbreviations
| PV | photovoltaic |
| MDM | modified decision making |
| MPC | model predictive control |
| EVCS | electric vehicle charging station |
| DG | distributed generation |
| DN | distribution network |
| IU29NDN | Indian Utility 29 Node Distribution Network |
| SAIFI | system average interruption frequency index |
| CAIFI | consumer average interruption frequency index |
| SAIDI | system average interruption duration index |
| CAIDI | consumer average interruption duration index |
| ASAI | average service availability index |
| ASUI | average service unavailability index |
| ENS | energy not supplied |
| AENS | average energy not supplied |
| ACCI | average customer curtailment index |
| PLoad | power across load |
| PAvailable | available power |
| PEVCS | power absorbed by electrical vehicle charging station |
| NEVCS | number of EVCSs |
| BC | rating of the battery |
| SC | required amount of charging |
| STL | overall power loss |
| PL | power loss in a line |
| PD | power requirement at two distinct nodes |
| PPV | power generated by PV |
| PSS | power provided by a substation |
| Vi,min | minimum voltage at node i |
| Vi,max | maximum voltage at node i |
| Pinj | power injected at node i |
| PDG | power generated by DG at node i |
| Pmin | minimum active power at node i |
| Qmin | minimum reactive power at node i |
| Qinj | injected reactive power at node i |
| Qmax | maximum reactive power at node i |
| average failure rate | |
| number of elements | |
| average failure rate of the ith element | |
| Ui | duration of annual outages at load point j |
| Dij | average outage duration |
| λj | average rate of failure at point j |
| λe,i | average failure rate. |
| Ni | number of customers belonging to load point i |
| Laf | active failures |
| Lpf | passive failures |
| La | average load |
| Lp | peak load demand |
| Ed | load–duration curve |
References
- Majeed, A.A.; Altaie, A.S.; Abderrahim, M.; Alkhazraji, A.A. A Review of Protection Schemes for Electrical Distribution Networks with Green Distributed Generation. Energies 2023, 16, 7587. [Google Scholar] [CrossRef]
- Ibrahim, A.H.M.; Sadanandan, S.K.; Ghaoud, T.; Rajkumar, V.S.; Sharma, M. Incipient Fault Detection in Power Distribution Networks: Review, Analysis, Challenges and Future Directions. IEEE Access 2024, 12, 112822–112838. [Google Scholar] [CrossRef]
- Dechgummarn, Y.; Fuangfoo, P.; Kampeerawat, W. Predictive reliability analysis of power distribution systems considering the effects of seasonal factors on outage data using Weibull analysis combined with polynomial regression. IEEE Access 2023, 11, 138261–138278. [Google Scholar] [CrossRef]
- Salam, I.U.; Yousif, M.; Numan, M.; Zeb, K.; Billah, M. Optimizing Distributed Generation Placement and Sizing in Distribution Systems: A Multi-Objective Analysis of Power Losses, Reliability, and Operational Constraints. Energies 2023, 16, 5907. [Google Scholar] [CrossRef]
- Veza, I.; Asy’ari, M.Z.; Idris, M.; Epin, V.; Fattah, I.M.R.; Spraggon, M. Electric vehicle (EV) and driving towards sustainability: Comparison between EV, HEV, PHEV, and ICE vehicles to achieve net zero emissions by 2050 from EV. Alex. Eng. J. 2023, 82, 459–467. [Google Scholar] [CrossRef]
- Breve, M.M.; Bohnet, B.; Michalke, G.; Kowal, J.; Strunz, K. Flow-Network-Based Method for the Reliability Analysis of Decentralized Power System Topologies with a Sequential Monte-Carlo Simulation. IEEE Trans. Reliab. 2024, 73, 1005–1019. [Google Scholar] [CrossRef]
- Zhang, J.; Wang, B.; Ma, H.; Li, Y.; Yang, M.; Wang, H.; Ma, F. A Fast Reliability Evaluation Strategy for Power Systems under High Proportional Renewable Energy—A Hybrid Data-Driven Method. Processes 2024, 12, 608. [Google Scholar] [CrossRef]
- Borousan, F.; Hamidan, M.-A. Distributed power generation planning for distribution network using chimp optimization algorithm in order to reliability improvement. Electr. Power Syst. Res. 2023, 217, 109109. [Google Scholar] [CrossRef]
- Zhang, S.; Liu, W.; Wan, H.; Bai, Y.; Yang, Y.; Ma, Y.; Lu, Y. Combing data-driven and model-driven methods for high proportion renewable energy distribution network reliability evaluation. Int. J. Electr. Power Energy Syst. 2023, 149, 108941. [Google Scholar] [CrossRef]
- Ahmad, S.; Asar, A.U. Reliability Enhancement of Electric Distribution Network Using Optimal Placement of Distributed Generation. Sustainability 2021, 13, 11407. [Google Scholar] [CrossRef]
- Alfraidi, W.; Alaql, F.; AlMuhanna, K.; Hussein, H.M.; Al-Shamma’a, A.A. Designing EV Charging Energy Hubs to Meet Flexibility Requirements in Smart Grids. World Electr. Veh. J. 2025, 16, 43. [Google Scholar] [CrossRef]
- Singh, S.; Saket, R.K.; Khan, B. A comprehensive state-of-the-art review on reliability assessment and charging methodologies of grid-integrated electric vehicles. IET Electr. Syst. Transp. 2023, 13, e12073. [Google Scholar] [CrossRef]
- Amani, A.M.; Sajjadi, S.S.; Al Khafaf, N.; Song, H.; Jalili, M.; Yu, X.; McTaggart, P. Technology balancing for reliable EV uptake in distribution grids: An Australian case study. Renew. Energy 2023, 206, 939–948. [Google Scholar] [CrossRef]
- Yan, F.; Wei, L.; Yang, J.; Shi, B. Day-Ahead Two-Stage Bidding Strategy for Multi-Photovoltaic Storage Charging Stations Based on Bidding Space. World Electr. Veh. J. 2025, 16, 41. [Google Scholar] [CrossRef]
- Bilal, M.; Rizwan, M.; Alsaidan, I.; Almasoudi, F.M. AI-Based Approach for Optimal Placement of EVCS and DG With Reliability Analysis. IEEE Access 2021, 9, 154204–154224. [Google Scholar] [CrossRef]
- Bishla, T.S.; Khosla, A. Review of Power Quality and Stability of EV Charging with Grid and PV Solar. Energy Technol. 2023, 12, 2300744. [Google Scholar] [CrossRef]
- Ahmad, F.; Ashraf, I.; Iqbal, A.; Marzband, M.; Khan, I. A novel AI approach for optimal deployment of EV fast charging station and reliability analysis with solar based DGs in distribution network. Energy Rep. 2022, 8, 11646–11660. [Google Scholar] [CrossRef]
- Kurukuru, V.S.B.; Khan, M.A.; Singh, R. Electric Vehicle Charging/Discharging Models for Estimation of Load Profile in Grid Environments. Electr. Power Compon. Syst. 2022, 51, 279–295. [Google Scholar] [CrossRef]
- Dharmalingam, U.; Arumugam, V. Optimal energy management in EVCS and distribution system considering QoS using hybrid technique. Artif. Intell. Rev. 2023, 56, 14297–14326. [Google Scholar] [CrossRef]
- Sattianadan, D.; Sudhakaran, M.; Dash, S.S.; Vijayakumar, K. Power Loss Minimization by the Placement of DG in Distribution System Using GA. In Swarm, Evolutionary, and Memetic Computing; Lecture Notes in Computer Science; Springer: Cham, Switzerland, 2012; Volume 7677, pp. 259–266. [Google Scholar] [CrossRef]
- Bhushan, M.S.; Sudhakaran, M. Time-series quasi-dynamic load flow analysis with seasonal load variation to resolve energy nexus for a practical distribution network in Puducherry smart grid system incorporating harmonic analysis and mitigation. Energy Nexus 2023, 11, 100234. [Google Scholar] [CrossRef]
- Tamashiro, K.; Omine, E.; Krishnan, N.; Mikhaylov, A.; Hemeida, A.M.; Senjyu, T. Optimal components capacity based multi-objective optimization and optimal scheduling based MPC-optimization algorithm in smart apartment buildings. Energy Build. 2023, 278, 112616. [Google Scholar] [CrossRef]
- Anuar, A.; Abdullah, M.P.; Kajaan, N.A.B.M. Impact of EV Charging Stations on Electrical Distribution System with PV System. In Proceedings of the 2024 IEEE International Conference on Advanced Power Engineering and Energy (APEE), Johor Bahru, Malaysia, 10–11 September 2024; pp. 47–52. [Google Scholar] [CrossRef]
- Olcay, K.; Çetinkaya, N. Investigation of the effects of electric vehicle charging stations and solar energy integration on grid performance. J. Sci. Rep. A 2023, 206–219. [Google Scholar] [CrossRef]
- Henrique, L.F.; Bitencourt, L.A.; Borba, B.S.M.C.; Dias, B.H. Impacts of EV residential charging and charging stations on quasi-static time-series PV hosting capacity. Electr. Eng. 2022, 104, 2717–2728. [Google Scholar] [CrossRef]
- Yuvaraj, T.; Suresh, T.D.; Christy, A.A.; Babu, T.S.; Nastasi, B. Modeling and Allocation of Hydrogen-Fuel-Cell-Based Distributed Generation to Mitigate Electric Vehicle Charging Station Impact and Reliability Analysis on Electrical Distribution Systems. Energies 2023, 16, 6869. [Google Scholar] [CrossRef]
- Martyushev, N.V.; Malozyomov, B.V.; Sorokova, S.N.; Efremenkov, E.A.; Valuev, D.V.; Qi, M. Review Models and Methods for Determining and Predicting the Reliability of Technical Systems and Transport. Mathematics 2023, 11, 3317. [Google Scholar] [CrossRef]
Disclaimer/Publisher’s Note: The statements, opinions and data contained in all publications are solely those of the individual author(s) and contributor(s) and not of MDPI and/or the editor(s). MDPI and/or the editor(s) disclaim responsibility for any injury to people or property resulting from any ideas, methods, instructions or products referred to in the content. |
© 2025 by the authors. Published by MDPI on behalf of the World Electric Vehicle Association. Licensee MDPI, Basel, Switzerland. This article is an open access article distributed under the terms and conditions of the Creative Commons Attribution (CC BY) license (https://creativecommons.org/licenses/by/4.0/).