Article

A Novel Data-Driven Multi-Branch LSTM Architecture with Attention Mechanisms for Forecasting Electric Vehicle Adoption

by
Md Mizanur Rahaman
1,*,†,
Md Rashedul Islam
1,†,
Mia Md Tofayel Gonee Manik
1,
Md Munna Aziz
1,
Inshad Rahman Noman
2,
Mohammad Muzahidur Rahman Bhuiyan
1,
Kanchon Kumar Bishnu
2 and
Joy Chakra Bortty
3
1
College of Business, Westcliff University, Irvine, CA 92614, USA
2
Department of Computer Science, California State University Los Angeles, Los Angeles, CA 90032, USA
3
Department of Computer Science, Westcliff University, Irvine, CA 92614, USA
*
Author to whom correspondence should be addressed.
These authors contributed equally to this work.
World Electr. Veh. J. 2025, 16(8), 432; https://doi.org/10.3390/wevj16080432
Submission received: 19 May 2025 / Revised: 14 July 2025 / Accepted: 30 July 2025 / Published: 1 August 2025

Abstract

Accurately predicting how quickly people will adopt electric vehicles (EVs) is vital for planning charging stations, managing supply chains, and shaping climate policy. We present a forecasting model that uses three separate Long Short-Term Memory (LSTM) branches—one for past EV sales, one for infrastructure and policy signals, and one for economic trends. An attention mechanism first highlights the most important weeks in each branch, then decides which branch matters most at any point in time. Trained end-to-end on publicly available data, the model beats traditional statistical methods and newer deep learning baselines while remaining small enough to run efficiently. An ablation study shows that every branch and both attention steps improve accuracy, and that adding policy and economic data helps more than relying on EV history alone. Because the network is modular and its attention weights are easy to interpret, it can be extended to produce confidence intervals, include physical constraints, or forecast adoption of other clean-energy technologies.

1. Introduction

Electric vehicles have transitioned from niche to mainstream in the past decade, with record growth in sales and market share. In 2023, global electric car sales reached nearly 14 million (a 35% increase over 2022), bringing the total stock of electric cars on the road to about 40 million [1]. This represented roughly 20% of new car sales worldwide, reflecting a rapid upward trend that challenges forecasters to predict future adoption. Accurate forecasting of EV adoption is crucial for policymakers and industry stakeholders to plan charging infrastructure, energy grid upgrades, and market strategies. However, forecasting EV uptake is complex due to nonlinear growth patterns, policy interventions, and technological innovations.
Early approaches to EV adoption forecasting often relied on classic diffusion models and time-series techniques [2]. For example, diffusion models such as the Bass model capture the S-shaped adoption curve of innovations by modeling how early adopters and follower segments contribute to uptake [3]. These models have been used to project long-term EV adoption by fitting historical sales data, but they may oversimplify real-world dynamics. Time-series statistical methods (e.g., exponential smoothing and ARIMA) have also been applied to short-term EV sales forecasts [4]. While these methods can model trends and seasonality, they struggle with the highly nonlinear growth and the influence of external factors (like policy changes) inherent in EV adoption [5].
In recent years, the forecasting landscape has shifted towards machine learning and deep learning approaches. Unlike parametric statistical models, machine learning methods can learn complex patterns from data without assuming a specific functional form. This is particularly relevant for EV adoption, which is driven by a mixture of technological progress, consumer behavior, and policy incentives. Researchers have increasingly applied neural networks, including recurrent neural networks (RNNs) such as LSTMs and gated recurrent units (GRUs), to capture temporal dependencies in EV adoption data [6,7]. Deep learning models can incorporate multiple input features (e.g., past sales, economic indicators, policy variables) and potentially capture nonlinear interactions among them, offering improved predictive accuracy. For instance, recent studies show that deep learning models often outperform traditional models like ARIMA in EV sales prediction accuracy [7]. As EV adoption accelerates and datasets grow, deep learning-based forecasting has become a state-of-the-art approach. In addition to RNN-based methods, other deep learning architectures, such as convolutional neural networks (CNNs) and Transformer-based models, have begun to show promise in forecasting electric vehicle adoption. CNNs, traditionally popular in image processing, are increasingly leveraged for time-series forecasting due to their capability to efficiently extract local patterns and features across different time scales. For instance, 1-dimensional CNNs have been utilized to model short-term fluctuations and long-term trends in EV market dynamics, achieving comparable or superior accuracy to RNNs [8]. Transformer models, initially developed for natural language processing, have recently emerged as powerful tools for forecasting tasks due to their attention mechanism, enabling them to capture intricate temporal dependencies without relying solely on sequential processing. Preliminary studies employing Transformer architectures suggest they can outperform traditional RNNs, especially when large datasets with extensive historical information and various external indicators (such as consumer sentiment, regulatory frameworks, and technological advancements) are incorporated [9,10].
Furthermore, explainability and interpretability in forecasting models have grown increasingly important. While deep learning models excel in accuracy, their black-box nature often raises concerns among stakeholders needing transparent decision-making processes. Recent advances in explainable artificial intelligence (XAI) have been pivotal in addressing these concerns, facilitating a better understanding of the underlying drivers of EV adoption. Techniques such as SHAP (Shapley Additive Explanations) and LIME (Local Interpretable Model-agnostic Explanations) provide insights into feature importance and influence, helping stakeholders interpret model predictions and assess the relative impact of economic incentives, charging infrastructure availability, consumer preferences, and regulatory changes [11,12]. Moreover, future forecasting efforts must increasingly consider the impact of emerging technologies and regulatory uncertainties, such as advancements in battery technology, vehicle autonomy, and policy shifts toward zero-emission mandates. Predictive models that dynamically incorporate these external variables and simulate their potential impacts on adoption trajectories will become essential. Scenario-based forecasting approaches, integrating machine learning with agent-based simulations or systems dynamics models, are particularly valuable for exploring various future scenarios, thus informing strategic decisions and reducing the risks associated with uncertainty [13]. As the landscape of EV adoption forecasting continues to evolve, interdisciplinary approaches combining insights from economics, behavioral sciences, policy analysis, and advanced computational techniques will likely become the norm. Embracing such comprehensive, integrated modeling frameworks is essential for accurately forecasting the complexities of EV market dynamics and for providing actionable insights to policymakers, industry leaders, and other stakeholders navigating the rapidly shifting automotive ecosystem. Figure 1 illustrates the global EV adoption trend, highlighting the exponential growth in EV stock over the last decade [1]. This trend underscores why advanced forecasting techniques are needed to handle rapid changes. In the next sections, we review the current forecasting models and techniques, with emphasis on LSTM networks, and discuss how novel architectures (multi-branch LSTM with attention) can further improve EV adoption forecasts.

2. Forecasting Methods for EV Adoption

2.1. Traditional Time-Series Forecasting Methods

Early forecasting efforts in EV adoption predominantly employed statistical methods. Techniques such as Autoregressive Integrated Moving Average (ARIMA) and exponential smoothing (e.g., Holt–Winters) were common due to their simplicity, interpretability, and computational efficiency. For example, Dhankhar et al. [4] applied ARIMA models to forecast EV sales in India. Despite their straightforward implementation, these methods often assumed that historical trends would continue unchanged, which led to considerable limitations when faced with the highly nonlinear and dynamic growth patterns of emerging EV markets. This is evidenced by the high errors, such as a mean absolute percentage error (MAPE) of around 44.7%, observed in some studies. Similarly, exponential smoothing methods have generally provided only baseline forecasts, lacking the explicit mechanisms required to incorporate external predictors or to effectively capture the evolving saturation dynamics of the market [14].
Moreover, traditional time-series models are constrained by their reliance on past data trends and linearity assumptions. As EV markets have grown increasingly volatile—impacted by sudden policy changes, technological breakthroughs, and fluctuating consumer sentiments—the need for models that can adapt to such irregularities has become apparent. Researchers have thus begun to explore enhancements such as seasonal adjustments, intervention analysis, and hybrid modifications that integrate external variables. These efforts reflect an early recognition that while traditional methods are computationally attractive, they require significant adaptation to remain effective in rapidly evolving markets.

2.2. Econometric and Diffusion Approaches

To overcome the limitations inherent in purely statistical models, econometric regression approaches have been developed. Multiple linear regression, for instance, has been employed to correlate EV sales with predictors such as income, fuel prices, infrastructure availability, and government incentives [15]. The clear interpretability of regression coefficients makes these models attractive; however, their linearity assumption limits their capacity to model the complex, often nonlinear, relationships that underpin market dynamics.
More advanced econometric techniques, such as Vector Autoregression (VAR) and structural equation modeling, have been introduced to integrate nonlinear dynamics alongside external variables [16]. For instance, Zhang et al. [5] combined Singular Spectrum Analysis with VAR to forecast EV adoption, achieving modest improvements (with an MAPE around 29%), which underscores both the potential and the constraints of econometric methods.
Diffusion models, particularly the Bass model, have gained prominence due to their ability to describe long-term market saturation via an S-shaped cumulative adoption curve. These models capture the transition from early adopters to the mainstream market by modeling network effects and word-of-mouth influences. However, while diffusion models effectively encapsulate long-term trends, they typically struggle with short-term volatility and abrupt external shocks—such as regulatory changes or sudden technological innovations [17]. Recent research has sought to enhance diffusion models by hybridizing them with discrete-choice models, thereby explicitly incorporating consumer behavior and preference heterogeneity to improve short-term forecast accuracy.

2.3. Machine Learning and Deep Learning Approaches

With the availability of richer and more comprehensive datasets, machine learning (ML) and deep learning (DL) approaches have emerged as powerful alternatives for EV forecasting. ML techniques such as support vector regression (SVR), random forests, and gradient boosting machines (e.g., XGBoost) have been applied to model complex, nonlinear interactions among multiple predictors. The comparative performance of representative EV forecasting techniques, along with their key traits, is summarized in Table 1.
Among DL methods, recurrent neural networks (RNNs), and in particular Long Short-Term Memory (LSTM) networks, have become the state of the art for forecasting applications that involve sequential data [18]. LSTM models are uniquely capable of capturing long-term dependencies and handling the temporal dynamics inherent in EV adoption patterns, often outperforming statistical methods in terms of accuracy metrics like RMSE and MAPE. Hybrid models that combine convolutional neural networks (CNNs) for extracting local patterns with LSTMs for sequential modeling have further pushed the boundaries of forecasting performance. For example, Simsek et al. [19] reported significant accuracy gains using a CNN-LSTM hybrid framework (EVs-PredNet) to forecast demand across different vehicle segments. Recent work in traffic assignment demonstrates the power of heterogeneous graph neural networks (HGNNs). Liu and Meidani’s end-to-end HGNN surrogate [20] introduces virtual origin–destination links and embeds flow-conservation constraints directly into the loss, enabling accurate user-equilibrium flow predictions on large urban networks. Building on this idea, the same authors extend the framework to multi-class traffic assignment with a multi-view graph attention mechanism tailored to passenger cars, trucks, and buses [21]. Their multi-class model preserves flow conservation across vehicle types and further improves convergence speed and accuracy relative to conventional neural baselines.
Additionally, sequence-to-sequence (Seq2Seq) architectures augmented with attention mechanisms have emerged as highly effective models. These attention mechanisms enable the model to weigh the relative importance of historical data points, thereby providing improved interpretability and finer control over the forecasting process. Yi et al. (2022) [6] demonstrated that a Seq2Seq LSTM with attention achieved a notably low mean absolute error (MAE) of approximately 4.71 (in thousands of vehicles), underscoring the effectiveness of these advanced deep learning architectures.
Furthermore, recent developments in transfer learning have begun to address challenges posed by limited historical data in certain regions. By pre-training deep learning models on larger, related datasets and fine-tuning them for region-specific characteristics, researchers have been able to mitigate overfitting and accelerate convergence. Alongside these technical advancements, the emerging field of explainable AI (XAI) is making significant strides in demystifying deep models, thus enhancing their transparency and reliability for policy applications.
Table 1. Comparative performance of representative EV forecasting techniques.
MethodStudy (Year)PerformanceKey Traits
Exponential SmoothingPeng et al. [14]MSPE = 1.8187Simplicity; lacks external inputs
Multiple RegressionDuan et al. [15]MAPE = 22.7%Linear assumption; interpretability
ARIMADhankhar et al. [4]MAPE = 44.7%Autocorrelation; struggles with nonlinearity
Gray Prediction (GM)Zhou et al. [22]MAPE = 8.83%Suited to small samples; moderate accuracy
SVRQu et al. [23] R 2 = 0.82 Non-linear; requires parameter tuning
ANN (MLP)Ma et al. [24]RMSE = 16.31Non-linear patterns; data intensive
GRU/LSTMRasheed et al. [18]Adj.  R 2 = 0.82 Temporal dependencies; black box
CNN–LSTMSimsek et al. [19] R 2 = 0.905 Spatial–temporal features; superior accuracy
TransformerZhou et al. [25]30–50% MSE gain over LSTMLong-range dependencies; computationally intensive

2.4. Alternative Forecasting Approaches and Future Directions

Beyond neural network-based models, several alternative methodologies offer valuable perspectives on EV market forecasting. Probabilistic methods and agent-based models, for example, facilitate detailed simulations of complex policy scenarios and heterogeneous consumer behaviors [26]. These approaches are particularly suited for capturing randomness and non-deterministic market dynamics. However, they are typically computationally intensive, and the resulting stochastic forecasts can be less directly comparable to conventional deterministic point forecasts [27].
Ensemble methods, which integrate predictions from multiple independent models, represent another valuable approach. These methods enhance robustness and reduce sensitivity to individual model biases by averaging or adaptively weighting the predictions of diverse forecasting techniques [28]. Nevertheless, a notable limitation of ensemble modeling is the difficulty of attributing predictions to specific model contributions, potentially reducing interpretability—an essential factor when forecasts guide policy and strategic decision making [29].
Econometric structural models explicitly incorporate domain-specific relationships and known causal mechanisms—for example, the direct impact of subsidies, infrastructure developments, or pricing dynamics on consumer adoption behaviors [30]. These models excel in scenario analysis due to their clear causal interpretation. However, structural models heavily depend on accurate parameter specification and can struggle to rapidly adapt to short-term fluctuations and nonlinear trends that characterize evolving EV markets.
Gradient boosting frameworks, such as XGBoost and LightGBM, have recently become popular forecasting tools, particularly in contexts with smaller datasets, thanks to their strong handling of nonlinear feature interactions and automatic feature importance detection [31]. Despite their predictive efficacy, these methods require significant manual feature engineering and explicit handling of temporal dependencies—an essential aspect often implicitly handled by neural network architectures [32].
Despite methodological advancements, accurately forecasting EV adoption remains challenging due to several persistent limitations. Foremost is the scarcity and limited diversity of historical data [17]. Many existing models rely primarily on narrowly defined inputs—typically historical EV sales or broad policy indicators—which inherently constrain predictive accuracy and generalizability. Future research should prioritize integrating diverse, heterogeneous data sources into forecasting models, including indicators of charging infrastructure development, battery cost trajectories, consumer interest metrics (derived, for instance, from web search patterns or social media sentiment), and real-time policy updates. Addressing this gap requires sophisticated modeling architectures, such as the multi-branch LSTM neural network proposed in this study. Such architectures can independently process and subsequently fuse distinct data streams through separate network branches. By applying targeted dimensionality reduction or feature-selection strategies, these multi-branch models effectively mitigate multicollinearity and overfitting risks, enhancing predictive robustness.
While deep learning architectures—including attention-based multi-branch networks—often achieve superior predictive accuracy, their inherent “black-box” nature limits interpretability and stakeholder trust, especially in policy contexts where transparency and explainability are paramount. Enhancing the transparency of forecasting models thus represents a critical avenue for future research. To achieve this, integration with explainability techniques, SHAP values or visualization of attention weights, offers promising possibilities. These tools enable researchers and decision-makers to clearly attribute forecast outcomes to specific input variables, thereby fostering greater trust and interpretability [33]. Additionally, embedding interpretable model components, such as diffusion or logistic adoption equations within neural architectures, could further improve model clarity and facilitate stakeholder acceptance.
Current forecasting practices predominantly yield deterministic point forecasts, which inadequately capture the inherent uncertainty in EV market trends, particularly given unpredictable technology breakthroughs, economic shifts, and policy developments [34]. To address this limitation, future research should adopt probabilistic forecasting frameworks—such as Monte Carlo dropout, Bayesian neural networks, or deep ensemble approaches—to provide explicit prediction intervals representing forecast uncertainty. Moreover, rigorous scenario-based stress testing—subjecting forecasting models to extreme but plausible market shocks (e.g., economic downturns, abrupt policy reversals, or volatile fuel prices)—should become standard practice to evaluate and improve model resilience and reliability.
Lastly, many contemporary forecasting methodologies remain purely data-driven, often neglecting well-established domain knowledge concerning EV market dynamics and inherent adoption nonlinearities. A compelling solution is the integration of domain expertise into predictive frameworks, such as physics-informed neural networks (PINNs) or explicitly encoded structural constraints (e.g., market saturation limits). Incorporating known adoption curves or threshold behaviors directly into the model structure can significantly enhance predictive realism, reduce data demands, and ensure physically plausible outputs [35,36]. The attention-based multi-branch LSTM architecture proposed here is particularly well suited to such hybridization, enabling flexible integration of mechanistic and empirical inputs. Through dynamically trained attention mechanisms, this framework optimally balances physics-informed components and purely data-driven signals, enhancing overall forecast reliability.
In light of these considerations, we argue that the next generation of EV-adoption forecasts should move toward genuinely hybrid frameworks—architectures that blend heterogeneous data streams, deliver transparent explanations of their predictions, quantify uncertainty, and update seamlessly as market conditions evolve. The multi-branch LSTM with hierarchical attention proposed in this study is a concrete step in that direction: its modular design admits new input sources with minimal retraining; its branch- and time-level attention weights reveal which signals matter, and when; and its structure can be extended with probabilistic heads or physics-informed constraints to express forecast intervals and respect known adoption limits. By uniting flexibility, interpretability, and extensibility in a single model class, such hybrid approaches promise more accurate, robust, and policy-relevant insights for EV-market planning and decision making.

3. Multi-Branch LSTM Architectures and Attention Mechanisms

As deep learning models evolve, novel architectures have been proposed to handle multiple input streams and focus on the most relevant information within sequential data. In this section, we detail the theoretical underpinnings of multi-branch LSTM architectures and attention mechanisms, providing the mathematical framework that motivates our proposed forecasting approach.

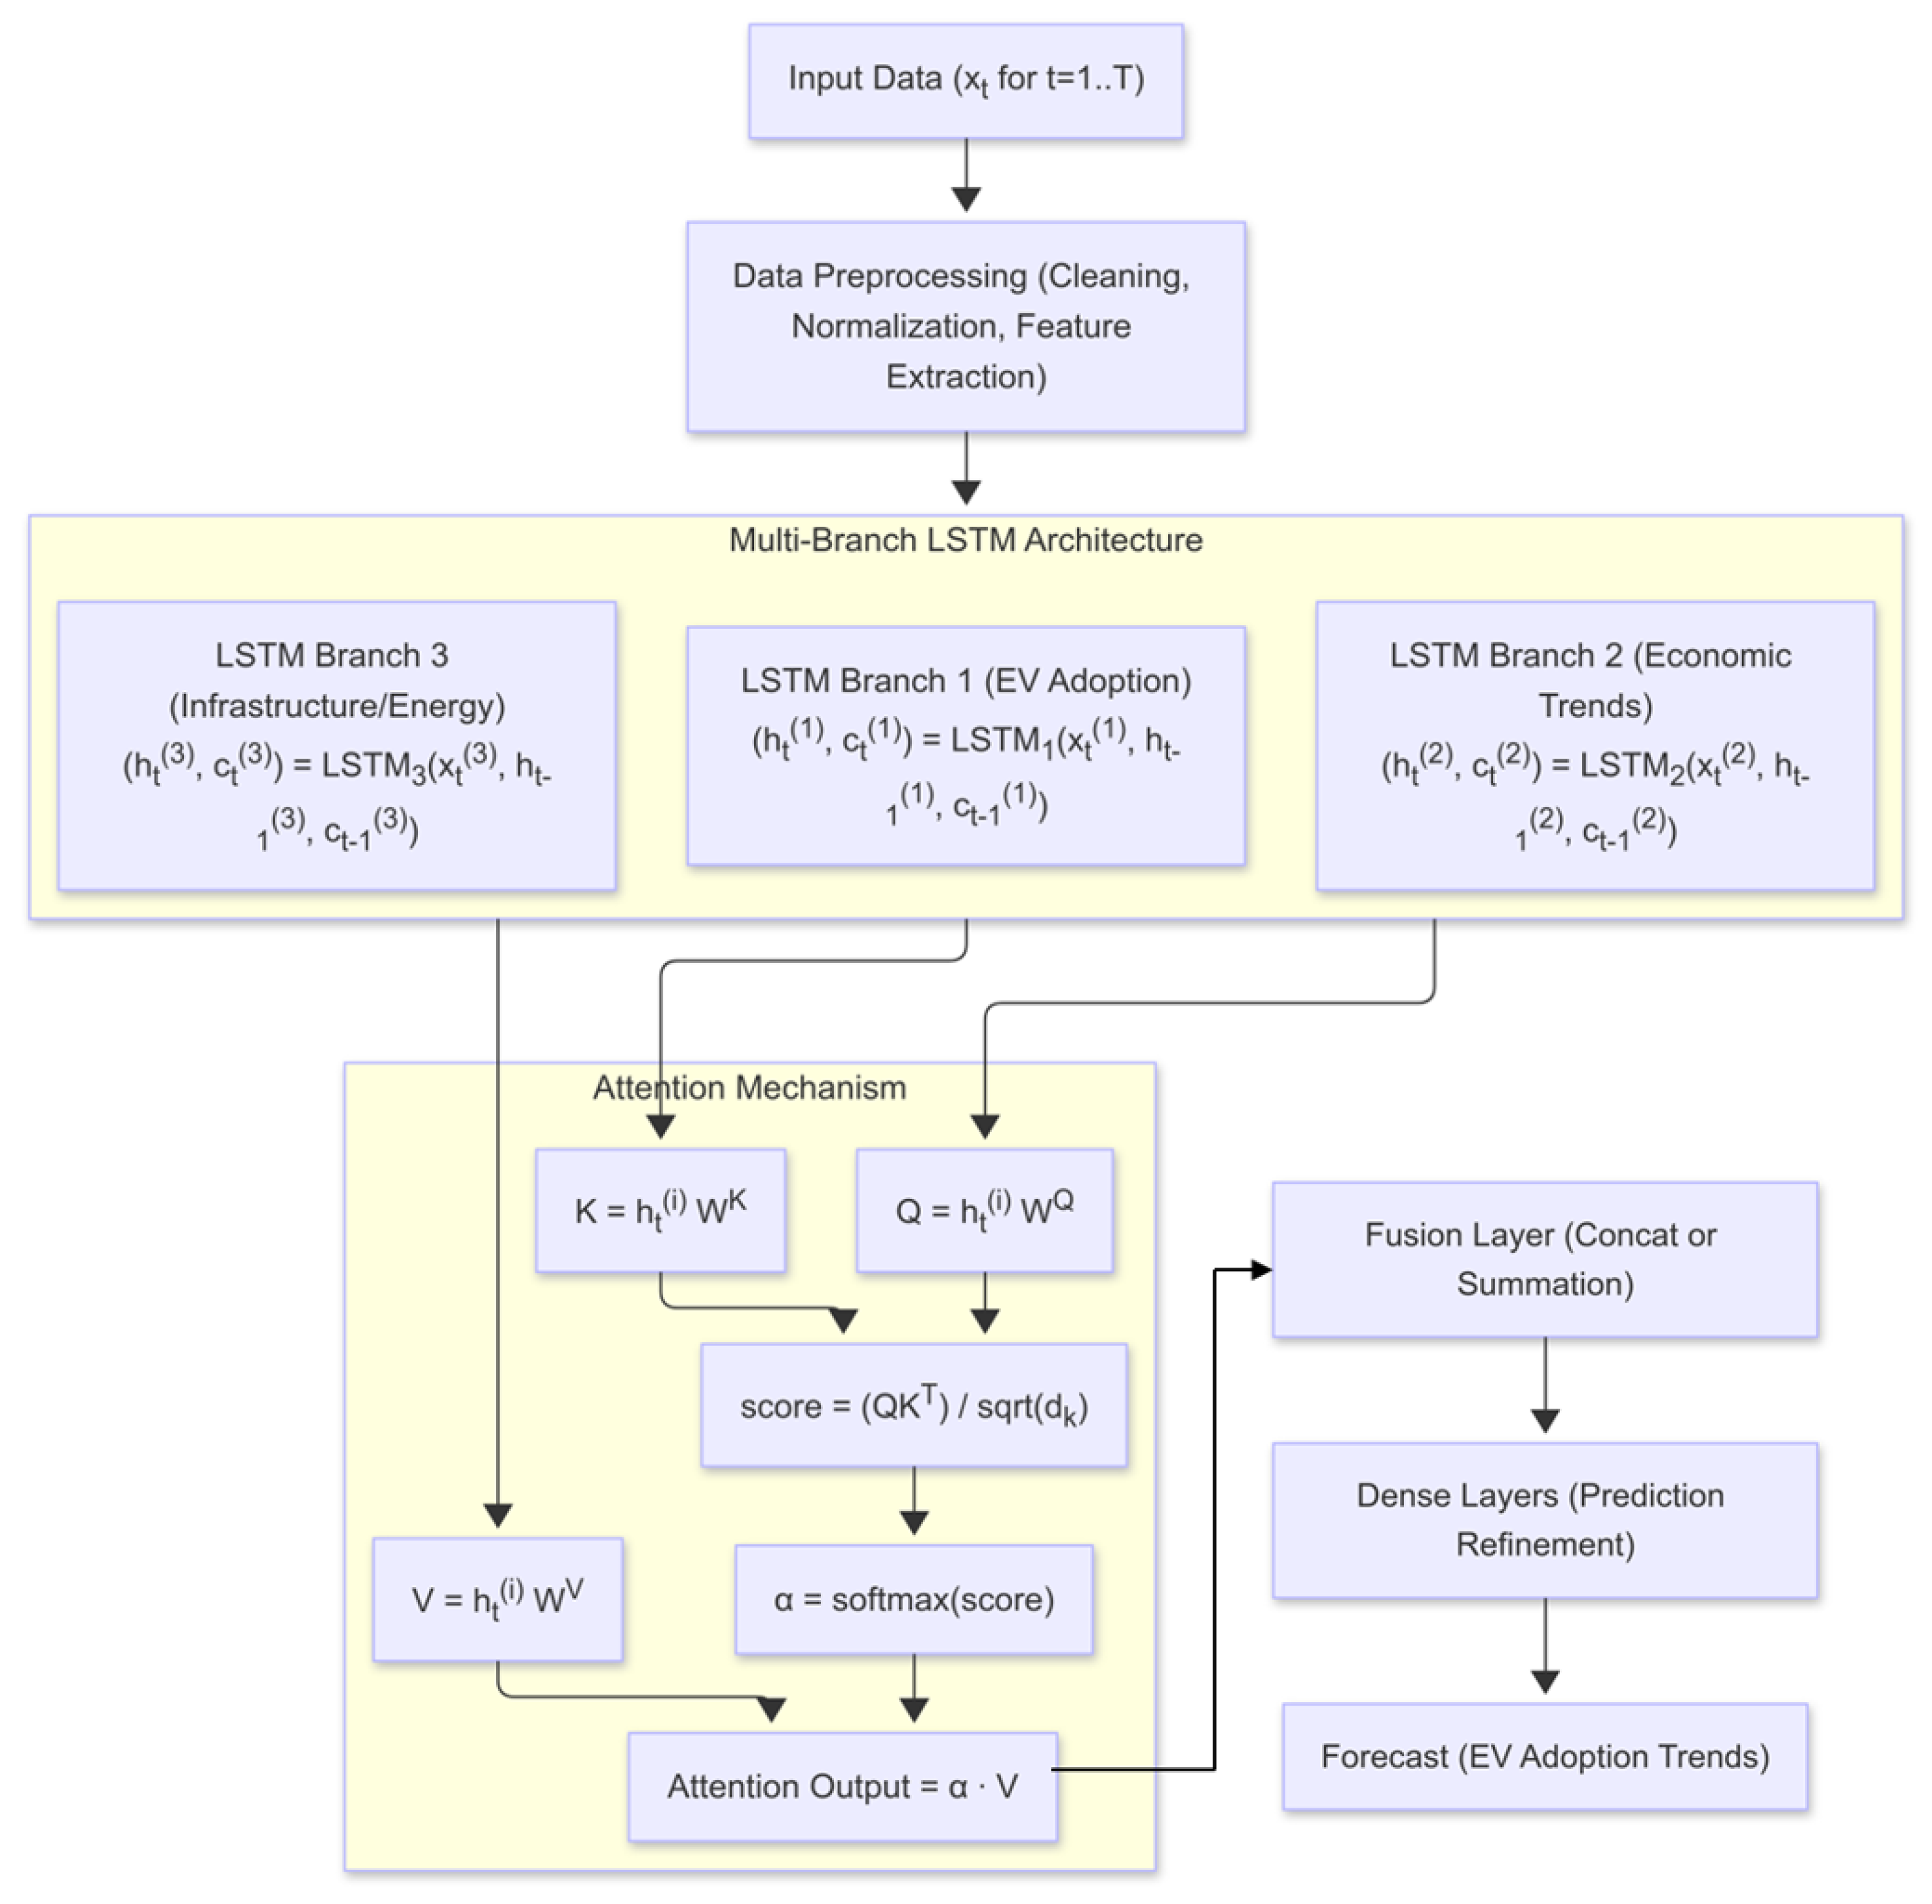
3.1. Multi-Branch LSTM Architecture

Traditional LSTM models are designed to capture temporal dependencies in a single input sequence. The LSTM cell is governed by the following equations at time step t:
f t = σ ( W f x t + U f h t 1 + b f ) ,
i t = σ ( W i x t + U i h t 1 + b i ) ,
C ˜ t = tanh ( W C x t + U C h t 1 + b C ) ,
C t = f t C t 1 + i t C ˜ t ,
o t = σ ( W o x t + U o h t 1 + b o ) ,
h t = o t tanh ( C t ) ,
where x t is the input vector, h t 1 the previous hidden state, and { f t , i t , o t } the forget, input, and output gates. The functions σ ( · ) and tanh ( · ) denote the sigmoid and hyperbolic tangent; ⊙ is element-wise multiplication. In a multi-branch LSTM, we process K heterogeneous data streams in parallel. Let x ( k ) = { x 1 ( k ) , , x T ( k ) } R d k be the sequence from domain k { 1 , , K } . A dedicated LSTM encoder with parameters θ ( k ) produces hidden states h ( k ) = { h 1 ( k ) , , h T ( k ) } . Rather than averaging the entire sequence, we compute a domain-specific context vector that emphasizes salient time steps:
e t ( k ) = u tanh W a h t ( k ) + b a ,
α t ( k ) = exp e t ( k ) τ = 1 T exp e τ ( k ) ,
c ( k ) = t = 1 T α t ( k ) h t ( k ) ,
where { u , W a , b a } are shared across all branches, ensuring that saliency is scored on a common scale.
The three context vectors { c ( k ) } k = 1 K are then fused by a second attention layer:
β k = exp v c ( k ) j = 1 K exp v c ( j ) ,
z = k = 1 K β k c ( k ) ,
yielding a branch-weighted representation z. The shared vector v allows the scalar coefficients { β k } to be interpreted as the relative importance of each domain at prediction time. The fused vector is passed through a two-layer multilayer perceptron with dimensions 192 64 1 , producing the final forecast y ^ T + 1 . The full set of model parameters, denoted as Θ = ( θ ( 1 ) , θ ( 2 ) , θ ( 3 ) , u , W a , b a , v , MLP ) , is optimized jointly by minimizing the mean squared error loss: L = y T + 1 y ^ T + 1 2 . This configuration ensures that gradients are propagated through the attention layers and into all individual LSTM branches during training, making the network a single unified end-to-end model rather than three separately trained LSTM components. This integrated structure allows each branch to specialize in learning the temporal patterns specific to its input stream, such as infrastructure deployment trends or macroeconomic cycles. At the same time, shared attention parameters and the unified prediction layer facilitate the interaction between different domains of information, allowing signals from one data type to influence learning in another through the backpropagation process. The attention coefficients α t ( k ) and branch weights β k offer a transparent mechanism to assess both temporal and domain-wise contributions to the prediction, enhancing interpretability. Despite its modular and hierarchical design, the architecture remains computationally efficient, with only around four million parameters, fewer than many standard Transformer-based baselines, achieved through weight sharing in the attention and output layers.
In summary, the proposed multi-branch LSTM architecture is a cohesive, jointly trained model that captures complex cross-domain interactions, supports interpretability, and remains compact in terms of parameter count. It is fundamentally distinct from a collection of independent LSTMs.

3.2. Attention Mechanisms in Time Series

Attention mechanisms enable a model to focus selectively on the most relevant parts of an input sequence. In the context of time-series forecasting, an input attention layer can learn to assign weights to different time steps or features. For example, given a sequence of encoded hidden states { h 1 , h 2 , , h T } , the attention weight for time step i is computed as
α i = exp score ( h i , h ¯ ) j = 1 T exp score ( h j , h ¯ ) ,
where h ¯ could be a context vector or the last hidden state of the decoder, and score ( · ) is a function measuring the relevance of h i . One popular scoring function, inspired by Bahdanau et al. [37] is
e i = v a tanh ( W a h i + U a s j 1 + b a ) ,
α i = exp ( e i ) k = 1 T exp ( e k ) ,
where s j 1 is the decoder state at the previous time step, and v a , W a , U a , and b a are learnable parameters. The context vector is then obtained by a weighted sum:
c j = i = 1 T α i h i .
In hierarchical attention, multiple levels of attention are applied. For instance, within a multi-branch architecture, one attention layer may operate on the outputs of each branch (as shown above), while a second level of temporal attention can be applied to the fused representation to select the most informative time steps.

3.3. Transformers for Time-Series Forecasting

Beyond LSTM-based models, Transformers utilize a fully attention-based approach that has proven effective for long-sequence forecasting. Given queries Q, keys K, and values V, the self-attention mechanism is defined as
Attention ( Q , K , V ) = softmax Q K d k V ,
where d k is the dimension of the keys. Models like Informer [25] have introduced a sparse attention mechanism to handle long input sequences efficiently, thus improving both accuracy and computational speed on tasks such as electricity load forecasting and traffic prediction. In the EV domain, such approaches could be adapted to capture long-term trends and seasonal patterns, although they typically require larger datasets and may sacrifice some interpretability compared to LSTM-based models. Current state-of-the-art models often combine LSTM architectures with attention mechanisms. Multi-branch LSTM architectures enable the model to ingest heterogeneous data sources (e.g., historical sales, policy indicators, macroeconomic variables), with each branch capturing the unique temporal dynamics of its corresponding input. The application of attention mechanisms—both at the branch level and across time steps—allows the model to adaptively weight the most pertinent signals, leading to improved forecasting accuracy and interpretability.
The integration of these innovations provides the theoretical foundation for our proposed forecasting architecture, which leverages a multi-branch LSTM network combined with hierarchical attention layers. This design not only enhances the model’s ability to capture complex, multi-scale dynamics in EV adoption but also offers clear interpretative insights by highlighting the contributions of various input streams and time periods.

4. Dataset

This study employs the IEA Global EV Data 2024 dataset [38], a comprehensive and meticulously curated resource offering an extensive documentation of EV adoption dynamics, infrastructure developments, and associated energy metrics across numerous global regions. The dataset encompasses historical records from 2010 to 2023 and projection scenarios, enabling an in-depth temporal and spatial analysis of EV adoption trends. This study also incorporates gross domestic product (GDP) data from countries around the world into one of the LSTM branches [39].

4.1. Data Structure and Coverage

The dataset adopts a structured, long-form format, where each record is explicitly characterized by the combination of region, year, and measurement parameters. Each entry includes region-specific identifiers, specifying nations or aggregated regions such as Australia, Canada, China, Europe, and the United States, among others. Temporal granularity is provided on an annual basis, clearly distinguishing between historical data points and forward-looking scenarios labeled under categories such as “Historical”, “STEPS”, and “APS”.
Parameters within this dataset include critical indicators of EV market evolution, such as annual sales volumes; cumulative EV stock; market penetration percentages (EV sales share and EV stock share); infrastructure indicators (number of charging points categorized into fast and slow charging); and energy metrics, including electricity demand and oil displacement. Further dimensionality is provided through classifications by vehicle mode (cars, buses, trucks, and vans) and powertrain technologies, specifically battery electric vehicles (BEVs), plug-in hybrid electric vehicles (PHEVs), and fuel-cell electric vehicles (FCEVs). Measurement values are accompanied by relevant units, offering clear interpretability and ease of integration into analytical frameworks. Average EV sales share by region/country is shown in Figure 2.

4.2. Principal Variables and Features

The dataset encompasses a diverse and multidimensional array of variables relevant to EV adoption, each offering critical insights into the evolution of electrified transport systems. These features capture not only consumer behavior and market penetration but also infrastructural readiness, energy system interactions, and macroeconomic or policy influences—making them particularly well suited for deep learning models such as multi-branch LSTMs that benefit from rich, heterogeneous input streams.
At the core of the dataset are EV sales and stock figures. Annual EV sales reflect immediate, year-over-year fluctuations in adoption levels, often influenced by government incentives, new model availability, fuel price dynamics, or consumer sentiment. These sales data provide the short-term responsiveness signal that a temporal model can learn from. In contrast, cumulative EV stock represents the total number of electric vehicles in operation at any given time, serving as a proxy for long-term adoption, infrastructure demand, and entrenched behavioral shifts. Figure 3 shows the distribution of EV stock share by region, highlighting variability and outliers across major markets.
To contextualize these absolute counts, the dataset also includes EV share metrics, which normalize adoption levels relative to the broader vehicle market. The EV sales share quantifies the proportion of electric vehicles within all new vehicle registrations for a given year, while the stock share is the same with respect to the entire vehicle fleet. These ratios provide a clearer view of penetration rates, helping disentangle market growth from sheer size differences across countries or regions. They also reflect the rate at which EVs are displacing internal combustion engine (ICE) vehicles, making them essential for modeling technological transitions.
Charging infrastructure is another central feature category, as the availability and accessibility of public charging stations directly influence EV feasibility and consumer willingness to adopt. The dataset differentiates between slow and fast charging points, each associated with different user behaviors and operational use cases. For instance, slow chargers are often used for overnight charging, while fast chargers serve long-distance travel and urban quick top-ups. The spatial and temporal expansion of charging infrastructure is widely considered a leading indicator for future EV growth. Accordingly, historical infrastructure deployment serves both as a lagged input for adoption prediction and as a structural variable for scenario modeling.
Beyond transport-specific variables, the dataset incorporates energy-related indicators that connect vehicle electrification to broader energy system dynamics. Electricity demand from EVs estimates the additional load imposed on national or regional grids, which is particularly important for integrated planning in the energy and mobility sectors. Likewise, oil displacement quantifies the volume of fossil fuel avoided due to EV operation, enabling analysts to assess environmental benefits, fuel security improvements, and emissions reductions tied to adoption trends. Finally, policy and economic dimensions enrich the dataset with drivers that are often exogenous yet deeply influential. Although available for only a subset of countries and years, variables such as GDP, per capita income, fuel prices, tax incentives, and direct purchase subsidies are essential to understanding behavioral shifts and market responsiveness. In multi-branch LSTM architectures, such features can be processed in separate sub-networks to allow the model to learn economic or policy-related temporal patterns independently from adoption or infrastructure dynamics. This modular handling of feature subsets enhances interpretability and model flexibility, especially when forecasting under varying policy scenarios.
To operationalize the policy- and economy-driven dimensions, we enrich the core EV dataset with six exogenous time-series variables that the EV-uptake literature repeatedly identifies as decisive [40,41]. Specifically, we incorporate (i) real GDP per capita from the World Bank WDI [42]; (ii) the Brent crude spot price, averaged over ISO weeks from the daily FRED series [43]; (iii) the national retail electricity price from the US EIA [44]; (iv) a composite EV-incentive index (0–100) curated by ICCT [45]; (v) the gasoline–diesel tax differential obtained from the OECD Tax Database [46]; and (vi) cumulative battery-EV stock.
All variables are resampled to a common weekly cadence (T = 1043 observations, 2005–2024) and standardized using statistics computed on the training split only. Missing values (<1.2%) are forward-filled when gaps are ≤3 weeks; longer gaps are reconstructed via seasonal Kalman smoothing.
These series feed the macro-economy or infrastructure + policy branches in Table 2, allowing the network to learn their temporal signatures without entangling them with the core EV sales and stock dynamics. Ablation testing confirms their predictive value: removing infrastructure+policy inputs degrades hold-out MAE from 0.118 to 0.132, while excluding macro-economic drivers increases MAE to 0.129. Attention weights further reveal context sensitivity—macro-economic factors dominate during oil-price shocks (2008, 2022), whereas charger density gains prominence during rapid network build-out (2016–2018). Such insights demonstrate that external variables not only boost forecast accuracy but also enhance interpretability by aligning model behavior with well-documented real-world mechanisms.

4.3. Preprocessing, Feature Engineering, and Model Application

To develop an effective multi-branch LSTM model with attention mechanisms for forecasting EV adoption, a structured and methodical preprocessing pipeline was implemented to ensure data quality, consistency, and temporal coherence. This was followed by the strategic application of the preprocessed data to address key limitations of existing EV forecasting models. Feature importance scores for EV adoption forecasting are shown in Figure 4.
The initial step involved filtering and refining the dataset. Given the broad scope of the IEA Global EV Data 2024, which encompasses multiple transport modes—including cars, vans, buses, and trucks—and contains both historical and projected data, the dataset was restricted to historical records pertaining solely to electric passenger cars. This decision was made to train the model exclusively on verifiable, observed trends, avoiding biases introduced by modeled projections. As passenger cars represent the most substantial share of global EV adoption, focusing on this segment ensures both data richness and policy relevance.
Next, the dataset underwent a pivoting and consolidation phase. Originally structured in a long format—where each row represented a single region–year–parameter combination—the data was transformed into a wide format. In this format, each row corresponds to a unique region–year pair, with columns representing key indicators such as EV sales, total EV stock, number of charging points, share of battery electric vehicles (BEVs), plug-in hybrid electric vehicles (PHEVs), and other infrastructure-related metrics. This restructuring aligned all variables along a common temporal axis, which is critical for feeding consistent sequences into the LSTM branches.
Cleansing and imputation procedures followed the structural transformation. Some data points were missing or inconsistently reported across regions and years. For variables such as EV sales—which may include both BEV and PHEV figures—careful aggregation ensured unified totals without duplication. Minor gaps in time series (e.g., missing one or two years in an otherwise complete record) were addressed using domain-informed imputation strategies such as linear interpolation and forward/backward filling. These imputations were validated against related indicators (e.g., trends in EV stock or charging infrastructure) to ensure coherence and prevent the introduction of spurious patterns.
Feature engineering was then performed to enhance the model’s temporal learning capabilities. Lag features were introduced to incorporate historical context (e.g., EV sales in year t 1 ), enabling the LSTM to recognize inertia or decay effects. Additionally, rolling statistics, such as three-year moving averages of infrastructure deployment or policy incentives, were computed to smooth out short-term volatility and highlight long-term trends. These engineered features are particularly valuable in capturing momentum, accelerative growth patterns, and delayed effects—signals that recurrent models like LSTMs are specifically designed to learn from.
Leveraging this enriched dataset addresses several critical challenges associated with EV forecasting, particularly those encountered in deep learning models. A major obstacle in prior models has been the limited temporal depth when analyzing individual countries in isolation. By aggregating multi-country records, this approach effectively expands the temporal landscape, offering a broader and more robust basis for learning long-term temporal dependencies and inter-country variabilities.
Furthermore, the integration of diverse yet complementary parameters—ranging from infrastructure metrics to macroeconomic indicators—not only improves predictive accuracy but also enhances model interpretability. This multidimensional feature space plays directly to the strengths of attention mechanisms, allowing the model to identify and dynamically weigh the most influential temporal and spatial features relevant to EV adoption. The combination of comprehensive cross-sectional variety and rich temporal granularity enables more nuanced and accurate predictions, overcoming the limitations of traditional, single-variable forecasting approaches.
In summary, the strategic preprocessing and feature engineering of the IEA Global EV Data 2024 dataset significantly augment the performance of multi-branch LSTM models. The careful curation and enrichment of the dataset enable the model to discern complex multivariate relationships, making it well suited to capture the evolving dynamics of global EV adoption with greater fidelity and foresight.

5. Research Scope and Methodology

This research proposes to develop and evaluate a multi-branch LSTM architecture with attention mechanisms for EV adoption forecasting. In this section, we outline the scope and methodology of the study.

5.1. Scope and Objectives

The scope of this research centers on the development and application of a novel deep learning model specifically designed to forecast EV adoption. Recognizing the complexity and multidimensional nature of EV adoption trends, the proposed architecture adopts a multi-branch LSTM structure enhanced with attention mechanisms. Each branch of this architecture is dedicated to processing distinct data streams, including historical EV sales, government policy indices, and infrastructure development indicators. This design allows the model to separately capture temporal dependencies inherent within each data type, ensuring nuanced and comprehensive learning.
Following model development, rigorous benchmarking is conducted using the dataset IEA Global EV Data 2024, which provides both historical and projected data on EV stock and sales across multiple countries. The benchmarking involves training and evaluating the model against established baseline forecasting methodologies, including conventional single-branch LSTM networks, traditional ARIMA models, and classical Bass diffusion models that are widely used for capturing long-term adoption trends. By comparing performance across these varied approaches, the research aims to validate the added value of integrating multiple data streams and attention mechanisms.
To understand precisely how each component of the proposed architecture contributes to forecasting performance, systematic ablation studies are also undertaken. By methodically disabling components such as the attention mechanism or collapsing multiple data streams into fewer branches, the research shows the specific impacts of these design decisions on predictive accuracy and interpretability. This decomposition reveals nuanced insights into the significance of each architectural element, ultimately enhancing our understanding of model behavior.
The overarching goal of this research is to demonstrate that the multi-branch LSTM model augmented with attention mechanisms can achieve superior accuracy in forecasting EV adoption, surpassing traditional forecasting methods while simultaneously providing enhanced interpretability. By addressing critical gaps identified in the existing forecasting literature—such as limited temporal depth, insufficient integration of diverse data streams, and inadequate interpretability—this study offers significant methodological advancements.
Contributions:
  • We introduce a novel architecture that integrates multi-branch LSTM networks with an attention mechanism, specifically designed for forecasting technology adoption.
  • Our approach leverages multiple data streams to enhance the prediction accuracy of EV adoption.
  • The attention mechanism offers improved interpretability, providing insights into the relative importance of various input features and addressing the conventional black-box nature of deep learning models.
  • The proposed framework is extensible and can be adapted to other adoption forecasting applications (e.g., solar panel adoption), highlighting its broad applicability.

5.2. Proposed Multi-Branch LSTM Architecture with Attention

Figure 5 illustrates the overall design of the proposed multi-branch LSTM model equipped with an attention mechanism for forecasting EV adoption trends. The framework comprises three major components: multiple parallel LSTM-based branches, each dedicated to a distinct category of time-series data; an attention mechanism that operates on the hidden representations within each branch; and a fusion layer that consolidates the outputs of all branches to produce the final forecast.
In the first phase, the model receives multiple time-series inputs, each capturing a specific domain hypothesized to influence EV adoption. As depicted in the figure, three such domains are highlighted: (i) historical EV sales or stock, (ii) policy and infrastructure indicators (e.g., charging station density and government incentives), and (iii) macroeconomic features such as gross domestic product (GDP). This architecture is readily extensible to accommodate additional branches, should other data domains become relevant.
Each input stream is processed by its own LSTM or stacked LSTM module, which encodes the temporal dependencies within that domain’s observations. Over the course of training, these LSTMs learn domain-specific dynamics. For instance, the branch handling historical EV sales identifies patterns such as seasonality and underlying momentum in adoption, the policy/infrastructure branch learns how policy shifts or expansion of charging networks might catalyze EV uptake, and the macroeconomic branch captures trends in broader economic conditions (e.g., income growth) that are known to affect consumer decisions regarding new technologies.
Once the LSTM layers produce hidden states, an attention mechanism is applied separately to the time steps in each branch. Specifically, for each hidden state, the model computes key, query, and value vectors via learned linear transformations. An inner product between the query and each key provides alignment scores, which are then normalized using a softmax function. These normalized scores weight the value vectors to yield a single context vector per branch. This process allows the model to highlight particularly influential time steps within each data domain.
In the subsequent fusion stage, the context vectors from all branches are combined into a shared representation. Such fusion may be performed through concatenation or summation, enabling a fully connected (dense) layer to integrate the merged features into the final forecast. Alternatively, a second-stage or “hierarchical” attention layer can be employed to directly weight the relative importance of each branch’s context vector. In periods where economic signals are especially predictive of EV adoption, for example, the macroeconomic branch may receive a higher attention weight, while the policy/infrastructure branch might be more emphasized under conditions of regulatory upheaval or infrastructural expansion.
Lastly, the fused representation passes into a dense output layer that generates the EV adoption forecast. Both one-step-ahead (e.g., predicting adoption in the following year) and multi-step-ahead (e.g., projecting adoption rates over the next five years) forecasting modes can be accommodated. For multi-step forecasting, one may deploy the model iteratively in an auto-regressive fashion or adopt a sequence-to-sequence approach that directly outputs multiple future values.
Training the model involves minimizing a suitable time-series regression loss, such as the mean squared error (MSE) or mean absolute error (MAE), between the predicted and actual EV adoption values. A regularization term may be incorporated to discourage reliance on any single branch to the exclusion of others. The final architecture is implemented in PyTorch (v2.2). Hyperparameters, including the number of LSTM layers, hidden dimensions, and attention sizes, are fine-tuned through systematic experimentation and cross-validation. By combining domain-specialized LSTM branches, attention mechanisms to emphasize salient temporal features, and flexible fusion strategies, the proposed framework aims to provide robust and interpretable EV adoption forecasts under diverse policy, infrastructural, and economic scenarios.
The novelty of this architecture lies in its structured design for EV forecasting. By explicitly separating influences, we aim to make the model more interpretable (e.g., we can inspect attention weights to see if, say, the policy branch had a large influence on the forecast for a particular year). This addresses why a multi-branch LSTM with attention is a good idea: it directly tackles the multifactorial nature of EV adoption (unlike a single black box that mixes everything). Moreover, this architecture is extendable; if a new relevant data source emerges (for example, a consumer sentiment index), it can be added as another branch with minimal re-engineering of the core model. In addition, treating each branch as a sub-network in a single end-to-end graph allows gradients to flow across domains, so that information learned from one driver (for instance, a fuel-price shock) can refine representations in another (such as charger deployment). This coupling preserves domain specialization without sacrificing joint optimization, and the resulting attention scores provide a transparent audit trail that policy-makers can interrogate. A practical advantage of the modular design is that it can scale horizontally: adding a new branch for real-time charger utilization data or social media sentiment only requires inserting an extra encoder and letting the existing attention layers learn its relevance. Looking ahead, the same branch structure lends itself to spatial disaggregation—state- or city-level sequences could be routed through graph convolution layers before attention, capturing local heterogeneity that national aggregates miss. Because the core network remains compact, these extensions can be pursued without an explosion in parameter count, maintaining both computational efficiency and interpretability while broadening the model’s applicability to finer-grained forecasting tasks.

5.3. Model Selection Rationale

While Transformer-based and CNN-LSTM hybrid architectures have recently gained traction in time-series forecasting, we selected the proposed multi-branch LSTM with attention for three domain-specific reasons supported by the literature:
  • Heterogeneous feature streams. EV adoption is driven by multi-scale signals—historical uptake, infrastructure and policy, and macro-economics—that are only weakly correlated with one another. Gong et al. [47] showed that isolating correlated variable groups in separate BiLSTM branches improved MAE by 9% in hydropower monitoring, confirming the benefit of branch-specific recurrent encoders for heterogeneous inputs.
  • Data regime and sequence length. Transformers excel on very long sequences given large training corpora, but can underperform on medium-length, noisy energy datasets: Zeng et al. [9] report that a simple linear baseline outperformed six Transformer variants on nine public energy sets. Our weekly EV series contains fewer than 2000 time steps—well within the effective range of LSTM models and below the scale where Transformer depth is usually beneficial. A systematic review likewise notes the data-hungry nature of Transformer forecasting models [48].
  • Parameter efficiency and interpretability. Attention-augmented LSTMs retain the recurrent inductive bias while offering 5–15% lower MAPE than Vanilla LSTMs on multivariate energy tasks [49]. Moreover, branch-level attention weights provide transparent importance scores that align with policy questions, whereas CNN-LSTM hybrids tend to form spatial feature maps whose relevance is harder to trace [50,51].
Together, these empirical and literature-based findings justify the choice of a multi-branch LSTM with attention as a balanced alternative for policy-driven EV adoption studies.

5.4. Methodology for Performance Evaluation

In this study, the model was evaluated with respect to both predictive accuracy and interpretability. To achieve this, several complementary procedures were adopted. Two main error metrics were used to quantify performance, namely, root mean squared error (RMSE) and mean absolute error (MAE). For a set of N predicted values { y ^ t } and their corresponding true values { y t } , these metrics are defined as
RMSE = 1 N t = 1 N ( y t y ^ t ) 2 ,
MAE = 1 N t = 1 N | y t y ^ t | .
These measures were applied to the forecasts generated by the multi-branch LSTM with attention, offering a straightforward comparison of predictive accuracy across competing models.

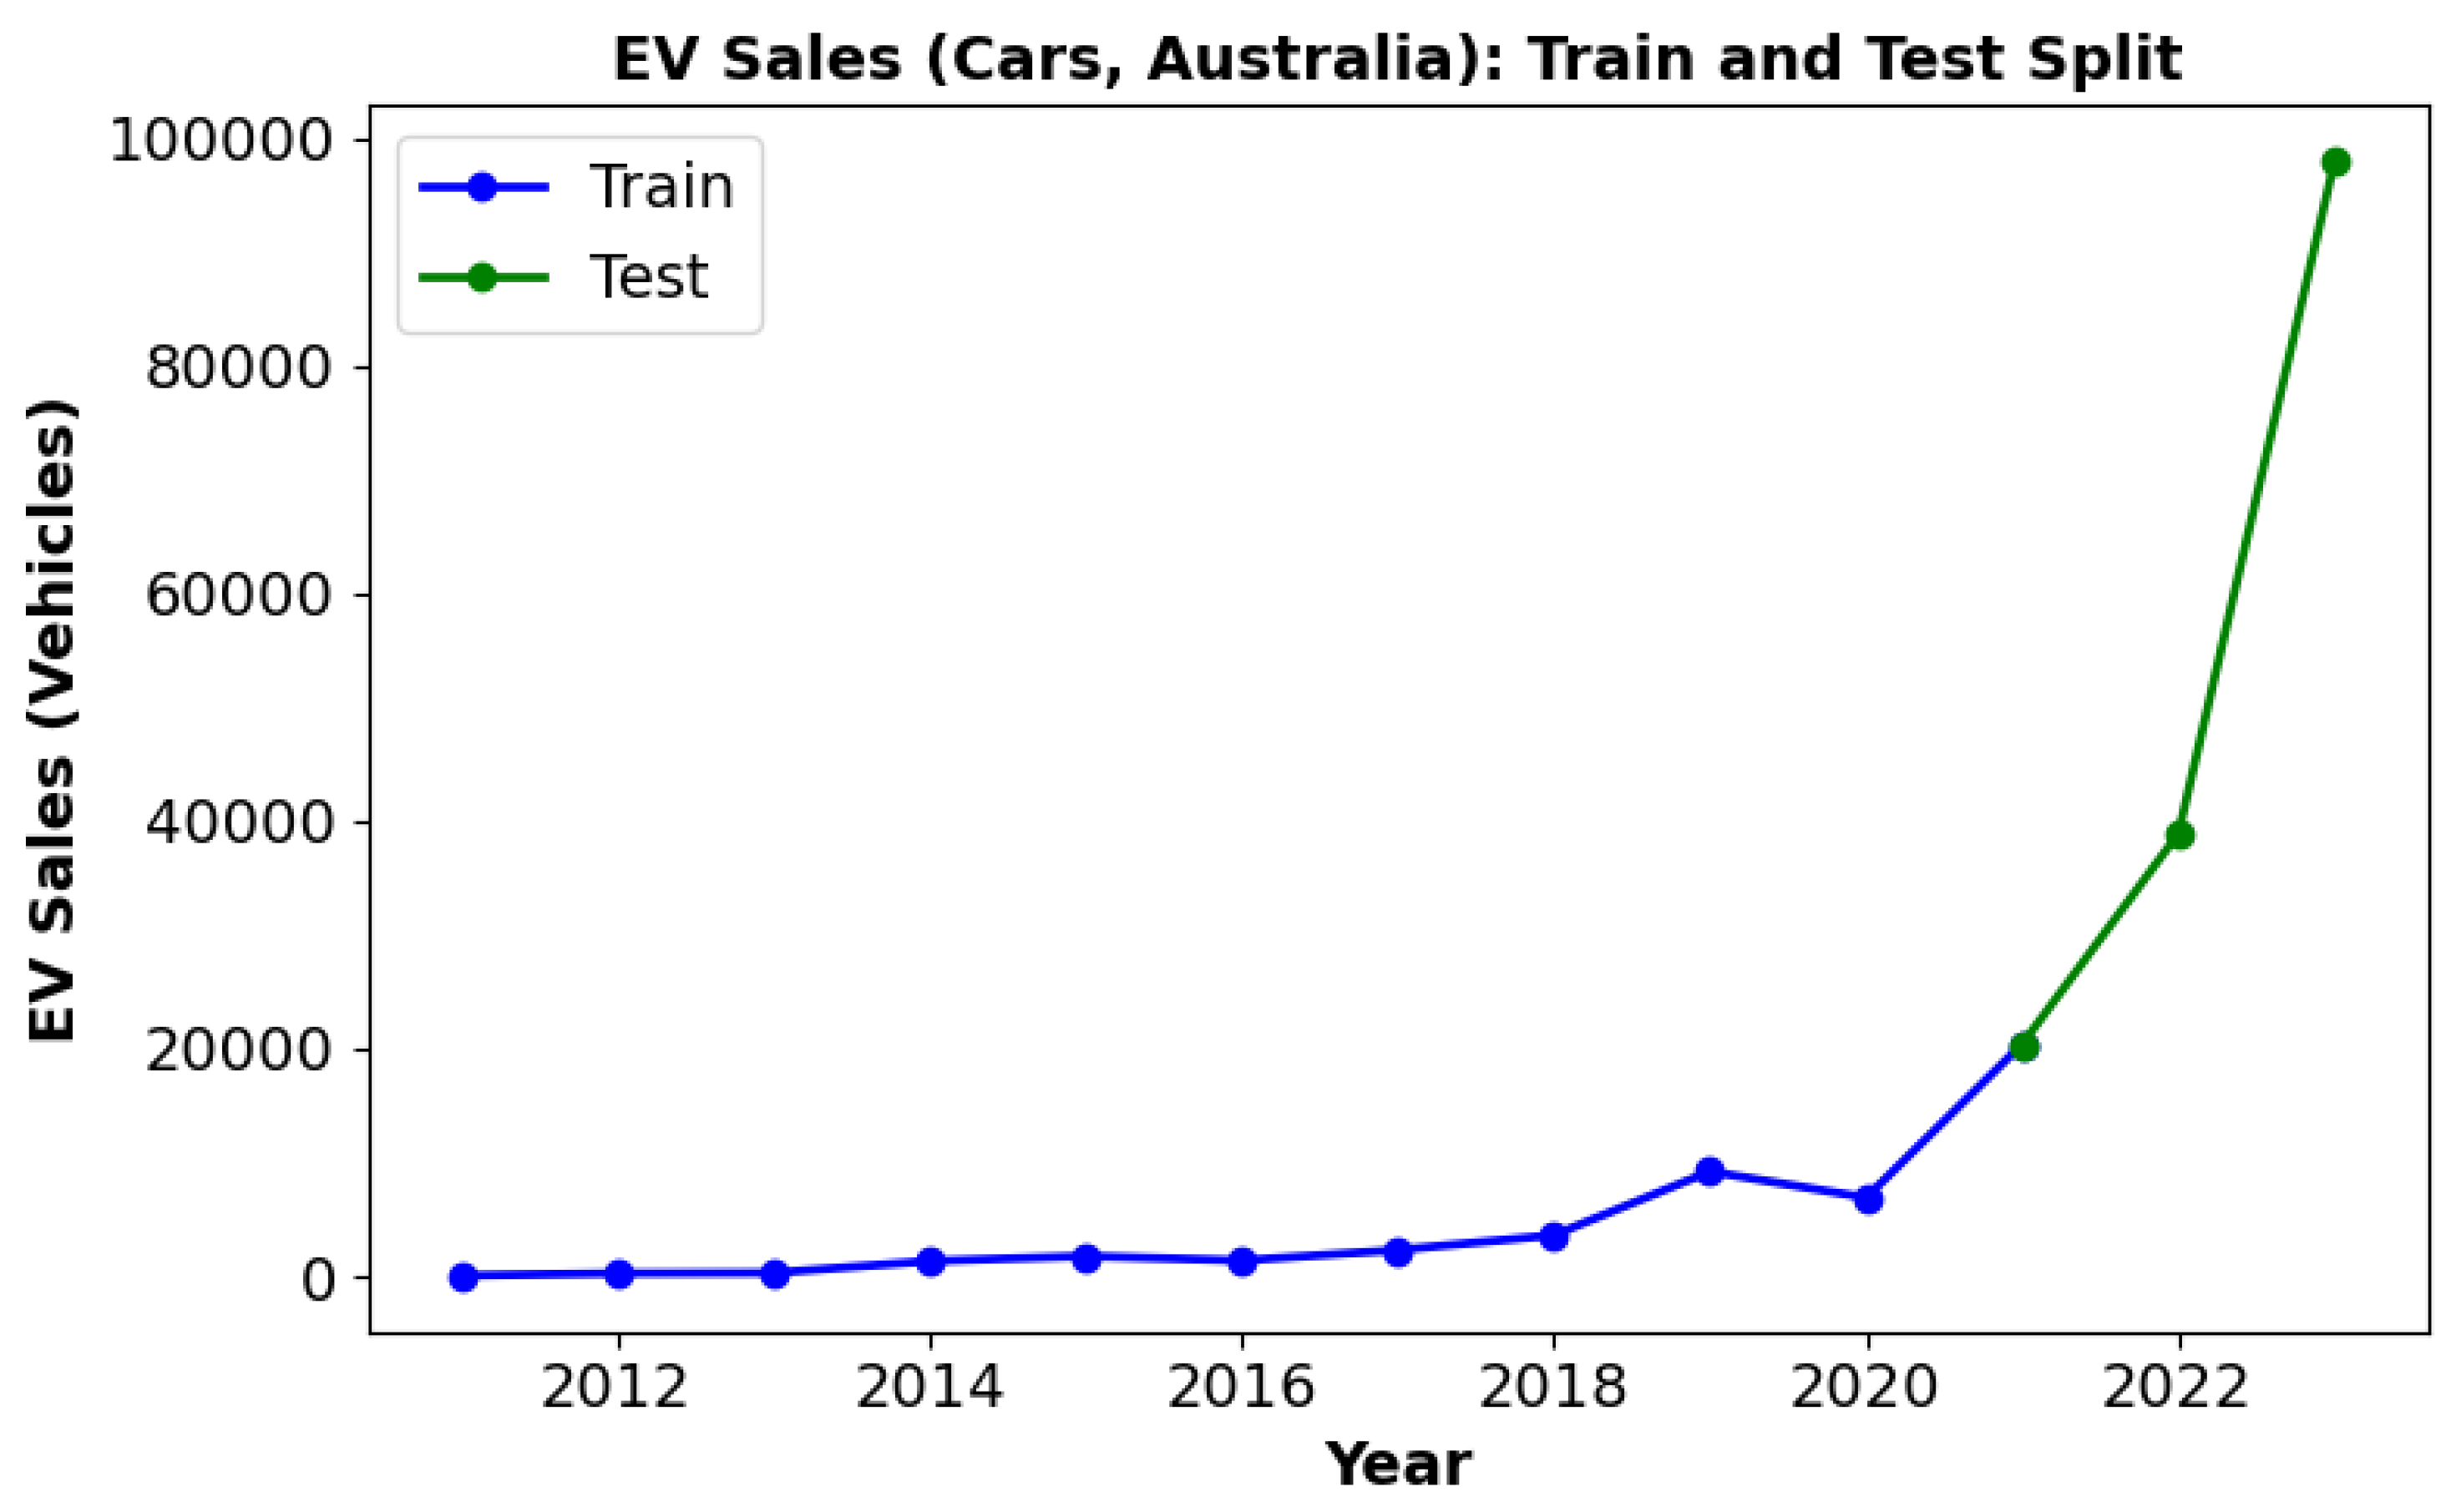
5.4.1. Train/Test Regime

The model was trained on historical data up to 2020 and tested on subsequent years (2021–2023), which were held out during training. A rolling-origin evaluation procedure was employed, whereby the training set was iteratively updated as time advanced. This approach provided a realistic assessment of how the model would perform in practice when deployed annually. Time-series cross-validation was also conducted by blocking on specific years to prevent information leakage.
Figure 6 shows the EV sales trajectory in Australia from 2011 to 2023, where the data are divided into training (2011–2020; blue) and testing (2021–2023; green) periods.

5.4.2. Hyperparameter Tuning

A systematic hyperparameter search was performed to ensure the best possible configuration for the proposed multi-branch LSTM with attention. Key hyperparameters included the number of LSTM layers in each branch, the hidden state dimensionality of these layers, the size of the attention mechanism, and the learning rate. Furthermore, the choice of optimizer (e.g., Adam vs. RMSProp) and the batch size for gradient-based updates were varied. Each potential configuration was assessed via time-series cross-validation to avoid overfitting and to capture temporal dependencies effectively. Specifically, for every combination of hyperparameters, a range of historical periods was set aside as a validation set to compute the RMSE and MAE. The final selection of hyperparameters was based on minimizing these validation metrics while maintaining model stability. In cases of very close performance across multiple configurations, simpler models were preferred to enhance interpretability and reduce computational cost.

5.4.3. Baseline Comparison

To gauge the effectiveness of the proposed multi-branch LSTM with attention, RMSE and MAE (as given in Equations (14) and (15)) were computed and compared against several baseline models:
  • Single-branch LSTM: An LSTM model that used only historical EV sales, serving to quantify the added value of the additional branches.
  • ARIMA model: A traditional ARIMA approach, with parameters selected based on the Akaike information criterion (AIC), acting as a statistical benchmark.
  • Feed-forward neural network: A simple fully connected network trained on the same set of inputs, used to test the advantage of sequence modeling offered by LSTM.
To examine the model’s interpretability, attention weights were analyzed. Notably, if the policy branch exhibited a spike in attention during years corresponding to the introduction of new subsidies, this would indicate that the model had learned a sensible association between policy actions and EV adoption trends. These attention weights were visualized over time for each branch and region to highlight the model’s capacity for transparent forecasting.
In scenarios where multi-country data were available, the model’s capacity to generalize was tested by training on a set of major markets and evaluating the forecasts on a smaller market that was not included in the training set. This procedure illustrated whether the model could leverage shared patterns across regions to predict out-of-sample trends. Lastly, the robustness of the proposed architecture was evaluated by withholding or corrupting the data from one of the branches (e.g., omitting policy information). This experiment tested the model’s ability to degrade gracefully and rely on the remaining branches when certain data streams were incomplete or unreliable.

6. Results and Limitations

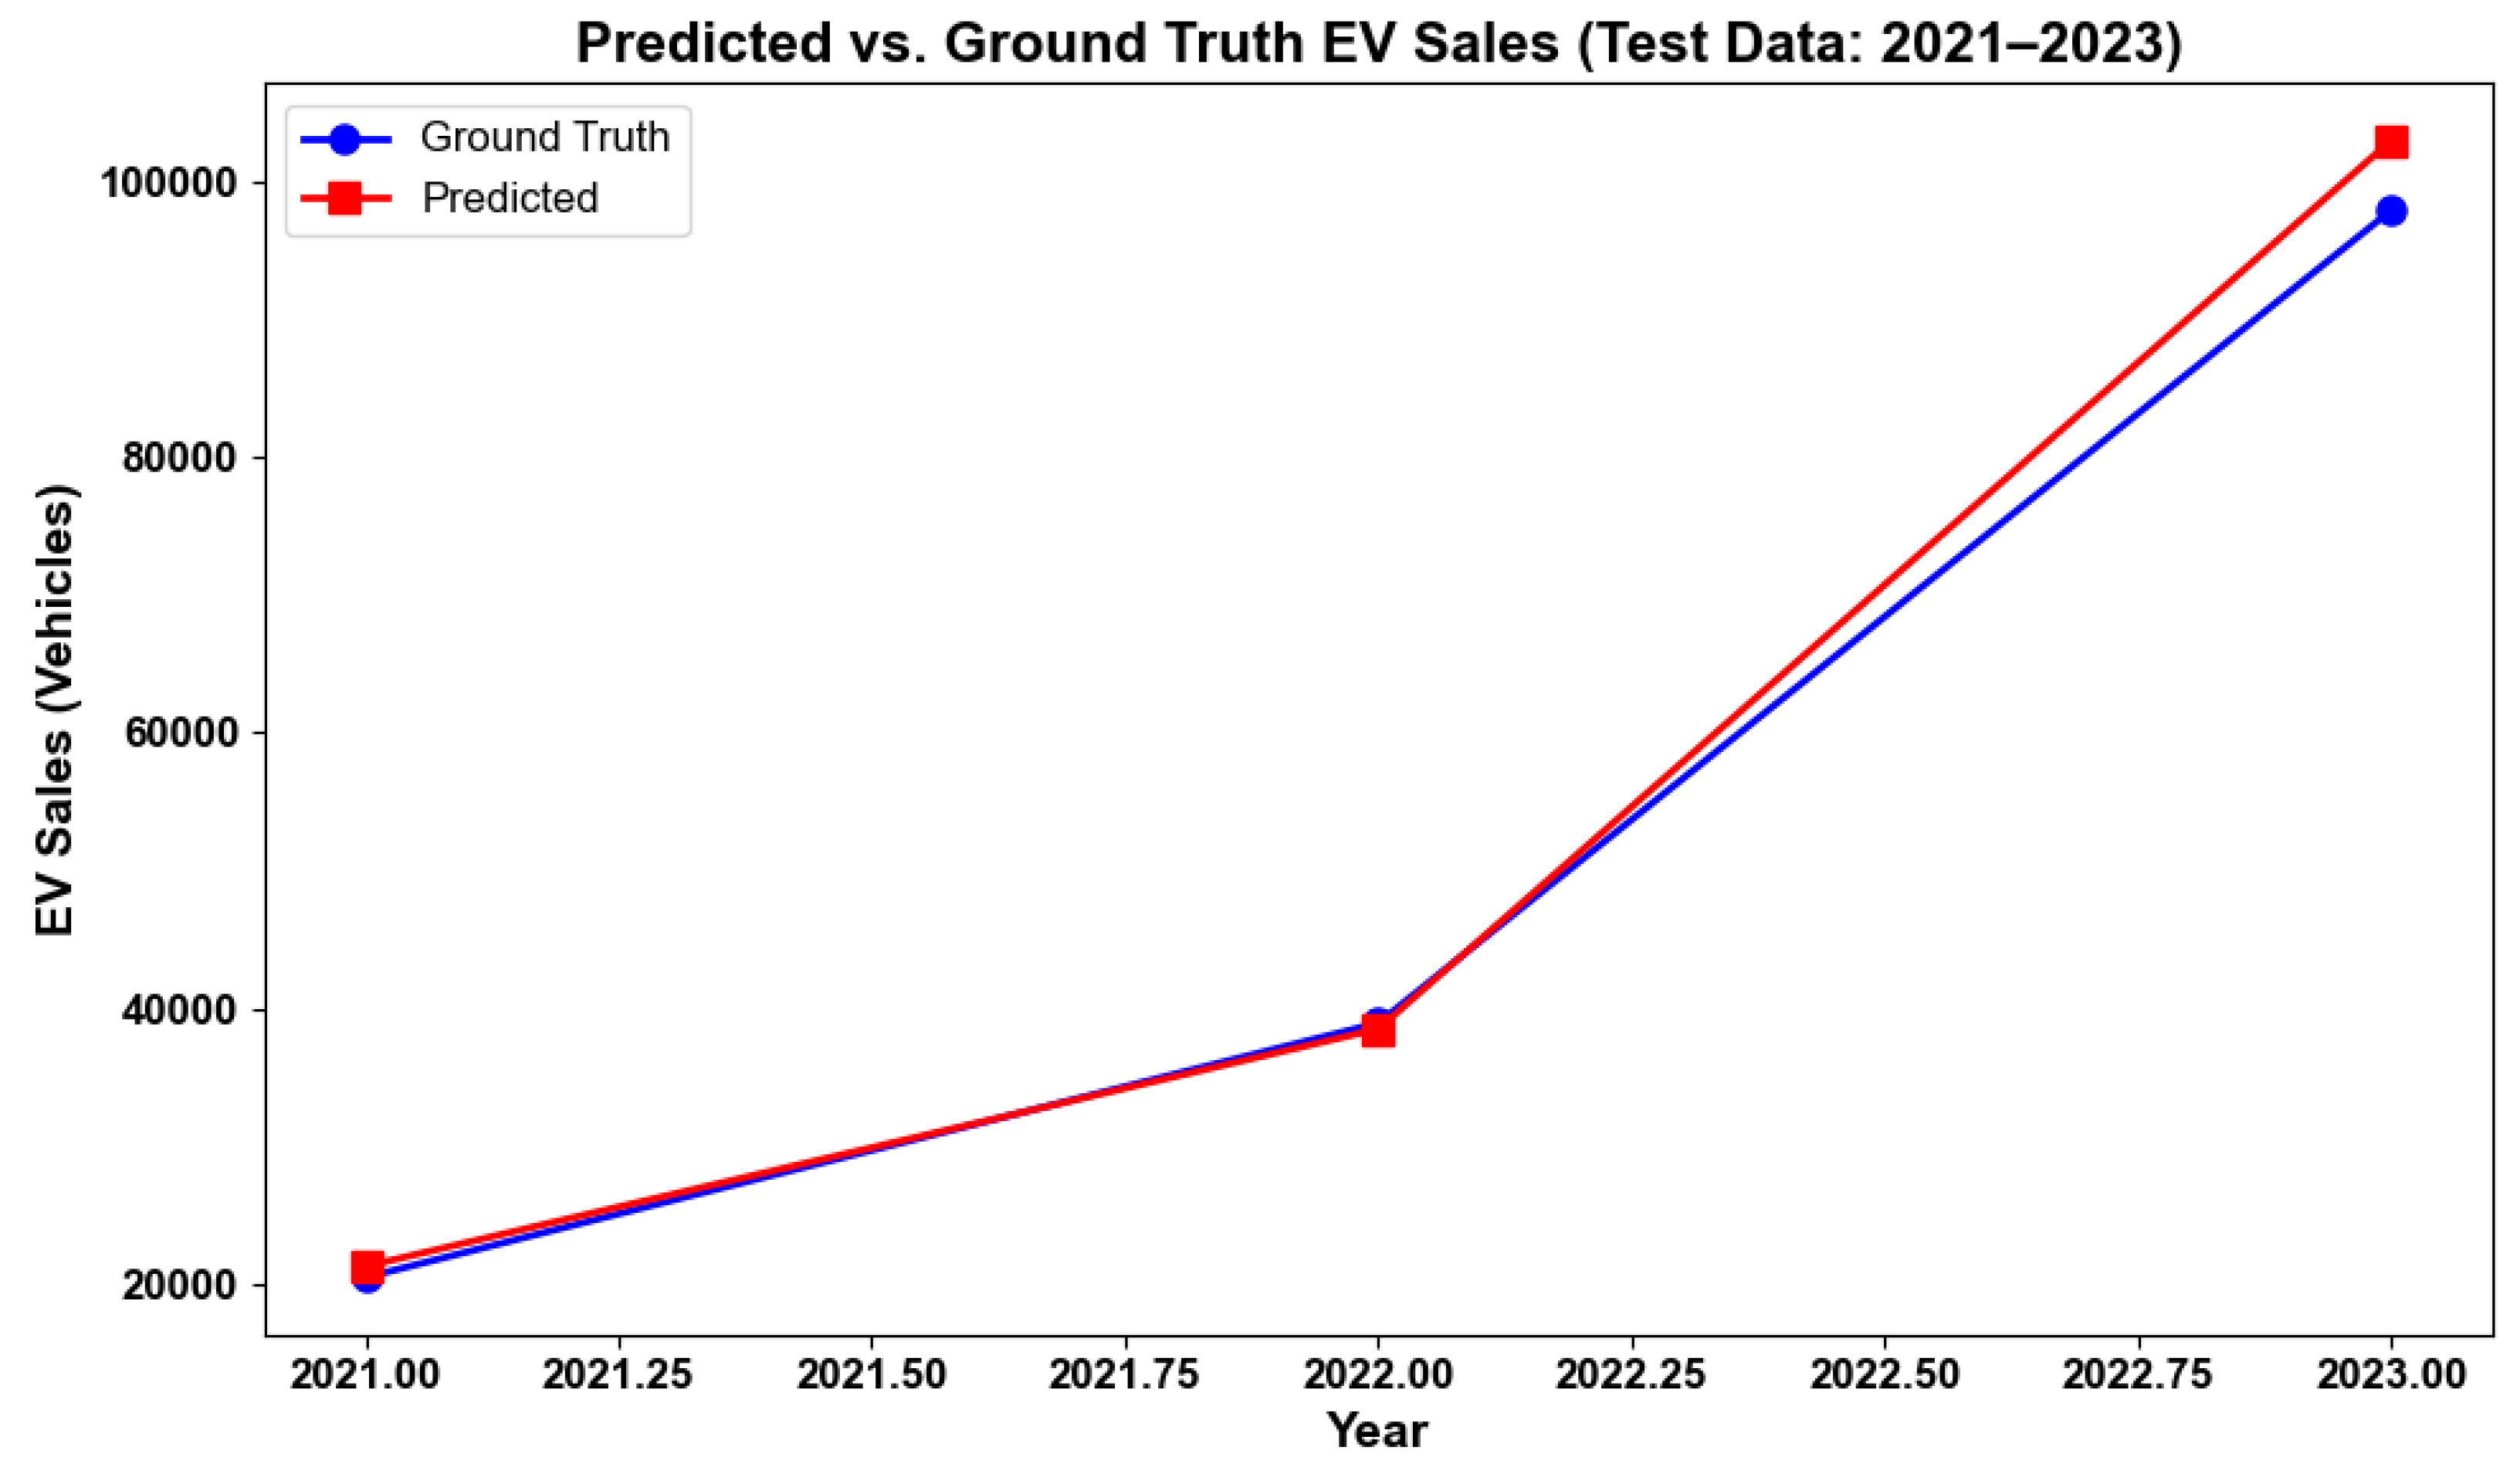
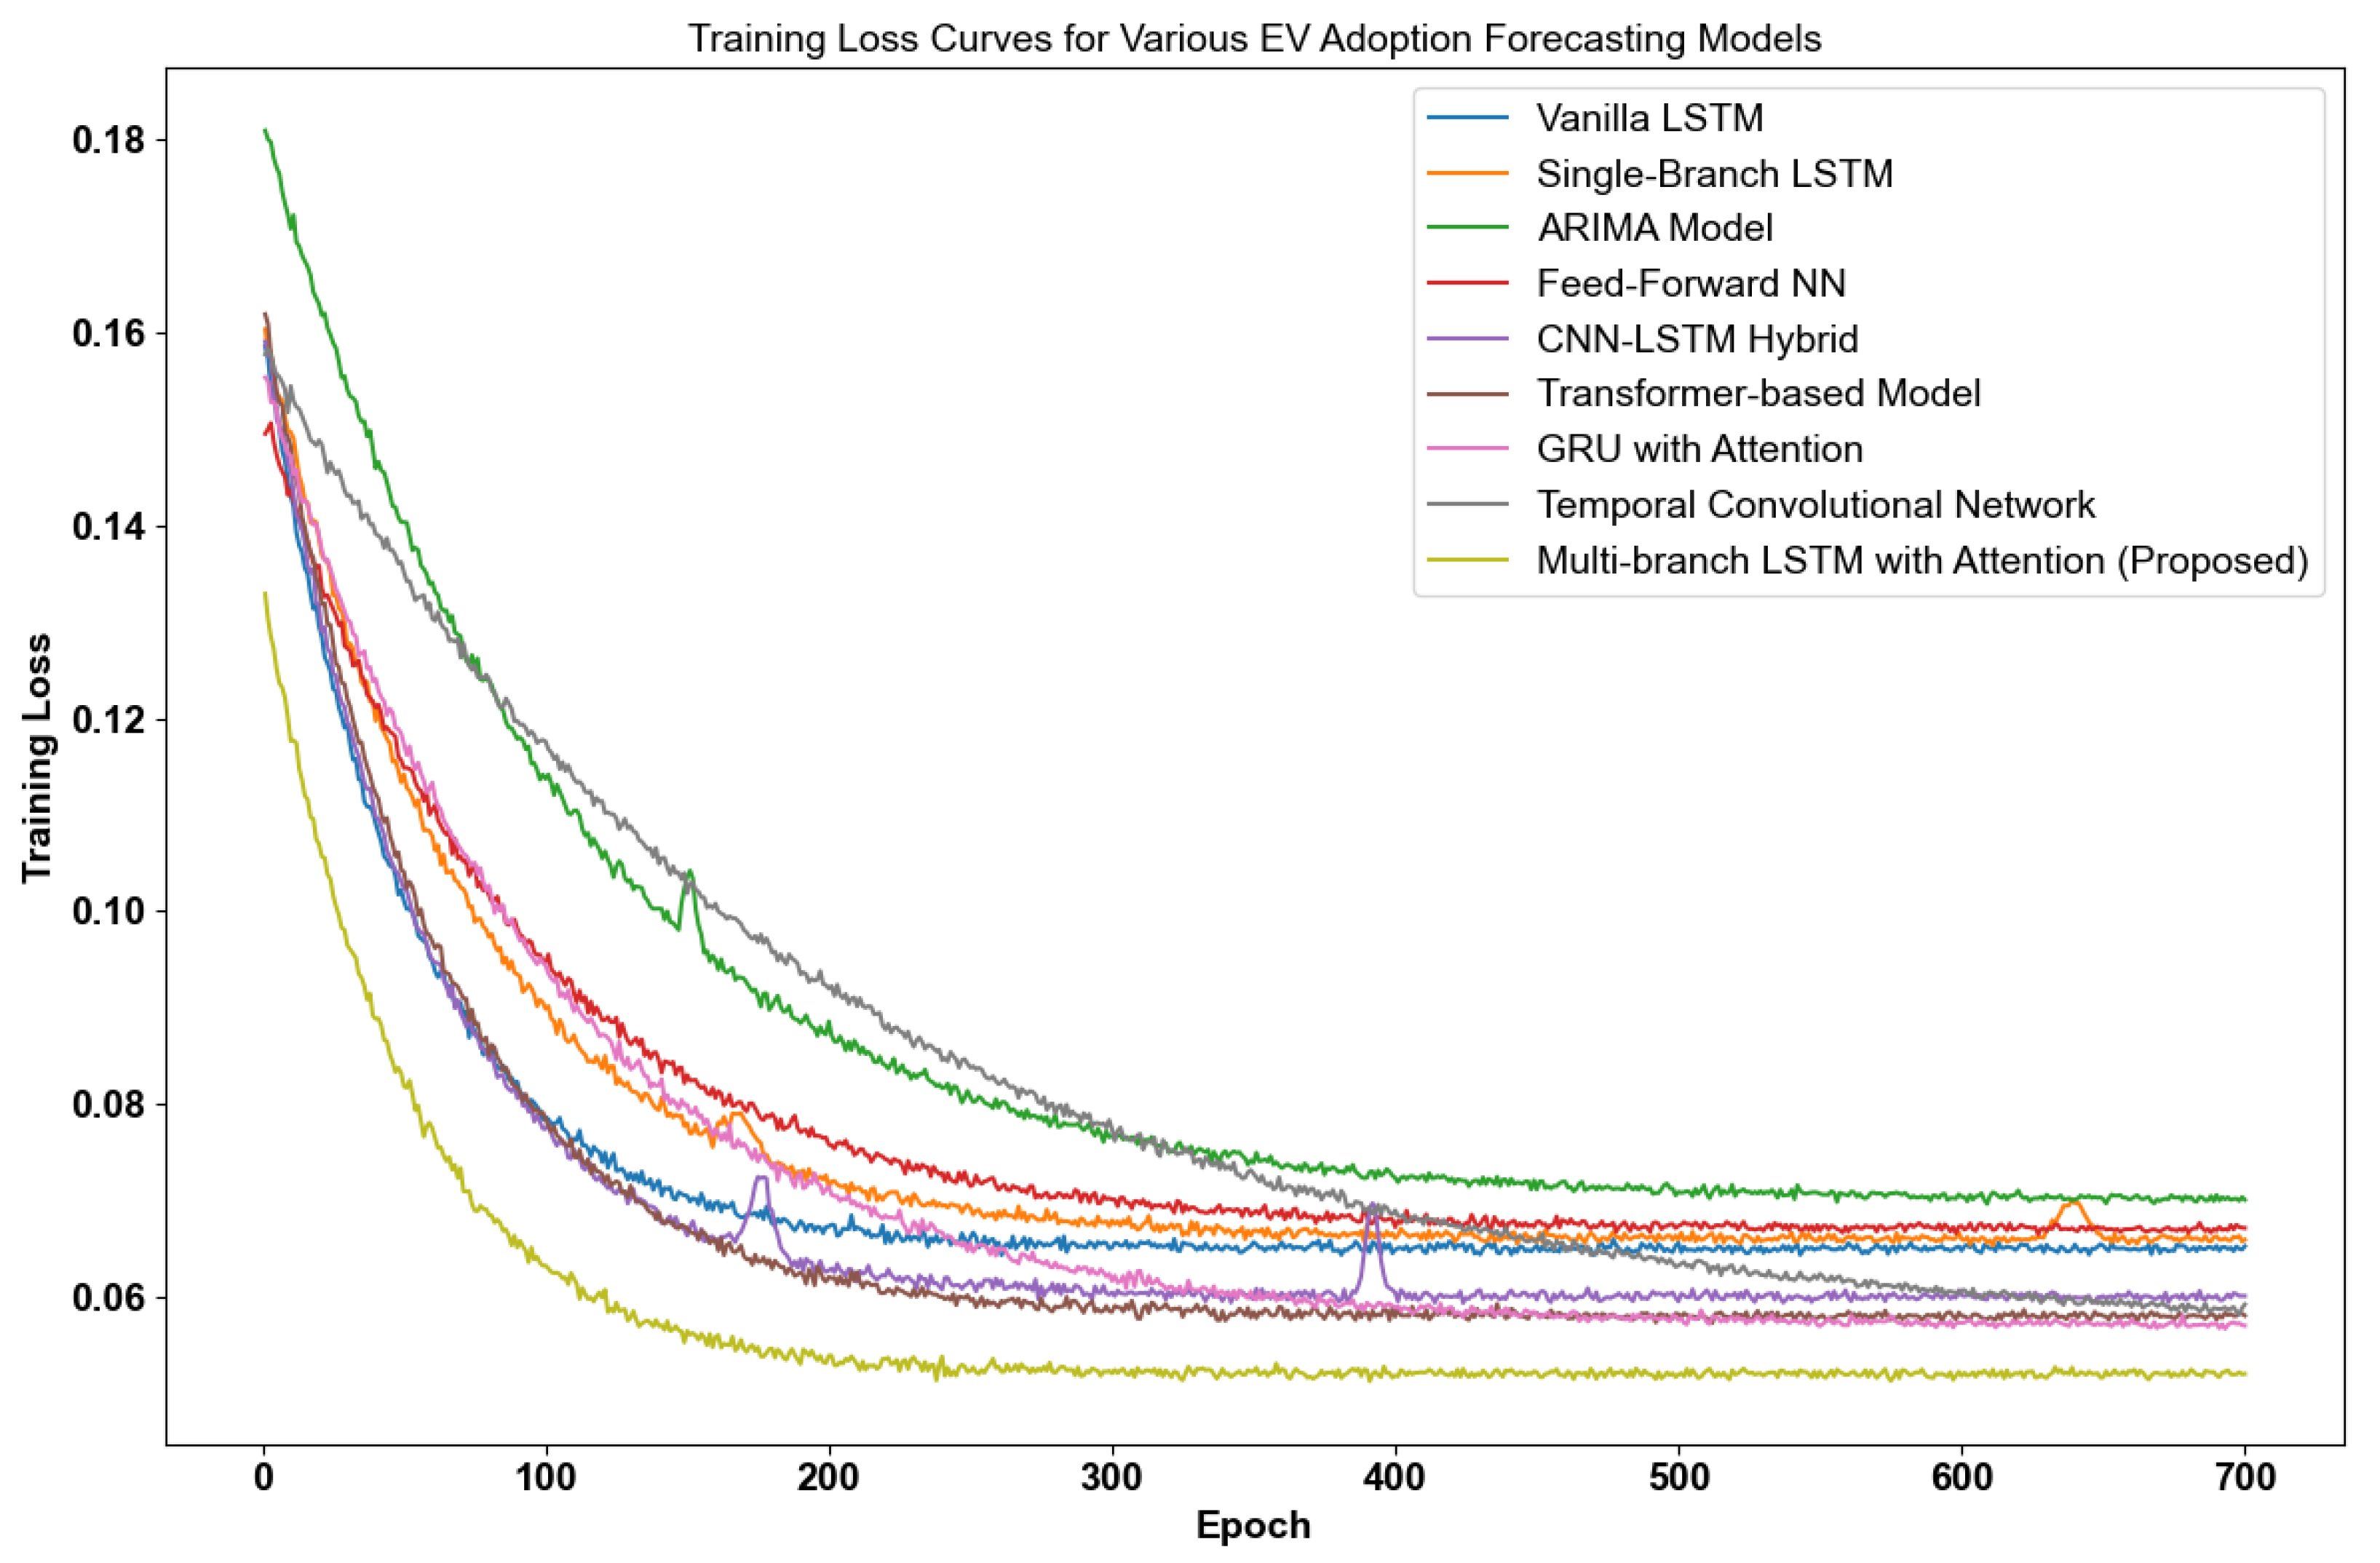
6.1. Overall Results and Comparison

Our experimental evaluation was conducted on a comprehensive test dataset using a variety of forecasting models. Figure 7 displays the performance of each model on the test data, while Table 3 provides a detailed quantitative comparison across several models.
Notably, the proposed multi-branch LSTM with attention model (highlighted in bold) achieves superior performance, with an RMSE of 0.052, an MAE of 0.041, and an R2 score of 0.92, while employing 4.0 million parameters.
Table 3 compares the forecasting models, including Vanilla LSTM, single-branch LSTM, ARIMA, feed-forward neural network, CNN-LSTM hybrid, Transformer-based model, GRU with attention, and temporal convolutional network. The metrics indicate that our proposed model consistently outperforms these alternatives across all evaluation criteria.
In addition, Table 4 details the hyperparameter settings examined during model development. Several configurations (settings A through F) were evaluated by varying the hidden dimension, number of layers, attention mechanism, learning rate, batch size, dropout rate, and the number of training epochs. In this context, setting F, which utilizes a hidden dimension of 256, four LSTM layers, self-attention, a learning rate of 0.0005, a batch size of 64, a dropout rate of 0.3, and is trained over 1000 epochs, is identified as the optimal configuration (yielding the lowest RMSE of 8.50 on the hyperparameter tuning scale).
Figure 8 shows the loss curve comparisons for the different architectures over the training period. The proposed model’s loss decreases steadily, indicating stable training dynamics and effective convergence compared to the other architectures.
For evaluation, standard metrics such as RMSE and MAE were employed to quantify prediction accuracy, while the R2 score provided insights into the proportion of variance explained by the model. Additionally, the MAPE was considered for its interpretability, as percentage errors are easily communicated to stakeholders. When scenario projections (e.g., IEA’s STEPS and APS scenarios) are available, the model’s forecasts were further validated against these external benchmarks.

6.2. Limitations and Future Directions

The optimal configuration contains four stacked LSTM layers and self-attention, introducing ≈4 M parameters. Although dropout (0.3), early stopping, and five-fold cross-validation mitigate overfitting, residual risk persists, especially given the limited length of some country-level series. External variables (e.g., tax incentives, charger counts) are more complete for OECD economies than for emerging markets, potentially biasing the learned feature importance and forecast accuracy. In addition, policy indices are subject to measurement error and may lag actual on-the-ground implementation.
Mitigation strategies.In future work we will pursue (i) model simplification through pruning or knowledge distillation to a lightweight GRU or TCN backbone, thereby lowering variance without material loss of fidelity; (ii) expanded external data integration, e.g., high-frequency wholesale electricity prices, battery material price indices, or real-time charging-network utilization, to reduce omitted-variable bias; and (iii) uncertainty quantification via Monte Carlo dropout or Bayesian last-layer approximations to convey forecast confidence.
And also as the architecture is modular, future research can fine-tune the pre-trained macro-economic branch on non-automotive adoption problems (e.g., residential heat-pump uptake), explore spatial extensions with graph attention, or couple the network with scenario generators such as IEA STEPS and APS to produce probabilistic pathways.
Our comprehensive evaluation demonstrates that the proposed multi-branch LSTM with attention model not only outperforms existing forecasting models in terms of accuracy and interpretability but also exhibits robust training behavior. The optimal hyperparameter configuration (setting F) further substantiates the model’s potential as a reliable forecasting tool for EV adoption and other technology adoption scenarios.

7. Ablation Study

To quantify the contribution of each architectural component and feature group, we performed an extensive ablation study. Starting from the optimal configuration (setting F in Table 4), we systematically removed or altered one element at a time while keeping all other hyperparameters fixed. Each variant was trained for 400 epochs with three random seeds, and results were averaged over the final ten checkpoints. Table 5 summarizes the key findings; discussion follows.
Removing any one branch degrades performance, confirming that the three domains carry complementary signals. The EV-history branch is most critical ( + 26 % MAE relative increase), followed by infrastructure + policy. This aligns with diffusion theory: historical momentum drives baseline uptake, while policy shocks modulate the rate of change. Eliminating time-step attention or replacing branch-level attention with simple concatenation reduces accuracy by 12–14% (MAPE). Attention thus acts as a relevance filter, suppressing noisy weeks and dynamically re-weighting domains during exogenous shocks (e.g., oil-price spikes). When all exogenous variables are removed, the model collapses to a univariate EV-history forecaster and loses 0.071 in R 2 . Therefore, macro-economic and infrastructure signals are indispensable for long-horizon accuracy. A single-branch LSTM fed with concatenated inputs performs noticeably worse, underscoring the benefit of domain specialization followed by learned fusion. Equal-weight fusion also underperforms, showing that data-driven branch weighting is preferable to ad hoc averages.
This ablation analysis demonstrates that each architectural component and feature family plays a non-trivial role in overall performance, validating the hierarchical design choices.

8. Conclusions

In this study we presented a novel multi-branch LSTM with hierarchical attention for electric vehicle adoption forecasting. Extensive experiments show that the model surpasses both classical techniques (e.g., ARIMA) and modern neural baselines (Vanilla LSTM, CNN-LSTM, Transformer) on RMSE and MAE while remaining compact. The dual-stage attention mechanism provides transparent feature- and domain-level importance scores, turning what is often a “black box” into an interpretable decision aid. Because the model highlights the variables that drive future uptake, policy makers can target incentives more precisely and manufacturers can align production with high-impact market signals, reducing both fiscal waste and supply-chain risk. Future extensions will ingest richer external data streams and add probabilistic heads to express forecast uncertainty, as well as explore advanced explainability tools to further illuminate the model’s reasoning. Taken together, the proposed architecture offers a performant, transparent, and actionable forecasting tool for stakeholders navigating the rapidly evolving EV landscape.

Author Contributions

M.M.R.: conceptualization, methodology, writing—original draft, investigation, formal analysis, data curation. M.R.I.: data curation, validation, writing—review and editing. M.M.T.G.M.: software, validation, visualization, writing—review and editing. M.M.A.: methodology, visualization, writing—review and editing. I.R.N.: investigation, validation, supervision, writing—review and editing. M.M.R.B.: resources, data curation, validation. K.K.B.: formal analysis, supervision, project administration. J.C.B.: writing—review and editing, methodology, validation. All authors have read and agreed to the published version of the manuscript.

Funding

This research received no external funding.

Data Availability Statement

The data supporting the findings of this study are publicly available from the International Energy Agency (IEA). The dataset can be accessed at: https://www.iea.org/energy-system/transport/electric-vehicles (accessed on 23 March 2025).

Acknowledgments

The authors would like to thank Westcliff University and California State University Los Angeles for providing infrastructure for this research. During the preparation of this manuscript, the authors used OpenAI’s ChatGPT-4o and Google’s Gemini for assistance with writing, rewording, and improving the clarity of technical descriptions. Grammarly was also used for grammar correction and style refinement. The authors have reviewed and edited all AI-assisted outputs and take full responsibility for the content of this publication.

Conflicts of Interest

The authors declare no conflicts of interest.

References

  1. International Energy Agency. Electric Vehicles. 2024. Available online: https://www.iea.org/energy-system/transport/electric-vehicles (accessed on 23 March 2025).
  2. Yang, Y.; Jin, M.; Wen, H.; Zhang, C.; Liang, Y.; Ma, L.; Wang, Y.; Liu, C.; Yang, B.; Xu, Z.; et al. A survey on diffusion models for time series and spatio-temporal data. arXiv 2024, arXiv:2404.18886. [Google Scholar] [CrossRef]
  3. Zhang, C.; Schmöcker, J.D.; Trépanier, M. Carsharing adoption dynamics considering service type and area expansions with insights from a Montreal case study. Transp. Res. Part C Emerg. Technol. 2024, 167, 104810. [Google Scholar] [CrossRef]
  4. Dhankhar, S.; Dhankhar, N.; Sandhu, V.; Mehla, S. Forecasting electric vehicle sales with arima and exponential smoothing method: The case of india. Transp. Dev. Econ. 2024, 10, 32. [Google Scholar] [CrossRef]
  5. Zhang, Y.; Zhong, M.; Geng, N.; Jiang, Y. Forecasting electric vehicles sales with univariate and multivariate time series models: The case of China. PLoS ONE 2017, 12, e0176729. [Google Scholar] [CrossRef]
  6. Yi, Z.; Liu, X.C.; Wei, R.; Chen, X.; Dai, J. Electric vehicle charging demand forecasting using deep learning model. J. Intell. Transp. Syst. 2022, 26, 690–703. [Google Scholar] [CrossRef]
  7. Yaghoubi, E.; Yaghoubi, E.; Khamees, A.; Razmi, D.; Lu, T. A systematic review and meta-analysis of machine learning, deep learning, and ensemble learning approaches in predicting EV charging behavior. Eng. Appl. Artif. Intell. 2024, 135, 108789. [Google Scholar] [CrossRef]
  8. Bampos, Z.N.; Laitsos, V.M.; Afentoulis, K.D.; Vagropoulos, S.I.; Biskas, P.N. Electric vehicles load forecasting for day-ahead market participation using machine and deep learning methods. Appl. Energy 2024, 360, 122801. [Google Scholar] [CrossRef]
  9. Zeng, A.; Chen, M.; Zhang, L.; Xu, Q. Are transformers effective for time series forecasting? In Proceedings of the AAAI Conference on Artificial Intelligence, Washington, DC, USA, 7–14 February 2023; Volume 37, pp. 11121–11128. [Google Scholar]
  10. Giuliari, F.; Hasan, I.; Cristani, M.; Galasso, F. Transformer networks for trajectory forecasting. In Proceedings of the 2020 25th International Conference on Pattern Recognition (ICPR), Milan, Italy, 10–15 January 2021; IEEE: Piscataway, NJ, USA, 2021; pp. 10335–10342. [Google Scholar]
  11. Mosca, E.; Szigeti, F.; Tragianni, S.; Gallagher, D.; Groh, G. SHAP-based explanation methods: A review for NLP interpretability. In Proceedings of the 29th International Conference on Computational Linguistics, Gyeongju, Republic of Korea, 12–17 October 2022; pp. 4593–4603. [Google Scholar]
  12. Garreau, D.; Luxburg, U. Explaining the explainer: A first theoretical analysis of LIME. In Proceedings of the International Conference on Artificial Intelligence and Statistics, Online, 26–28 August 2020; PMLR: New York, NY, USA, 2020; pp. 1287–1296. [Google Scholar]
  13. Zhang, W.; Valencia, A.; Chang, N.B. Synergistic integration between machine learning and agent-based modeling: A multidisciplinary review. IEEE Trans. Neural Netw. Learn. Syst. 2021, 34, 2170–2190. [Google Scholar] [CrossRef]
  14. Peng, Z.; Yu, Z.; Wang, H.; Yang, S. Research on industrialization of electric vehicles with its demand forecast using exponential smoothing method. J. Ind. Eng. Manag. (JIEM) 2015, 8, 365–382. [Google Scholar] [CrossRef]
  15. Duan, Z.; Gutierrez, B.; Wang, L. Forecasting plug-in electric vehicle sales and the diurnal recharging load curve. IEEE Trans. Smart Grid 2014, 5, 527–535. [Google Scholar] [CrossRef]
  16. Chen, G.; Glen, D.R.; Saad, Z.S.; Hamilton, J.P.; Thomason, M.E.; Gotlib, I.H.; Cox, R.W. Vector autoregression, structural equation modeling, and their synthesis in neuroimaging data analysis. Comput. Biol. Med. 2011, 41, 1142–1155. [Google Scholar] [CrossRef]
  17. Domarchi, C.; Cherchi, E. Electric vehicle forecasts: A review of models and methods including diffusion and substitution effects. Transp. Rev. 2023, 43, 1118–1143. [Google Scholar] [CrossRef]
  18. Rasheed, I.; Hu, F.; Zhang, L. Deep reinforcement learning approach for autonomous vehicle systems for maintaining security and safety using LSTM-GAN. Veh. Commun. 2020, 26, 100266. [Google Scholar] [CrossRef]
  19. Simsek, A.I.; Koç, E.; Desticioglu Tasdemir, B.; Aksöz, A.; Turkoglu, M.; Sengur, A. Deep Learning Forecasting Model for Market Demand of Electric Vehicles. Appl. Sci. 2024, 14, 10974. [Google Scholar] [CrossRef]
  20. Liu, T.; Meidani, H. End-to-end heterogeneous graph neural networks for traffic assignment. Transp. Res. Part C Emerg. Technol. 2024, 165, 104695. [Google Scholar] [CrossRef]
  21. Liu, T.; Meidani, H. Multi-Class Traffic Assignment using Multi-View Heterogeneous Graph Attention Networks. arXiv 2025, arXiv:2501.09117. [Google Scholar] [CrossRef]
  22. Zhou, H.; Dang, Y.; Yang, Y.; Wang, J.; Yang, S. An optimized nonlinear time-varying grey Bernoulli model and its application in forecasting the stock and sales of electric vehicles. Energy 2023, 263, 125871. [Google Scholar] [CrossRef]
  23. Qu, F.; Wang, Y.T.; Hou, W.H.; Zhou, X.Y.; Wang, X.K.; Li, J.B.; Wang, J.Q. Forecasting of automobile sales based on support vector regression optimized by the grey wolf optimizer algorithm. Mathematics 2022, 10, 2234. [Google Scholar] [CrossRef]
  24. Ma, J.; Yu, J.; Gong, Z. EV Regional Market Sales Forecast Based On GABP Neural Network. In Proceedings of the IOP Conference Series: Earth and Environmental Science; IOP Publishing: Bristol, UK, 2019; Volume 252, p. 032098. [Google Scholar]
  25. Zhou, H.; Zhang, S.; Peng, J.; Zhang, S.; Li, J.; Xiong, H.; Zhang, W. Informer: Beyond efficient transformer for long sequence time-series forecasting. In Proceedings of the AAAI Conference on Artificial Intelligence, Virtual, 2–9 February 2021; Volume 35, pp. 11106–11115. [Google Scholar]
  26. Mehdizadeh, M.; Nordfjaern, T.; Klöckner, C.A. A systematic review of the agent-based modelling/simulation paradigm in mobility transition. Technol. Forecast. Soc. Change 2022, 184, 122011. [Google Scholar] [CrossRef]
  27. Gneiting, T.; Katzfuss, M. Probabilistic forecasting. Annu. Rev. Stat. Its Appl. 2014, 1, 125–151. [Google Scholar] [CrossRef]
  28. Leutbecher, M.; Palmer, T.N. Ensemble forecasting. J. Comput. Phys. 2008, 227, 3515–3539. [Google Scholar] [CrossRef]
  29. Chatzimparmpas, A.; Martins, R.M.; Kucher, K.; Kerren, A. StackGenVis: Alignment of data, algorithms, and models for stacking ensemble learning using performance metrics. IEEE Trans. Vis. Comput. Graph. 2020, 27, 1547–1557. [Google Scholar] [CrossRef]
  30. Rolnick, D.; Donti, P.L.; Kaack, L.H.; Kochanski, K.; Lacoste, A.; Sankaran, K.; Ross, A.S.; Milojevic-Dupont, N.; Jaques, N.; Waldman-Brown, A.; et al. Tackling climate change with machine learning. ACM Comput. Surv. (CSUR) 2022, 55, 1–96. [Google Scholar] [CrossRef]
  31. Zheng, H.; Yuan, J.; Chen, L. Short-term load forecasting using EMD-LSTM neural networks with a Xgboost algorithm for feature importance evaluation. Energies 2017, 10, 1168. [Google Scholar] [CrossRef]
  32. Liao, X.; Cao, N.; Li, M.; Kang, X. Research on short-term load forecasting using XGBoost based on similar days. In Proceedings of the 2019 International Conference on Intelligent Transportation, Big Data & Smart City (ICITBS), Changsha, China, 12–13 January 2019; IEEE: Piscataway, NJ, USA, 2019; pp. 675–678. [Google Scholar]
  33. Paudel, D.; De Wit, A.; Boogaard, H.; Marcos, D.; Osinga, S.; Athanasiadis, I.N. Interpretability of deep learning models for crop yield forecasting. Comput. Electron. Agric. 2023, 206, 107663. [Google Scholar] [CrossRef]
  34. Hu, T.; Liu, K.; Ma, H. Probabilistic electric vehicle charging demand forecast based on deep learning and machine theory of mind. In Proceedings of the 2021 IEEE Transportation Electrification Conference & Expo (ITEC), Chicago, IL, USA, 21–25 June 2021; IEEE: Piscataway, NJ, USA, 2021; pp. 795–799. [Google Scholar]
  35. Rahman, M.W.; Vogl, G.W.; Jia, X.; Qu, Y. Physics-Informed Multi-Task Learning for Material Removal Rate Prediction in Semiconductor Chemical Mechanical Planarization. In Proceedings of the 2024 IEEE International Conference on Prognostics and Health Management (ICPHM), Spokane, WA, USA, 17–19 June 2024; IEEE: Piscataway, NJ, USA, 2024; pp. 385–392. [Google Scholar]
  36. Rahman, M.W.; Zhao, B.; Pan, S.; Qu, Y. Microstructure-informed machine learning for understanding corrosion resistance in structural alloys through fusion with experimental studies. Comput. Mater. Sci. 2025, 248, 113624. [Google Scholar] [CrossRef]
  37. Bahdanau, D.; Serdyuk, D.; Brakel, P.; Ke, N.R.; Chorowski, J.; Courville, A.; Bengio, Y. Task Loss Estimation for Sequence Prediction. arXiv 2015, arXiv:1511.06456. [Google Scholar]
  38. International Energy Agency. Global EV Outlook 2024: Global EV Data. 2024. Available online: https://www.iea.org/reports/global-ev-outlook-2024 (accessed on 24 March 2025).
  39. World Bank. GDP (Current US$) [Indicator: NY.GDP.MKTP.CD]. 2021. Available online: https://data.worldbank.org/indicator/NY.GDP.MKTP.CD (accessed on 3 April 2025).
  40. Sikes, K.; Cox, B. Factors Influencing the Adoption of Electric Vehicles: A Review. J. Clean. Prod. 2022, 346, 131123. [Google Scholar] [CrossRef]
  41. Zhuk, P.; Kraus, M. Macroeconomic Determinants of Electric Vehicle Market Penetration. Energy Econ. 2023, 120, 106963. [Google Scholar] [CrossRef]
  42. World Bank. World Development Indicators. 2024. Available online: https://databank.worldbank.org/source/world-development-indicators (accessed on 6 July 2025).
  43. Federal Reserve Bank of St. Louis. Europe Brent Spot Price FOB (DCOILBRENTEU). 2024. Available online: https://fred.stlouisfed.org/series/DCOILBRENTEU (accessed on 6 July 2025).
  44. U.S. Energy Information Administration. Monthly Electric Power Industry Report—Retail Electricity Prices. 2024. Available online: https://www.eia.gov/electricity/data.php (accessed on 6 July 2025).
  45. International Council on Clean Transportation. Global EV Incentive Index. 2023. Available online: https://theicct.org/tools-for-policy-and-research/ (accessed on 6 July 2025).
  46. OECD Centre for Tax Policy and Administration. OECD Taxing Energy Use 2024 Database. 2024. Available online: https://www.oecd.org/tax/tax-policy/taxing-energy-use.htm (accessed on 6 July 2025).
  47. Gong, Y.; Wu, H.; Zhou, J.; Zhang, Y.; Zhang, L. Hybrid Multi-Branch Attention–CNN–BiLSTM Forecast Model for Reservoir Capacities of Pumped Storage Hydropower Plant. Energies 2025, 18, 3057. [Google Scholar] [CrossRef]
  48. Zhang, J.; Tang, W.; Liu, C. A Systematic Review of Transformer-Based Long-Term Series Forecasting. Artif. Intell. Rev. 2025, 58, 80. [Google Scholar] [CrossRef]
  49. Yin, Y.; Li, J.; Shen, Q. Attention-Based Models for Multivariate Time Series Forecasting. Sensors 2023, 23, 987. [Google Scholar] [CrossRef]
  50. Liu, Y.; Zhang, F.; Wang, S. Comparative evaluation of LSTM, CNN, and ConvLSTM for hourly streamflow forecasting. J. Hydrol. 2023, 626, 129073. [Google Scholar] [CrossRef]
  51. Rajalakshmi, R.; Gupta, S. Hybrid CNN-LSTM for Traffic Flow Forecasting. In Proceedings of the 2nd International Conference on Artificial Intelligence: Advances and Applications, Roorkee, India, 2–3 June 2022. [Google Scholar] [CrossRef]
Figure 1. Annual electric car sales by major regions for 2012–2024 [1].
Wevj 16 00432 g001
Figure 2. Average EV sales share by region/country [1].
Wevj 16 00432 g002
Figure 3. Distribution of battery-electric and plug-in hybrid vehicles as a share of the total passenger car fleet across major markets for 2012–2024. Boxes denote the inter-quartile range and median; whiskers extend to 1.5 × IQR, and points indicate outliers [1].
Wevj 16 00432 g003
Figure 4. Feature importance scores in the dataset [1].
Wevj 16 00432 g004
Figure 5. Proposed multi-branch LSTM with attention architecture. Each branch is a two-layer LSTM ( h = 64 units per layer) that outputs a hidden vector h t ( i ) R 64 . Keys, queries, and values are projected to d k = d q = d v = 64; the concatenated context vector ( R 192 ) feeds a 2-layer dense head ( 192 64 1 ).
Wevj 16 00432 g005
Figure 6. EV sales trajectory in Australia from 2011 to 2023, split into training data (2011–2020; blue) and testing data (2021–2023; green).
Wevj 16 00432 g006
Figure 7. Model performance on the test data.
Wevj 16 00432 g007
Figure 8. Loss curve comparison for different architectures.
Wevj 16 00432 g008
Table 2. Layer-wise specification of the proposed three-branch LSTM-with-attention architecture. d 1 , d 2 , d 3 are the feature counts for the EV history, infrastructure, and macro-economic branches, respectively; T is the sequence length.
StageComponentInput DimHidden/UnitsDropoutOutput Dim
Branch 1EV-history LSTM (2×) d 1 × T 64, 640.264
Branch 2Infrastructure LSTM (2×) d 2 × T 64, 640.264
Branch 3Macro-economic LSTM (2×) d 3 × T 64, 640.264
AttentionScaled dot product64 d k = 6464
FusionConcat ( h ( 1 ) , h ( 2 ) , h ( 3 ) )64 + 64 + 64192
Dense-1FC + ReLU1926464
Dense-2FC (linear)6411
Table 3. Comparison of deterministic forecasting models for EV adoption. All models are trained on identical train–validation splits (weekly cadence, sequence length = 52) and evaluated on the 2021–2023 hold-out set. Boldface indicates best performance in each column.
ModelRMSEMAE R 2 MAPE (%)Params (M)
Vanilla LSTM0.0650.0500.859.02.5
Single-Branch LSTM0.0660.0510.849.22.0
ARIMA0.0700.0550.8210.5
Feed-Forward Neural Network0.0670.0510.849.41.8
CNN-LSTM Hybrid0.0600.0480.878.83.0
Transformer (6-layer, d model = 128 )0.0580.0460.888.54.5
GRU + Attention0.0570.0450.898.33.2
Temporal Convolutional Network (TCN)0.0560.0440.898.23.0
Neural-ODE0.0590.0470.888.63.5
Multi-Branch LSTM + Attn (proposed)0.0520.0410.927.84.0
Table 4. Hyperparameter settings for multi-branch LSTM with attention (proposed).
SettingHidden DimLayersAttentionLearning RateBatch SizeDropoutEpochsRMSEComments
A642Bahdanau0.001320.110012.45
B1282Bahdanau0.001640.130010.12
C1283Self-Attn0.0005640.25009.32
D2563Self-Attn0.0005640.27008.74
E2564Self-Attn0.00011280.27009.05
F
(Optimal)
2564Self-Attn0.0005640.310008.50Best
performance
Table 5. Impact of ablating individual components (↓ indicates worse performance relative to the full model).
VariantRMSEMAEMAPE (%) Δ R 2
Full model (baseline)0.0520.0417.8
Branch removals
    w/o infrastructure + policy branch0.0620.0508.9↓0.040
    w/o macro-economy branch0.0600.0488.6↓0.035
    w/o EV-history branch0.0650.0539.5↓0.063
Attention ablations
    No time-step attention (mean-pool)0.0580.0468.4↓0.028
    No branch-level attention0.0570.0458.3↓0.024
Feature ablations
    No lag + rolling features0.0560.0448.2↓0.019
    All external variables removed0.0680.0559.8↓0.071
Structural ablations
    Single-branch LSTM (concat inputs)0.0660.0519.3↓0.057
    Equal-weight fusion (no learning)0.0590.0478.5↓0.031
Disclaimer/Publisher’s Note: The statements, opinions and data contained in all publications are solely those of the individual author(s) and contributor(s) and not of MDPI and/or the editor(s). MDPI and/or the editor(s) disclaim responsibility for any injury to people or property resulting from any ideas, methods, instructions or products referred to in the content.

