Article

The Environmental and Grid Impact of Boda Boda Electrification in Nairobi, Kenya

by
Halloran Stratford
1 and
Marthinus Johannes Booysen
1,2,*
1
Department of Electrical and Electronic Engineering, Stellenbosch University, Stellenbosch 7600, South Africa
2
Department of Industrial Engineering, Stellenbosch University, Stellenbosch 7600, South Africa
*
Author to whom correspondence should be addressed.
World Electr. Veh. J. 2025, 16(8), 427; https://doi.org/10.3390/wevj16080427 (registering DOI)
Submission received: 27 June 2025 / Revised: 23 July 2025 / Accepted: 29 July 2025 / Published: 31 July 2025

Abstract

Boda boda motorbike taxis are a primary mode of transport in Nairobi, Kenya, and a major source of urban air pollution. This study investigates the environmental and electrical grid impacts of electrifying Nairobi’s boda boda fleet. Using real-world tracking data from 118 motorbikes, we simulated the effects of a full-scale transition from internal combustion engine (ICE) vehicles to electric motorbikes. We analysed various scenarios, including different battery charging strategies (swapping and home charging), motor efficiencies, battery capacities, charging rates, and the potential for solar power offsetting. The results indicate that electrification could reduce daily CO 2 emissions by approximately 85% and eliminate tailpipe particulate matter emissions. However, transitioning the entire country’s fleet would increase the national daily energy demand by up to 6.85 GWh and could introduce peak grid loads as high as 2.40 GW, depending on the charging approach and vehicle efficiency. Battery swapping was found to distribute the grid load more evenly and better complement solar power integration compared to home charging, which concentrates demand in the evening. This research provides a scalable, data-driven framework for policymakers to assess the impacts of transport electrification in similar urban contexts, highlighting the critical trade-offs between environmental benefits and grid infrastructure requirements.

1. Introduction

Across sub-Saharan African countries, motorbike taxis, called “boda bodas”, constitute a prominent mode of transport and are predominantly petroleum-fuelled. The global drive to electrify transport raises a key consideration given the region’s fragile electricity networks: how will electrification of this mode affect emissions and electricity networks? We answer this question for Nairobi, Kenya.
A key driver of global transport electrification is the reduction in CO 2 emissions. An additional consideration in sub-Saharan Africa is rampant pollution in its cities. Boda bodas dominate this sector, providing more than 35% of passengers, with 2.2 million registered in Kenya as of 2024 [1,2]. These vehicles are well suited to rapid electrification due to their simplicity and low cost relative to larger vehicles, further boosted by viable battery swapping technology.
This grid system yields a low carbon emission factor of 0.226 kg CO 2 /kWh [3] and features a diverse combination of electricity generation approaches, which creates a unique distribution of energy supply throughout a 24 h period.
The urgent need for transport electrification in sub-Saharan Africa is underscored by the severe health and environmental impacts of current transport systems. Traffic-related air pollution contributes significantly to mortality across the region, with PM 2.5 concentrations in African cities frequently exceeding WHO guidelines and reaching up to 80 μg/m3, driven substantially by vehicle emissions [4]. In 2019, air pollution was responsible for 1.1 million premature deaths across Africa, with children facing heightened risks of acute lower respiratory infections due to particulate matter exposure [5]. According to the Clean Air Fund, 40% of PM2.5 emissions—particulate matter harmful to human health—in Nairobi stem from the transport sector [6]. The transport sector compounds these challenges by accounting for approximately 26% of Africa’s total fossil fuel emissions [7].
However, the transition to electric transport faces significant infrastructure challenges, as countries in sub-Saharan Africa have fragile electrical grids that could be substantially burdened by a sizeable fleet of electric vehicles [8]. Kenya exemplifies this vulnerability, with an ageing grid infrastructure that led to a massive blackout in August 2024, plunging Nairobi and six other regions into darkness and highlighting the national grid’s fragility [9].
From an emissions perspective, electrifying motorbike fleets is appealing, but the impact on the electrical grid and infrastructure planning cannot be overlooked. Kenya’s grid stands out among African countries for its low-carbon profile. As of 2024, it generates over 11 TWh annually, with only about 1 TWh sourced from fossil fuels [10].
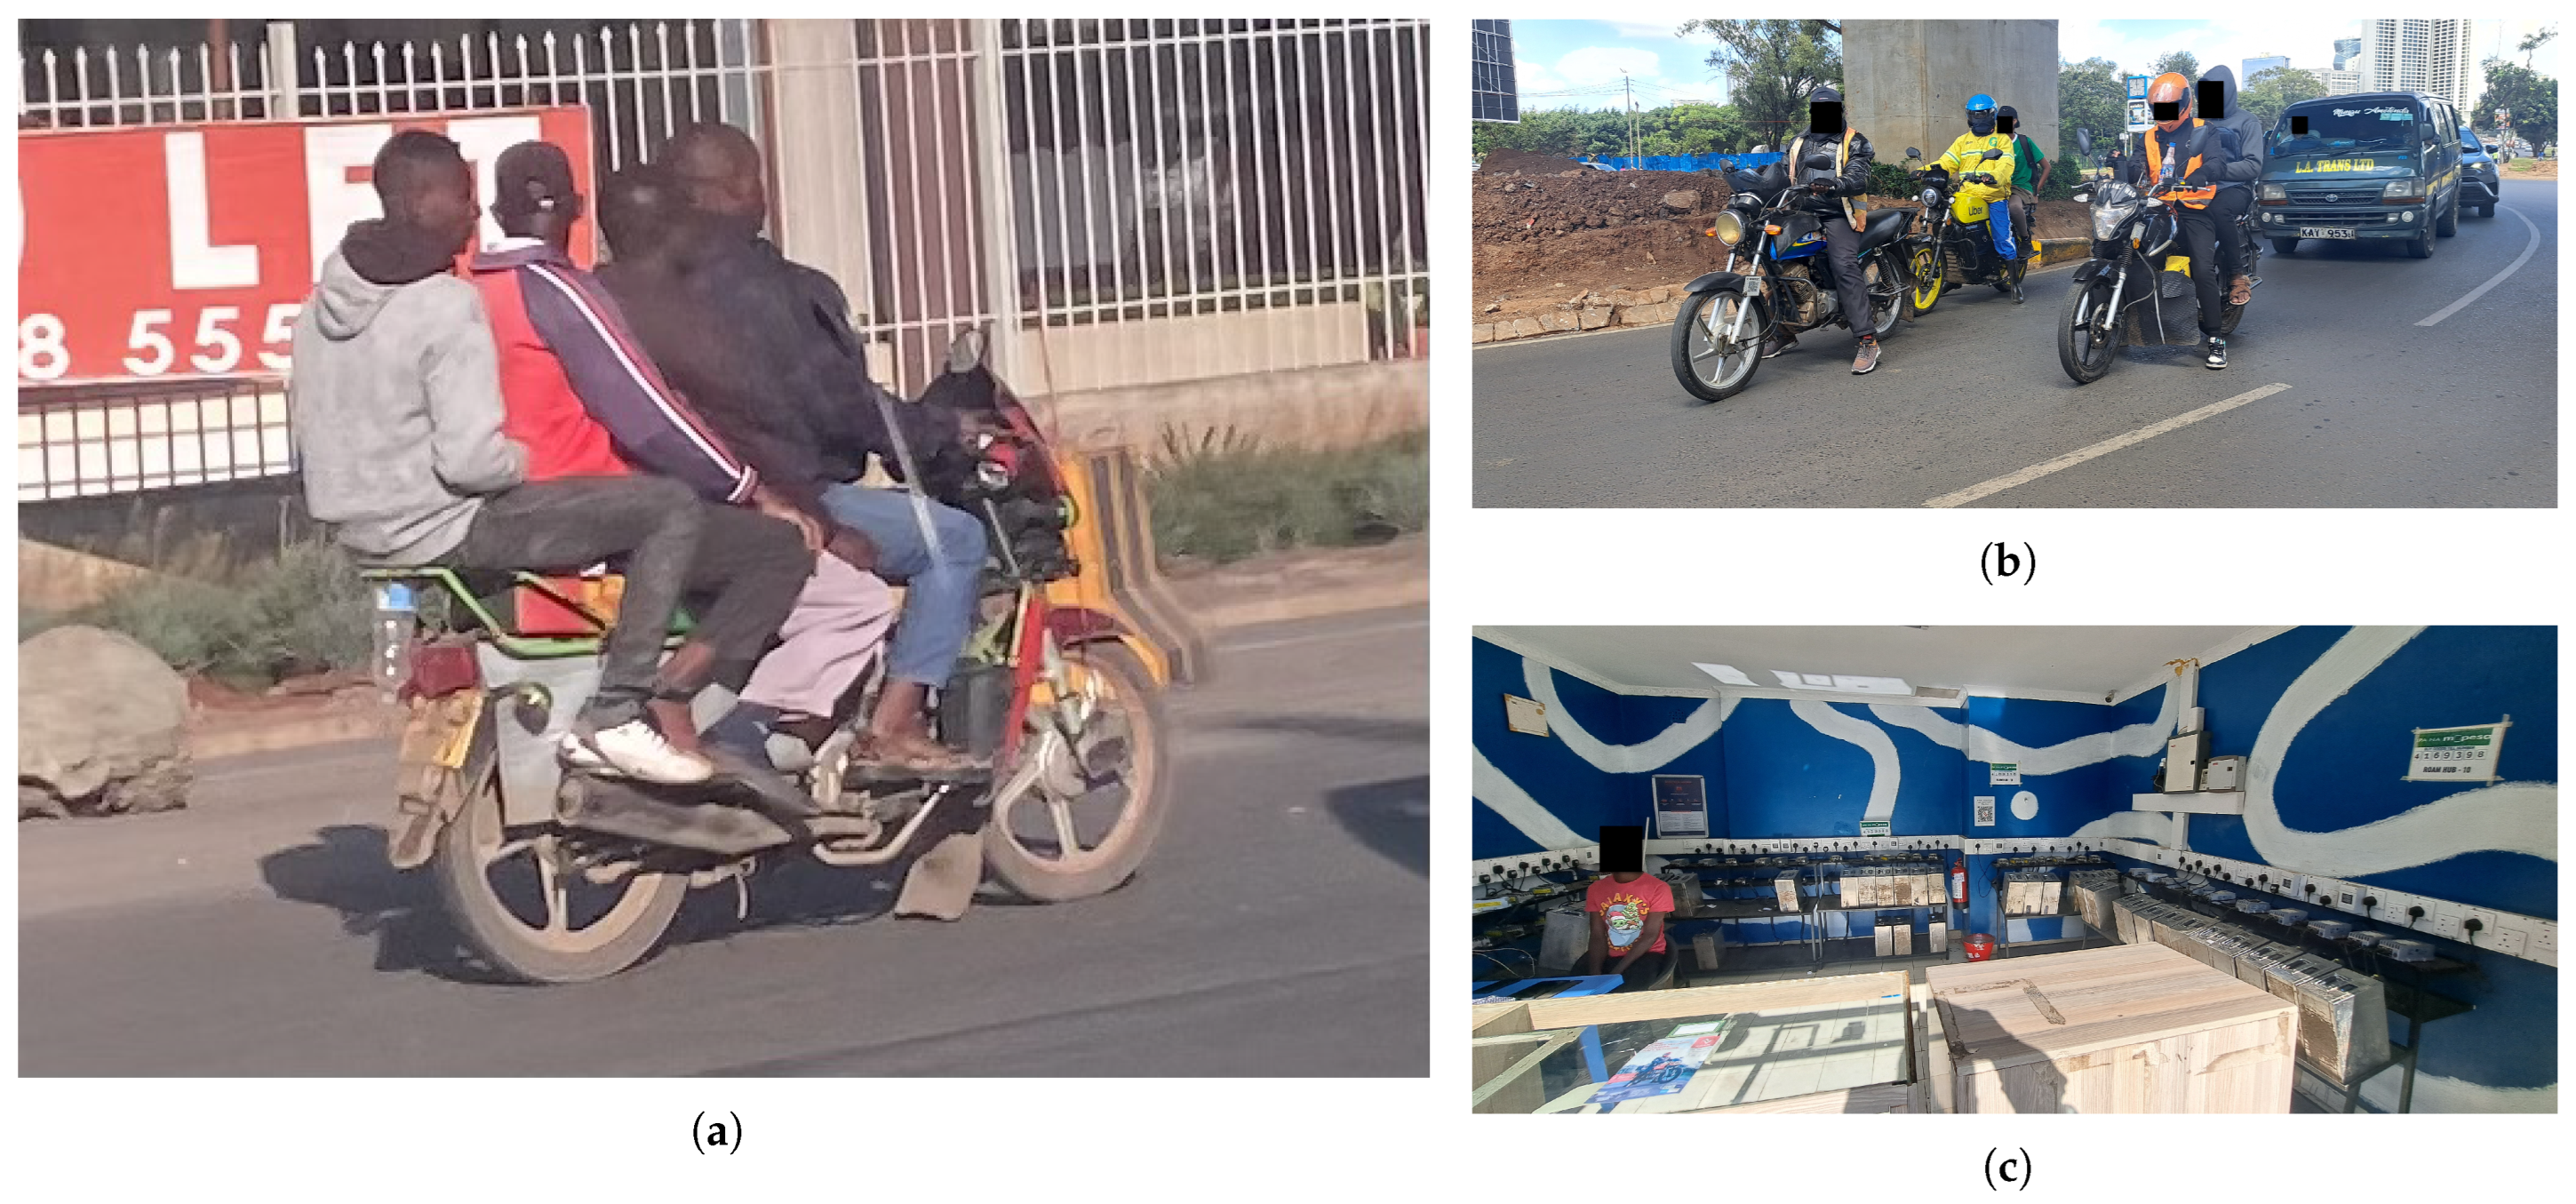
Research on transport electrification in the region has begun to address these challenges, with studies on minibus taxi electrification identifying the dual challenges of maintaining service demand while managing grid impact in already fragile networks [11]. Current research in Nairobi primarily relies on rider surveys for data [12]. While insightful, this paper seeks to validate these findings using real-world tracking data from boda bodas in Nairobi. Figure 1a shows the ubiquitous boda bodas transporting passengers in Nairobi, Kenya.
For motorbike taxis specifically, pioneering work by the University of Michigan in Kampala, Uganda, used real-world tracking data to simulate emission reductions for hypothetical electric motorbike fleets [13], establishing a valuable framework for emissions analysis. However, despite this foundational research, a comprehensive analysis of both the environmental benefits and grid infrastructure impacts of motorbike taxi electrification has not yet been conducted for Nairobi, representing a critical gap in understanding the scalability and feasibility of transport electrification in Kenya’s capital city.

Contribution

In the context described above, this article addresses the research gap by quantifying the CO 2 and PM 10 (including PM 2.5 ) emissions that could be displaced by electrifying boda bodas, and the resulting impact on the electricity network is assessed. Given the unique mobility patterns and battery models employed, different charging strategies are assessed. The results are assessed for different motor efficiencies, battery capacities, and charging rates. Given the region’s sunny climate, we also evaluate the potential for solar offsetting, which could facilitate a smoother and greener transition. Although the results are pertinent to Nairobi, the method provides a transferable framework for the easy replication of these results in other large cities worldwide, using existing internal combustion engine (ICE) motorbike tracking data to model the effects of electrification.
While this study focuses on Nairobi, it is important to acknowledge that its findings may not scale linearly to other cities in sub-Saharan Africa. Nairobi’s relatively low-carbon and diverse electricity grid, driven largely by geothermal energy, offers more favourable conditions for transport electrification than fossil-fuel-dependent grids in cities like Lagos or Johannesburg. Additionally, Nairobi’s relatively mild climate and growing battery-swapping ecosystem further differentiate its electrification potential from cities such as Kampala, where early pilots of electric motorbikes face different barriers. Urban density, cultural perceptions, informal transport structures, and access to charging infrastructure vary significantly across the region. Therefore, while the framework developed here is transferable, implementation strategies must be adapted to local grid capacity, solar irradiance variability, and institutional readiness in each city.

2. Methodology

2.1. Estimating Emissions

For simplicity, energy efficiency was assumed to be constant, and subsequent estimates were consequently based solely on the mileage covered by the motorbikes. The efficiencies were based on the specifications of comparable ICE (Figure 2a) and electric (Figure 2b) motorbike models.
The specifications, shown in Table 1, provide the basis for the efficiency values used in this study.
Using these specifications, the daily mileage data were used to estimate the fuel or energy consumed by the motorbikes.
Estimating the total fuel/energy consumed by the ICE versus the electric motorbike fleets allows for the calculation of harmful emissions. The CO 2 emissions depend on the volume of petroleum burned by ICE vehicles and the kilowatt-hours of electricity consumed by EVs from the electricity grid. According to the Carbon Dioxide Emissions Coefficients from the U.S. Energy Information Administration, the carbon emissions per litre of petroleum burned equate to 2.3 kg CO 2 /L [16]. According to the Grid Emission Factor for the Republic of Kenya, the grid emission factor for the Kenyan grid is 0.226 kg CO 2 /kWh [3].
The CO 2 emissions per kilometre for an internal combustion engine (ICE) vehicle and an electric vehicle (EV) are calculated as follows. For ICE vehicles,
CO 2 ICE / km = 2.30 kg CO 2 / L 45.50 km / L ,
This yields CO 2 ICE / km 0.0505 kg CO 2 / km ( 50.5 g CO 2 / km ) .
For electric vehicles,
CO 2 EV / km = 0.226 kg CO 2 / kWh 28.94 km / kWh ,
This yields CO 2 EV / km 0.0078 kg CO 2 / km ( 7.8 g CO 2 / km ) .
For particulate matter ( PM 10 , including PM 2.5 ), this study compares only tailpipe emissions, as the mechanical components surrounding the powertrain are largely identical between internal combustion engine (ICE) and electric boda boda motorbikes. Under Euro 5 emission standards, tailpipe emissions from mopeds, motorbikes, tricycles, and quadricycles must not exceed 4.5 mg/km of particulate matter [17]. While this represents a conservative estimate, many older motorbikes in Nairobi likely emit higher levels due to outdated technology and poor maintenance. However, quantifying exact tailpipe PM emissions for individual motorbikes is challenging, as factors such as temperature, fuel composition, vehicle mileage, driving conditions, and road conditions significantly influence emission rates [18]. Electric motorbikes produce zero tailpipe emissions. The emission coefficients are listed in Table 2.

2.2. Electrification of the Fleet

The second part of this study focuses on the potential grid impact if the fleet in the dataset were electric and the implications of scaling this electrification. To achieve this, the trip data were analysed to understand the daily, hourly, and minute-by-minute movements of motorbikes in Nairobi.

Battery Swapping/Charging Approaches

The data were used not only to understand the distribution of daily distances travelled but also to simulate the timing of battery swaps under three different approaches:
  • Swapping only—Battery swapping at swap stations only (1 battery): This assumes that swaps can occur whenever a bike has insufficient range for its next trip and that depleted batteries are placed on charge immediately upon being swapped. On the first day, the starting battery SOC is 100%; thereafter, the battery state carries over to the next day.
  • Swapping and home charging—Battery swapping at swap stations and home charging (1 battery): This allows for all bikes to recharge their battery overnight and begin the day with full capacity while also being able to swap out depleted batteries away from home.
  • Home charging only—Home charging only (2 batteries): This allows for all bikes to recharge their batteries overnight, starting the day with full capacity. This approach assumes that the daily distance travelled does not exceed the motorbike’s total range with two batteries.
The first step in simulating a battery swap was to estimate the remaining battery range for an electric motorbike. Using the efficiency of 28.94 km/kWh from Table 1 for the electric motorbike, and carrying one battery of 3.24 kWh (80% useful storage), results in an estimated total range of 75 km. For each trip, the estimated energy consumed was calculated. From this, the bike’s remaining range was updated. When the remaining range was insufficient to complete the next trip, a battery swap was simulated. The ’empty’ battery was then swapped (with its SOC noted) and replaced by a fully charged battery, thus restoring the bike to its full range. For the swapping and home charging scenario, the simulation was further configured such that when a bike completed its last trip of the day, its battery was assumed to be removed and placed on a home charger upon arrival. The fully charged battery was then available for use at the start of the next day. These simulations generated datasets of ’charge start’ events, which included the time of day a battery began charging, its SOC at the start of charging, and, by fitting a charging profile, a projection of the time at which the battery would be fully charged.

2.3. Battery Charging

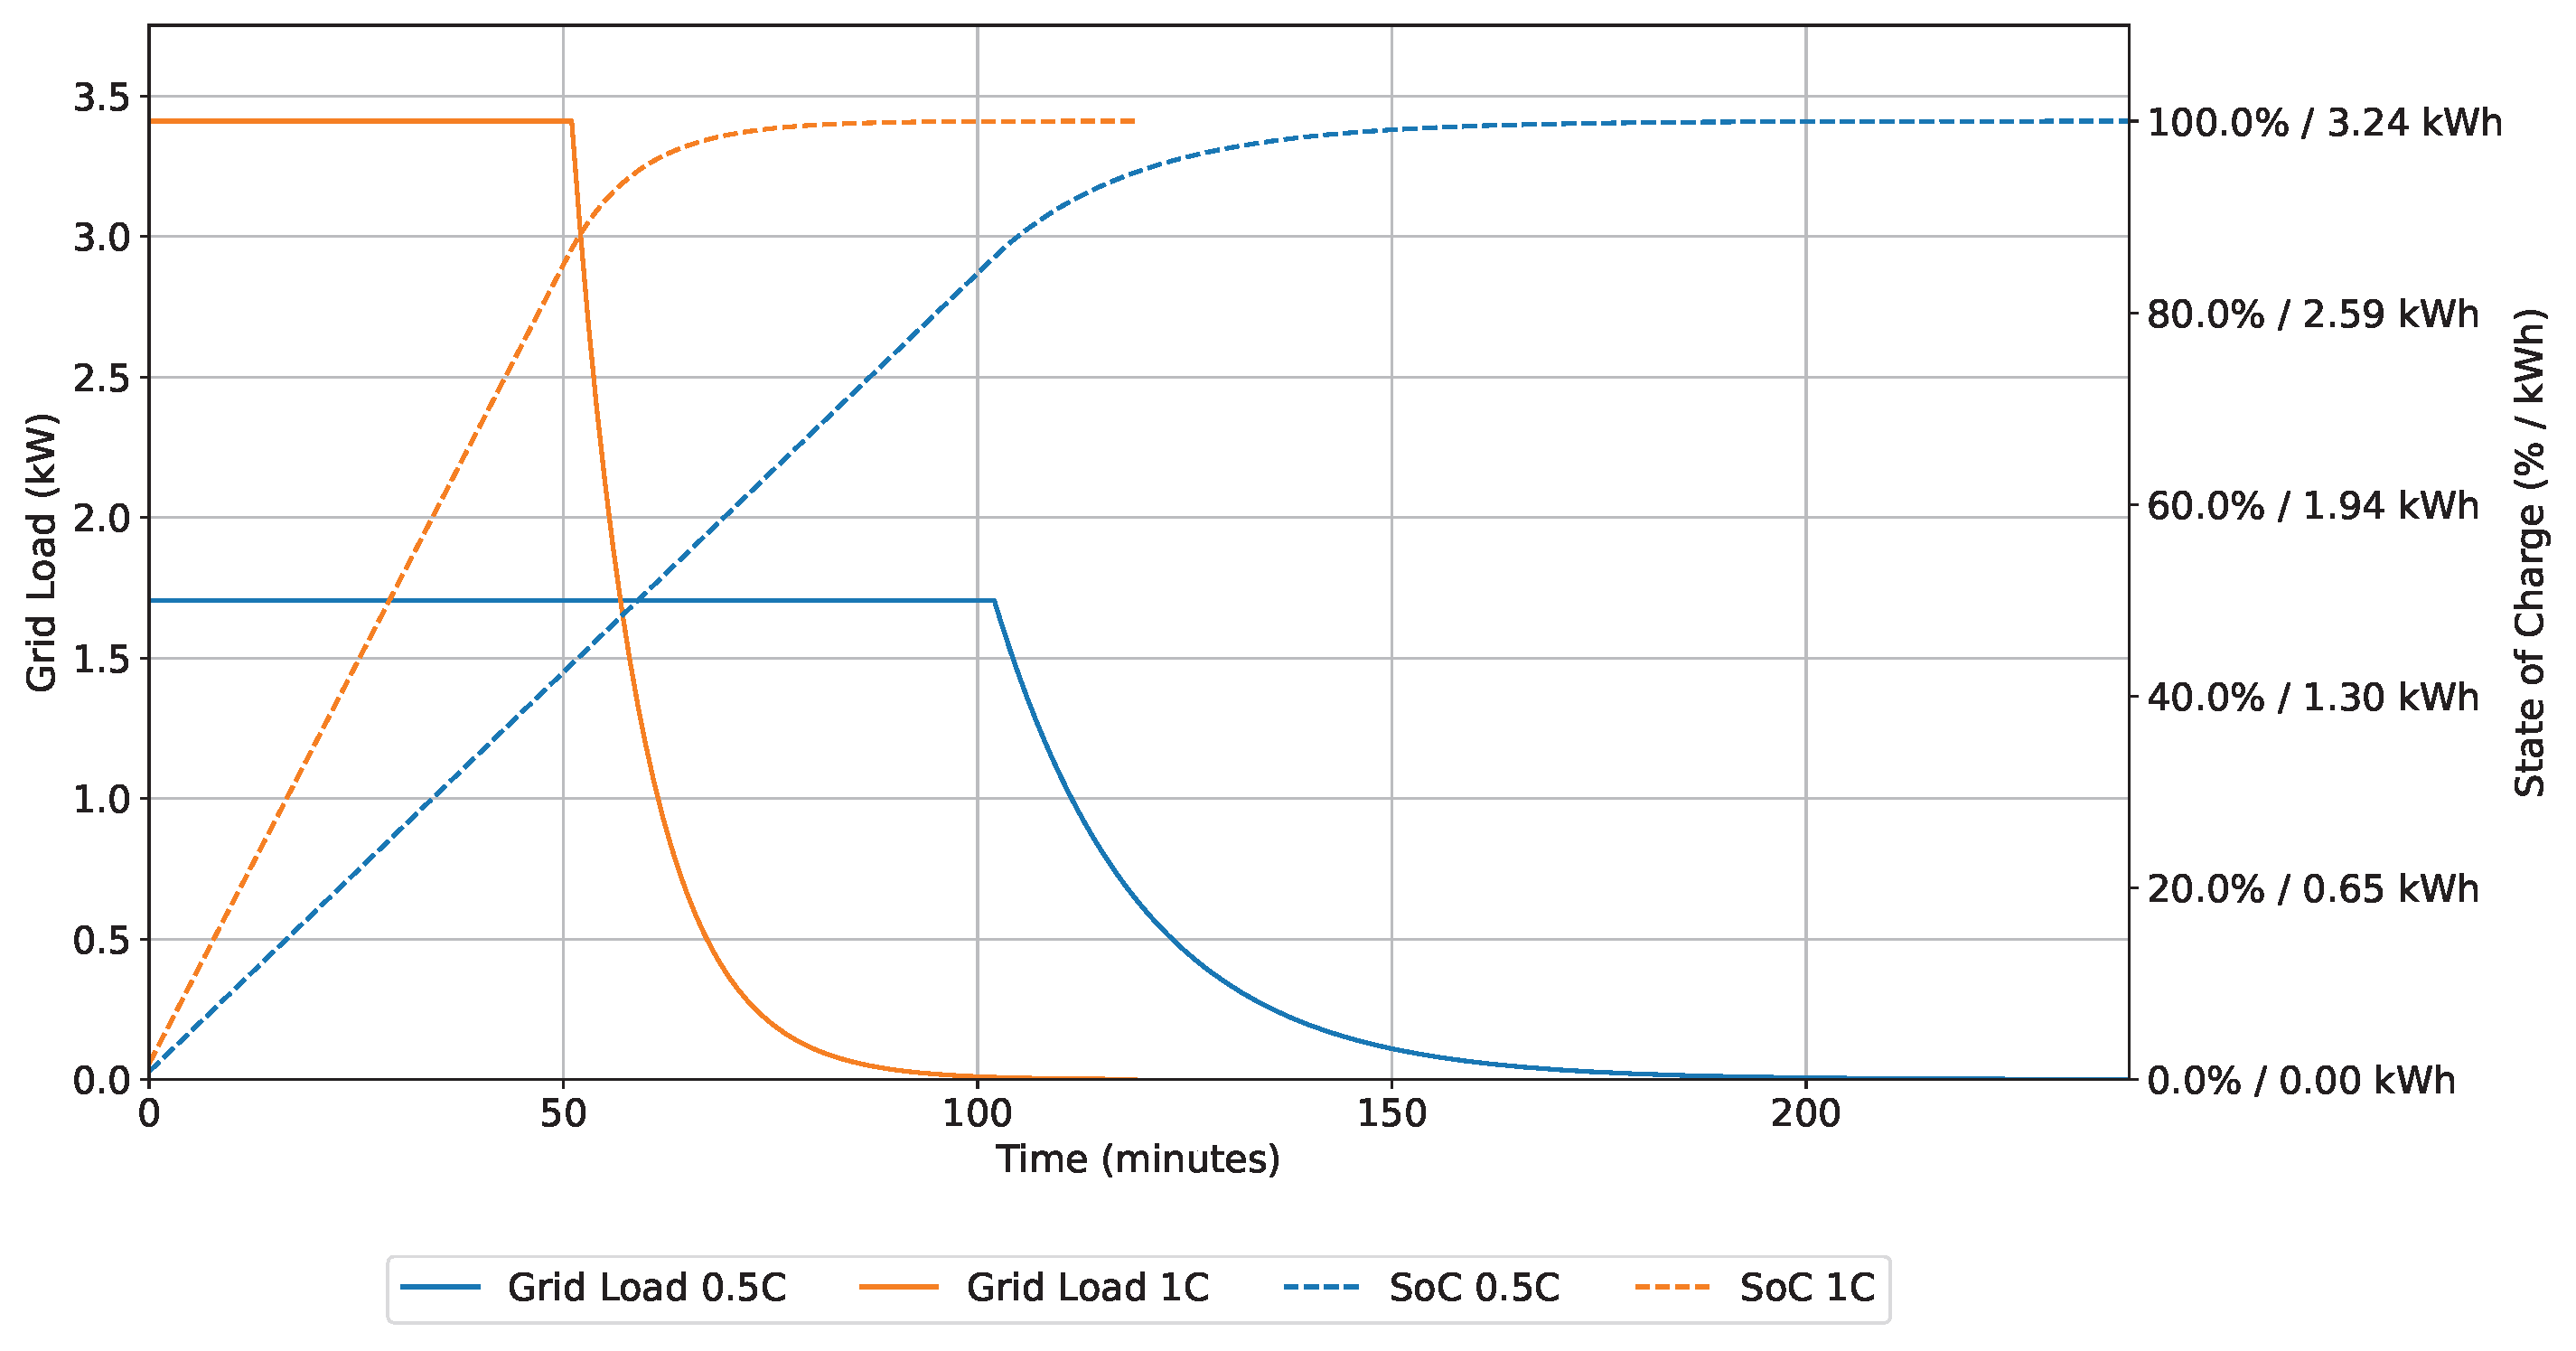
The charger specifications were configurable in the simulation. To generate the results in Section 3, a charging rate of 0.5C was used, corresponding to the charging time of 3 h and 45 min claimed by Roam Electric [15]. The effects of fast charging were also investigated using a charge rate of 1C. Figure A1 shows the SOC and grid load, adjusted by a charger efficiency of 0.95, for a single battery from 0% to 100% SOC. However, the operating range of the batteries in the simulation is between 20% and 100% SOC. The maximum amount of energy transferred in a single charge is therefore 2.592 kWh.
The charging profile follows a Constant Current–Constant Voltage (CC-CV) method [19]. The grid load function and energy function are defined in Appendix A.1. The source code to recreate the charging profiles in Figure A1 can be found in a public GitHub repository, of which version 1.0 (committed 27 May 2025) was used [20].

Simulating Grid Impact

Using the charge start data for each approach, the grid impact was simulated using a queued method. As batteries were put on charge, they remained in the charging state until reaching a full SOC, following the relevant charge profiles in Figure A1 and updating the corresponding grid load every minute. Any additional batteries put on charge during this period added to the cumulative grid load. This method ensures that the grid load dataset accurately represents all batteries actively charging at any given time, making it possible to identify the magnitude and timing of peak loads for each approach. When generating the results for Section 3, chargers were assumed to be identical at both battery swap stations and homes.

2.4. Alternative Scenarios

Further simulations with varying efficiencies, battery capacities, and charging speeds (Section 2.3) were conducted to provide references for future studies or to represent more realistic scenarios.

2.4.1. Efficiencies

The efficiency is calculated using the following formula:
efficiency ( km / kWh ) = range ( km ) battery capacity ( kWh ) × operating capacity factor
where the battery capacity is 3.24 kWh and the operating capacity factor is 0.8. The required efficiencies for different ranges are presented in Table 3. Factors such as terrain, topography, payload, and many others contribute to the achieved efficiency. The energy efficiency of electric motorcycles is subject to a variety of real-world factors, including terrain, topography, and payload. As it is challenging to model the specific contribution of each factor, this study instead evaluates the system’s sensitivity to overall efficiency variations. To achieve this, a range of efficiency scenarios were analysed to determine their subsequent impact on grid load and energy consumption.
The results of using these alternative efficiencies are displayed in Figure 5 (Section 3).

2.4.2. Increased Battery Capacity

To achieve an increased range, the battery capacity is scaled up by 20%, from 3.24 kWh to 3.888 kWh. Using a standard efficiency of 28.94 km/kWh and an operating capacity factor of 0.8, the new range is calculated as follows:
range = 28.94 km / kWh × 3.888 kWh × 0.8 90 km
This demonstrates that a 20% increase in battery capacity extends the range to 90 km while maintaining the standard efficiency. The results of this scenario are shown in Figure 5 (Section 3).

2.4.3. Solar Offsetting

The grid impact, both for the fleet and for a per-bike average, can be offset using solar power. A key goal of this study was to determine the average solar power output (in kWp) needed per bike in Nairobi to achieve a net-zero grid impact. To achieve this, solar radiation data for Nairobi (coordinates: −1.283253, 36.817245) were accessed from the National Solar Radiation Database (NSRDB) [21]. Using these data and the System Advisor Model (SAM) [22], a 1 kWp solar generation profile was simulated for the experimental time period.
The average daily energy generated by the 1 kWp plant was found to be 5.04 kWh. This value was then scaled to determine the minimum kilowatt-peak (kWp) capacity required to offset the energy consumption of the fleet, as shown in Figure 6 (Section 3).

2.5. Data Preparation

The data used for this study, which are accessible in a public repository, were collected over two phases: the baseline phase, where 118 boda boda internal combustion engine (ICE) motorbikes were tracked over 14 days, and the transition phase, where 108 boda boda ICE motorbikes and 9 electric motorbikes were tracked for a further 12 days [23]. The primary interest of this study is the daily and trip-based mobility patterns of boda bodas in Nairobi. Therefore, all trip datasets were combined to form a single mobility dataset spanning the entire collection period. Outliers were removed from the dataset using three criteria. First, all entries where the trip distance or duration were zero were removed. Second, any trips with an average speed of less than 4 km/h, the approximate walking speed [24], were removed. Third, any trips with an average speed above 80 km/h, the national speed limit for boda bodas in Kenya [25], were excluded.
Before proceeding, it is essential to understand the concept of a bike-day, defined as one day for a single unique bike. While the dataset spans 26 days, each bike active on any of those days contributes to the total of 2627 bike-days. To create the daily dataset used for this study, trips were aggregated for each bike on each day (aggregated in bike-days). The distribution of bike-day distances (distance travelled by a bike in day) is visualised in Figure 3.
The cleaned data were then split into two additional subsets for analysis (see Section 2.2):
  • Excluding all bike-days exceeding 150 km—allows for home charging only to be comparable to the other two approaches as it ensures all bikes can return home (carrying 2 batteries with 75 km range each). This excludes approximately 8% of all bike-days (see Figure 3).
  • Excluding all bike-days exceeding 120 km—allows for home charging only to be comparable to the other two approaches as it ensures all bikes can return home (carrying 2 batteries with 60 km range each). This excludes approximately 20% of all bike-days (see Figure 3).
These datasets are summarised in Table 4. All scripts to reproduce these steps are openly available in a GitHub repository [26].

3. Results

3.1. Environmental Impact

By using the daily distance data to estimate total emissions and dividing this by the total number of active bikes in the dataset, it is possible to make assumptions for the entire fleet and on a per-bike level, as shown in Table 5.
The results show an overall decrease in CO 2 emissions of approximately 85% for Nairobi if the fleet were completely electric. This has the added benefit of displacing these emissions to electricity generation facilities outside the city. Relative PM emissions are reduced by 38.9 g at the fleet level and by approximately 0.4 g per bike per day when transitioning from internal combustion engines to their electric counterparts.

3.2. Grid Impact

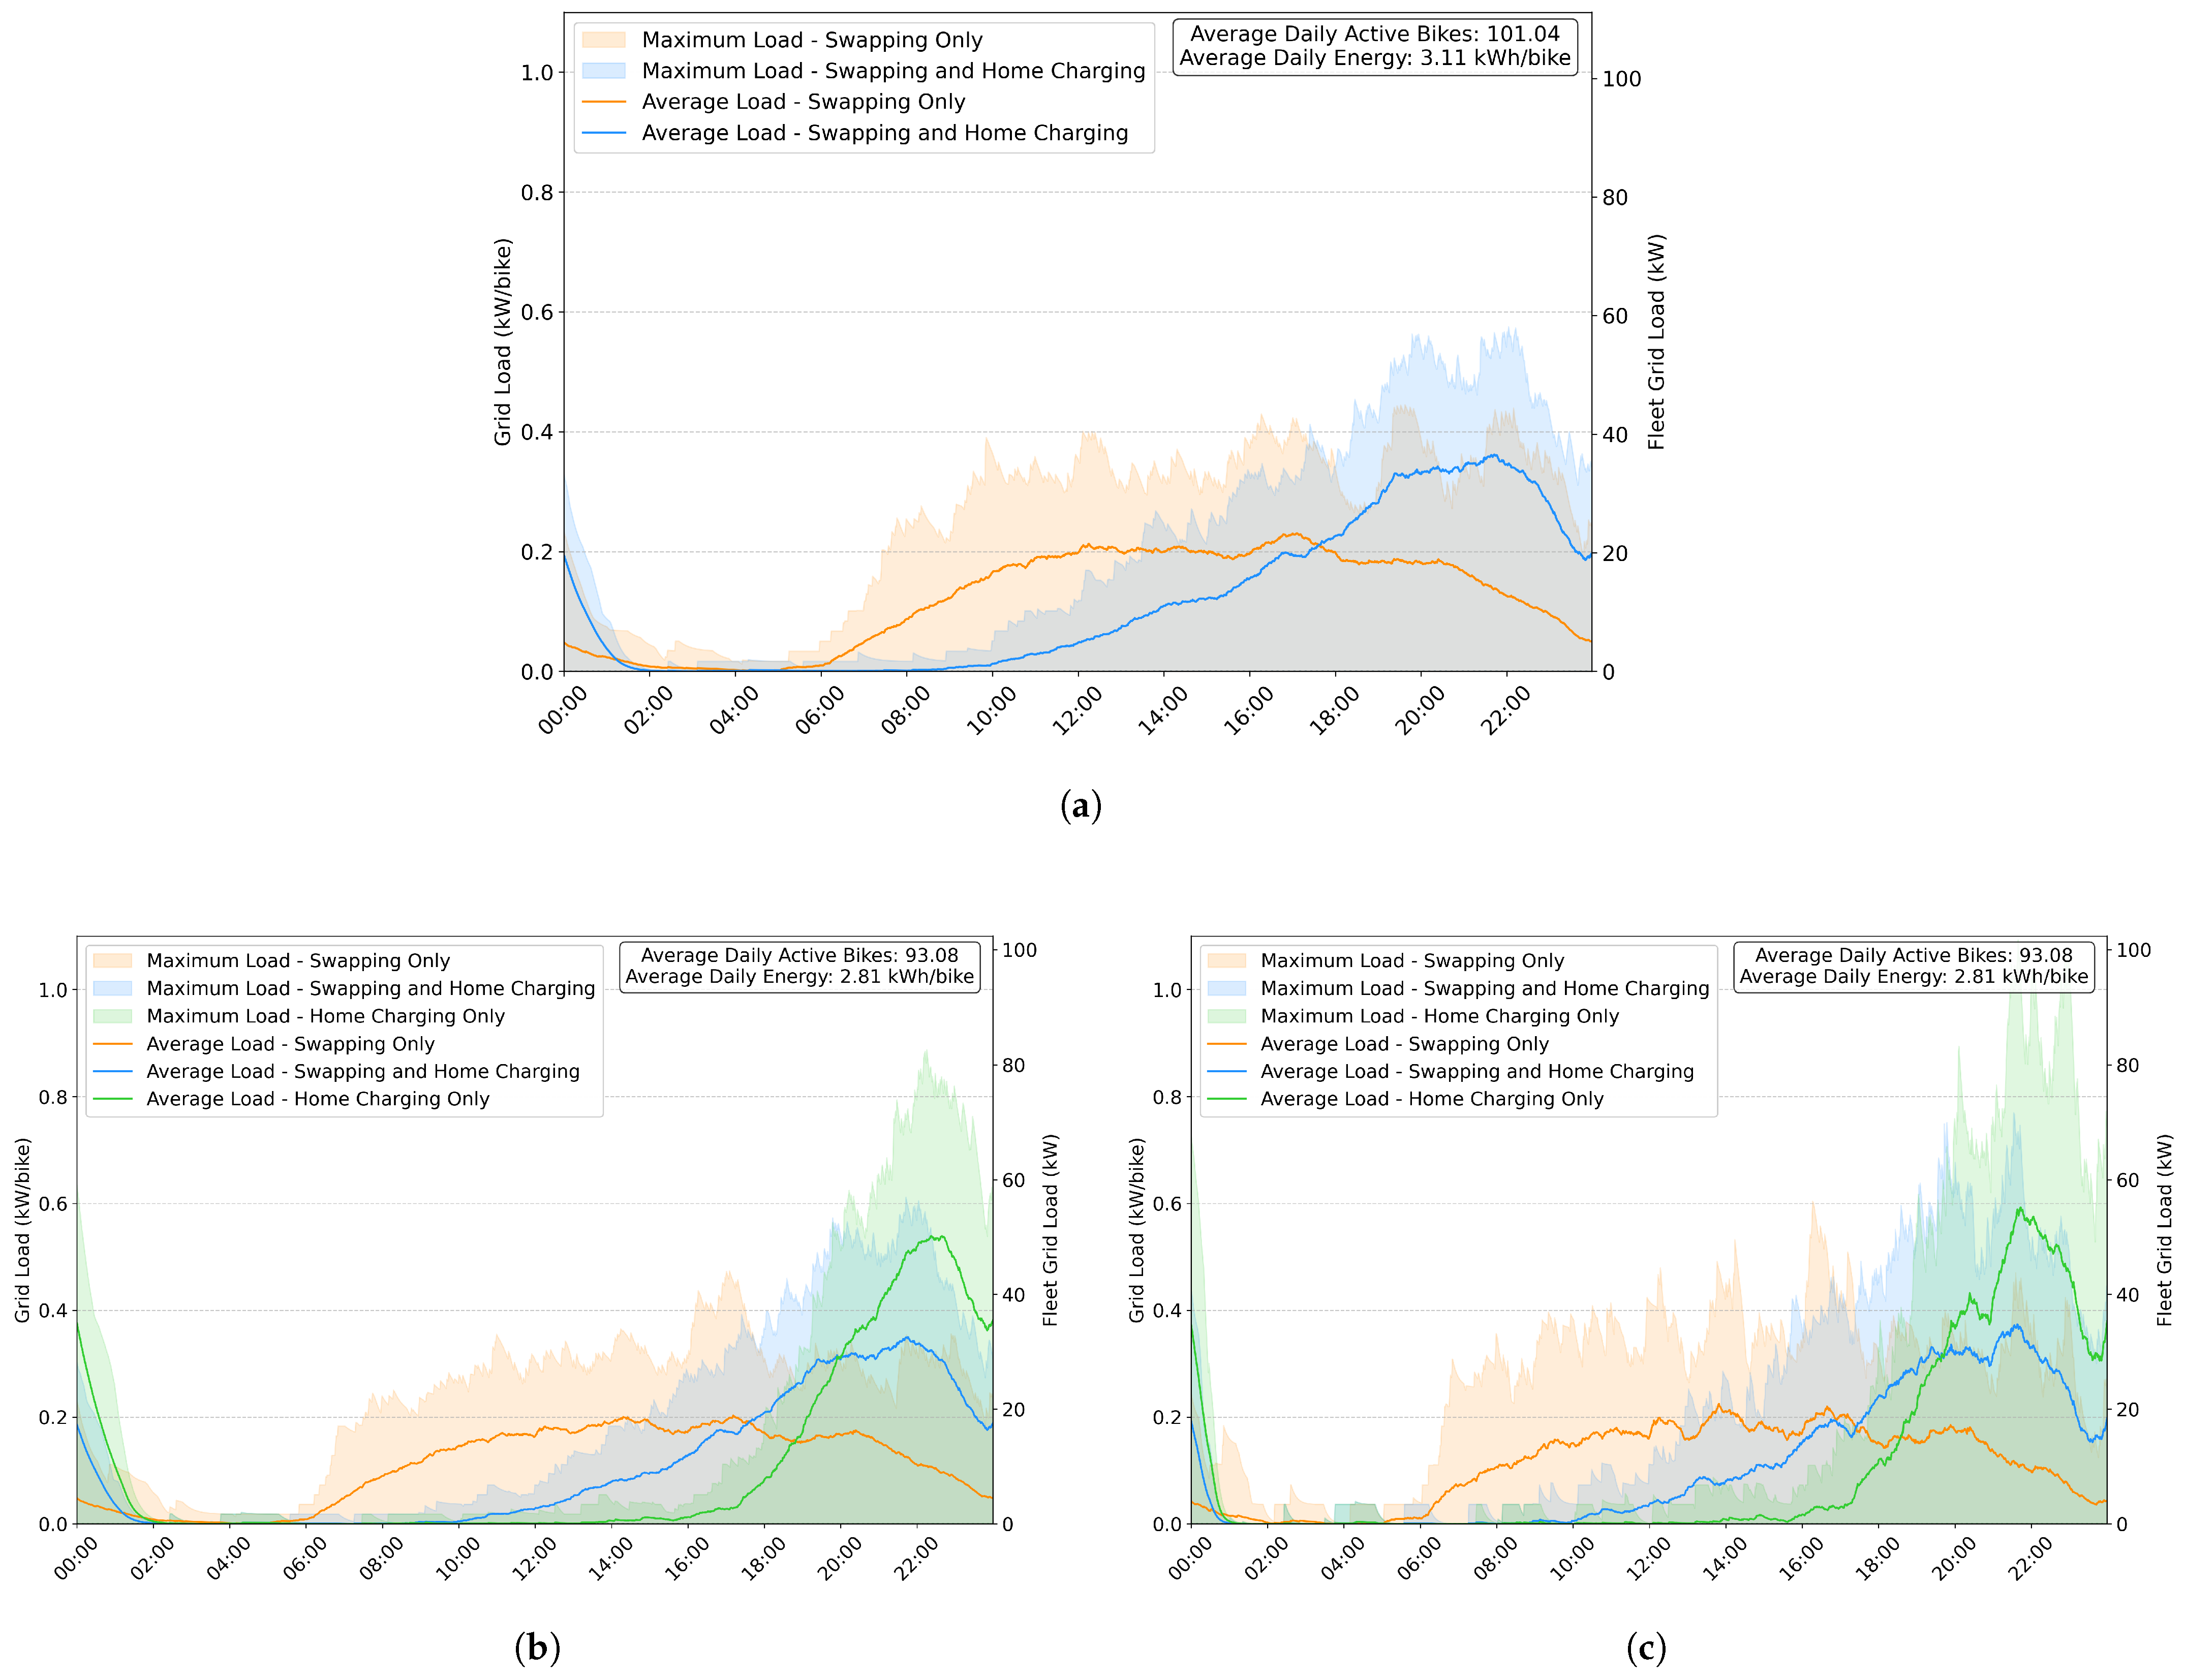
This scenario utilises all available data, assuming a standard battery range of 75 km and a standard efficiency of 28.94 km/kWh. A summary of the data used can be seen in Table 4. The home charging only approach is excluded from these results because the observed daily distances exceed the achievable range for this charging method. Using all the data and adjusting for charger inefficiencies, the fleet requires an average of 314.58 kWh of energy to be sustained for the day. When divided by the average number of daily active bikes, this equates to 3.11 kWh per bike per day. Figure 4a shows the average and peak grid load over each minute of a 24 h period.
It is evident that when employing the battery swapping only approach, the grid load is much more evenly distributed throughout the day compared to an approach that includes home charging. When incorporating home charging, approximately 70% of the energy is consumed between 6 p.m. and 6 a.m. the following morning. This is a much larger percentage than the 33% used during the same hours with the battery swapping only approach. The maximum load for the battery swapping only approach is 44.98 kW, whereas the approach including home charging peaks at 58.13 kW, with a twin peak developing in the evening centred around 8 p.m. and 10 p.m., respectively. This is likely because the mean daily distance travelled by the bikes (85.49 km) is slightly more than, but almost coincides with, their achievable range (75 km), implying that many bikes will swap their batteries close to their final trip of the day. On a per-bike level, this translates to a peak load of 445 W for swapping only and 575 W for the combined swapping and home charging approach. Furthermore, a shift in the grid load to later in the day is observed, which means that solar offsetting would rely more heavily on battery storage rather than real-time offsetting when home charging is included. This makes the offsetting process more battery-resource-intensive, a point further discussed in Section 3.5. This scenario is the most accurate representation of the real world given the current state of motor, battery, and charger technology.
To evaluate the home charging only scenario, we removed the bike-days in which more than 150 km was travelled, since these are not viable with home-only charging. The remaining dataset still comprises 2420 bike-days (26 days, with an average of 93.08 daily active bikes), with an average distance travelled of 77.27 km. The maximum distance travelled in a day is 149.75 km, with the longest single trip being 55.71 km. The entire fleet requires approximately 261.71 kWh per day, with the daily average per bike being 2.81 kWh. As expected, the home charging only approach results in much higher peak loads and greater imbalance throughout the day than the other two methods.
The results in Figure 4b, using standard charging of 0.5C, produce a plot very similar to Figure 4a. The inclusion of home charging only results in a peak grid load of 82.68 kW (0.89 kW/bike), which is significantly higher than the peaks for swapping only at 44.12 kW (0.47 kW/bike) and combined swapping and home charging at 56.95 kW (0.61 kW/bike).

3.3. Faster Charging (Data Excluding Bike-Days > 150 km)

Figure 4 provides a side-by-side comparison of the average and maximum grid loads for a standard charger (0.5C) in Figure 4b and a fast charger (1C) in Figure 4c.
With fast charging, the peak grid loads are 56.26 kW (0.61 kW/bike), 71.69 kW (0.77 kW/bike), and 101.71 kW (1.09 kW/bike) for swapping only, combined swapping and home charging, and home charging only, respectively. This equates to an approximate 25% increase in peak demand across all three approaches when switching to fast charging. We also notice that fast charging creates more volatile grid load profiles, with peaks forming more frequently, many of which surge past the maximum grid load observed for each approach with the standard charger. However, when observing the average load, there is a negligible increase in the maximum grid load. Instead, multiple peaks begin to form, as seen most prominently in the average load for the home charging only scenario.

3.4. Different Efficiencies and Battery Capacities (Data Excluding Bike-Days > 120 km)

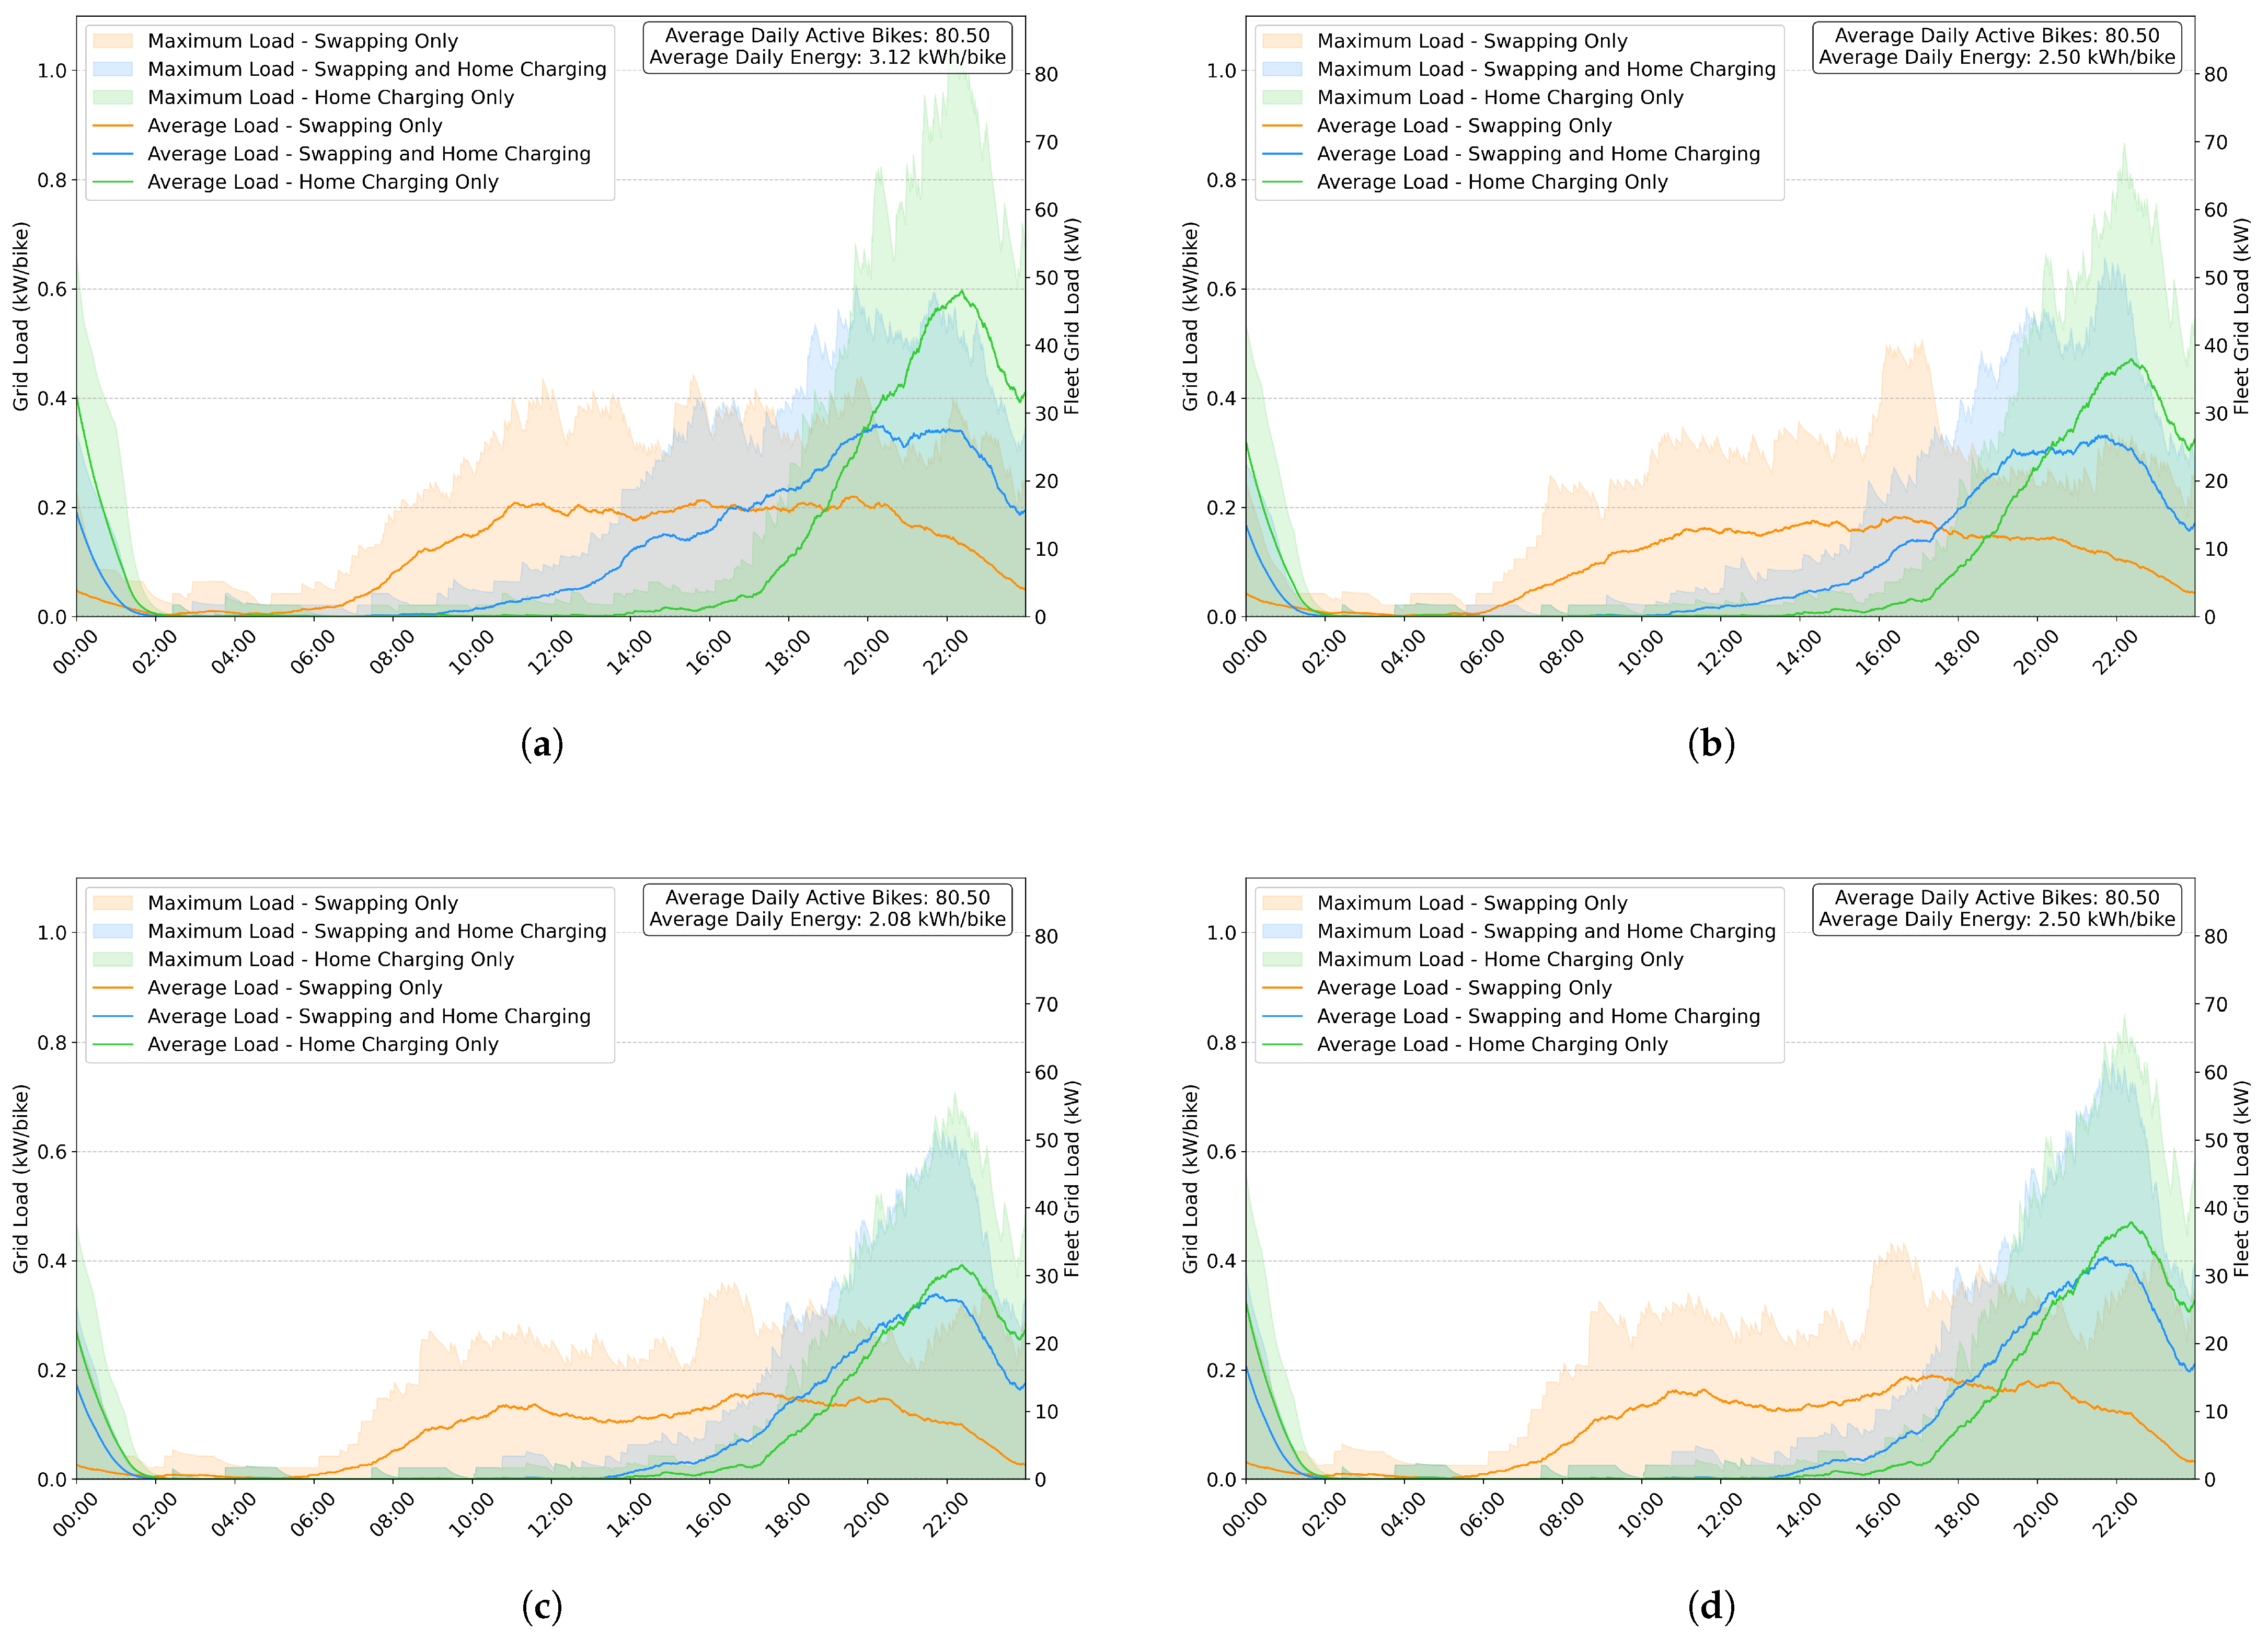
These results use the dataset that excludes all trips contributing to a bike travelling more than 120 km in a day. The average number of daily active bikes is 80.50, again over a 26-day period. This section compares three different efficiencies achieved by the bikes: 23.15 km/kWh (Figure 5a), 28.94 km/kWh (Figure 5b,d), and 34.72 km/kWh (Figure 5c). Figure 5d shows the result of using the standard efficiency with a battery capacity increased by 20% to 3.888 kWh.

3.4.1. Standard Capacity and Efficiency (Control)

Starting with Figure 5b, which serves as the benchmark by using the standard efficiency and capacity, the entire fleet consumes an average of 200.10 kWh daily. This averages out to approximately 2.50 kWh per bike. The plot shows a maximum load peak for the swapping only approach of 40.82 kW (0.51 kW/bike) just after 5 p.m. The combined swapping and home charging approach resulted in a maximum load peak of 52.94 kW (0.66 kW/bike) much later, just before 10 p.m. Finally, with home charging only, the maximum peak load occurred just after 10 p.m. with a surge to 69.79 kW (0.87 kW/bike). The swapping only approach is fairly uniform, with only 33% of the daily average energy being consumed between 6 p.m. and 6 a.m. the next day. This percentage increases to 78% when home charging is included and skyrockets to 95% when only home charging is used.

3.4.2. Standard Capacity, Reduced Efficiency

Figure 5a shows the results for a motorbike with reduced range but standard battery capacity. The average daily energy consumption increases from the benchmark to 3.12 kWh/bike, which is the highest across all tests, even when using a subset of the entire dataset. The lower efficiency also leads to an expected earlier swapping peak for both the swapping only and combined swapping and home charging approaches, as bikes cannot travel as far before their first swap of the day. The average grid load for battery swapping is notably evenly distributed, even more so than in the benchmark test. This could be attributed to the range limitation leading to a more uniform State of Charge (SOC) across all bikes at the end of each day. This, in turn, causes evenly distributed swap times on the following day, creating a ’steady state’ in the system. As expected, incorporating home charging with battery swapping results in a more evenly spread average grid load than the benchmark. This is due to more energy being consumed during working hours to keep bikes operational, alongside a similar dependence on home charging. The home charging only approach exhibits high peaks in the evening, particularly just after 10 p.m., with the maximum grid load surging to 86.68 kW (1.08 kW/bike). This surge is the second highest across all tests, surpassed only by the 1C charging scenario in Figure 4c at 1.09 kW/bike, emphasising the immense role that efficiency plays in large fleets and scalability.

3.4.3. Standard Capacity, Improved Efficiency

Figure 5c presents a scenario where the bike achieves an increased range with the same battery capacity, indicating improved efficiency. The battery swapping only approach remains largely the same, although the perfect uniformity seen with the 60 km range is disrupted, forming what appears to be three peaks in the average grid load throughout the day (around 11 a.m., 5 p.m., and just after 8 p.m.). The maximum grid load peaks at 29.05 kW (0.36 kW/bike), 51.46 kW (0.64 kW/bike), and 57.07 kW (0.71 kW/bike) for swapping only, combined swapping and home charging, and home charging only, respectively. This equates to reductions of up to 28% in peak load. The most noticeable change, however, lies in the similarity between the combined swapping and home charging and the home charging only approaches. As the bike range increases to 90 km, surpassing the mean daily distance travelled per bike for this dataset (68.68 km), the two approaches become largely identical. The only differences arise from the small subset of days where a bike travels more than 90 km. This causes the approach that includes home charging to consume over 87% of its total energy between 6 p.m. and 6 a.m. the next day, compared to only 36% consumed during these hours with the battery swapping only approach. The average daily energy consumption is reduced from the benchmark to 2.08 kWh/bike.

3.4.4. Increased Capacity, Standard Efficiency

Figure 5d shows the results for a bike that can travel 90 km on a single charge, achieved by increasing the battery capacity while maintaining the same efficiency. The plot closely mimics that of Figure 5c, but with a grid load inflated by 20%. This is intuitive, as the larger battery capacity demands more energy from the grid, while the timing of battery swaps remains identical. The average daily energy consumed is 2.50 kWh/bike, the same as the benchmark, which is expected since the efficiency is unchanged. The result is a fleet that tends to heavily favour home charging over battery swapping when the option is available. The maximum load peak for home charging only towers above the other scenarios, surging to a power level similar to the benchmark at around 0.87 kW/bike.

3.5. Solar Augmentation

To best compare the approaches in this section, the dataset excluding bike-days exceeding 150 km is used. Figure 6 includes the same grid impact information as Figure 4b but adds a solar profile scaled to achieve net-zero energy consumption. The net grid load throughout the day (average grid load minus average solar power) is plotted using dotted lines for all three approaches.
In this case, the average solar offsetting capacity averages out to around 558 Wp/bike (0.56 kWp/bike). However, this differs significantly for each approach when analysing how much energy can be offset directly versus how much needs to be stored for later use. The battery swapping only approach allows for the highest percentage of directly harnessed solar energy, at 51% (from 07:15 to 15:59). Including home charging decreases this percentage to just 15% (from 06:01 to 16:18), while the home charging only approach can only harness less than 3% (from 17:26 to 06:00) of the solar energy directly. This implies that the excess energy would need to be stored for later use. This indicates that a battery-swapping approach is well-complemented by solar offsetting. However, even having the option to charge at home heavily disrupts the benefits of direct solar offsetting, with direct offsetting capabilities plummeting by more than threefold compared to the battery swapping only approach. The positive aspect of this is that Kenya is not a solar-dependent country, with solar power constituting only 4% of its grid, according to [10]. However, the properties of geothermal generation, which makes up over 40% of the grid, mean that these plants can consistently generate over 4 TW of power throughout the day, come sunshine or rain. This unique grid characteristic makes the home charging approach more attractive to Kenyan policymakers. With EV charging peaks occurring around 10 p.m., as seen throughout the results, the grid load likely decreases as households go to sleep, creating capacity for this additional demand. For other countries, such as South Africa, the grid is not as diverse. For example, as of 2023, approximately 82% of its grid was dependent on coal and only 1% on renewables [27]. The benefits of solar offsetting for electric vehicles would be strongly worth considering in a country like South Africa.

4. Conclusions

In conclusion, let us consider the implications if all 2.2 million boda bodas in Kenya were electrified tomorrow, based on the results of this study. Daily CO 2 emissions would decrease from approximately 9519 tonnes within the city to 1470 tonnes dispersed at the points of electricity generation. Daily tailpipe PM 10 emissions in the city would decrease from 847 kg to 0 kg. The average daily energy demand would increase by 6.85 GWh, contributing approximately 2.5 TW of additional demand annually, representing a 23% increase in yearly demand. Lower efficiencies could increase this demand to 8.22 GWh, while improved efficiencies could reduce it to approximately 5.48 GWh. Maximum loads would also increase significantly. With home charging only, peaks could be as high as 1.95 GW, potentially increasing to 2.40 GW with fast charging or if bikes have 20% lower efficiency. However, a 20% improvement in efficiency could reduce these peaks to around 1.56 GW. Maximum peaks are consistently highest when only home charging is employed. As battery swapping becomes the dominant method, grid loads tend to decrease and become more evenly distributed throughout the day, in some cases reducing maximum peak loads by up to 60%, as seen in Figure 5a. An evenly distributed grid load is best achieved with the battery swapping only approach. This approach also favours solar offsetting, with about half of the additional 6.85 GWh demand (approximately 3.42 GWh) able to be directly offset by a net-zero installation. However, this would require a solar plant in Nairobi with a peak capacity of around 1.36 GWp. To achieve a completely net-zero impact, the excess 3.42 GWh would need to be stored (assuming 100% charging efficiency), which would require approximately 1 million of the standard batteries used in this experiment. This, however, represents the best-case scenario. The feasibility of solar offsetting diminishes as home charging is introduced, increasing the storage requirement to 5.82 GWh (approximately 1.8 million standard batteries), and further still with the home charging only approach, to 6.64 GWh (approximately 2 million standard batteries).
These conclusions are based on various assumptions, and the results on a per-bike level most definitely do not scale in a perfectly linear manner. However, this provides an indication of the potential impact of electrifying boda bodas at a large scale in Kenya. Kenya’s unique grid makes the prospect of electrification particularly impactful, given that the carbon emission factor of its grid is especially low at 0.226 kg CO 2 /kWh. For example, South Africa’s national grid emission factor was 0.931 kg CO 2 /kWh in 2023, more than four times higher than Kenya’s [28]. Ultimately, the results, as expected, show a reduction in urban CO 2 and PM 10 emissions. They also demonstrate an increased energy demand and peak grid load caused by charging electric vehicle batteries. The battery swapping only approach leads to evenly distributed grid loads, whereas the home charging only approach creates higher peaks in the evenings. The extent of these effects not only depends on the factors considered in this study (such as distance travelled, efficiency, battery capacity, and charging speeds) but also extends to other factors like topography, vehicle payload, and operating temperatures. This is not to mention the expected degradation in battery health over time. Overall, however, many of the main contributing factors have been accounted for, and a framework has been developed for future replication of this study in other dynamic and unique urban areas similar to Nairobi.

4.1. Limitations and Future Work

This work presented environmental and grid impact assessments of boda boda electrification in Nairobi, Kenya. However, the work is not without limitations. First, due to the dearth of data in the sector, the dataset used is fairly small. It is suggested that future studies leverage the emerging availability of larger datasets. Second, this study is relevant to Nairobi, Kenya, its solar characteristics, and its grid’s relatively low emissions factor. It is suggested that further work be performed to evaluate the impact on other cities in the region with more seasonally variant solar profiles and more fossil-fuel-dependent electricity grids. Third, the focus of this work was a technical assessment, but future works should evaluate the broader impact of electrification, considering the financial implications, impact on health, and impact on the national fiscus of reduced fuel and vehicle imports.

4.2. Policy Implication

To ensure equitable access to electric boda bodas, especially for low-income operators, policies must address the high upfront cost of electric vehicles relative to conventional alternatives. Governments and stakeholders should consider subsidised financing schemes, battery leasing models, and tax incentives that lower the barrier to entry for informal operators. Public–private partnerships could facilitate the establishment of affordable battery-swapping infrastructure, which this study shows reduces peak grid loads and aligns well with solar offsetting strategies.
Although electric boda bodas may incur higher upfront costs, this study and others suggest that their long-term maintenance and operational costs are significantly lower than those of their ICE counterparts due to fewer moving parts and higher energy efficiency. Policymakers should thus promote lifecycle cost awareness campaigns to inform operators of long-term savings, potentially supporting broader uptake.
International financial institutions (IFIs) can play a pivotal role by funding pilot projects, underwriting battery-swapping infrastructure, and offering concessional loans or guarantees to de-risk private sector investment in e-mobility. In parallel, IFIs can provide technical assistance to support standardisation of battery and charging systems and the development of inclusive regulatory frameworks that protect small-scale operators while enabling innovation.
Currently, the vast majority of vehicles are imported and so is the energy (fuel) that propels them. The transition to electric motorbikes provides a unique opportunity to establish local and fit-for-purpose vehicle production in the region and to boost energy self-sufficiency through local electricity generation.
Finally, to ensure that peak vehicle charging demand coincides with green energy availability, smart metering, with time-of-use metering and variable tariffs, and green energy trading schemes should be incentivised.
Author Contributions

Conceptualisation: H.S. and M.J.B.; methodology: H.S. and M.J.B.; software: H.S.; validation: H.S. and M.J.B.; resources: M.J.B.; supervision: M.J.B.: writing—original draft preparation: H.S.; writing—review and editing, M.J.B. All authors have read and agreed to the published version of the manuscript.

Funding

This research received funding from the Western Cape Government Motorised Transport department through contract S009285.

Data Availability Statement

The data presented in this study are openly available in the link provided in the paper (Data in Brief publication) https://www.sciencedirect.com/science/article/pii/S2352340925005323 (accessed on 20 July 2024).

Acknowledgments

The data used for this research was collected by the Clean Air Taskforce and EED Advisory. During the preparation of this manuscript/study, the author(s) used Grok 3 and Gemini Pro 2.5 for the purposes of data visualisation enhancements and grammar/spelling correction. The authors have reviewed and edited the output and take full responsibility for the content of this publication.

Conflicts of Interest

The authors declare no conflicts of interest.

Abbreviations

The following abbreviations are used in this manuscript:
CC-CVConstant Current–Constant Voltage
CO 2 Carbon Dioxide
EVElectric Vehicle
ICEInternal Combustion Engine
NSRDBNational Solar Radiation Database
PMParticulate Matter
PM 2.5 Particulate Matter (including particles with a diameter of 2.5 µm or less)
PM 10 Particulate Matter (including particles with a diameter of 10 µm or less)
SAMSystem Advisor Model
SOCState of Charge

Appendix A. Lithium-Ion Charging Profile

Appendix A.1. Charging Profile for 0.5C and 1C

Figure A1. Graph showing 0.5C (standard) and 1C (fast) charging profiles for a 3.24 kWh battery used for simulating recharging.
Wevj 16 00427 g0a1

Appendix A.1.1. Grid Load Function

P grid ( t ) = p D C η , 0 t t trans p D C η · e λ ( t t trans ) , t > t trans
  • P grid ( t ) : Instantaneous power drawn from the grid at time t.
  • p D C : Constant power delivered to the battery during the CC phase.
  • η : Charger efficiency (e.g., 0.95).
  • t: Time elapsed since charging begins.
  • t trans : Time when CC switches to CV mode (e.g., the time taken to reach 85% SOC).
  • λ : Decay constant for the CV phase (optimised such that the total energy delivered to the battery equals the battery capacity).

Appendix A.1.2. Energy Function

E = 0 η · P grid ( t ) d t = E bat
The State of Charge (SOC) at time t is calculated as the ratio of the cumulative energy delivered to the battery up to t relative to its total capacity:
SOC ( t ) = 0 t η · P grid ( t ) d t E bat
  • E: Total energy delivered to the battery.
  • η · P grid ( t ) : Power delivered to the battery after efficiency losses.
  • E bat : Total battery capacity (e.g., 3.24 kWh).
  • SOC ( t ) : State of Charge at time t.

References

  1. Nakijoba, S.; Courtright, T.; Said, T. E-Mobility as a Driver for Change Towards a Gender Transformative and Just Transition to Electric Mobility; UN Environment Programme, African E-Mobility Alliance: Nairobi, Kenya, 2024. Available online: https://sustmob.org/EMOB/pdf/EMOB_Uganda_GenderReport.pdf (accessed on 12 June 2025).
  2. FIA Foundation. A Fare Price: An Investigation into the Health Costs of Motorcycle Taxi Crashes in Kenya; FIA Foundation: London, UK, 2024. Available online: https://www.fiafoundation.org/resources/a-fare-price (accessed on 12 June 2025).
  3. Clean Development Mechanism. Methodological Tool: Tool to Calculate the Emission Factor for an Electricity System; Version 07.0.0; United Nations Framework Convention on Climate Change: Bonn, Germany, 2020. Available online: https://cdm.unfccc.int/sunsetcms/storage/contents/stored-file-20201230125121808/ASB0050-2020_PSB0055.pdf (accessed on 12 June 2025).
  4. Wichmann, J.; Voyi, K. Ambient air pollution exposure and respiratory, cardiovascular and cerebrovascular mortality in Cape Town, South Africa: 2001–2006. Int. J. Environ. Res. Public Health 2020, 17, 149. [Google Scholar] [CrossRef]
  5. Amegah, A.K. Proliferation of low-cost sensors. What are the prospects for air pollution epidemiologic research in Sub-Saharan Africa? Environ. Pollut. 2021, 289, 117863. [Google Scholar] [CrossRef] [PubMed]
  6. Clean Air Fund. Clean Air in Africa’s Cities: Nairobi and Air Pollution. Available online: https://www.cleanairfund.org/clean-air-africas-cities/nairobi-and-air-pollution/ (accessed on 12 June 2025).
  7. Odhiambo, E.; Kipkoech, D.; Hegazy, A.; Hegazy, M.; Manuel, M.; Schalekamp, H.; Klopp, J.M. The Potential for Minibus Electrification in Three African Cities: Cairo, Nairobi, and Cape Town. University of Cape Town. 2021. Available online: https://transportforcairo.com/wp-content/uploads/2021/09/PotentialforMinibusElectrificationinAfricanCitiesStudyReport.pdf (accessed on 26 June 2025).
  8. Kumar, A.; Singh, P.; Raizada, P.; Hussain, C.M. Impact of COVID-19 on greenhouse gases emissions: A critical review. Sci. Total Environ. 2021, 806, 150349. [Google Scholar] [CrossRef] [PubMed]
  9. Sollay Kenyan Foundation. Navigating the Challenges of Kenya’s Energy Crisis in 2025. Available online: https://www.sollaykenyanfoundation.org/navigating-the-challenges-of-kenyas-energy-crisis-in-2025/ (accessed on 26 June 2025).
  10. Low Carbon Power. Electricity in Kenya in 2024. Available online: https://lowcarbonpower.org/region/Kenya (accessed on 12 June 2025).
  11. Calitz, J.R.; Wright, J.G.; Baumanns, K. Electrification potential of minibus taxis in sub-Saharan Africa: A South African case study. Transp. Res. Part Transp. Environ. 2025, 138, 104440. [Google Scholar] [CrossRef]
  12. Martin, E. Taking a Sustainability Turn? Stakeholder Perceptions on Electrification of Motorcycle Taxis in Nairobi, Kenya. Master’s Thesis, Technische Universität Berlin, Berlin, Germany, 2020. [Google Scholar]
  13. Calzavara, J.; Courtright, T.; Park, J. Environmental and Social Impact Assessment of Electric Motorcycles in Kampala, Uganda; University of Michigan: Ann Arbor, MI, USA, 2021. [Google Scholar]
  14. Honda South Africa. ACE 125 Taxi 2022. Available online: https://cdn.honda.co.za/main-03/general/motorcycles/ace-125-taxi/ACE-125-Taxi-2022.pdf (accessed on 12 June 2025).
  15. Roam. Motorcycles: Roam Air. Available online: https://www.roam-electric.com/motorcycles (accessed on 12 June 2025).
  16. U.S. Energy Information Administration. Carbon Dioxide Emissions Coefficients. Available online: https://www.eia.gov/environment/emissions/co2_vol_mass.php (accessed on 12 June 2025).
  17. Association des Constructeurs Européens de Motocycles (ACEM). New Euro 5 Environmental Standard for Motorcycles and Mopeds to Enter into Force in 2020. Available online: https://www.acem.eu/new-euro-5-environmental-standard-for-motorcycles-and-mopeds-to-enter-into-force-in-2020/ (accessed on 12 June 2025).
  18. Chiang, K.-C.; Lin, G.-W.; Pai, Y.-F.; Liu, Y.-C. Motorcycle Exhaust Emission Can Be Reduced by 20% via the Adoption of Electric Throttle Valve Control and External EGR Loop Tested by a Dynamometer Testing System. Appl. Energy 2017, 201, 353–364. [Google Scholar] [CrossRef]
  19. Kristiansen, T.E.; Nordgård-Hansen, E.; Hoff, K.A. Electric Vehicles: Battery Capacity, Charger Power, Access to Charging and the Impacts on Distribution Networks. eTransportation 2020, 4, 100059. Available online: https://www.researchgate.net/publication/341262399_Electric_vehicles_Battery_capacity_charger_power_access_to_charging_and_the_impacts_on_distribution_networks (accessed on 12 June 2025). [CrossRef]
  20. HallyStrats. Li-Ion Charging Profile Source Code. Available online: https://github.com/HallyStrats/li-ion_charging_profile (accessed on 12 June 2025).
  21. National Solar Radiation Database. Data Viewer. Available online: https://nsrdb.nrel.gov/data-viewer (accessed on 13 May 2025).
  22. System Advisor Model. SAM: System Advisor Model. Available online: https://sam.nrel.gov/ (accessed on 13 May 2025).
  23. Mbutura, A.; Kitetu, M.; Stratford, H.; Booysen, M.J. Nairobi Motorcycle Transit Comparison Dataset: Fuel vs. Electric Vehicle Performance Tracking. Data Brief 2023, 55, 109628. [Google Scholar] [CrossRef]
  24. Medical News Today. What Is the Average Walking Speed? Available online: https://www.medicalnewstoday.com/articles/average-walking-speed (accessed on 12 June 2025).
  25. Soko Directory. NTSA Unveils New Changes to License Fees and Speed Limit. Available online: https://sokodirectory.com/2025/04/ntsa-unveils-new-changes-to-license-fees-and-speed-limit/ (accessed on 12 June 2025).
  26. Stratford, H. Nairobi Motorcycle Transit Comparison Scripts. Available online: https://github.com/HallyStrats/nairobi_impact_study (accessed on 12 June 2025).
  27. Department of Mineral Resources and Energy. South African Energy Sector Report 2023; Department of Mineral Resources and Energy: Pretoria, South Africa, 2023. Available online: https://www.dmre.gov.za/energy-resources/energy-statistics-reports/energy-sector-reports (accessed on 26 June 2025).
  28. South Africa Government. Integrated Resource Plan 2023; Government Gazette No. 50025; Pretoria, South Africa, 11 January 2024. Available online: https://www.gov.za/sites/default/files/gcis_document/202401/49974gon4238.pdf (accessed on 12 June 2025).
Figure 1. Examples of the boda boda motorbike taxi industry in Nairobi, Kenya. (a) A boda boda taxi with three passengers. (H.S.) (b) Boda bodas playing a prime role in the transport sector. (M.J.B.) (c) An electric boda boda battery swapping station. (M.J.B.)
Wevj 16 00427 g001
Figure 2. ICE and electric motorbikes used for this study. (a) ICE motorbike: Honda Ace 125cc. (b) Electric motorbike: Roam Air with swappable batteries.
Wevj 16 00427 g002
Figure 3. Plot showing distribution of bike-day distances.
Wevj 16 00427 g003
Figure 4. Grid load profiles for the charging approaches at different charging rates. (a) All bike-days for swapping only and swapping with home charging approaches (0.5C charging). (b) All three approaches with bike-day distances less than 150 km (0.5C charging). (c) All three approaches with bike-day distances less than 150 km (1C fast charging).
Wevj 16 00427 g004
Figure 5. Plots showing daily average and maximum grid load across different range, efficiency, and battery capacity configurations. (a) 60 km Range, Less Efficiency. (b) 75 km Range, Standard Efficiency. (c) 90 km Range, More Efficiency. (d) 90 km Range, Standard Efficiency, More Capacity.
Wevj 16 00427 g005
Figure 6. Plot showing the daily average, maximum, solar offset, and effective power demand.
Wevj 16 00427 g006
Table 1. Comparison of specifications for Honda Ace 125 cc [14] and Roam Air [15].
SpecificationHonda Ace 125 ccRoam Air
Fuel/Energy Efficiency45.50 km/L28.94 km/kWh
Tank/Battery Capacity10 L3.24 kWh (2.592 kWh *)
Range455 km per tank75 km per battery
* Operates only between 20% and 100% SOC.
Table 2. Emission coefficients (grams per km) for ICE and electric vehicles.
Emission TypeICEElectric
CO 2 50.5495 (from Equation (1))7.8106 (from Equation (2))
PM0.0045 [17]0.0000
Table 3. Required efficiencies for different ranges.
Range (km)Required Efficiency (km/kWh)
6023.15
7528.94
9034.72
Table 4. Daily data summary.
MetricAll DataBike-Days < 150 kmBike-Days < 120 km
Total days262626
Average daily active bikes1019381
Average daily fleet distance (km)864871955526
Average daily distance per bike (km)857769
Table 5. Estimated daily emissions for ICE and electric vehicle fleets and per bike in kilograms.
Emission TypeEntire FleetPer Bike
ICEElectricICEElectric
CO 2 437.187467.55154.32690.6686
PM0.03890.00000.00040.0000
Disclaimer/Publisher’s Note: The statements, opinions and data contained in all publications are solely those of the individual author(s) and contributor(s) and not of MDPI and/or the editor(s). MDPI and/or the editor(s) disclaim responsibility for any injury to people or property resulting from any ideas, methods, instructions or products referred to in the content.