1. Introduction
Across sub-Saharan African countries, motorbike taxis, called “boda bodas”, constitute a prominent mode of transport and are predominantly petroleum-fuelled. The global drive to electrify transport raises a key consideration given the region’s fragile electricity networks: how will electrification of this mode affect emissions and electricity networks? We answer this question for Nairobi, Kenya.
A key driver of global transport electrification is the reduction in
emissions. An additional consideration in sub-Saharan Africa is rampant pollution in its cities. Boda bodas dominate this sector, providing more than 35% of passengers, with 2.2 million registered in Kenya as of 2024 [
1,
2]. These vehicles are well suited to rapid electrification due to their simplicity and low cost relative to larger vehicles, further boosted by viable battery swapping technology.
This grid system yields a low carbon emission factor of 0.226 kg
/kWh [
3] and features a diverse combination of electricity generation approaches, which creates a unique distribution of energy supply throughout a 24 h period.
The urgent need for transport electrification in sub-Saharan Africa is underscored by the severe health and environmental impacts of current transport systems. Traffic-related air pollution contributes significantly to mortality across the region, with
concentrations in African cities frequently exceeding WHO guidelines and reaching up to 80 μg/m
3, driven substantially by vehicle emissions [
4]. In 2019, air pollution was responsible for 1.1 million premature deaths across Africa, with children facing heightened risks of acute lower respiratory infections due to particulate matter exposure [
5]. According to the Clean Air Fund, 40% of PM
2.5 emissions—particulate matter harmful to human health—in Nairobi stem from the transport sector [
6]. The transport sector compounds these challenges by accounting for approximately 26% of Africa’s total fossil fuel emissions [
7].
However, the transition to electric transport faces significant infrastructure challenges, as countries in sub-Saharan Africa have fragile electrical grids that could be substantially burdened by a sizeable fleet of electric vehicles [
8]. Kenya exemplifies this vulnerability, with an ageing grid infrastructure that led to a massive blackout in August 2024, plunging Nairobi and six other regions into darkness and highlighting the national grid’s fragility [
9].
From an emissions perspective, electrifying motorbike fleets is appealing, but the impact on the electrical grid and infrastructure planning cannot be overlooked. Kenya’s grid stands out among African countries for its low-carbon profile. As of 2024, it generates over 11 TWh annually, with only about 1 TWh sourced from fossil fuels [
10].
Research on transport electrification in the region has begun to address these challenges, with studies on minibus taxi electrification identifying the dual challenges of maintaining service demand while managing grid impact in already fragile networks [
11]. Current research in Nairobi primarily relies on rider surveys for data [
12]. While insightful, this paper seeks to validate these findings using real-world tracking data from boda bodas in Nairobi.
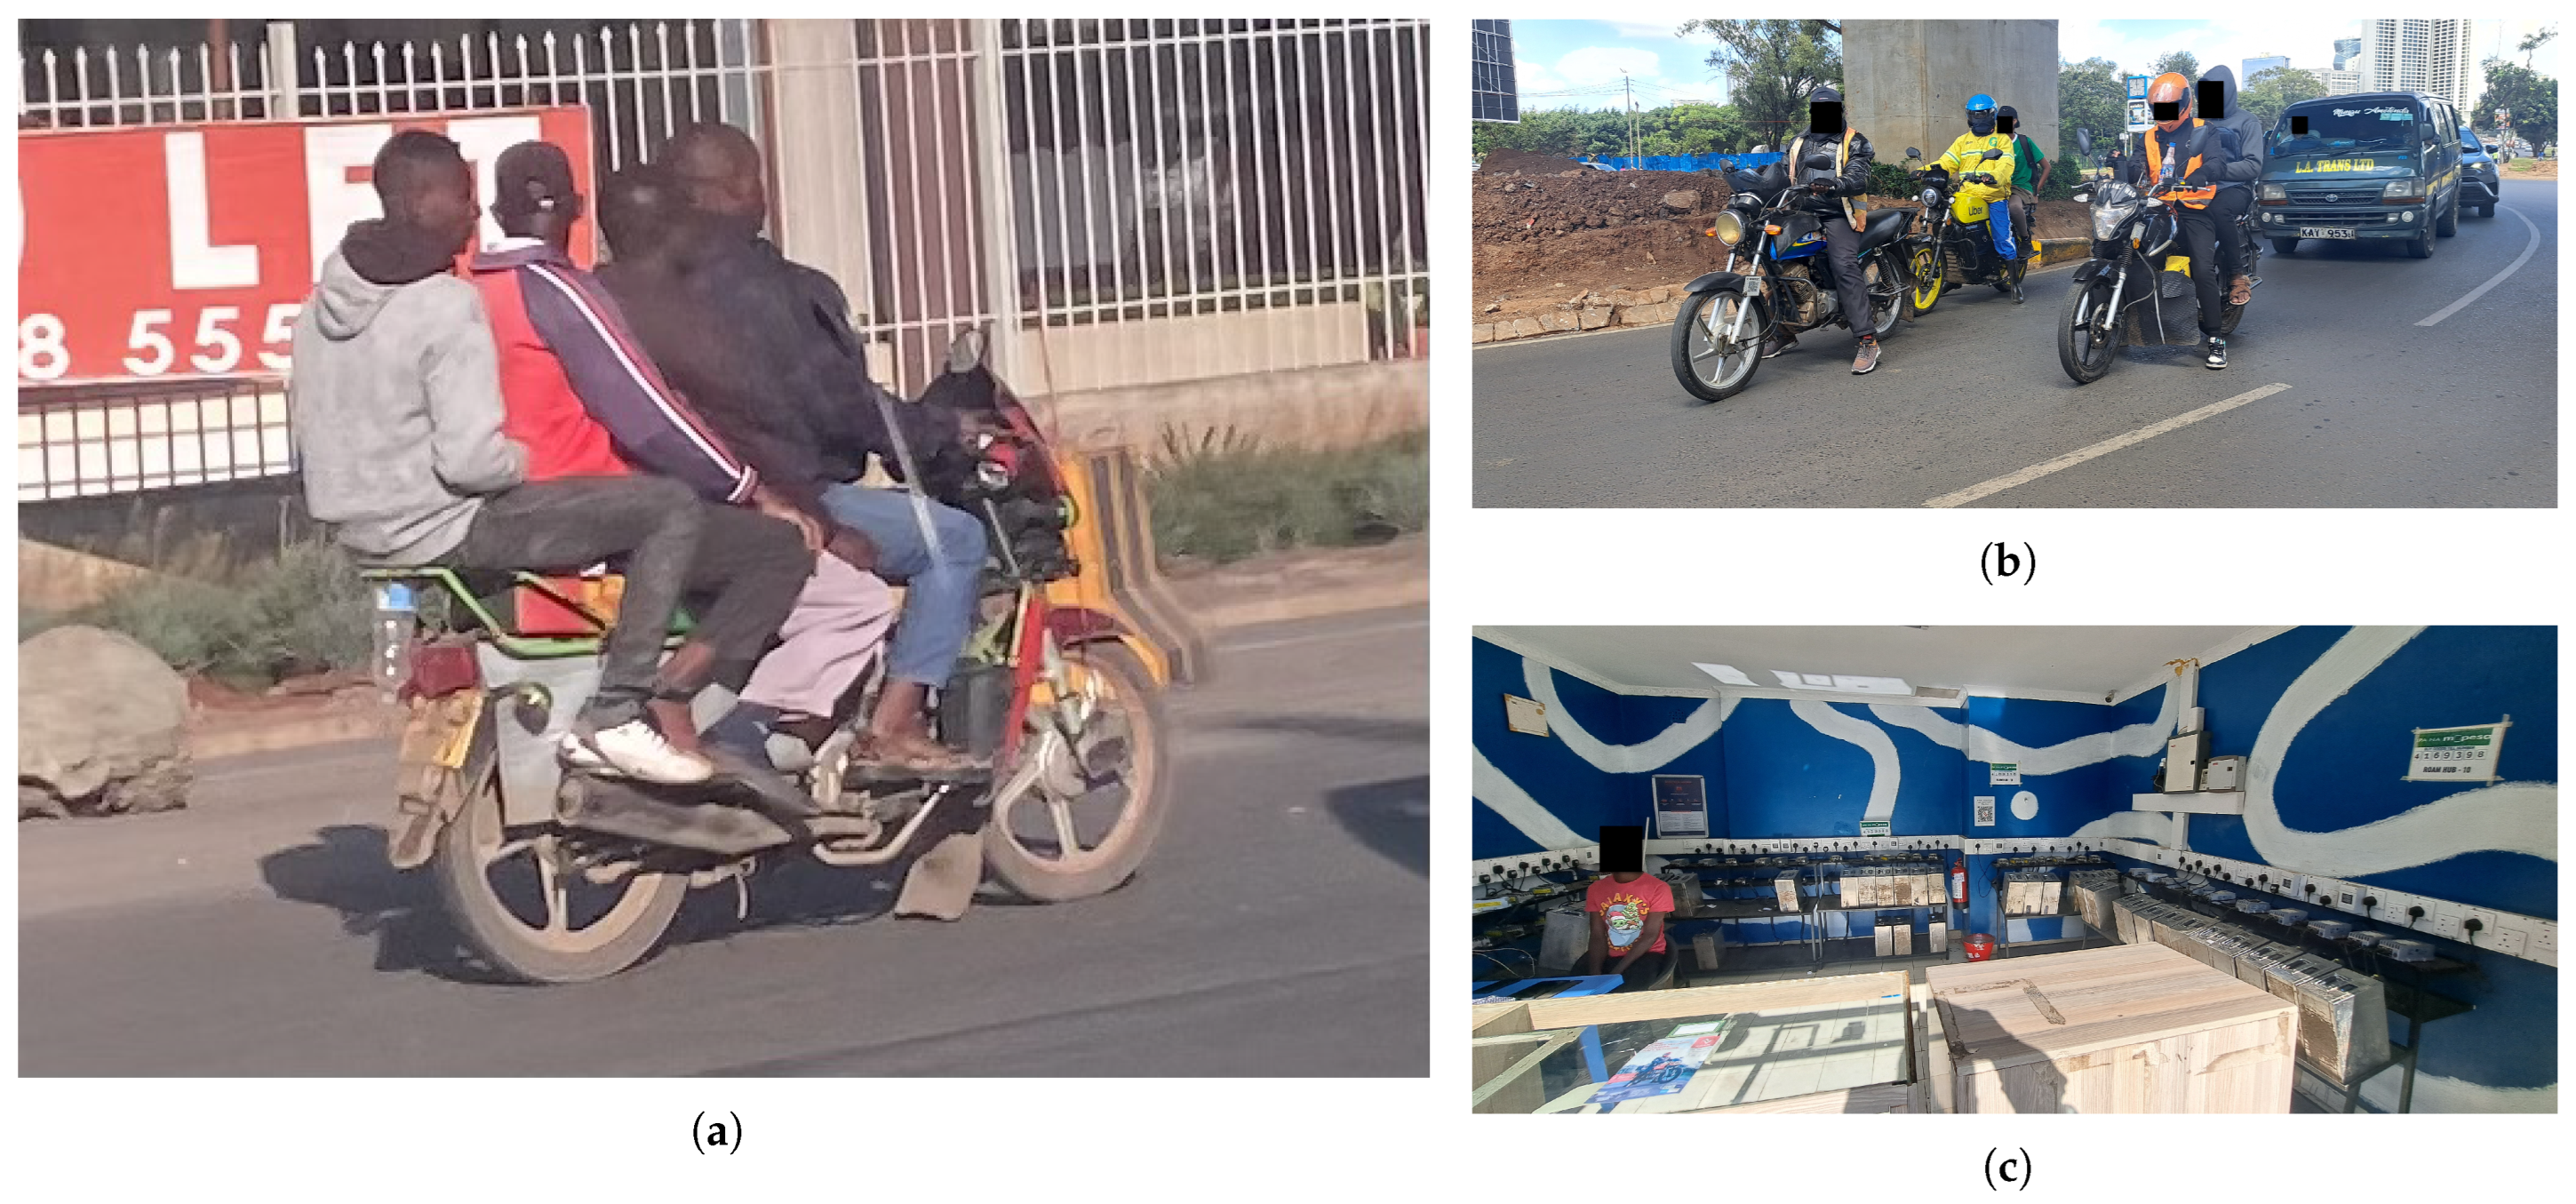
Figure 1a shows the ubiquitous boda bodas transporting passengers in Nairobi, Kenya.
For motorbike taxis specifically, pioneering work by the University of Michigan in Kampala, Uganda, used real-world tracking data to simulate emission reductions for hypothetical electric motorbike fleets [
13], establishing a valuable framework for emissions analysis. However, despite this foundational research, a comprehensive analysis of both the environmental benefits and grid infrastructure impacts of motorbike taxi electrification has not yet been conducted for Nairobi, representing a critical gap in understanding the scalability and feasibility of transport electrification in Kenya’s capital city.
Contribution
In the context described above, this article addresses the research gap by quantifying the and (including ) emissions that could be displaced by electrifying boda bodas, and the resulting impact on the electricity network is assessed. Given the unique mobility patterns and battery models employed, different charging strategies are assessed. The results are assessed for different motor efficiencies, battery capacities, and charging rates. Given the region’s sunny climate, we also evaluate the potential for solar offsetting, which could facilitate a smoother and greener transition. Although the results are pertinent to Nairobi, the method provides a transferable framework for the easy replication of these results in other large cities worldwide, using existing internal combustion engine (ICE) motorbike tracking data to model the effects of electrification.
While this study focuses on Nairobi, it is important to acknowledge that its findings may not scale linearly to other cities in sub-Saharan Africa. Nairobi’s relatively low-carbon and diverse electricity grid, driven largely by geothermal energy, offers more favourable conditions for transport electrification than fossil-fuel-dependent grids in cities like Lagos or Johannesburg. Additionally, Nairobi’s relatively mild climate and growing battery-swapping ecosystem further differentiate its electrification potential from cities such as Kampala, where early pilots of electric motorbikes face different barriers. Urban density, cultural perceptions, informal transport structures, and access to charging infrastructure vary significantly across the region. Therefore, while the framework developed here is transferable, implementation strategies must be adapted to local grid capacity, solar irradiance variability, and institutional readiness in each city.
3. Results
3.1. Environmental Impact
By using the daily distance data to estimate total emissions and dividing this by the total number of active bikes in the dataset, it is possible to make assumptions for the entire fleet and on a per-bike level, as shown in
Table 5.
The results show an overall decrease in emissions of approximately 85% for Nairobi if the fleet were completely electric. This has the added benefit of displacing these emissions to electricity generation facilities outside the city. Relative PM emissions are reduced by 38.9 g at the fleet level and by approximately 0.4 g per bike per day when transitioning from internal combustion engines to their electric counterparts.
3.2. Grid Impact
This scenario utilises all available data, assuming a standard battery range of 75 km and a standard efficiency of 28.94 km/kWh. A summary of the data used can be seen in
Table 4. The
home charging only approach is excluded from these results because the observed daily distances exceed the achievable range for this charging method. Using all the data and adjusting for charger inefficiencies, the fleet requires an average of 314.58 kWh of energy to be sustained for the day. When divided by the average number of daily active bikes, this equates to 3.11 kWh per bike per day.
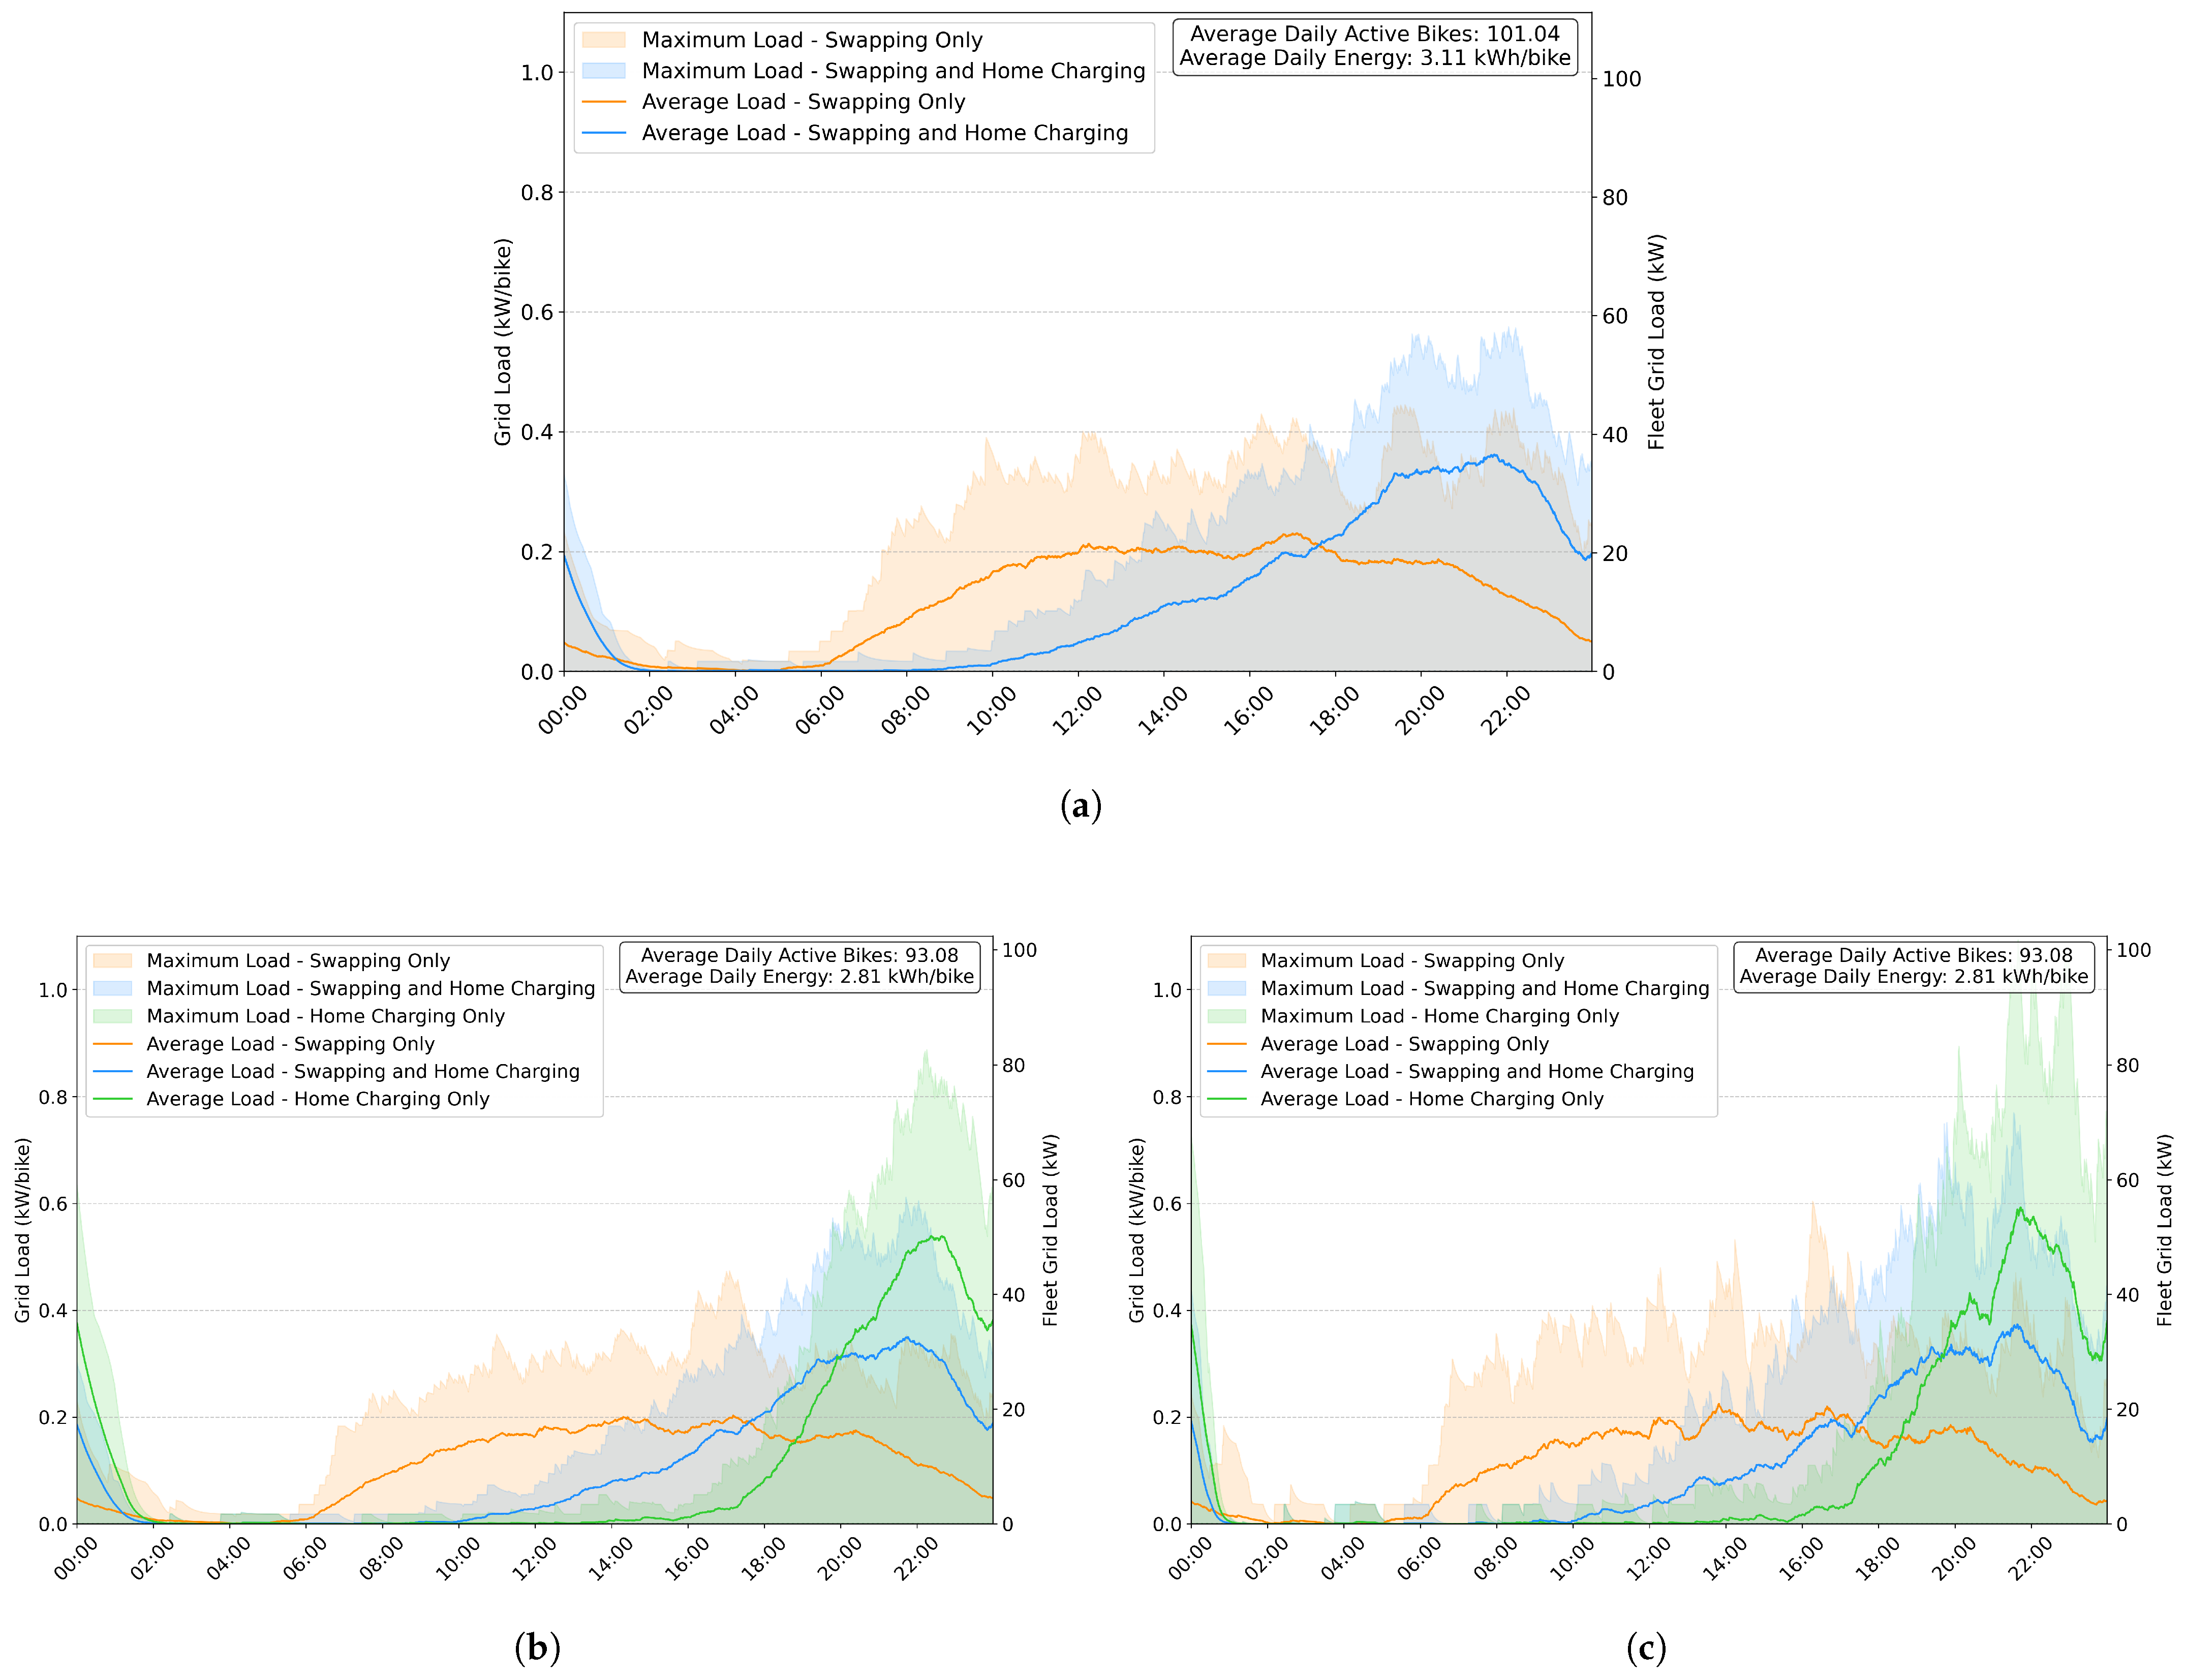
Figure 4a shows the average and peak grid load over each minute of a 24 h period.
It is evident that when employing the
battery swapping only approach, the grid load is much more evenly distributed throughout the day compared to an approach that includes home charging. When incorporating home charging, approximately 70% of the energy is consumed between 6 p.m. and 6 a.m. the following morning. This is a much larger percentage than the 33% used during the same hours with the
battery swapping only approach. The maximum load for the
battery swapping only approach is 44.98 kW, whereas the approach including home charging peaks at 58.13 kW, with a twin peak developing in the evening centred around 8 p.m. and 10 p.m., respectively. This is likely because the mean daily distance travelled by the bikes (85.49 km) is slightly more than, but almost coincides with, their achievable range (75 km), implying that many bikes will swap their batteries close to their final trip of the day. On a per-bike level, this translates to a peak load of 445 W for swapping only and 575 W for the combined
swapping and home charging approach. Furthermore, a shift in the grid load to later in the day is observed, which means that solar offsetting would rely more heavily on battery storage rather than real-time offsetting when home charging is included. This makes the offsetting process more battery-resource-intensive, a point further discussed in
Section 3.5. This scenario is the most accurate representation of the real world given the current state of motor, battery, and charger technology.
To evaluate the home charging only scenario, we removed the bike-days in which more than 150 km was travelled, since these are not viable with home-only charging. The remaining dataset still comprises 2420 bike-days (26 days, with an average of 93.08 daily active bikes), with an average distance travelled of 77.27 km. The maximum distance travelled in a day is 149.75 km, with the longest single trip being 55.71 km. The entire fleet requires approximately 261.71 kWh per day, with the daily average per bike being 2.81 kWh. As expected, the home charging only approach results in much higher peak loads and greater imbalance throughout the day than the other two methods.
The results in
Figure 4b, using standard charging of 0.5C, produce a plot very similar to
Figure 4a. The inclusion of
home charging only results in a peak grid load of 82.68 kW (0.89 kW/bike), which is significantly higher than the peaks for swapping only at 44.12 kW (0.47 kW/bike) and combined
swapping and home charging at 56.95 kW (0.61 kW/bike).
3.3. Faster Charging (Data Excluding Bike-Days > 150 km)
Figure 4 provides a side-by-side comparison of the average and maximum grid loads for a standard charger (0.5C) in
Figure 4b and a fast charger (1C) in
Figure 4c.
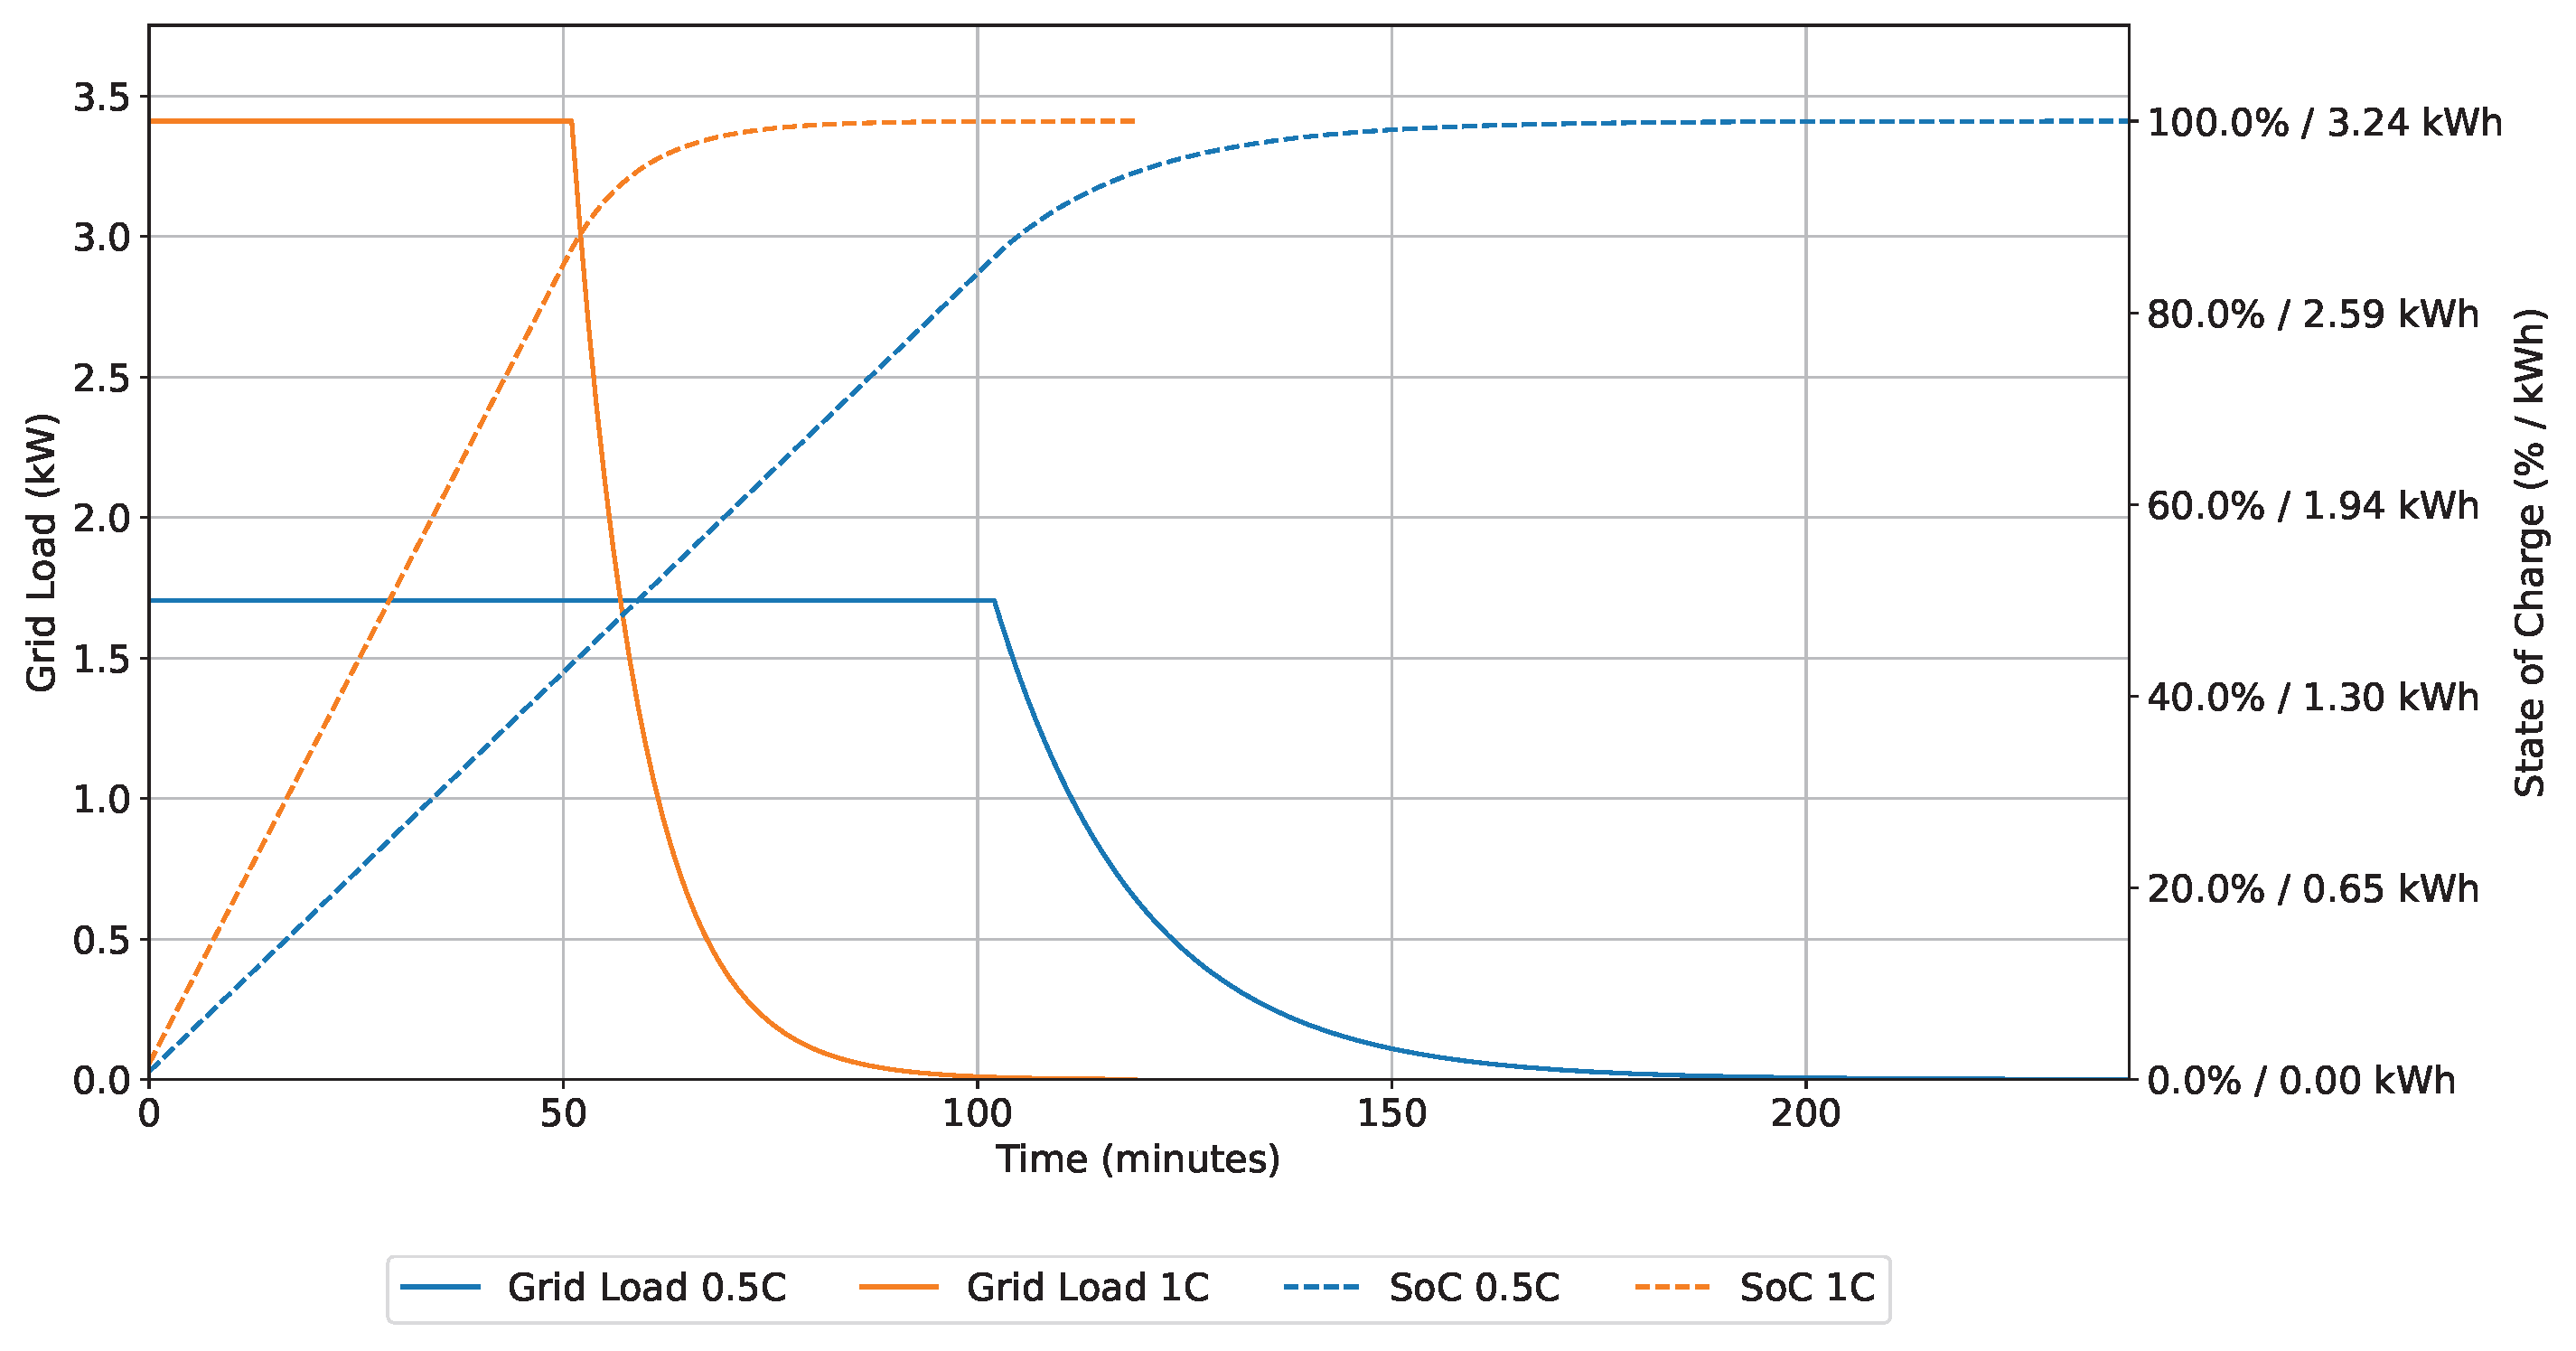
With fast charging, the peak grid loads are 56.26 kW (0.61 kW/bike), 71.69 kW (0.77 kW/bike), and 101.71 kW (1.09 kW/bike) for swapping only, combined swapping and home charging, and home charging only, respectively. This equates to an approximate 25% increase in peak demand across all three approaches when switching to fast charging. We also notice that fast charging creates more volatile grid load profiles, with peaks forming more frequently, many of which surge past the maximum grid load observed for each approach with the standard charger. However, when observing the average load, there is a negligible increase in the maximum grid load. Instead, multiple peaks begin to form, as seen most prominently in the average load for the home charging only scenario.
3.4. Different Efficiencies and Battery Capacities (Data Excluding Bike-Days > 120 km)
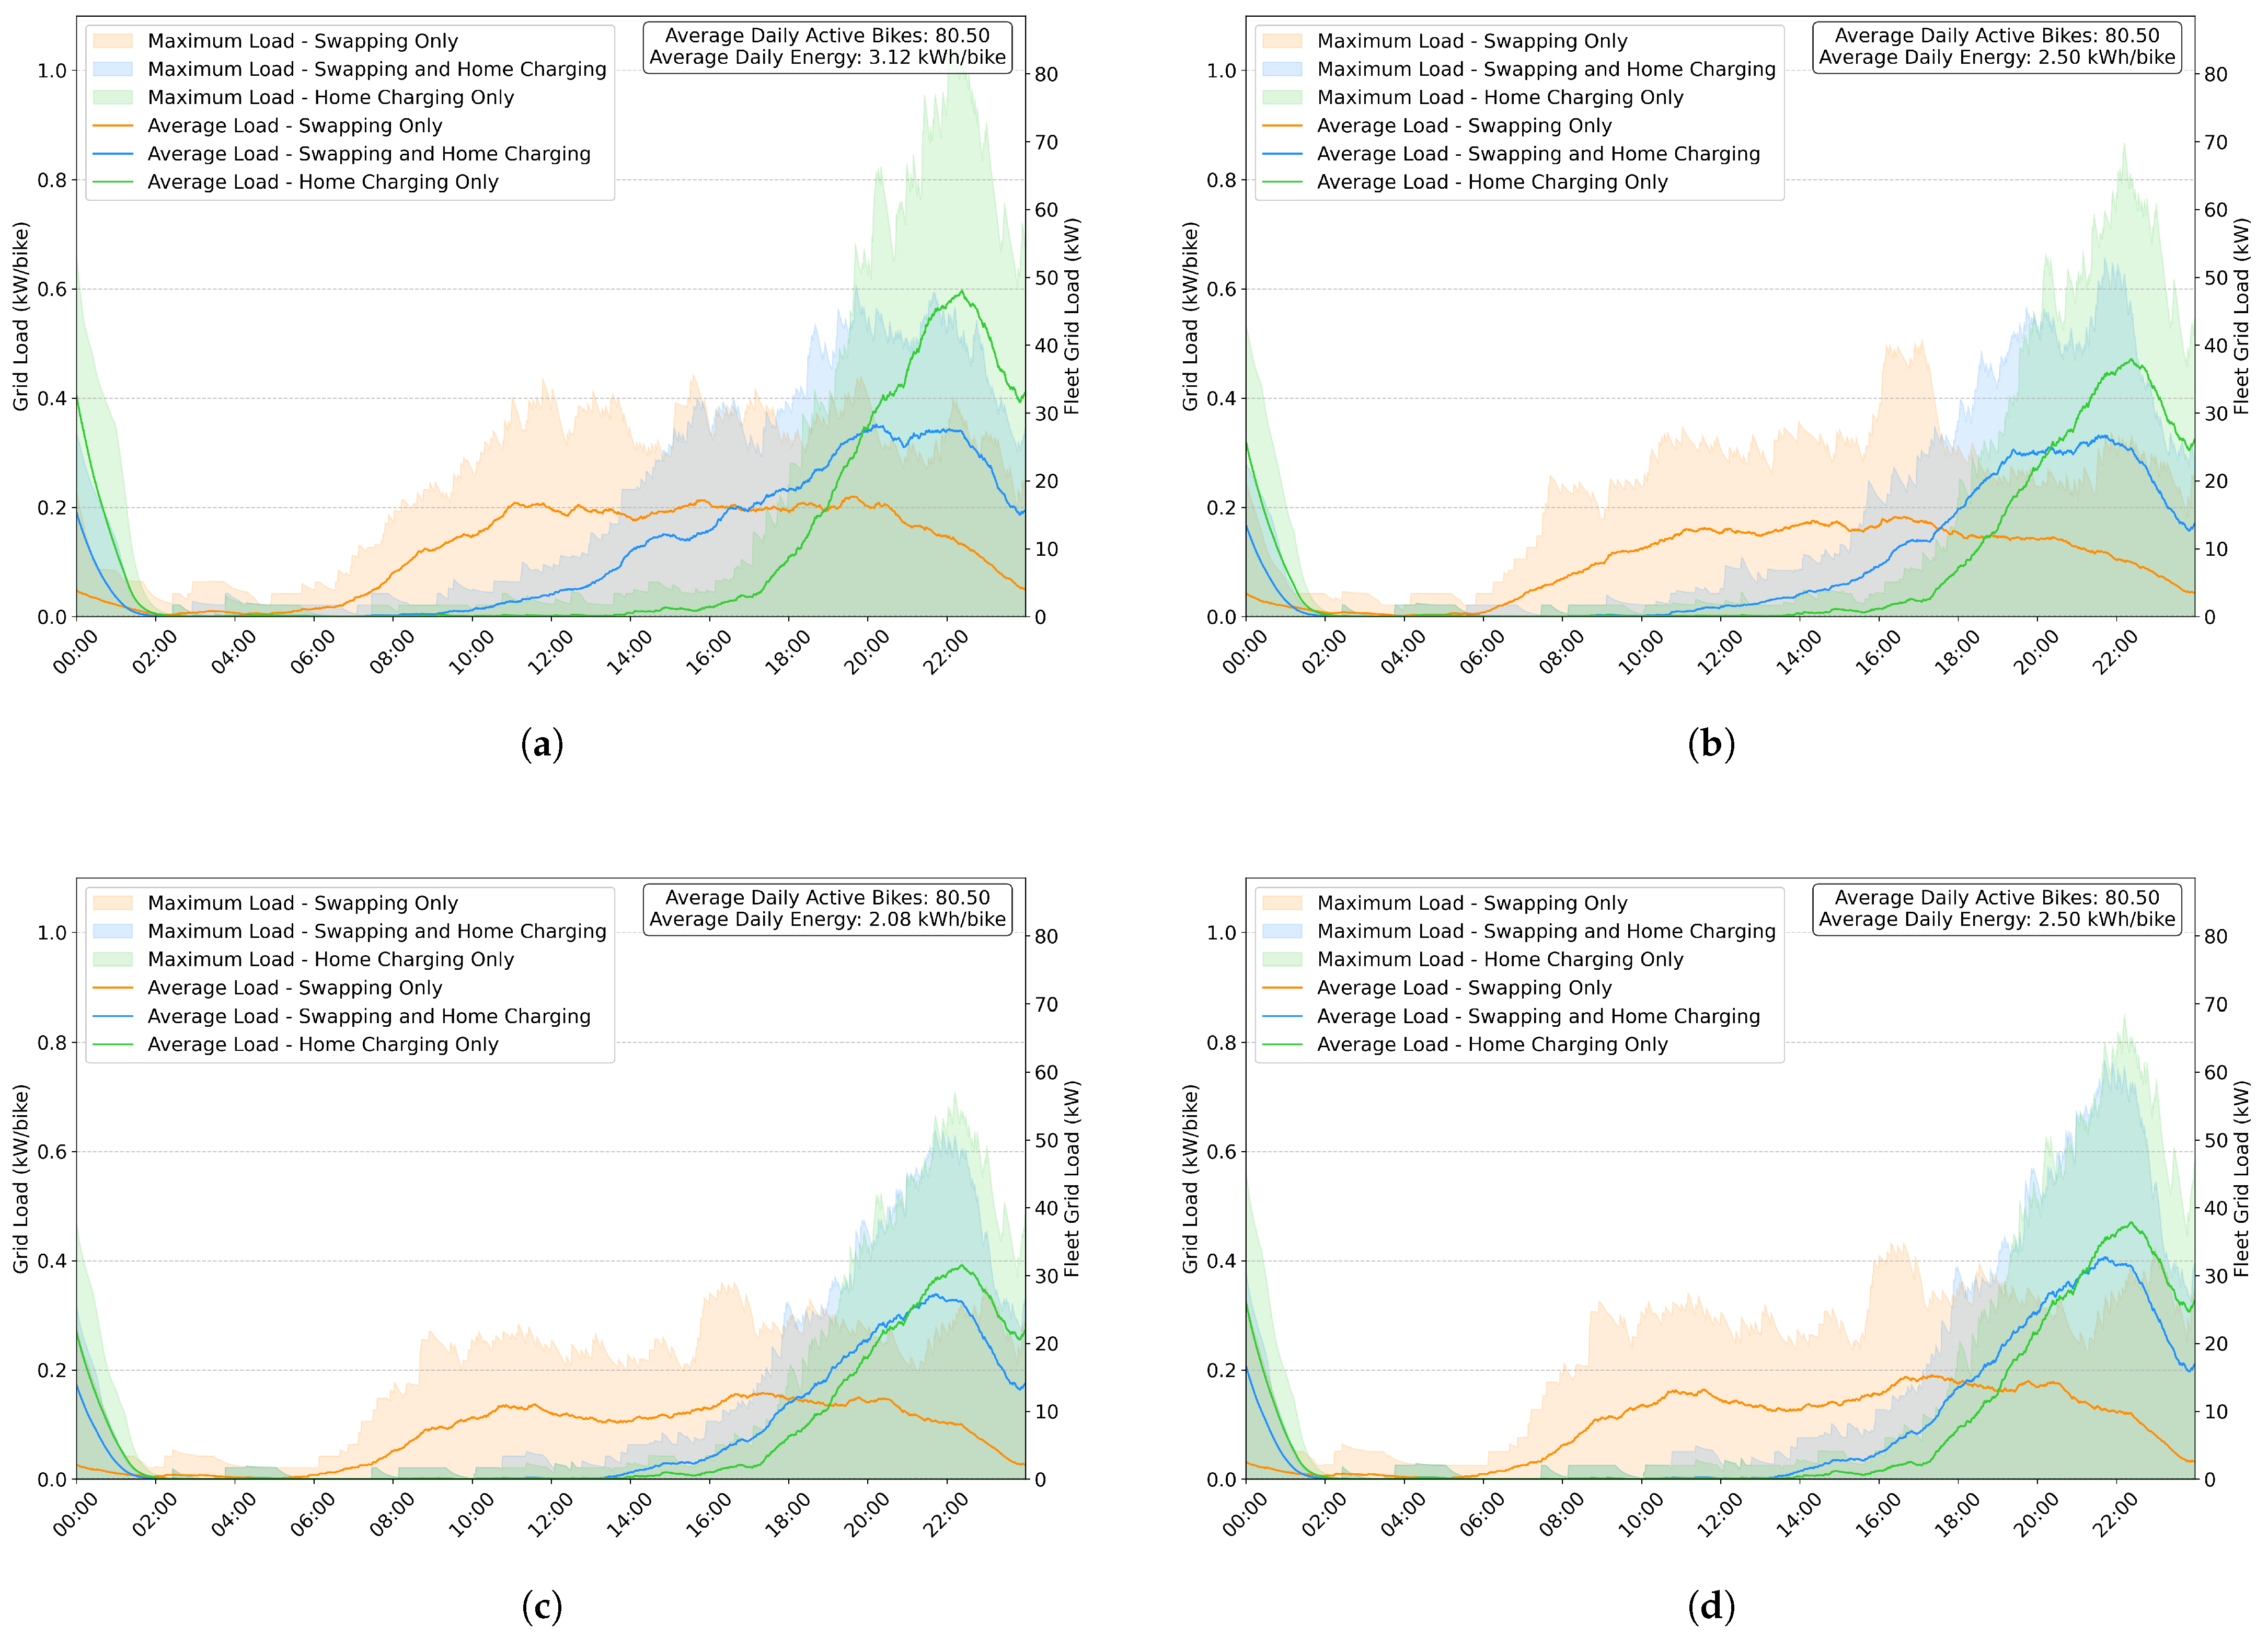
These results use the dataset that excludes all trips contributing to a bike travelling more than 120 km in a day. The average number of daily active bikes is 80.50, again over a 26-day period. This section compares three different efficiencies achieved by the bikes: 23.15 km/kWh (
Figure 5a), 28.94 km/kWh (
Figure 5b,d), and 34.72 km/kWh (
Figure 5c).
Figure 5d shows the result of using the standard efficiency with a battery capacity increased by 20% to 3.888 kWh.
3.4.1. Standard Capacity and Efficiency (Control)
Starting with
Figure 5b, which serves as the benchmark by using the standard efficiency and capacity, the entire fleet consumes an average of 200.10 kWh daily. This averages out to approximately 2.50 kWh per bike. The plot shows a maximum load peak for the
swapping only approach of 40.82 kW (0.51 kW/bike) just after 5 p.m. The combined
swapping and home charging approach resulted in a maximum load peak of 52.94 kW (0.66 kW/bike) much later, just before 10 p.m. Finally, with
home charging only, the maximum peak load occurred just after 10 p.m. with a surge to 69.79 kW (0.87 kW/bike). The
swapping only approach is fairly uniform, with only 33% of the daily average energy being consumed between 6 p.m. and 6 a.m. the next day. This percentage increases to 78% when home charging is included and skyrockets to 95% when only home charging is used.
3.4.2. Standard Capacity, Reduced Efficiency
Figure 5a shows the results for a motorbike with reduced range but standard battery capacity. The average daily energy consumption increases from the benchmark to 3.12 kWh/bike, which is the highest across all tests, even when using a subset of the entire dataset. The lower efficiency also leads to an expected earlier swapping peak for both the
swapping only and combined
swapping and home charging approaches, as bikes cannot travel as far before their first swap of the day. The average grid load for battery swapping is notably evenly distributed, even more so than in the benchmark test. This could be attributed to the range limitation leading to a more uniform State of Charge (SOC) across all bikes at the end of each day. This, in turn, causes evenly distributed swap times on the following day, creating a ’steady state’ in the system. As expected, incorporating home charging with battery swapping results in a more evenly spread average grid load than the benchmark. This is due to more energy being consumed during working hours to keep bikes operational, alongside a similar dependence on home charging. The
home charging only approach exhibits high peaks in the evening, particularly just after 10 p.m., with the maximum grid load surging to 86.68 kW (1.08 kW/bike). This surge is the second highest across all tests, surpassed only by the 1C charging scenario in
Figure 4c at 1.09 kW/bike, emphasising the immense role that efficiency plays in large fleets and scalability.
3.4.3. Standard Capacity, Improved Efficiency
Figure 5c presents a scenario where the bike achieves an increased range with the same battery capacity, indicating improved efficiency. The
battery swapping only approach remains largely the same, although the perfect uniformity seen with the 60 km range is disrupted, forming what appears to be three peaks in the average grid load throughout the day (around 11 a.m., 5 p.m., and just after 8 p.m.). The maximum grid load peaks at 29.05 kW (0.36 kW/bike), 51.46 kW (0.64 kW/bike), and 57.07 kW (0.71 kW/bike) for
swapping only, combined
swapping and home charging, and
home charging only, respectively. This equates to reductions of up to 28% in peak load. The most noticeable change, however, lies in the similarity between the combined
swapping and home charging and the
home charging only approaches. As the bike range increases to 90 km, surpassing the mean daily distance travelled per bike for this dataset (68.68 km), the two approaches become largely identical. The only differences arise from the small subset of days where a bike travels more than 90 km. This causes the approach that includes home charging to consume over 87% of its total energy between 6 p.m. and 6 a.m. the next day, compared to only 36% consumed during these hours with the
battery swapping only approach. The average daily energy consumption is reduced from the benchmark to 2.08 kWh/bike.
3.4.4. Increased Capacity, Standard Efficiency
Figure 5d shows the results for a bike that can travel 90 km on a single charge, achieved by increasing the battery capacity while maintaining the same efficiency. The plot closely mimics that of
Figure 5c, but with a grid load inflated by 20%. This is intuitive, as the larger battery capacity demands more energy from the grid, while the timing of battery swaps remains identical. The average daily energy consumed is 2.50 kWh/bike, the same as the benchmark, which is expected since the efficiency is unchanged. The result is a fleet that tends to heavily favour home charging over battery swapping when the option is available. The maximum load peak for
home charging only towers above the other scenarios, surging to a power level similar to the benchmark at around 0.87 kW/bike.
3.5. Solar Augmentation
To best compare the approaches in this section, the dataset excluding bike-days exceeding 150 km is used.
Figure 6 includes the same grid impact information as
Figure 4b but adds a solar profile scaled to achieve net-zero energy consumption. The net grid load throughout the day (average grid load minus average solar power) is plotted using dotted lines for all three approaches.
In this case, the average solar offsetting capacity averages out to around 558 Wp/bike (0.56 kWp/bike). However, this differs significantly for each approach when analysing how much energy can be offset directly versus how much needs to be stored for later use. The
battery swapping only approach allows for the highest percentage of directly harnessed solar energy, at 51% (from 07:15 to 15:59). Including home charging decreases this percentage to just 15% (from 06:01 to 16:18), while the
home charging only approach can only harness less than 3% (from 17:26 to 06:00) of the solar energy directly. This implies that the excess energy would need to be stored for later use. This indicates that a battery-swapping approach is well-complemented by solar offsetting. However, even having the option to charge at home heavily disrupts the benefits of direct solar offsetting, with direct offsetting capabilities plummeting by more than threefold compared to the
battery swapping only approach. The positive aspect of this is that Kenya is not a solar-dependent country, with solar power constituting only 4% of its grid, according to [
10]. However, the properties of geothermal generation, which makes up over 40% of the grid, mean that these plants can consistently generate over 4 TW of power throughout the day, come sunshine or rain. This unique grid characteristic makes the home charging approach more attractive to Kenyan policymakers. With EV charging peaks occurring around 10 p.m., as seen throughout the results, the grid load likely decreases as households go to sleep, creating capacity for this additional demand. For other countries, such as South Africa, the grid is not as diverse. For example, as of 2023, approximately 82% of its grid was dependent on coal and only 1% on renewables [
27]. The benefits of solar offsetting for electric vehicles would be strongly worth considering in a country like South Africa.
4. Conclusions
In conclusion, let us consider the implications if all 2.2 million boda bodas in Kenya were electrified tomorrow, based on the results of this study. Daily
emissions would decrease from approximately 9519 tonnes within the city to 1470 tonnes dispersed at the points of electricity generation. Daily tailpipe
emissions in the city would decrease from 847 kg to 0 kg. The average daily energy demand would increase by 6.85 GWh, contributing approximately 2.5 TW of additional demand annually, representing a 23% increase in yearly demand. Lower efficiencies could increase this demand to 8.22 GWh, while improved efficiencies could reduce it to approximately 5.48 GWh. Maximum loads would also increase significantly. With
home charging only, peaks could be as high as 1.95 GW, potentially increasing to 2.40 GW with fast charging or if bikes have 20% lower efficiency. However, a 20% improvement in efficiency could reduce these peaks to around 1.56 GW. Maximum peaks are consistently highest when only home charging is employed. As battery swapping becomes the dominant method, grid loads tend to decrease and become more evenly distributed throughout the day, in some cases reducing maximum peak loads by up to 60%, as seen in
Figure 5a. An evenly distributed grid load is best achieved with the
battery swapping only approach. This approach also favours solar offsetting, with about half of the additional 6.85 GWh demand (approximately 3.42 GWh) able to be directly offset by a net-zero installation. However, this would require a solar plant in Nairobi with a peak capacity of around 1.36 GWp. To achieve a completely net-zero impact, the excess 3.42 GWh would need to be stored (assuming 100% charging efficiency), which would require approximately 1 million of the standard batteries used in this experiment. This, however, represents the best-case scenario. The feasibility of solar offsetting diminishes as home charging is introduced, increasing the storage requirement to 5.82 GWh (approximately 1.8 million standard batteries), and further still with the
home charging only approach, to 6.64 GWh (approximately 2 million standard batteries).
These conclusions are based on various assumptions, and the results on a per-bike level most definitely do not scale in a perfectly linear manner. However, this provides an indication of the potential impact of electrifying boda bodas at a large scale in Kenya. Kenya’s unique grid makes the prospect of electrification particularly impactful, given that the carbon emission factor of its grid is especially low at 0.226 kg
/kWh. For example, South Africa’s national grid emission factor was 0.931 kg
/kWh in 2023, more than four times higher than Kenya’s [
28]. Ultimately, the results, as expected, show a reduction in urban
and
emissions. They also demonstrate an increased energy demand and peak grid load caused by charging electric vehicle batteries. The
battery swapping only approach leads to evenly distributed grid loads, whereas the
home charging only approach creates higher peaks in the evenings. The extent of these effects not only depends on the factors considered in this study (such as distance travelled, efficiency, battery capacity, and charging speeds) but also extends to other factors like topography, vehicle payload, and operating temperatures. This is not to mention the expected degradation in battery health over time. Overall, however, many of the main contributing factors have been accounted for, and a framework has been developed for future replication of this study in other dynamic and unique urban areas similar to Nairobi.
4.1. Limitations and Future Work
This work presented environmental and grid impact assessments of boda boda electrification in Nairobi, Kenya. However, the work is not without limitations. First, due to the dearth of data in the sector, the dataset used is fairly small. It is suggested that future studies leverage the emerging availability of larger datasets. Second, this study is relevant to Nairobi, Kenya, its solar characteristics, and its grid’s relatively low emissions factor. It is suggested that further work be performed to evaluate the impact on other cities in the region with more seasonally variant solar profiles and more fossil-fuel-dependent electricity grids. Third, the focus of this work was a technical assessment, but future works should evaluate the broader impact of electrification, considering the financial implications, impact on health, and impact on the national fiscus of reduced fuel and vehicle imports.
4.2. Policy Implication
To ensure equitable access to electric boda bodas, especially for low-income operators, policies must address the high upfront cost of electric vehicles relative to conventional alternatives. Governments and stakeholders should consider subsidised financing schemes, battery leasing models, and tax incentives that lower the barrier to entry for informal operators. Public–private partnerships could facilitate the establishment of affordable battery-swapping infrastructure, which this study shows reduces peak grid loads and aligns well with solar offsetting strategies.
Although electric boda bodas may incur higher upfront costs, this study and others suggest that their long-term maintenance and operational costs are significantly lower than those of their ICE counterparts due to fewer moving parts and higher energy efficiency. Policymakers should thus promote lifecycle cost awareness campaigns to inform operators of long-term savings, potentially supporting broader uptake.
International financial institutions (IFIs) can play a pivotal role by funding pilot projects, underwriting battery-swapping infrastructure, and offering concessional loans or guarantees to de-risk private sector investment in e-mobility. In parallel, IFIs can provide technical assistance to support standardisation of battery and charging systems and the development of inclusive regulatory frameworks that protect small-scale operators while enabling innovation.
Currently, the vast majority of vehicles are imported and so is the energy (fuel) that propels them. The transition to electric motorbikes provides a unique opportunity to establish local and fit-for-purpose vehicle production in the region and to boost energy self-sufficiency through local electricity generation.
Finally, to ensure that peak vehicle charging demand coincides with green energy availability, smart metering, with time-of-use metering and variable tariffs, and green energy trading schemes should be incentivised.


