Abstract
Traditional collision risk warning methods primarily focus on vehicle-to-vehicle collisions, neglecting conflicts between vehicles and vulnerable road users (VRUs) such as pedestrians, while the difficulty in predicting pedestrian trajectories further limits the accuracy of collision warnings. To address this problem, this study proposes a vehicle-to-everything-based (V2X) multi-fusion vehicle–pedestrian collision warning method, aiming to enhance the traffic safety protection for VRUs. First, Unmanned Aerial Vehicle aerial imagery combined with the YOLOv7 and DeepSort algorithms is utilized to achieve target detection and tracking at unsignalized intersections, thereby constructing a vehicle–pedestrian interaction trajectory dataset. Subsequently, key foundational modules for collision warning are developed, including the vehicle trajectory module, the pedestrian trajectory module, and the risk detection module. The vehicle trajectory module is based on a kinematic model, while the pedestrian trajectory module adopts an Attention-based Social GAN (AS-GAN) model that integrates a generative adversarial network with a soft attention mechanism, enhancing prediction accuracy through a dual-discriminator strategy involving adversarial loss and displacement loss. The risk detection module applies an elliptical buffer zone algorithm to perform dynamic spatial collision determination. Finally, a collision warning framework based on the Monte Carlo (MC) method is developed. Multiple sampled pedestrian trajectories are generated by applying Gaussian perturbations to the predicted mean trajectory and combined with vehicle trajectories and collision determination results to identify potential collision targets. Furthermore, the driver perception–braking time (TTM) is incorporated to estimate the joint collision probability and assist in warning decision-making. Simulation results show that the proposed warning method achieves an accuracy of 94.5% at unsignalized intersections, outperforming traditional Time-to-Collision (TTC) and braking distance models, and effectively reducing missed and false warnings, thereby improving pedestrian traffic safety at unsignalized intersections.
1. Introduction
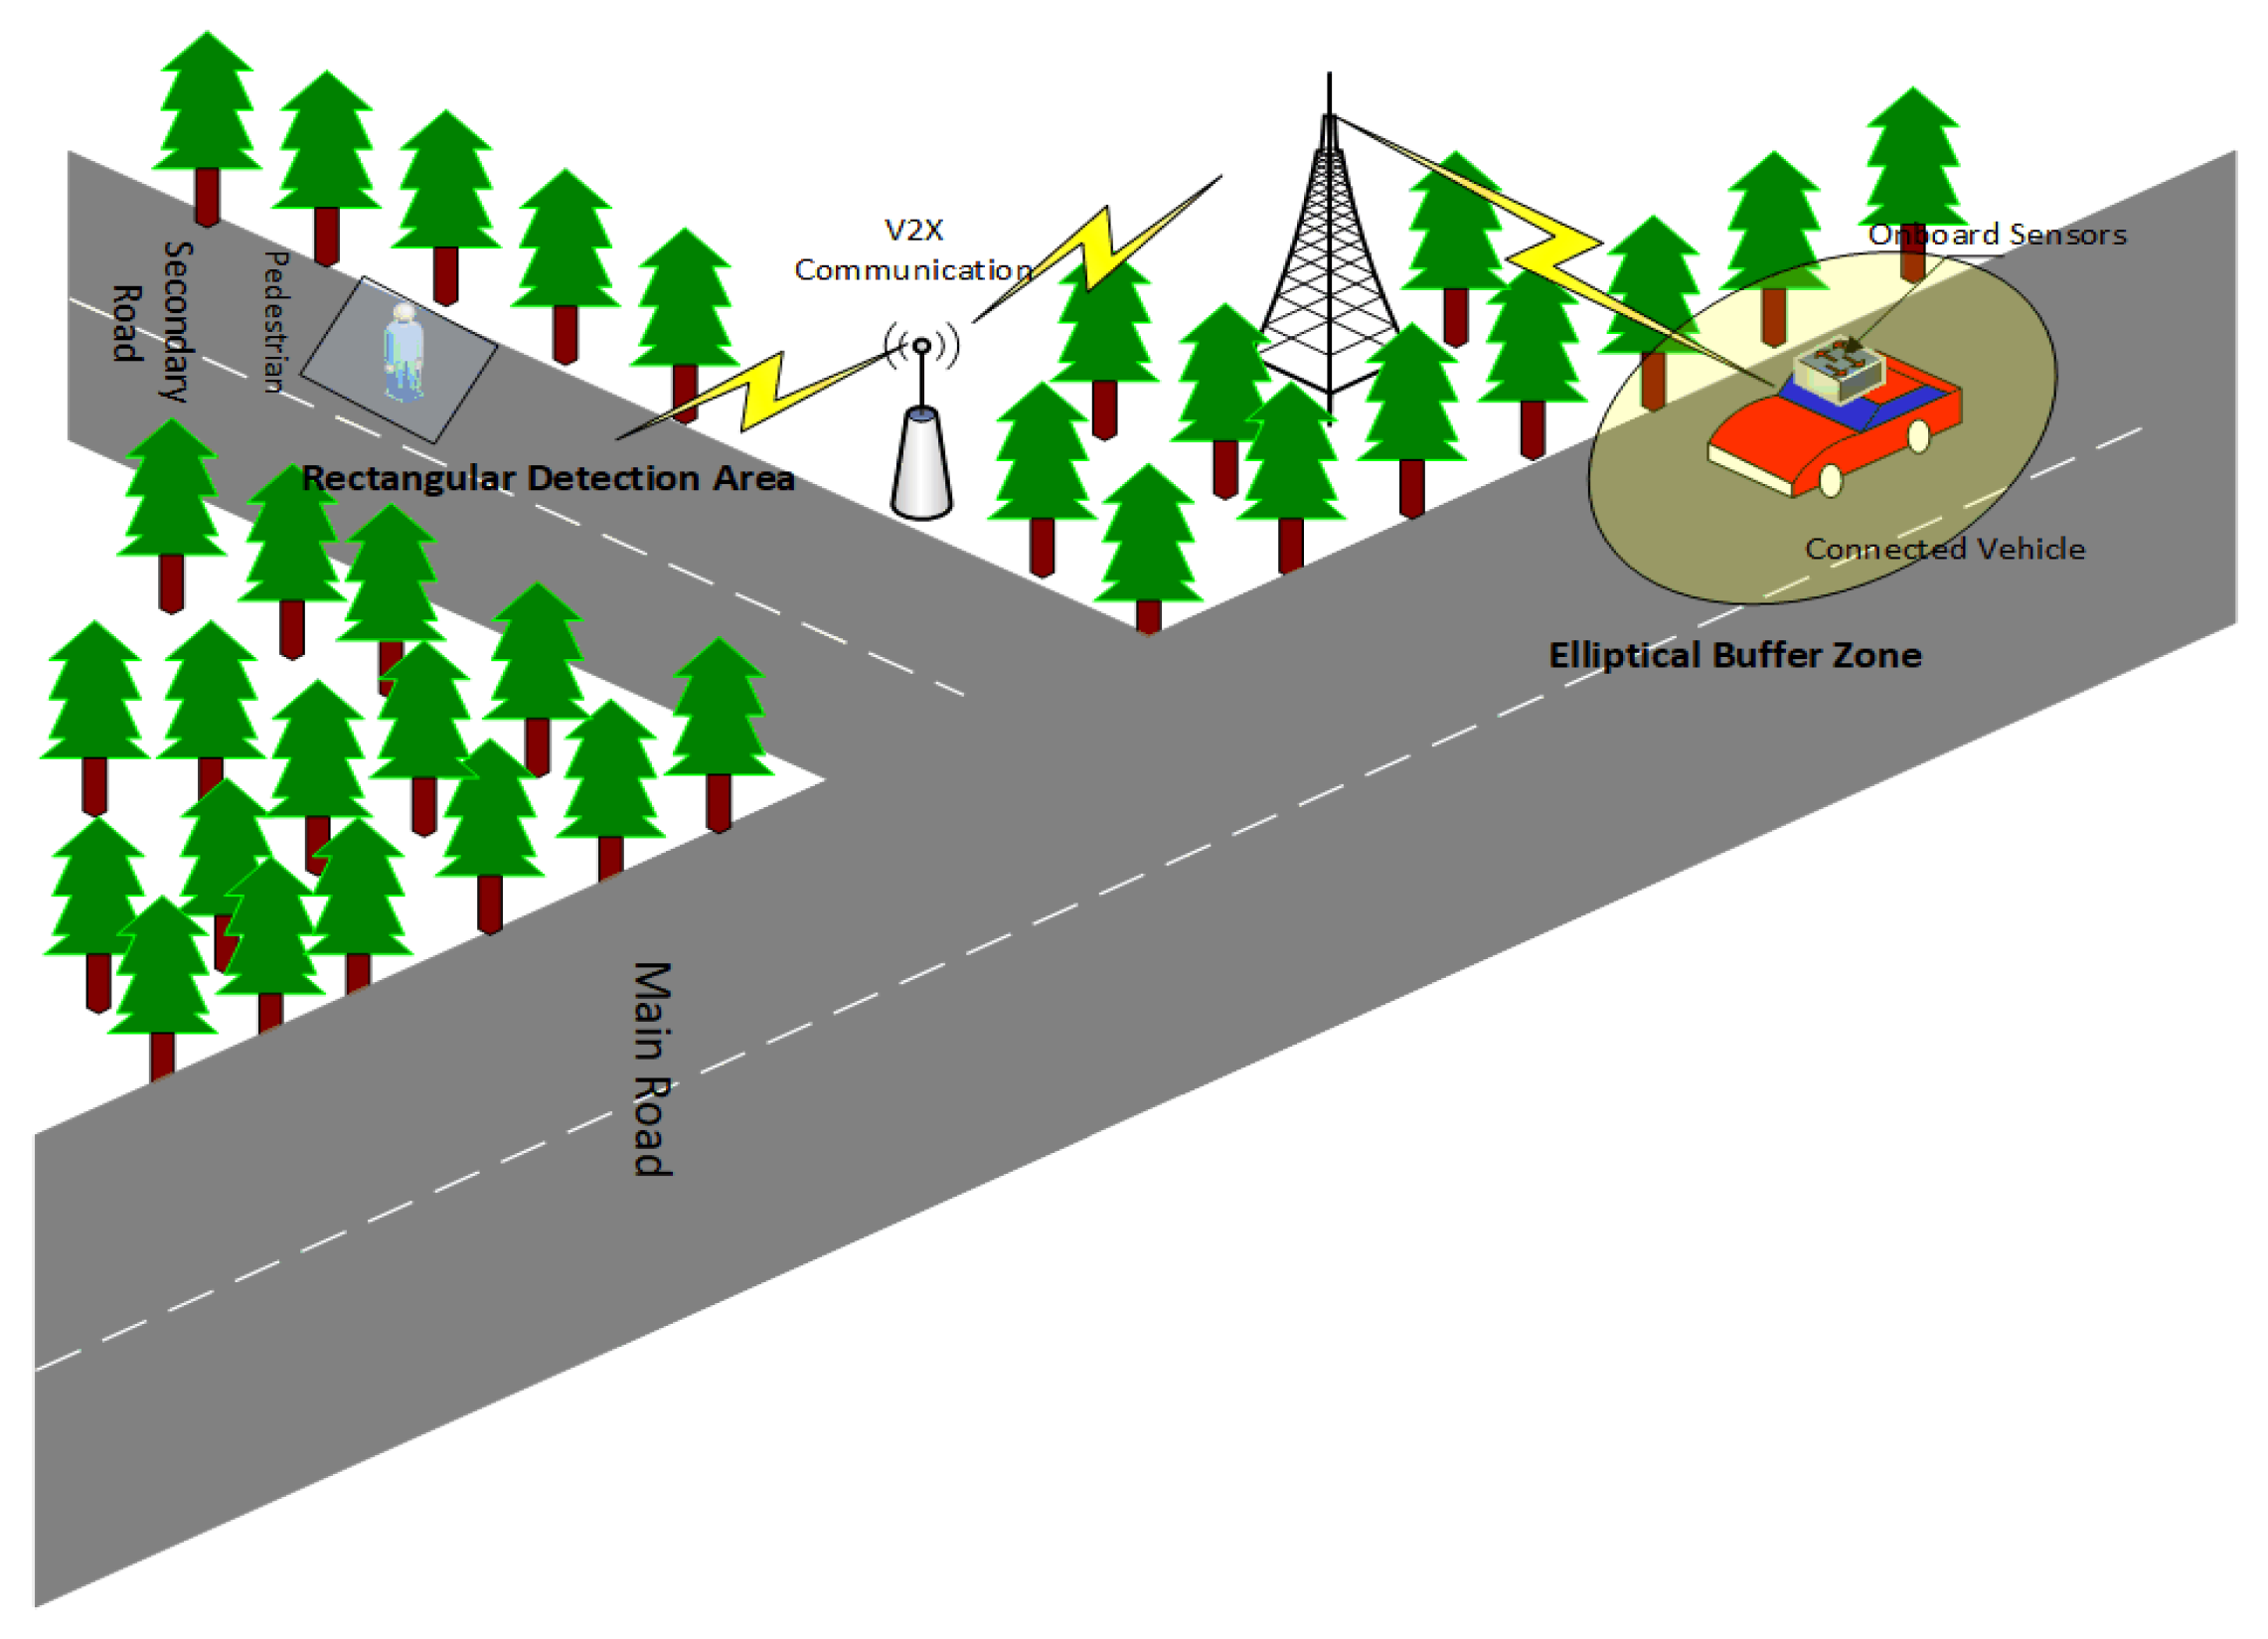
With the rapid development of modern industry, the number of vehicles worldwide continues to rise, and frequent traffic accidents have had a profound impact on the economy and society, making traffic accident prevention research increasingly urgent [1]. Especially at unsignalized intersections, due to obstructed driver visibility, high vehicle speeds, frequent crossings by non-motorized vehicles and pedestrians, and other factors such as trajectory uncertainty, traffic accidents occur frequently. To address the intense conflicts between vehicles, non-motorized vehicles, and pedestrians at unsignalized intersections, it is necessary to explore a new method for intersection conflict warning to significantly reduce accident rates and further improve traffic safety.
Intersection Collision Warning (ICW) technology is an important component of vehicle active safety technology. Early collision warning systems primarily relied on radar and cameras to perceive the surrounding environment and issue collision warnings to the driver [2]. However, the limitations of traditional sensors (such as obstruction by obstacles) have restricted the effectiveness and further development of collision warning systems [3]. In recent years, the rise of technologies such as Vehicle-to-Vehicle Communication (V2V) and Vehicle-to-Infrastructure Communication (V2I) has enabled traffic participants to achieve comprehensive and real-time information sharing, becoming a new hot topic in collision risk identification and warning research.
The collision risk at unsignalized intersections is essentially an issue of motion conflicts between traffic participants. Commonly used conflict risk identification indicators are mainly divided into two categories: time-space conflict indicators and probability conflict indicators. Time-space conflict-based warning methods predict potential collision risks by evaluating the time and spatial relationships between vehicles. Among them, Time to Collision (TTC) is a commonly used evaluation indicator. For example, Miller et al. [4] proposed an intersection collision detection method based on TTC, performing risk assessment by calculating the TTC of vehicles. Lan et al. [5], addressing the conflict between right-turning vehicles and pedestrians, used TTC, Post Encroachment Time (PET), and Deceleration to Safety Time (DST) as evaluation indicators. They found that TTC and PET were negatively correlated with the severity of conflict, while DST was positively correlated. Guo et al. [6,7,8,9] proposed an improved TTC calculation method and optimized the application of rectangular and elliptical models in conflict detection based on geometric models, enhancing calculation accuracy and real-time performance. In addition, safety distance warning methods assess risk by analyzing the distance change in vehicle movement. Han et al. [10] proposed a longitudinal and lateral TTC difference model for collision scenarios between cars and electric two-wheelers, optimizing the trigger strategy of the Autonomous Emergency Braking (AEB) system, improving collision avoidance rates, and reducing collision injuries. Li et al. [11] proposed a location fusion algorithm based on unscented Kalman filtering, improving positioning accuracy and vehicle safety when positioning fails. Zhao et al. [12], based on V2I communication, proposed a warning method combining Dynamic Detection of Collision (DDTC) and Collision Avoidance with Circular Trajectory (CATC), which reduced missed and false alarms.
Although time-space conflict-based warning methods have the advantages of low computation and ease of operation, they rely on a single indicator (such as TTC or PET), making it difficult to address complex traffic scenarios. Moreover, probability conflict-based warning methods introduce uncertainty probability models to quantify the collision risk of vehicles or pedestrians for evaluation. For example, Laugier et al. [13] used the Hidden Markov Model (HMM) and Gaussian processes to identify vehicle behavior, predict future collision risks, and validate its effectiveness in uncertain environments. Joerer et al. [14] evaluated the collision risk of all possible vehicle trajectories using acceleration probability distributions, further improving detection accuracy. Berthelot et al. [15] proposed a TTC probability distribution calculation method based on uncertain inputs, enhancing the system’s reliability by handling input noise. For pedestrian collision risks, Peng et al. [16] proposed a stochastic geometry model for pedestrian collision zones based on V2I communication technology, considering factors such as communication delay and positioning errors, and established a pedestrian-vehicle collision probability model, which was validated through simulation experiments in complex scenarios. Yang et al. [17] constructed a real-time collision risk warning model for pedestrians and vehicles based on catastrophe theory, evaluating it using binary logistic and catastrophe degree methods. Jin et al. [18] proposed a warning method based on intersection vehicle collision probabilities, predicting the vehicle’s future behavior and calculating collision probabilities, which was validated through simulation.
In summary, pedestrian behavior at unsignalized intersections, which are characterized as high-risk scenarios, exhibits considerable uncertainty. Furthermore, traditional collision warning methods suffer from limited capability in modeling trajectory diversity and rely on single risk assessment mechanisms, resulting in inadequate adaptability and warning accuracy in complex mixed traffic environments. To address these challenges, this paper focuses on potential conflicts between vehicles and pedestrians and proposes a multi-fusion collision warning method under the Vehicle-to-Everything (V2X) communication environment, aiming to enhance the traffic safety protection of vulnerable road users (VRUs) in typical unsignalized scenarios. Specifically, the proposed method employs the Monte Carlo (MC) algorithm as the core framework, integrating the social generative adversarial network (Social GAN) and a soft attention mechanism to achieve robust pedestrian trajectory prediction in complex traffic interaction scenarios. Trajectory samples are generated by adding Gaussian noise to the mean trajectory to support the warning algorithm. Moreover, an elliptical buffer zone algorithm is employed to dynamically construct the risk detection module, achieving a collision detection mechanism that balances accuracy and computational efficiency. This study systematically advances from behavior modeling and risk assessment to warning decision-making, with the objective of improving pedestrian risk identification and collision warning capabilities at unsignalized intersections, thereby providing theoretical foundations and technical solutions for enhancing road traffic safety.
The remainder of this paper is organized as follows: Chapter 2 describes the data sources and preprocessing procedures; Chapter 3 details the design of each algorithmic module, including vehicle motion modeling, pedestrian trajectory prediction, and risk detection methods; Chapter 4 develops the integrated warning algorithm framework and introduces the collision probability evaluation mechanism; Chapter 5 presents simulation experiments and comparative analyses to validate the effectiveness of the proposed method under typical scenarios; finally, Chapter 6 concludes the paper and discusses future research directions.
2. Dataset
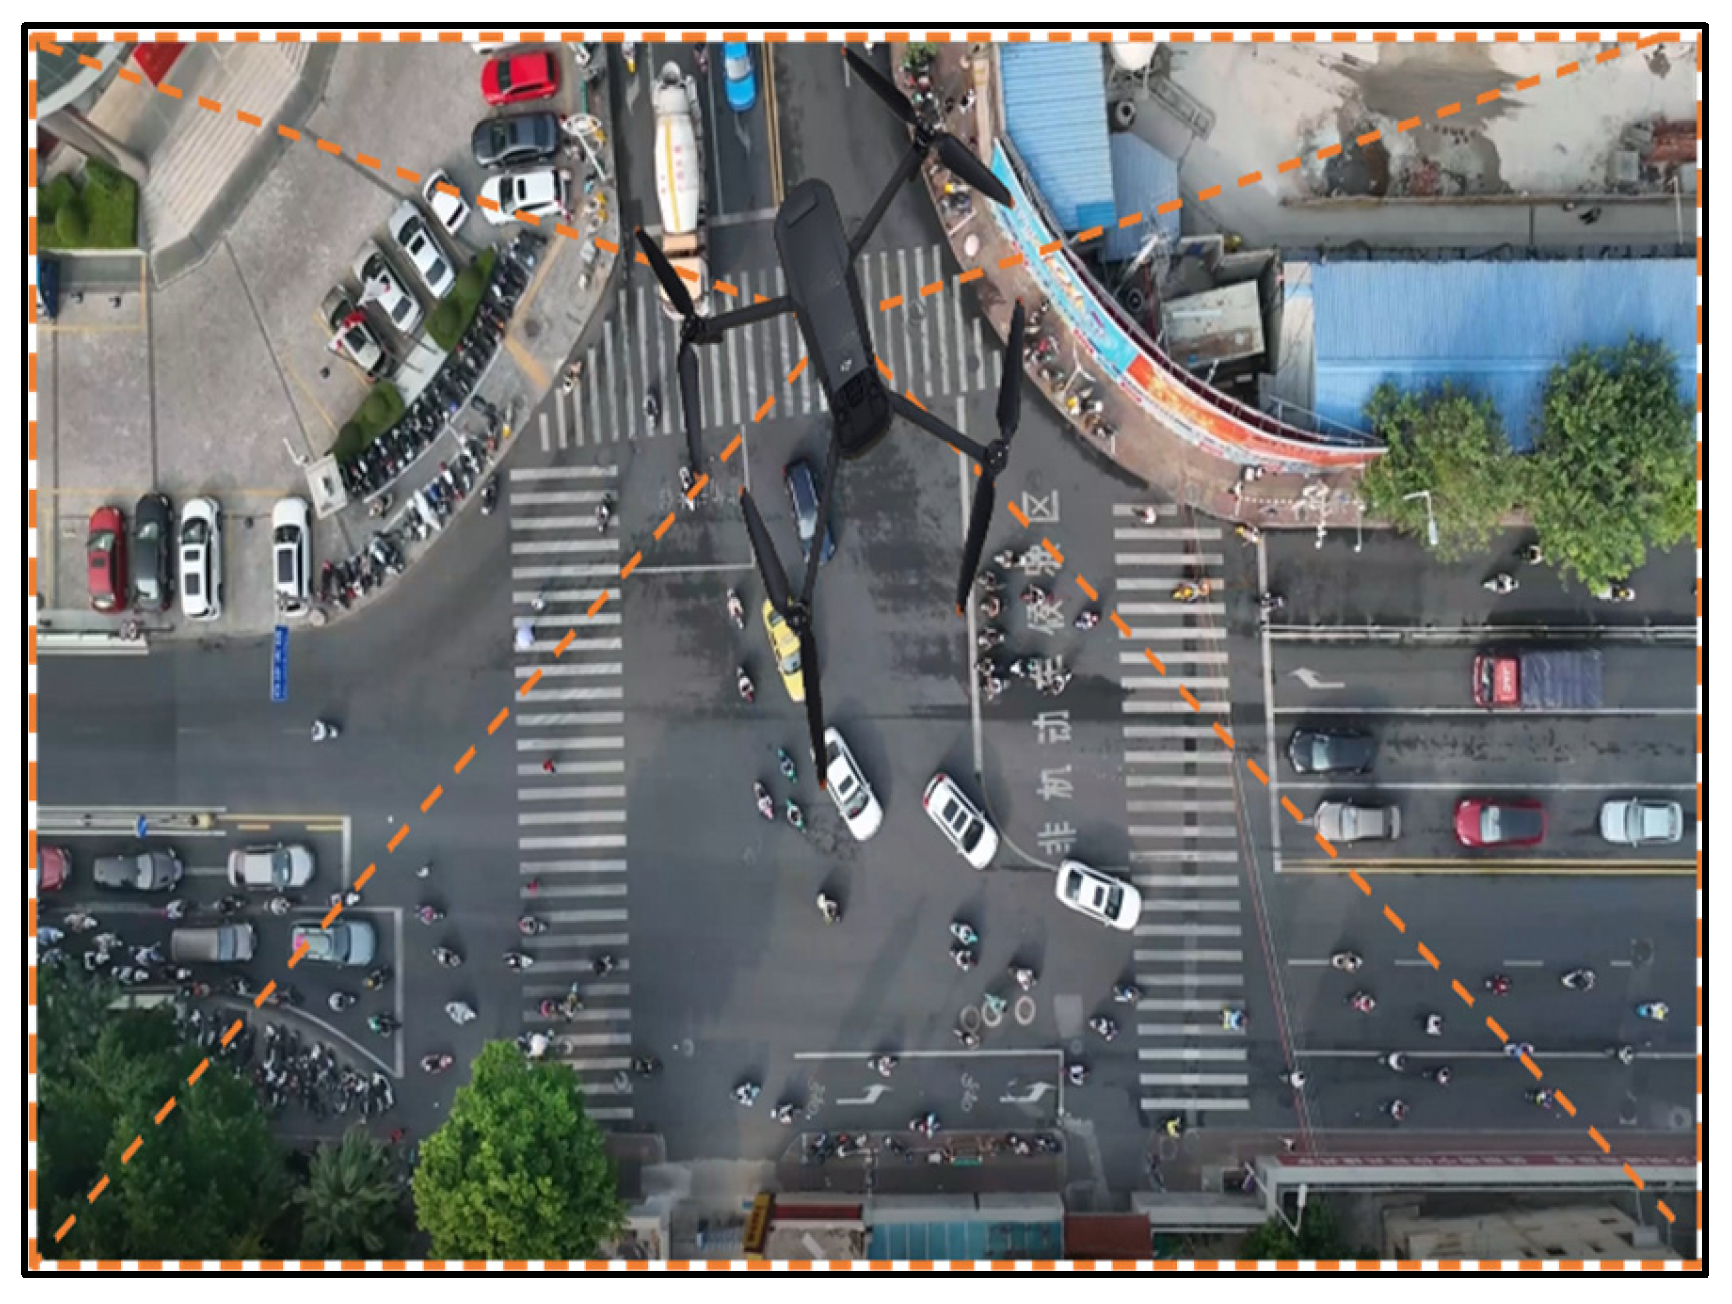
To obtain high-quality training samples, this study employed DJI Mavic 3 series unmanned aerial vehicles to conduct field aerial photography at several typical unsignalized intersections in Guilin City, Guangxi Province, collecting high-resolution video data involving multiple types of traffic participants, as shown in Figure 1. Subsequently, based on the YOLOv7 object detection algorithm and the DeepSort multi-object tracking algorithm, this study performed target identification and trajectory tracking of various traffic participants in the videos (see Figure 2), obtaining the initial trajectory data of vehicles and pedestrians. On this basis, after data filtering and processing, an interactive dataset containing the trajectories of 500 pedestrians was constructed. The dataset records traffic dynamic information at a frequency of 30 frames per second, covering key parameters such as interaction event identifiers, pedestrian longitudinal and lateral coordinates, velocities and accelerations, vehicle positions, velocities and accelerations, as well as the relative distances between pedestrians and vehicles, providing essential data support for subsequent trajectory modeling and collision risk prediction.
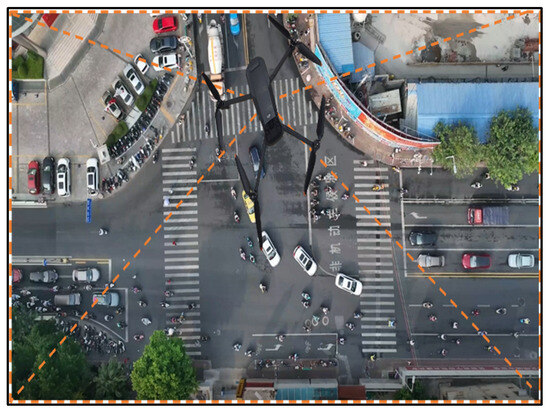
Figure 1.
Example of an unsignalized intersection scene.
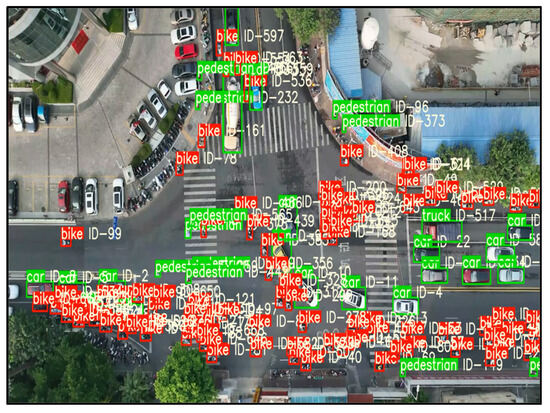
Figure 2.
Example of target identification and tracking.
3. Modular Algorithms
To develop a collision warning model suitable for unsignalized intersection scenarios, this study constructed a vehicle trajectory motion module, a pedestrian trajectory prediction module, and a risk detection module. Specifically, considering that motor vehicles exhibit relatively stable behavioral patterns and adhere to traffic rules during travel, this study employed a kinematics-based modeling approach for trajectory fitting. In contrast, given the high motion uncertainty and frequent path changes of pedestrians, this study further introduced a generative adversarial network (GAN) to model pedestrian trajectories, aiming to enhance the ability to predict pedestrians’ future movement trends. To address the insufficient spatial conflict recognition accuracy of traditional collision detection methods in dynamic interaction scenarios, this study designed a collision detection algorithm based on the elliptical buffer region in order to improve the spatial collision judgment between pedestrians and motor vehicles at unsignalized intersections.
3.1. Vehicle Trajectory Motion Module
This study adopts a simplified two-dimensional planar kinematics model (see Figure 3) as the vehicle trajectory motion module in the warning algorithm to describe the motion characteristics of vehicles at unsignalized intersections, including state parameters such as vehicle position, velocity, and acceleration. Based on real-time vehicle state data provided by V2X communication, a vehicle state vector is constructed to achieve dynamic updating of the vehicle’s position. On this basis, the future trajectory of the vehicle on the plane is further predicted, providing necessary trajectory information support for the subsequent collision risk warning algorithm, as detailed in Equations (1) and (2).
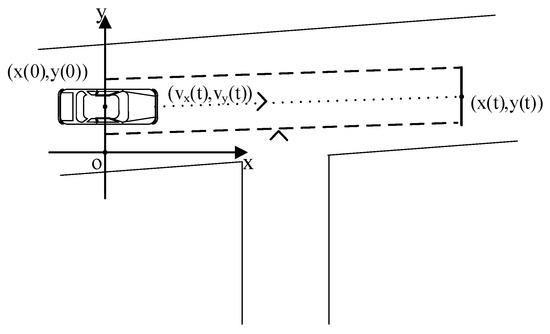
Figure 3.
Vehicle motion trajectory diagram.
In the equations, and represent the position coordinates of the vehicle on the two-dimensional plane at time , while and represent the vehicle’s positions at the previous time The vehicle’s velocity components at time are denoted by and , with corresponding to the velocities in the and directions, respectively.
3.2. Pedestrian Trajectory Prediction Module
Based on the Social GAN model [19], this paper proposes an improved Attention-based Social GAN (AS-GAN) model for developing the pedestrian trajectory prediction module in the warning algorithm. The overall model structure is shown in Figure 4, and the model mainly consists of the input layer, pooling layer, interactive attention mechanism, and the generative adversarial network, which is further divided into the generator and discriminator. In this model, the target’s historical trajectory information and surrounding interaction data are used as inputs, and the generator, with the help of the interactive attention mechanism module, generates the trajectory sequence of the target over a specific future time span based on the input data. Subsequently, the discriminator performs authenticity discrimination on the generated trajectory sequence. Finally, the model outputs an individual predicted trajectory sequence that highly matches the distribution of real-world scenarios. This sequence, as the mean trajectory, will be introduced into the MC sampling stage of the subsequent collision risk warning model.
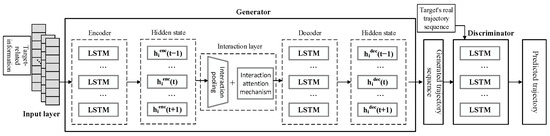
Figure 4.
Network architecture for pedestrian trajectory prediction.
3.2.1. Model Input
In the AS-GAN model, the first 8 time steps of historical trajectory data are input into the interactive attention layer, where the attention mechanism captures the pedestrian’s movement trends and potential intentions. The Long Short-Term Memory (LSTM) then generates trajectory predictions for the next 12 time steps, each with a time step interval of 0.4 s. To capture the dynamic changes in the trajectory, the model simultaneously considers the status information of the target pedestrian and their surrounding interacting objects. This status information is described by dynamic features such as position, velocity, and acceleration and is represented as the state vector .
In the equation, represents the state of the predicted pedestrian at time , including the lateral coordinate , longitudinal coordinate , velocity , and acceleration . represents the state of the interacting vehicle target at time , including the identifier of the interacting target, position , velocity , acceleration , and relative distance .
3.2.2. Encoder and Decoder
The encoder and decoder together form the foundation of the AS-GAN model. In the encoding stage, the model encodes the pedestrian’s historical states through an LSTM network, thereby capturing the pedestrian’s movement features. In the decoding stage, the model combines historical information with interaction features to generate the pedestrian’s future trajectory. This structure enables the model to predict future movement states based on historical trajectories and enhances the robustness of the prediction by incorporating interaction features from the traffic environment, as detailed in Equations (4) and (5).
In the equation, represents the historical encoded vector of the target pedestrian at time , serving as the input state information . denotes the predicted trajectory of the pedestrian at future time . is the context vector in the decoder input.
3.2.3. Interaction Feature Extraction and Attention Module
The interaction pooling layer and the interaction attention mechanism jointly constitute the interaction layer of the AS-GAN model. The interaction pooling layer extracts temporal interaction features based on the interaction information between the pedestrian and surrounding interactive objects, providing input for subsequent tasks such as trajectory prediction. Meanwhile, this study introduces the Soft Attention Mechanism from reference [14] as the interaction attention mechanism module, assigning weights to different interactive objects to enable the model to focus on factors influencing pedestrian trajectories, thereby improving the accuracy and robustness of subsequent trajectory prediction, as detailed in Equations (6) and (7).
In the equations, represents the interaction feature vector, and , , , and represent the position information, velocity, and acceleration of pedestrians and vehicles, respectively, while denotes the relative distance between pedestrians and vehicles. determines the importance of each interactive object in pedestrian trajectory prediction; is the attention scoring function; is the encoded vector of the pedestrian’s historical states; and are the weight matrices; and is the learnable vector.
3.2.4. Dual Loss Function
To further improve the accuracy of trajectory prediction, this paper introduces a displacement loss function based on the traditional adversarial loss , thereby constructing a dual-loss mechanism. This mechanism not only maintains constraints on the authenticity of the generated trajectories but also guides the model to learn a trajectory distribution closer to reality by quantifying the displacement difference between the generated and real trajectories, as detailed in Equations (8)–(10).
In the AS-GAN model, trajectory prediction is achieved through adversarial optimization between the generator and the discriminator . The discriminator aims to maximize the adversarial loss to distinguish between real and generated trajectories. The generator attempts to minimize the loss value to enhance the authenticity of the generated trajectories. The adversarial loss function uses cross-entropy as a metric to measure the difference between the generated trajectory distribution and the real trajectory distribution. Meanwhile, to improve the spatial fitting accuracy of the trajectory, this paper introduces a displacement loss function to measure the Euclidean distance difference between the predicted trajectory and the real trajectory in both spatial and temporal dimensions. is a weighting coefficient used to balance the adversarial loss and the displacement loss functions.
3.2.5. Comparative Experiments
To validate the performance of the AS-GAN model proposed in this paper, several classic pedestrian trajectory prediction algorithms are used as benchmarks for comparison with the proposed model, such as the Constant Velocity Model (ConstVel) [20], Social Long Short-Term Memory (Social LSTM) [21], Social GAN, etc. The evaluation metrics are Average Displacement Error (ADE) and Final Displacement Error (FDE), with units in meters. A detailed comparison of the models can be found in Table 1.

Table 1.
Comparison of evaluation metrics for different models.
The results show that the AS-GAN model proposed in this paper outperforms the other comparison models in both prediction accuracy and robustness. The ConstVel model only uses historical trajectories for linear extrapolation, which cannot capture the nonlinear behavioral characteristics of pedestrians. The Social LSTM model introduces an LSTM network to model individual dynamics, but its social modeling ability is limited, as it only considers local interactions. The Social GAN model enhances interaction modeling capabilities through max pooling, but it fails to effectively incorporate the influence of vehicles, resulting in limited adaptability in mixed traffic environments. In contrast, the AS-GAN model proposed in this paper combines generative adversarial networks and a soft attention mechanism, enabling effective modeling of the dynamic relationships between pedestrians and surrounding multiple traffic participants. It improves trajectory prediction accuracy through the joint optimization of adversarial and displacement losses, providing more reliable trajectory support for collision risk warning.
3.3. Risk Detection Module
To improve the collision risk identification accuracy in unsignalized intersection scenarios, this paper designs an ellipse-buffer-based risk detection algorithm as the risk detection module in the warning algorithm, aimed at implementing spatial-level collision determination. The risk detection module takes the trajectory prediction module of vehicles and pedestrians as input and constructs a dynamically adjustable elliptical buffer zone, combining the motion states and physical boundary information of traffic participants. The long axis and short axis of the buffer zone are determined by vehicle speed , driver reaction time , vehicle dimensions (, ), and safety distance , and are adaptively adjusted using a tuning coefficient to ensure good risk coverage and geometric discrimination accuracy under varying traffic conditions. Additionally, this mechanism significantly improves the robustness and accuracy of the warning system in multi-type traffic participant scenarios by expanding the detection boundaries and enhancing adaptability, providing a stable and reliable spatial criterion for the calculation of joint collision probabilities. As shown in Figure 5, the yellow elliptical area represents the dynamically expanded vehicle safety domain, and the blue rectangle represents pedestrians or other vulnerable road users.

Figure 5.
Schematic of risk detection under the elliptical buffer zone algorithm.
The ellipse-buffer algorithm determines whether there are intersection points, i.e., whether a potential spatial collision occurs, by substituting the vertices of the pedestrian’s rectangular boundary into the elliptical geometric equation. If there is an overlap between the two, a potential collision event can be determined, and its corresponding occurrence time and distance will be recorded. The specific calculation process is shown in Formulas (11)–(15).
In the formula, denotes the index of the four edges of the rectangle, where the top and bottom boundaries, as well as the left and right boundaries, each correspond to a straight line. is the slope of the -th edge, and is the intercept of the -th edge. is the center coordinates of the ellipse, and are the semi-major and semi-minor axes, respectively, and is the rotation angle of the ellipse.
4. Collision Warning Algorithm Framework
4.1. Warning Process
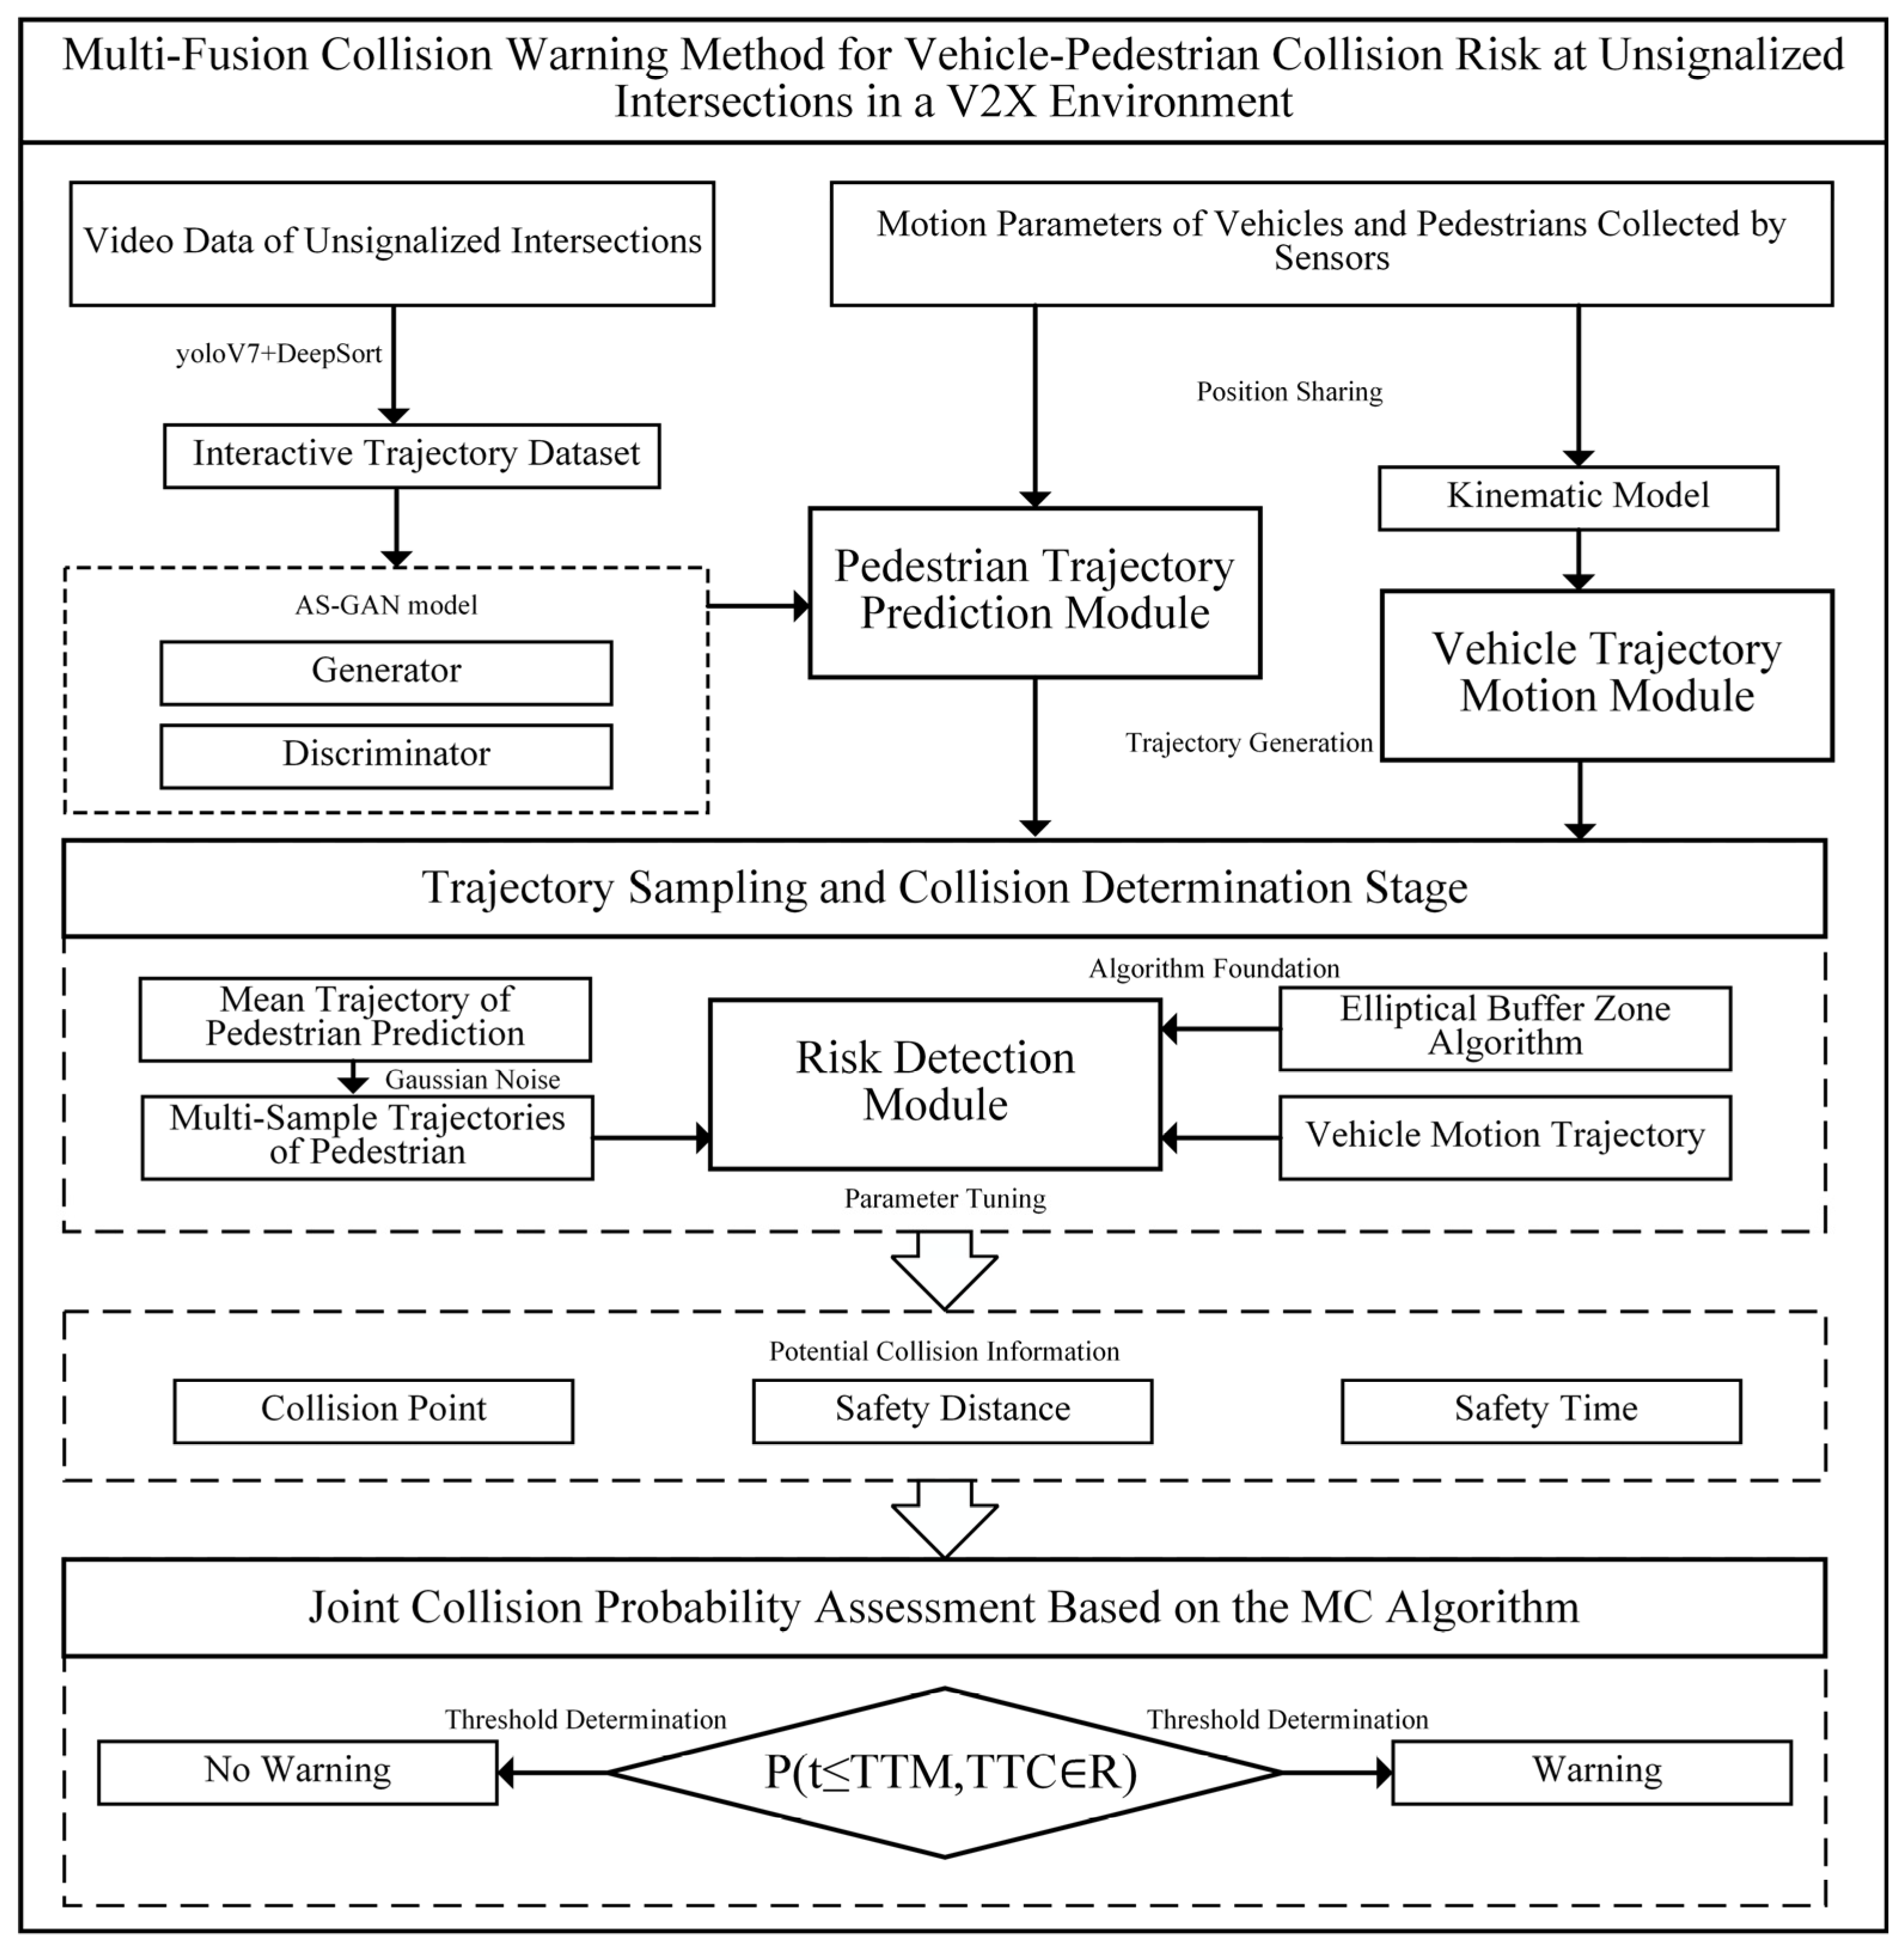
Based on the previously constructed vehicle trajectory motion module, pedestrian trajectory prediction module, and risk detection module, this paper proposes an MC-based multi-fusion collision warning algorithm for vehicle–pedestrian interactions. The overall process of the warning system is shown in Figure 6, consisting of four stages: trajectory prediction, trajectory sampling, collision determination, and joint collision probability assessment. First, the Road Side Unit (RSU) collects historical trajectory data of vehicles and pedestrians and outputs future motion trajectories through the trajectory module. For each pedestrian target, the MC method is used to add Gaussian noise disturbance to the predicted trajectory, generating multiple sampled trajectories to simulate potential pedestrian motion paths. Subsequently, the system uses the risk detection module to perform spatial collision determination for each sampled trajectory and records the potential collision time and distance. On this basis, the system combines all determination results with the driver’s reaction-braking time (TTM) and evaluates the overall collision risk according to the joint collision probability calculation formula (see Formula (22)). If the joint collision probability exceeds the set threshold, the system issues a warning to prompt the driver to take timely evasive actions.
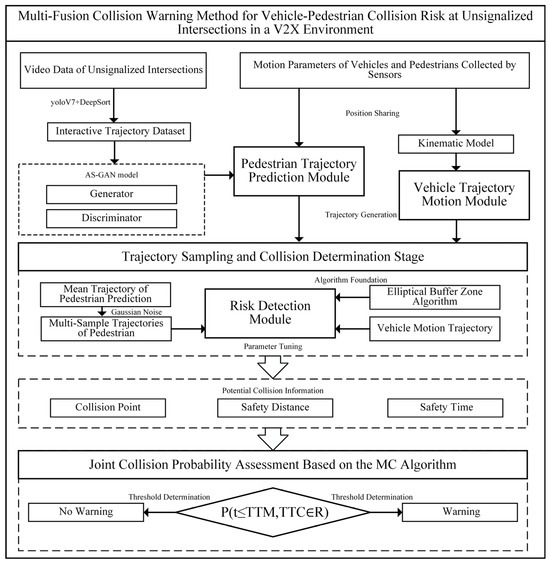
Figure 6.
Flowchart of the multi-fusion warning method.
4.2. MC-Based Multi-Fusion Warning Method
To model the uncertainty in pedestrian motion trajectories, this paper uses the prediction results from the trajectory prediction module as the mean estimate of the pedestrian’s future trajectory and adds Gaussian noise on top of it to generate multiple future trajectory samples, which serve as the input for MC sampling. This method not only takes into account the uncertainty introduced by prediction errors but also provides probabilistic support for collision risk assessment. For each potential target, its sample predicted trajectory is denoted as .
In the equation, represents the mean predicted trajectory of the -th pedestrian, is the Gaussian noise term used to perturb the trajectory during each generation to increase diversity. refers to Gaussian white noise with standard deviations approximately ranging from 0.08 to 0.12 in the lateral direction and from 0.13 to 0.17 in the longitudinal direction; represents the -th trajectory of the -th pedestrian, and are natural integers, and denotes the number of time steps in the trajectory.
Subsequently, in the MC random sampling of each predicted sample trajectory at each time step, this paper uses the risk detection module to detect the relative position relationship between pedestrians and vehicles for collision determination , recording the potential conflict points, collision time, and collision distance between vehicles and pedestrians, and using the MC algorithm to calculate the expected value of the collision distance distribution and the collision probability . Among them, represents the proportion of samples where the TTC falls within the risk interval , as detailed in Equations (17)–(20).
In the equation, is the collision determination function for the -th potential collision target in the -th predicted trajectory; and are natural integers, and represents the time step in the trajectory; is the total number of MC samples; represents the collision distance of the -th potential target; represents the proportion of samples where the TTC falls within the risk interval ; and is the indicator function used to indicate whether a collision exists.
To further incorporate the driver’s behavioral response mechanism, this paper introduces the TTM, which is the sum of the driver’s reaction time and braking time, to comprehensively consider whether a successful avoidance can occur before a collision takes place, as detailed in Equations (21) and (22).
In the formula, TTM represents the total of the driver’s reaction time and braking time ; is the conditional probability, which describes the likelihood that the collision time is less than TTM, given that a collision has already occurred (i.e., TTC ∈ R); is the joint collision probability, which reflects the situation where a collision occurs (TTC ∈ R) and the collision time is less than TTM in all samples. This probability index provides a more detailed characterization of the severity and avoidability of the collision, thereby offering a reliable basis for the trigger logic of the warning system.
4.3. Collision Warning Threshold Selection
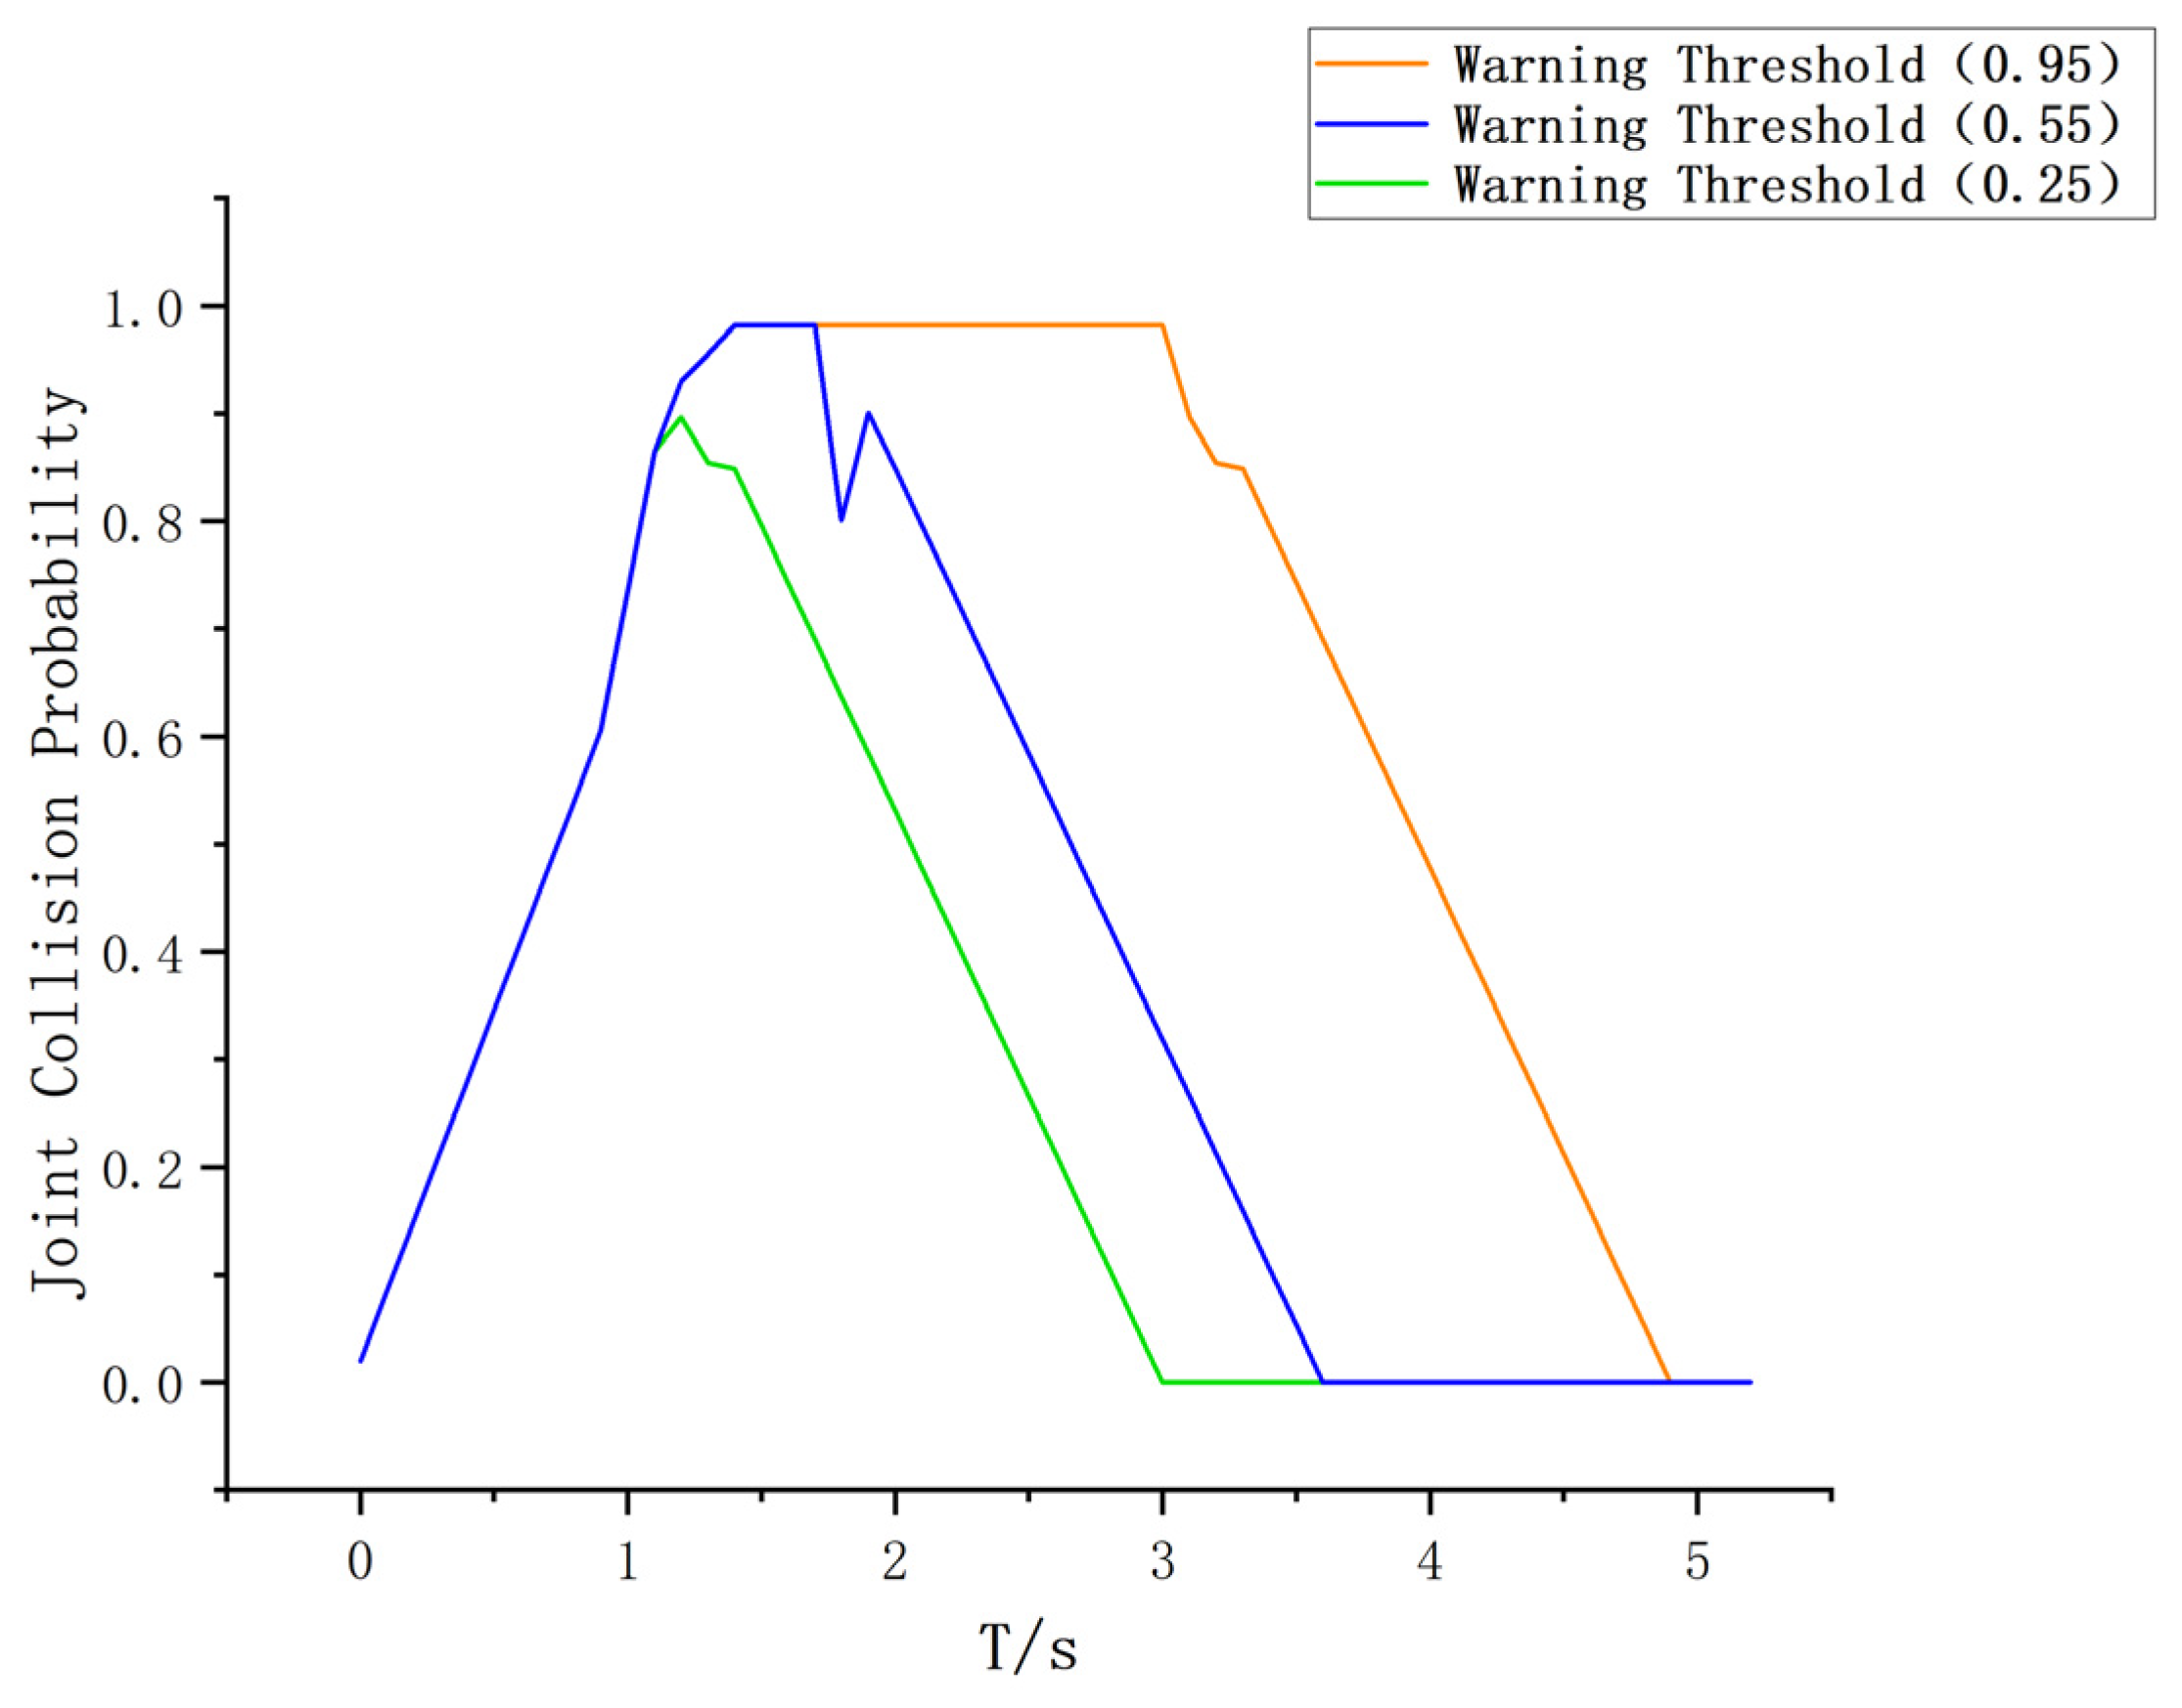
In the single-vehicle accident simulation experiment, this paper selects joint collision probability thresholds of 0.25, 0.55, and 0.95 to analyze the performance of the warning system under different collision probability conditions, as shown in Figure 7.
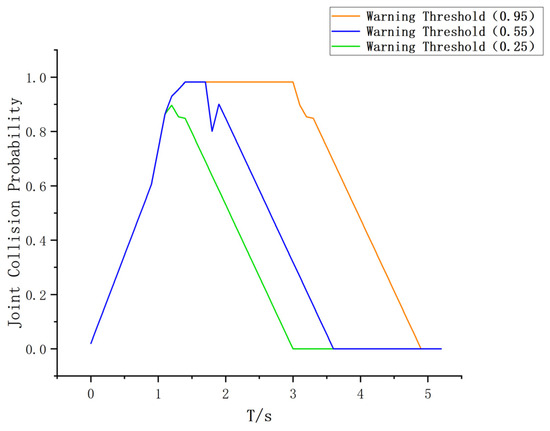
Figure 7.
Change in collision probability under different thresholds.
As shown in Figure 7, the experiment assumes that the accident occurs 4.2 s later. When the set collision probability threshold is 0.55, the warning system effectively balances the false alarm rate and the missed warning rate, exhibiting high accuracy and the best overall performance. Therefore, considering that the accident triggering mechanism is a dynamic time variable, this paper ultimately determines 0.55 as the joint collision warning threshold. When the collision probability exceeds this threshold, the system will immediately issue a warning, advising the driver to take evasive or braking actions to prevent a collision from occurring.
5. Simulation Verification
To verify the reliability and practicality of the proposed multi-fusion warning method, a simulation platform was built using MATLAB (version R2021b) and Simulink, (version R2021b) and multiple real accident cases from Guilin, Guangxi, were selected for testing. The simulation experiments include case analysis and comparative algorithm experiments, with the former focusing on evaluating the effectiveness of the warning model and the latter providing a comprehensive performance assessment from a statistical perspective. Given that the system integrates multiple technologies such as UAV-based perception, V2X communication, and AI-based prediction, its stability and reliability are particularly critical. The reliability analysis methods for the lifecycle of complex technical systems [22] offer a valuable reference for future system deployment and maintenance.
5.1. Case Simulation Analysis
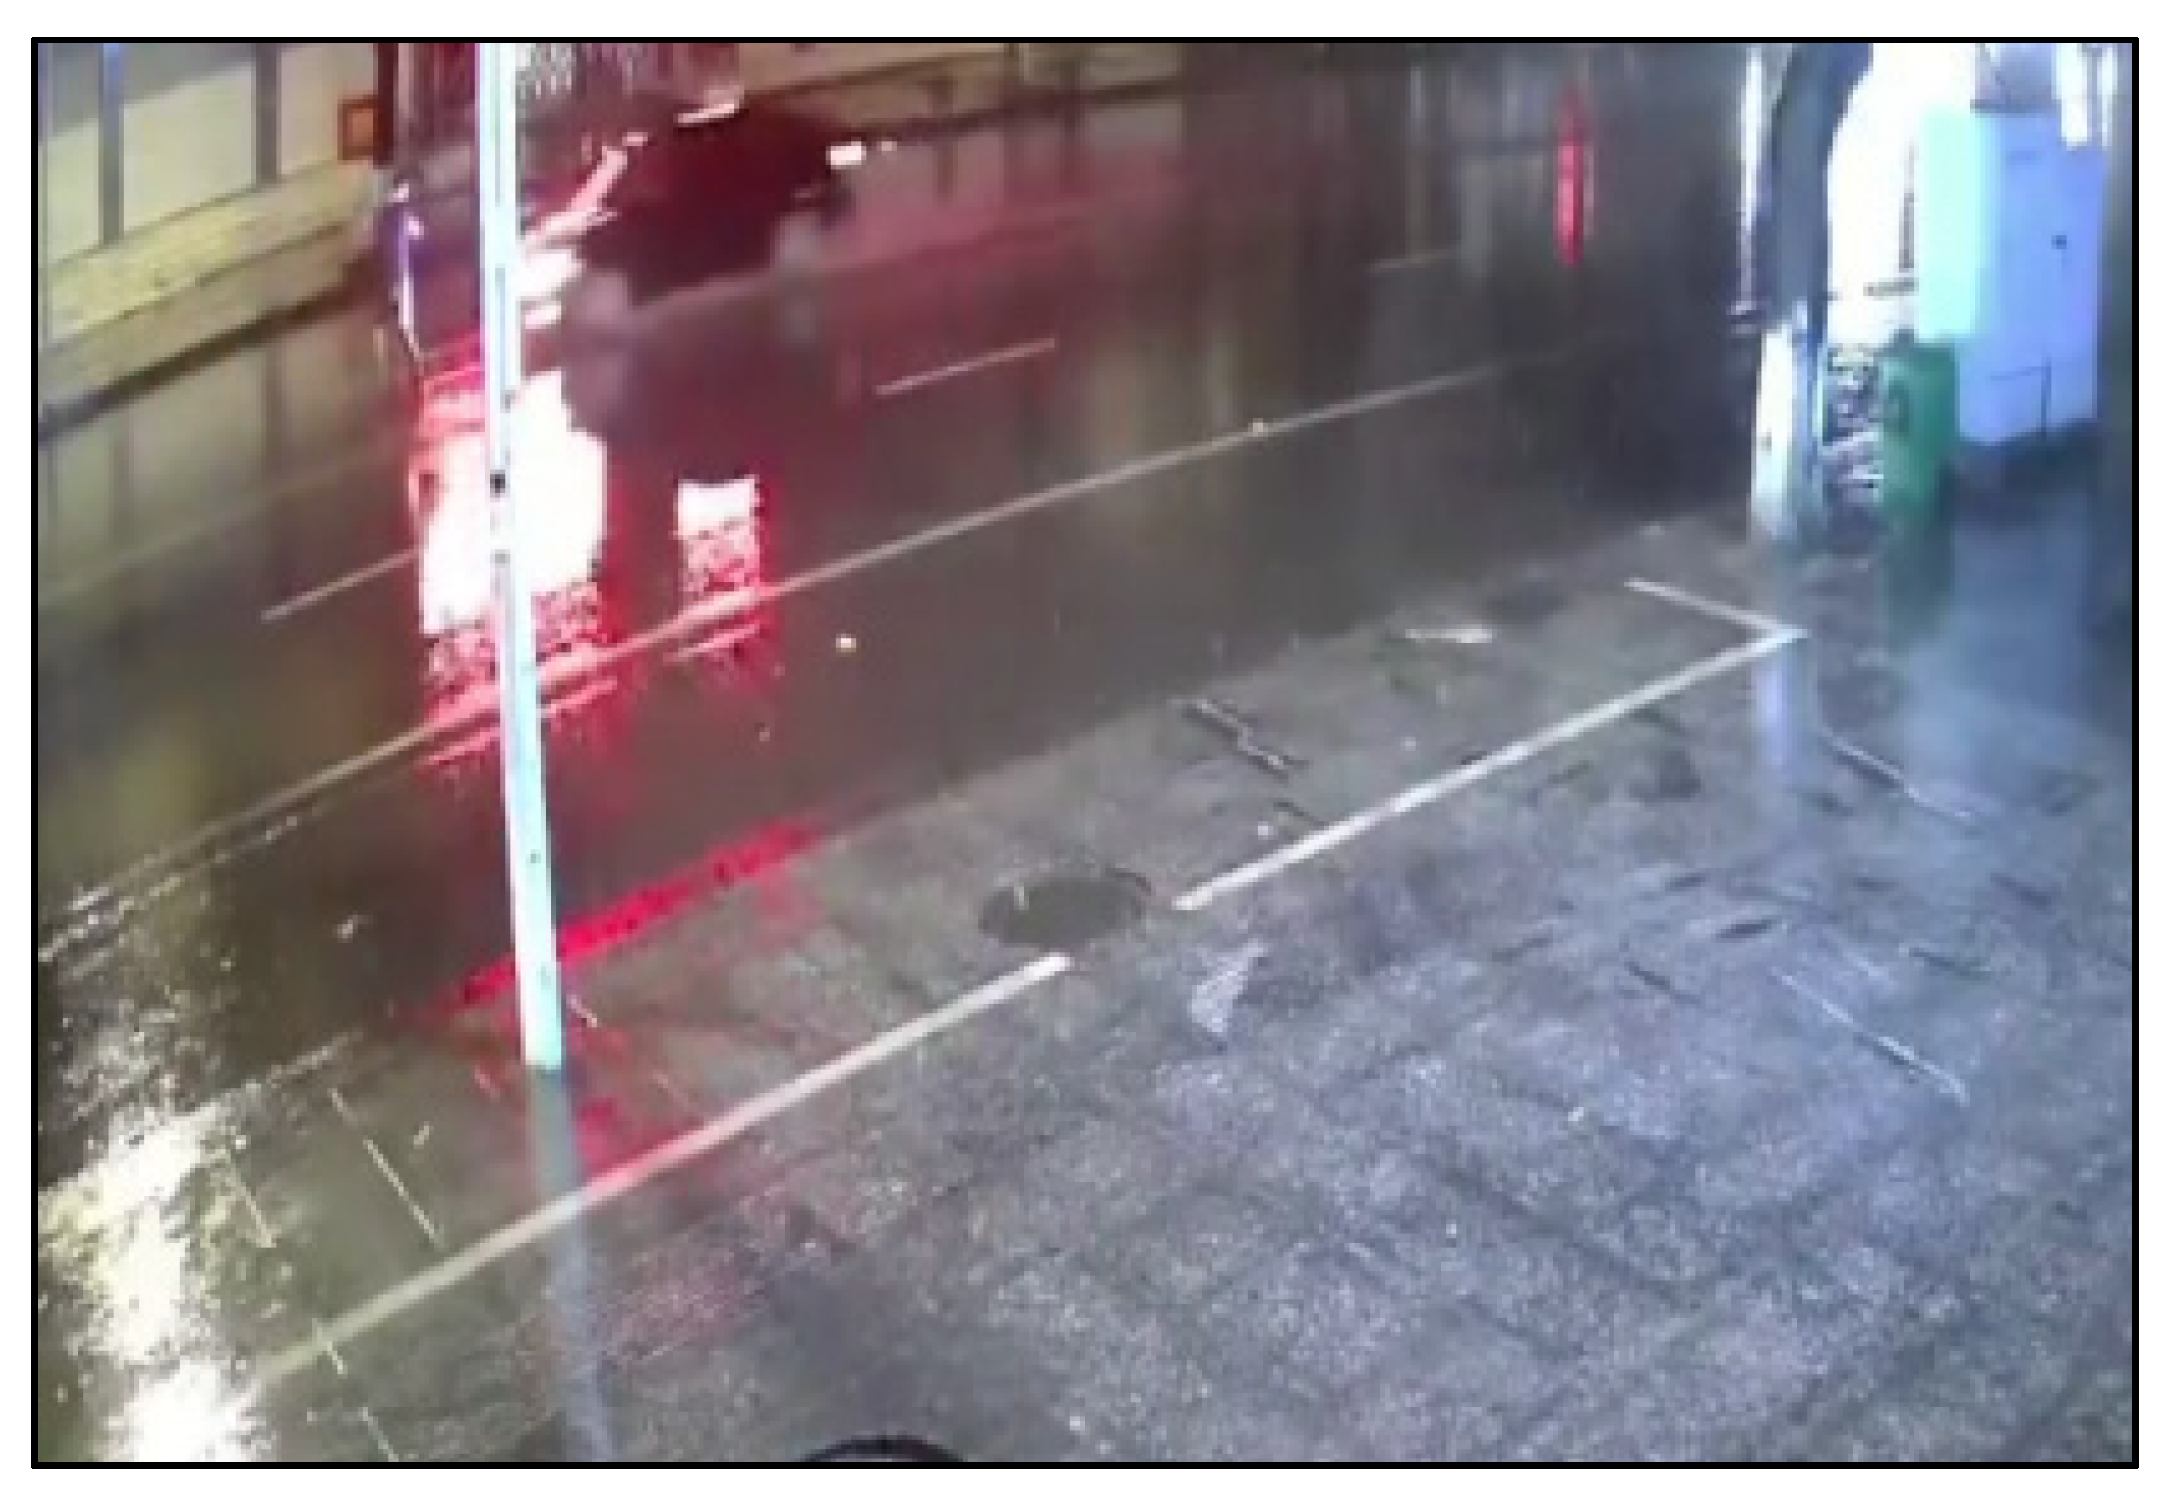
This paper selects a real accident case for simulation analysis, as shown in Figure 8. In the case, the initial speed of the vehicle is 52.72 km/h, the braking distance is 17.14 m, the average deceleration is 7.35 m/s2, and the driver’s braking reaction time is 1.240 s. In the simulation, the vehicle is set to travel at a constant speed of 12.25 m/s from the starting point at coordinates (16.5, −40.0). At the same time, the pedestrian walks at a normal speed from the starting point (10.67, 3.99), with velocity components at this moment as Vx = 1.45 m/s and Vy = 0.29 m/s.
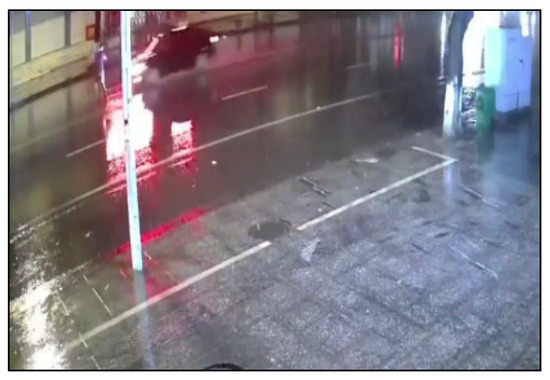
Figure 8.
Real collision scene.
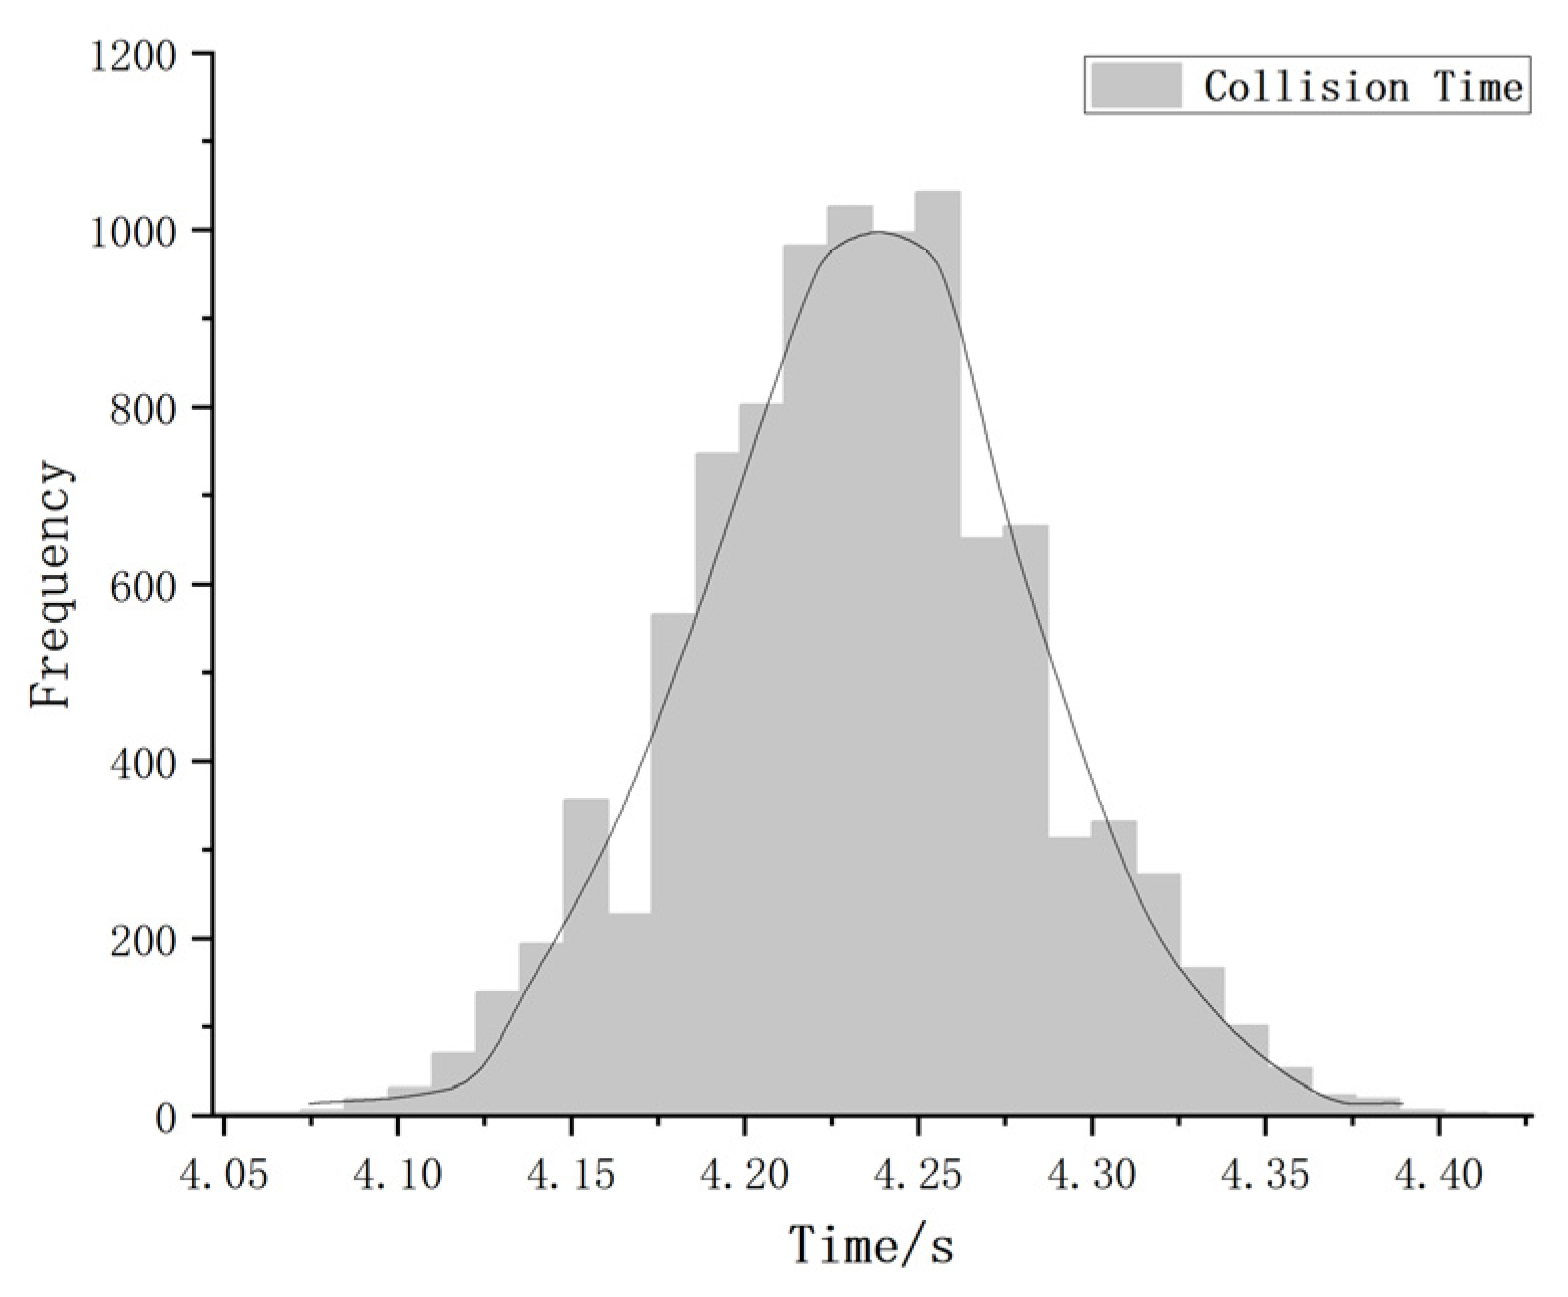
Figure 9 and Figure 10 show the distribution of future collision time and future collision distance calculated by the multi-fusion warning method at simulation time T = 0 s. Both collision distance and collision time exhibit a clear normal distribution trend. In Figure 9, most of the sampled collision times are close to 4.2 s, indicating that the collision time is mainly concentrated within this time range. Figure 10 shows that the collision frequency between the vehicle and the pedestrian peaks within the distance range of 63 m to 64 m, indicating that the collision risk significantly increases within this distance interval. In conclusion, the mean of the distribution indicates that the future collision time between the vehicle and the pedestrian is 4.2 s, or the future collision distance is 63.5 m, which also indicates the existence of a potential high-risk collision point.
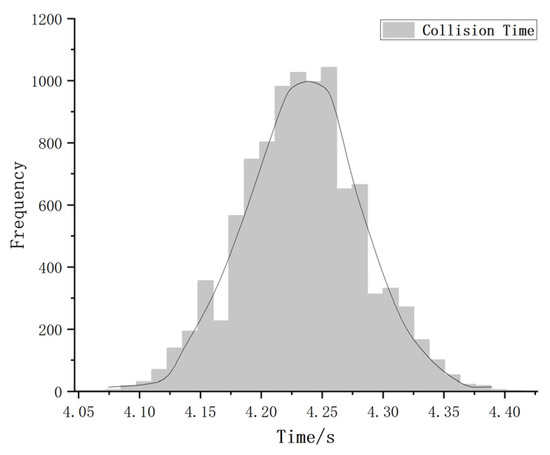
Figure 9.
Collision time distribution.
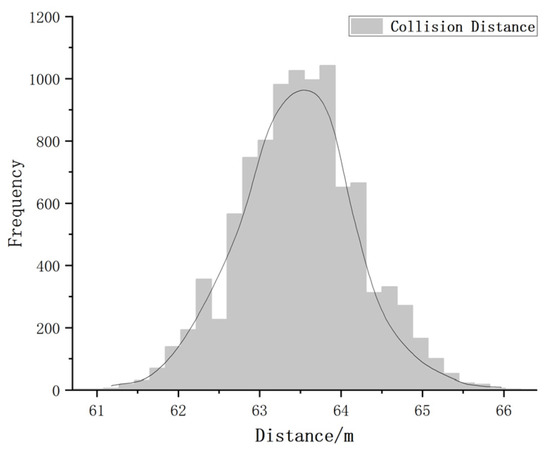
Figure 10.
Collision distance distribution.
In the subsequent simulation time, this paper uses the multi-fusion warning method to calculate the joint collision probability between the vehicle and the pedestrian in real-time and records the simulation scenarios and changes in joint collision probability at key time points (T = 1 s, T = 1.45 s, and T = 4.2 s), as shown in Figure 11 and Figure 12.

Figure 11.
Simulation accident analysis at T = 1 s: (a) simulation collision scene at T = 1 s and (b) change in joint collision probability at T = 1 s.
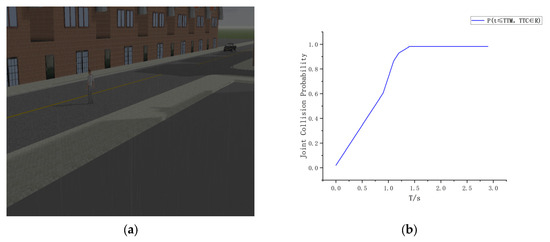
Figure 12.
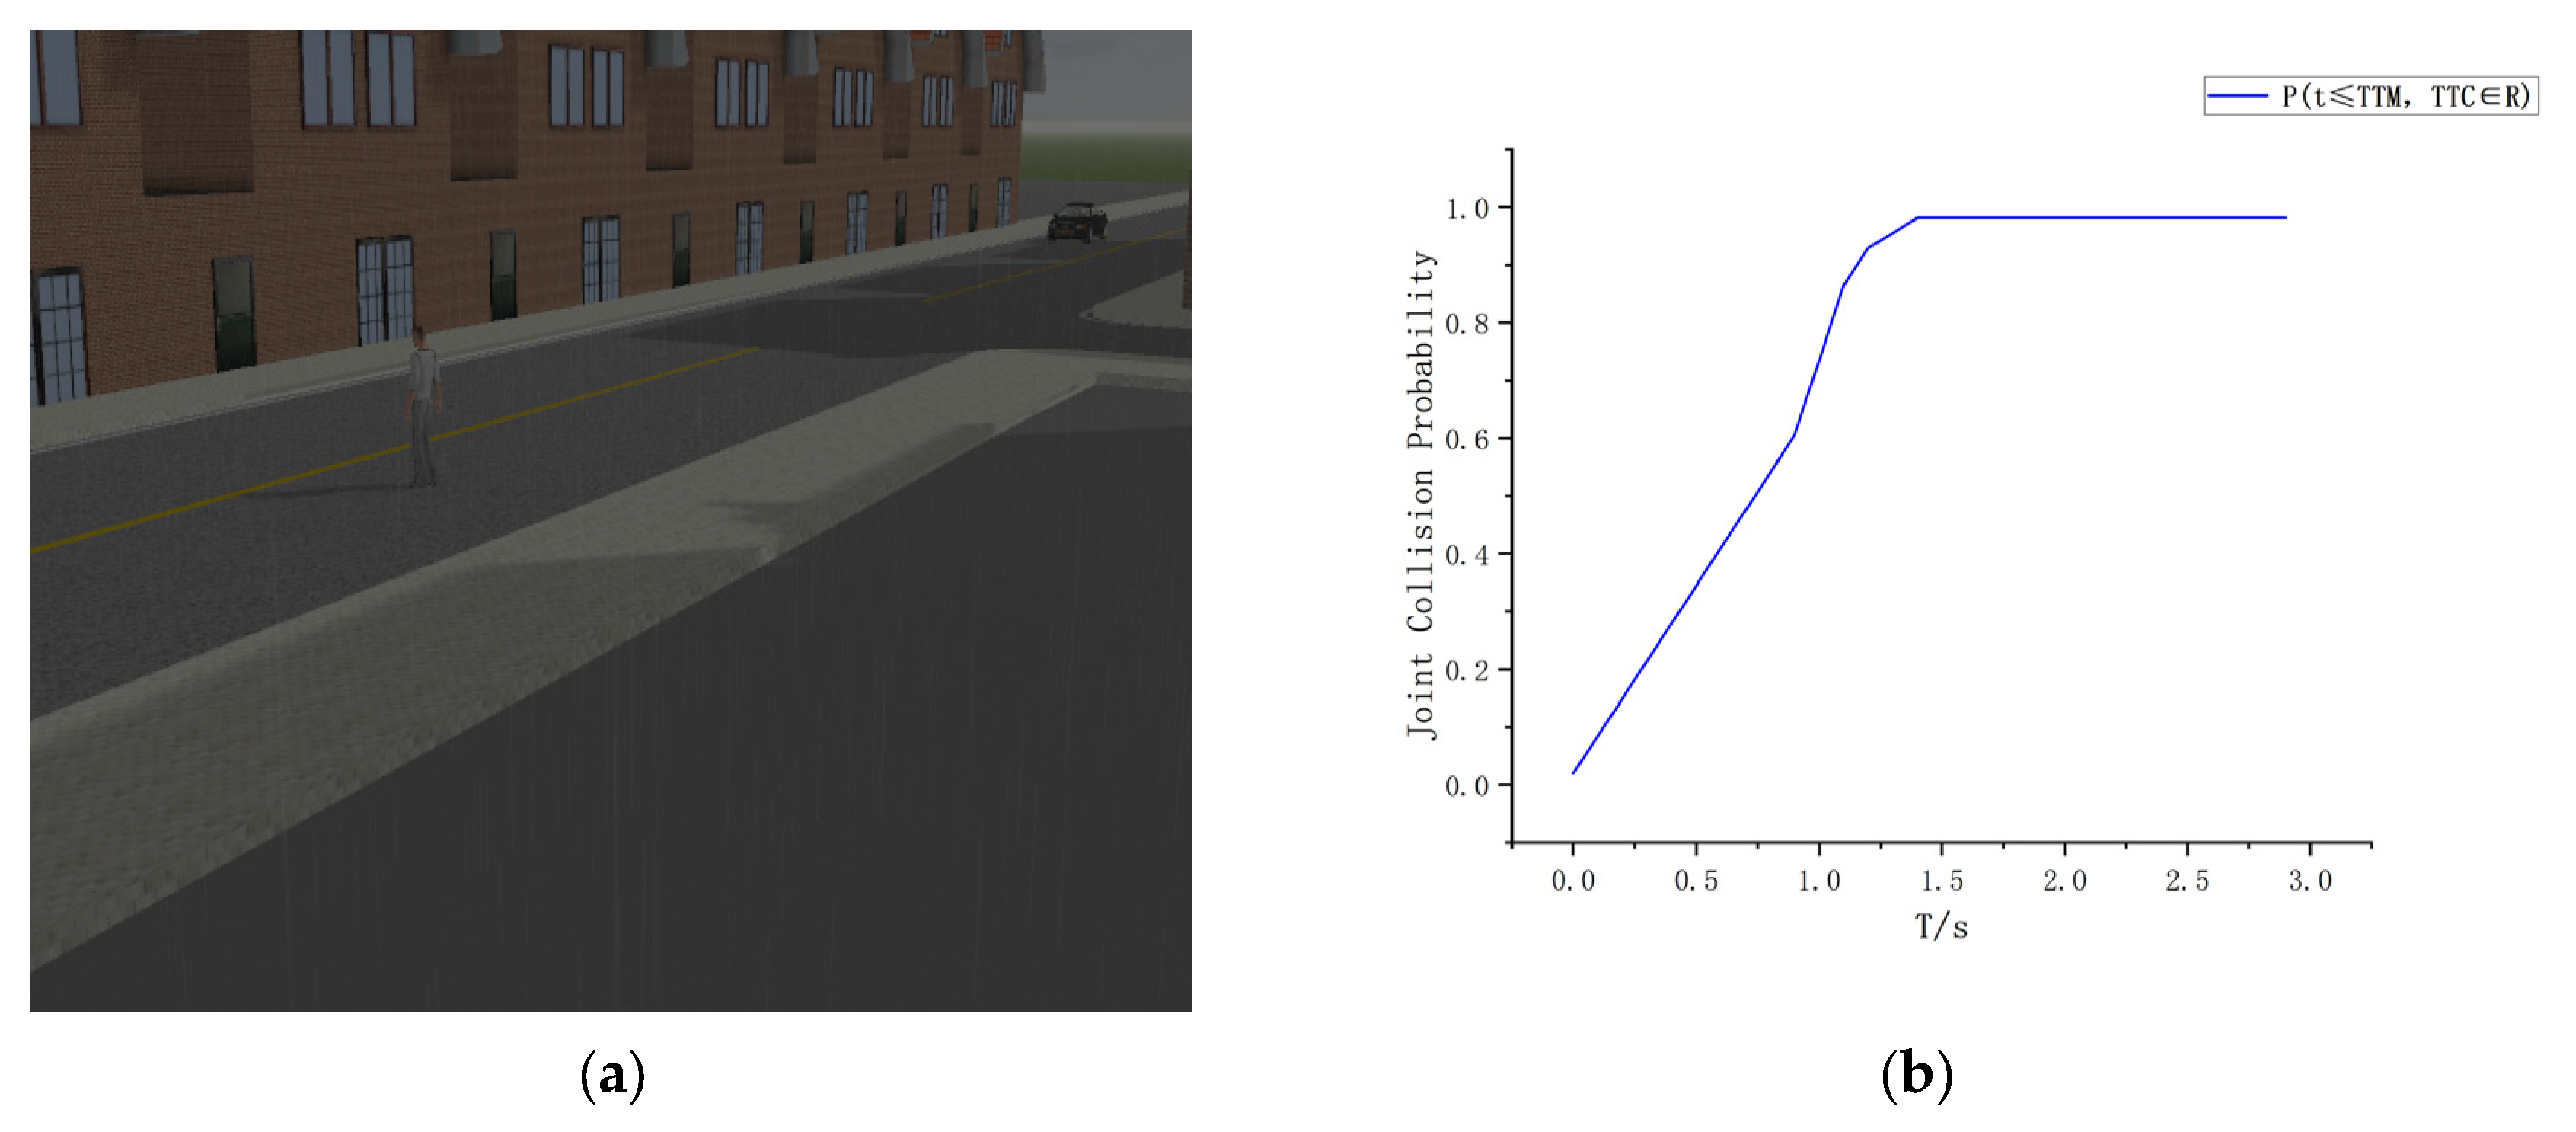
Simulation accident analysis at T = 1.45 s: (a) simulation collision scene at T = 1.45 s and (b) change in joint collision probability at T = 1.45 s.
As shown in Figure 11, at T = 1 s, the vehicle begins to detect the pedestrian, and the joint collision probability starts to gradually increase. Figure 11a shows the simulation scenario at this time, and Figure 11b displays the change curve of the joint collision probability. At this point, the joint collision probability has not yet exceeded the warning threshold of 0.55, and the system is in monitoring mode.
As shown in Figure 12, at T = 1.45 s, Figure 12a presents the simulation scenario at this time; Figure 12b shows the change in joint collision probability without any warning. From the figure, it can be seen that the joint collision probability rapidly climbs to nearly 98%, far exceeding the warning threshold. This indicates that if the vehicle does not brake in time, the likelihood of a collision with the pedestrian is extremely high.
The real scenario of a collision between the vehicle and pedestrian without any warning is shown in Figure 8 above. In the case of an early warning, as shown in Figure 13, the simulation scenario of the vehicle and pedestrian at T = 4.2 s is presented. Figure 13a shows the change in the joint collision probability after the warning. Due to the driver’s collision reaction time of 1.240 s, the joint collision probability rises rapidly within this time and reaches its peak. However, it significantly decreases and reaches zero because the driver brakes in time. As shown in Figure 13b, the vehicle and pedestrian successfully avoid the collision under the warning. The simulation results validate the effectiveness of the warning system in high-risk scenarios and demonstrate the practicality of the V2X-based collision warning system at unsignalized intersections in real-world applications.
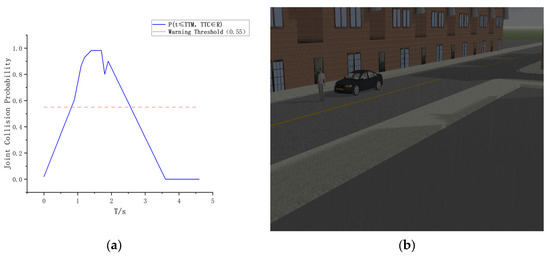
Figure 13.
Simulation accident analysis under warning at T = 4.2 s: (a) change in joint collision probability at T = 4.2 s and (b) collision simulation scene at T = 4.2 s.
5.2. Comparative Algorithm Experiments
Vulnerable road users, such as pedestrians, often exhibit unstable behavior on the road, especially at traffic junctions, which are highly unpredictable. At the same time, vehicles need to maintain a safe distance or provide enough reaction time to ensure safety. The braking distance safety model and the TTC model in traditional algorithms are applicable in various traffic scenarios, playing an important role, especially in predicting and avoiding collisions. Therefore, this paper selects these two models as comparison algorithms and conducts simulation experiments in combination with the proposed algorithm.
This paper selects real traffic accident data from various types of unsignalized intersections in Guilin City, Guangxi, as simulation scenarios, covering intersections such as cross, T-junction, and road interchanges, to comprehensively assess the collision warning accuracy of the three models. In addition, the speed range is set to 30–60 km/h based on traffic safety regulations and actual accident data from unsignalized intersections on national and provincial roads. To ensure the scientific validity and data rationality of the experiment, 200 sets of experiments were designed for pedestrians, as shown in Table 2.
Table 2.
Intersection experiment results of different algorithms.
Table 2 shows the test results of different algorithms when both vehicles and pedestrians participate in traffic. As shown in Table 2, the missed alarm rate of the proposed warning method is 4.8%, significantly lower than the TTC model’s 16.2% and the braking distance model’s 17%. The false alarm rate is 7.4%, clearly lower than the TTC model’s 23.1% and the braking distance model’s 18.1%. The accuracy rate reaches 94.5%, superior to the TTC model’s 82% and the braking distance model’s 86.5%. The results show that the proposed warning method outperforms the TTC model and the braking distance-based model in terms of missed alarm rate, false alarm rate, and accuracy, verifying the reliability of the multi-fusion warning method. Furthermore, the collision probability warning model proposed in this paper can accurately predict the collision probability between vehicles and pedestrians, offering advantages such as numerical risk representation, reasonable anticipation, and flexible evaluation.
6. Conclusions
This study addresses the vehicle–pedestrian conflict problem at unsignalized intersections and proposes a multi-fusion collision warning method based on V2X communication technology. The method adopts the MC algorithm as the core computational framework, incorporates the AS-GAN model for pedestrian trajectory prediction, and introduces an elliptical buffer zone algorithm for spatial collision detection.
In the trajectory prediction module, an improved AS-GAN model is proposed to model future pedestrian trajectories. This model integrates a GAN architecture with a soft attention mechanism, enabling the effective extraction of temporal evolution patterns and interaction features of trajectories. By designing a dual loss function composed of adversarial loss and displacement loss, the model significantly enhances trajectory prediction accuracy and reduces false and missed alarms caused by prediction deviations.
For collision detection, a spatial discrimination method based on elliptical buffer zones is proposed to address the limitations of traditional TTC models in handling lateral movement, target expansion, and dynamic trajectory evaluation. This method allows for a more accurate representation of interaction zones and improves the precision of collision point identification. Meanwhile, the system leverages V2X communication to obtain real-time motion state information of vehicles and pedestrians, providing crucial data support for risk analysis in dynamic scenarios.
In the collision risk assessment stage, the MC sampling algorithm serves as the core framework to introduce Gaussian perturbations into the predicted trajectories, generating multiple trajectory samples for spatial collision judgment. The system further incorporates driver reaction time and braking distance windows to construct a joint collision probability function, which serves as the basis for issuing collision warnings. This strategy not only enhances the model’s ability to represent trajectory uncertainty but also significantly improves the stability and reliability of the warning outcomes. Comparative experiments using real-world data and conventional algorithms confirm the superiority of the proposed method in predicting and warning of potential collision risks.
Nevertheless, this study has certain limitations. The current method has been validated primarily in relatively simple intersection scenarios with low traffic density, and its applicability in more complex environments—such as high-density traffic flows, multi-lane intersections, and weak communication conditions—has yet to be thoroughly evaluated. In addition, system deployment imposes demands on computational resources and real-time response capabilities, which require further balancing in future research. Subsequent work will focus on optimizing the model for more complex scenarios, improving the robustness of V2X communication, and refining strategies for system integration and deployment, with the ultimate goal of facilitating the practical implementation of the proposed method in real-world traffic safety systems.
Author Contributions
Conceptualization, W.Z. and R.C.; methodology: X.Z., R.C. and J.D.; software: X.G., J.D., B.Y. and Q.L.; validation: R.C., X.G. and J.D.; formal analysis: X.Z. and J.D.; investigation: J.D., X.G., B.Y., E.L., W.W., Q.L. and Q.T.; resources: X.G., R.C. and Q.T.; data management: J.D.; writing—original draft preparation: X.G. and J.D.; writing—review and editing: X.G. and J.D.; visualization: J.D. and Q.T.; supervision: R.C. and W.Z.; project administration: R.C. All authors have read and agreed to the published version of the manuscript.
Funding
This research was funded by the Guangxi Natural Science Foundation (Grant No. 2023GXNSFAA026359), the Guilin Science and Technology Program (Grant No. 20230120-7), the National Natural Science Foundation of China (Grant No. 52262047), and the Guangxi Key Research and Development Program (Grant Nos. AB25069483 and AB25069333).
Institutional Review Board Statement
Not applicable.
Informed Consent Statement
Not applicable.
Data Availability Statement
The original contributions presented in the study are included in the article, and further inquiries can be directed to the corresponding author upon reasonable request.
Conflicts of Interest
The authors declare no conflicts of interest.
References
- National Bureau of Statistics of China. China Statistical Yearbook 2024; China Statistics Press: Beijing, China, 2024.
- Liu, H. Research on Left-Turn Collision Warning Algorithm at Intersections Based on V2X. Master’s Thesis, Jilin University, Changchun, China, 2023. [Google Scholar]
- Xia, H.; Daowen, Z.; Yaoyue, C.; Qi, L.; Xiaofei, D.; Honglei, D. Optimization of AEB trigger width based on pedestrian crossing scenarios. China Saf. Sci. J. 2020, 30, 141–146. [Google Scholar]
- Miller, R.; Huang, Q. An adaptive peer-to-peer collision warning system. In Proceedings of the IEEE 55th Vehicular Technology Conference (VTC Spring 2002), Birmingham, AL, USA, 6–9 May 2002; pp. 317–321. [Google Scholar]
- Lan, L.T.; Xu, L.; Gong, Y. Assessment of conflict severity between pedestrians and right-turning vehicles. J. Chongqing Univ. Technol. 2022, 36, 70–77. [Google Scholar]
- Guo, R.J.; Wang, T.T.; Liu, M. Rectangular conflict detection and resolution at signal-free intersections in cooperative vehicle-infrastructure systems. J. Automot. Eng. 2023, 13, 791–802. [Google Scholar]
- Wang, Y.; Wenjuan, E.; Tian, D.; Lu, G.; Yu, G.; Wang, Y. Vehicle collision warning system and collision detection algorithm based on vehicle infrastructure integration. In Proceedings of the 7th Advanced Forum on Transportation of China (AFTC 2011), Beijing, China, 22 October 2011; pp. 216–220. [Google Scholar]
- Zeng, L.; Chen, Y.; Teng, H.F. Analytical equations for unsuitable boundary of ellipse-ellipse collision and its interference judgment. J. Image Graph. 2007, 5, 917–921. [Google Scholar]
- Jiménez, F.; Naranjo, J.E.; García, F. An improved method to calculate the time-to-collision of two vehicles. Int. J. Intell. Transp. Syst. Res. 2013, 11, 34–42. [Google Scholar] [CrossRef]
- Han, Y.; Yuan, X.B.; Lu, M.; Tan, X. Research on AEB longitudinal and lateral trigger strategy in typical car–electric two-wheeler collision scenarios. Automot. Eng. 2023, 45, 501–509. [Google Scholar]
- Li, X.J.; Li, J.F.; Zhu, M.; Peng, N.; Zuo, S. Research on positioning fusion and verification algorithm based on unscented Kalman filter. Automot. Eng. 2021, 43, 825–832. [Google Scholar]
- Zhao, R.; Li, Y.; Hu, H.Y.; Gao, Z.-H. Vehicle collision warning method at intersections based on V2I communication. J. Jilin Univ. Eng. Technol. Ed. 2023, 53, 1019–1029. [Google Scholar]
- Laugier, C.; Paromtchik, I.E.; Perrollaz, M.; Yong, M.; Yoder, J.D.; Tay, C.; Mekhnacha, K.; Nègre, A. Probabilistic analysis of dynamic scenes and collision risk assessment to improve driving safety. IEEE Intell. Transp. Syst. Mag. 2011, 3, 4–19. [Google Scholar] [CrossRef]
- Joerer, S.; Segata, M.; Bloessl, B.; Cigno, R.L.; Sommer, C.; Dressler, F. A vehicular networking perspective on estimating vehicle collision probability at intersections. IEEE Trans. Veh. Technol. 2013, 63, 1802–1812. [Google Scholar] [CrossRef]
- Berthelot, A.; Tamke, A.; Dang, T.; Breuel, G. A novel approach for the probabilistic computation of time-to-collision. In Proceedings of the 2012 IEEE Intelligent Vehicles Symposium, Madrid, Spain, 3–7 June 2012; pp. 1173–1178. [Google Scholar]
- Peng, L.Q.; He, S.X.; He, Y. Research on pedestrian collision risk identification based on V2P in Internet of Vehicles. J. Transp. Syst. Eng. Inf. Technol. 2018, 18, 89–95. [Google Scholar] [CrossRef]
- Yang, X.; Zhou, Z.P.; Liu, B.W. Real-time vehicle-pedestrian collision risk warning model based on catastrophe theory. J. Nanjing Univ. Sci. Technol. 2021, 45, 606–613. [Google Scholar]
- Jin, Y.Y.; Liu, M.J.; Niu, H.H. Research on vehicle collision warning method based on collision probability at intersections. Sci. Technol. Innov. Appl. 2022, 12, 7–12+18. [Google Scholar]
- Gupta, A.; Johnson, J.; Fei-Fei, L.; Savarese, S.; Alahi, A. SocialGAN: Socially acceptable trajectories with generative adversarial networks. In Proceedings of the 2018 IEEE/CVF Conference on Computer Vision and Pattern Recognition (CVPR), New York, NY, USA, 18–23 June 2018; pp. 2255–2264. [Google Scholar]
- Raina, S.; Challagundla, J.; Singh, M. Trajectory prediction in autonomous driving: A comprehensive review of deep learning models and future direction. In Proceedings of the 2025 IEEE 15th Annual Computing and Communication Workshop and Conference (CCWC), Las Vegas, NV, USA, 6–8 January 2025; pp. 753–759. [Google Scholar]
- Alahi, A.; Goel, K.; Ramanathan, V.; Robicquet, A.; Fei-Fei, L.; Savarese, S. Social LSTM: Human trajectory prediction in crowded spaces. In Proceedings of the IEEE Conference on Computer Vision and Pattern Recognition (CVPR), Las Vegas, NV, USA, 27–30 June 2016; pp. 961–971. [Google Scholar]
- Breznická, A.; Kohutiar, M.; Krbaťa, M.; Šimková, E. Reliability analysis during the life cycle of a technical system and the monitoring of reliability properties. Systems 2023, 11, 556. [Google Scholar] [CrossRef]


Disclaimer/Publisher’s Note: The statements, opinions and data contained in all publications are solely those of the individual author(s) and contributor(s) and not of MDPI and/or the editor(s). MDPI and/or the editor(s) disclaim responsibility for any injury to people or property resulting from any ideas, methods, instructions or products referred to in the content. |
© 2025 by the authors. Published by MDPI on behalf of the World Electric Vehicle Association. Licensee MDPI, Basel, Switzerland. This article is an open access article distributed under the terms and conditions of the Creative Commons Attribution (CC BY) license (https://creativecommons.org/licenses/by/4.0/).