

Quantitative Assessment of EV Energy Consumption: Applying Coast Down Testing to WLTP and EPA Protocols


Abstract
1. Introduction
2. Background
Application to WLTP and EPA Protocols
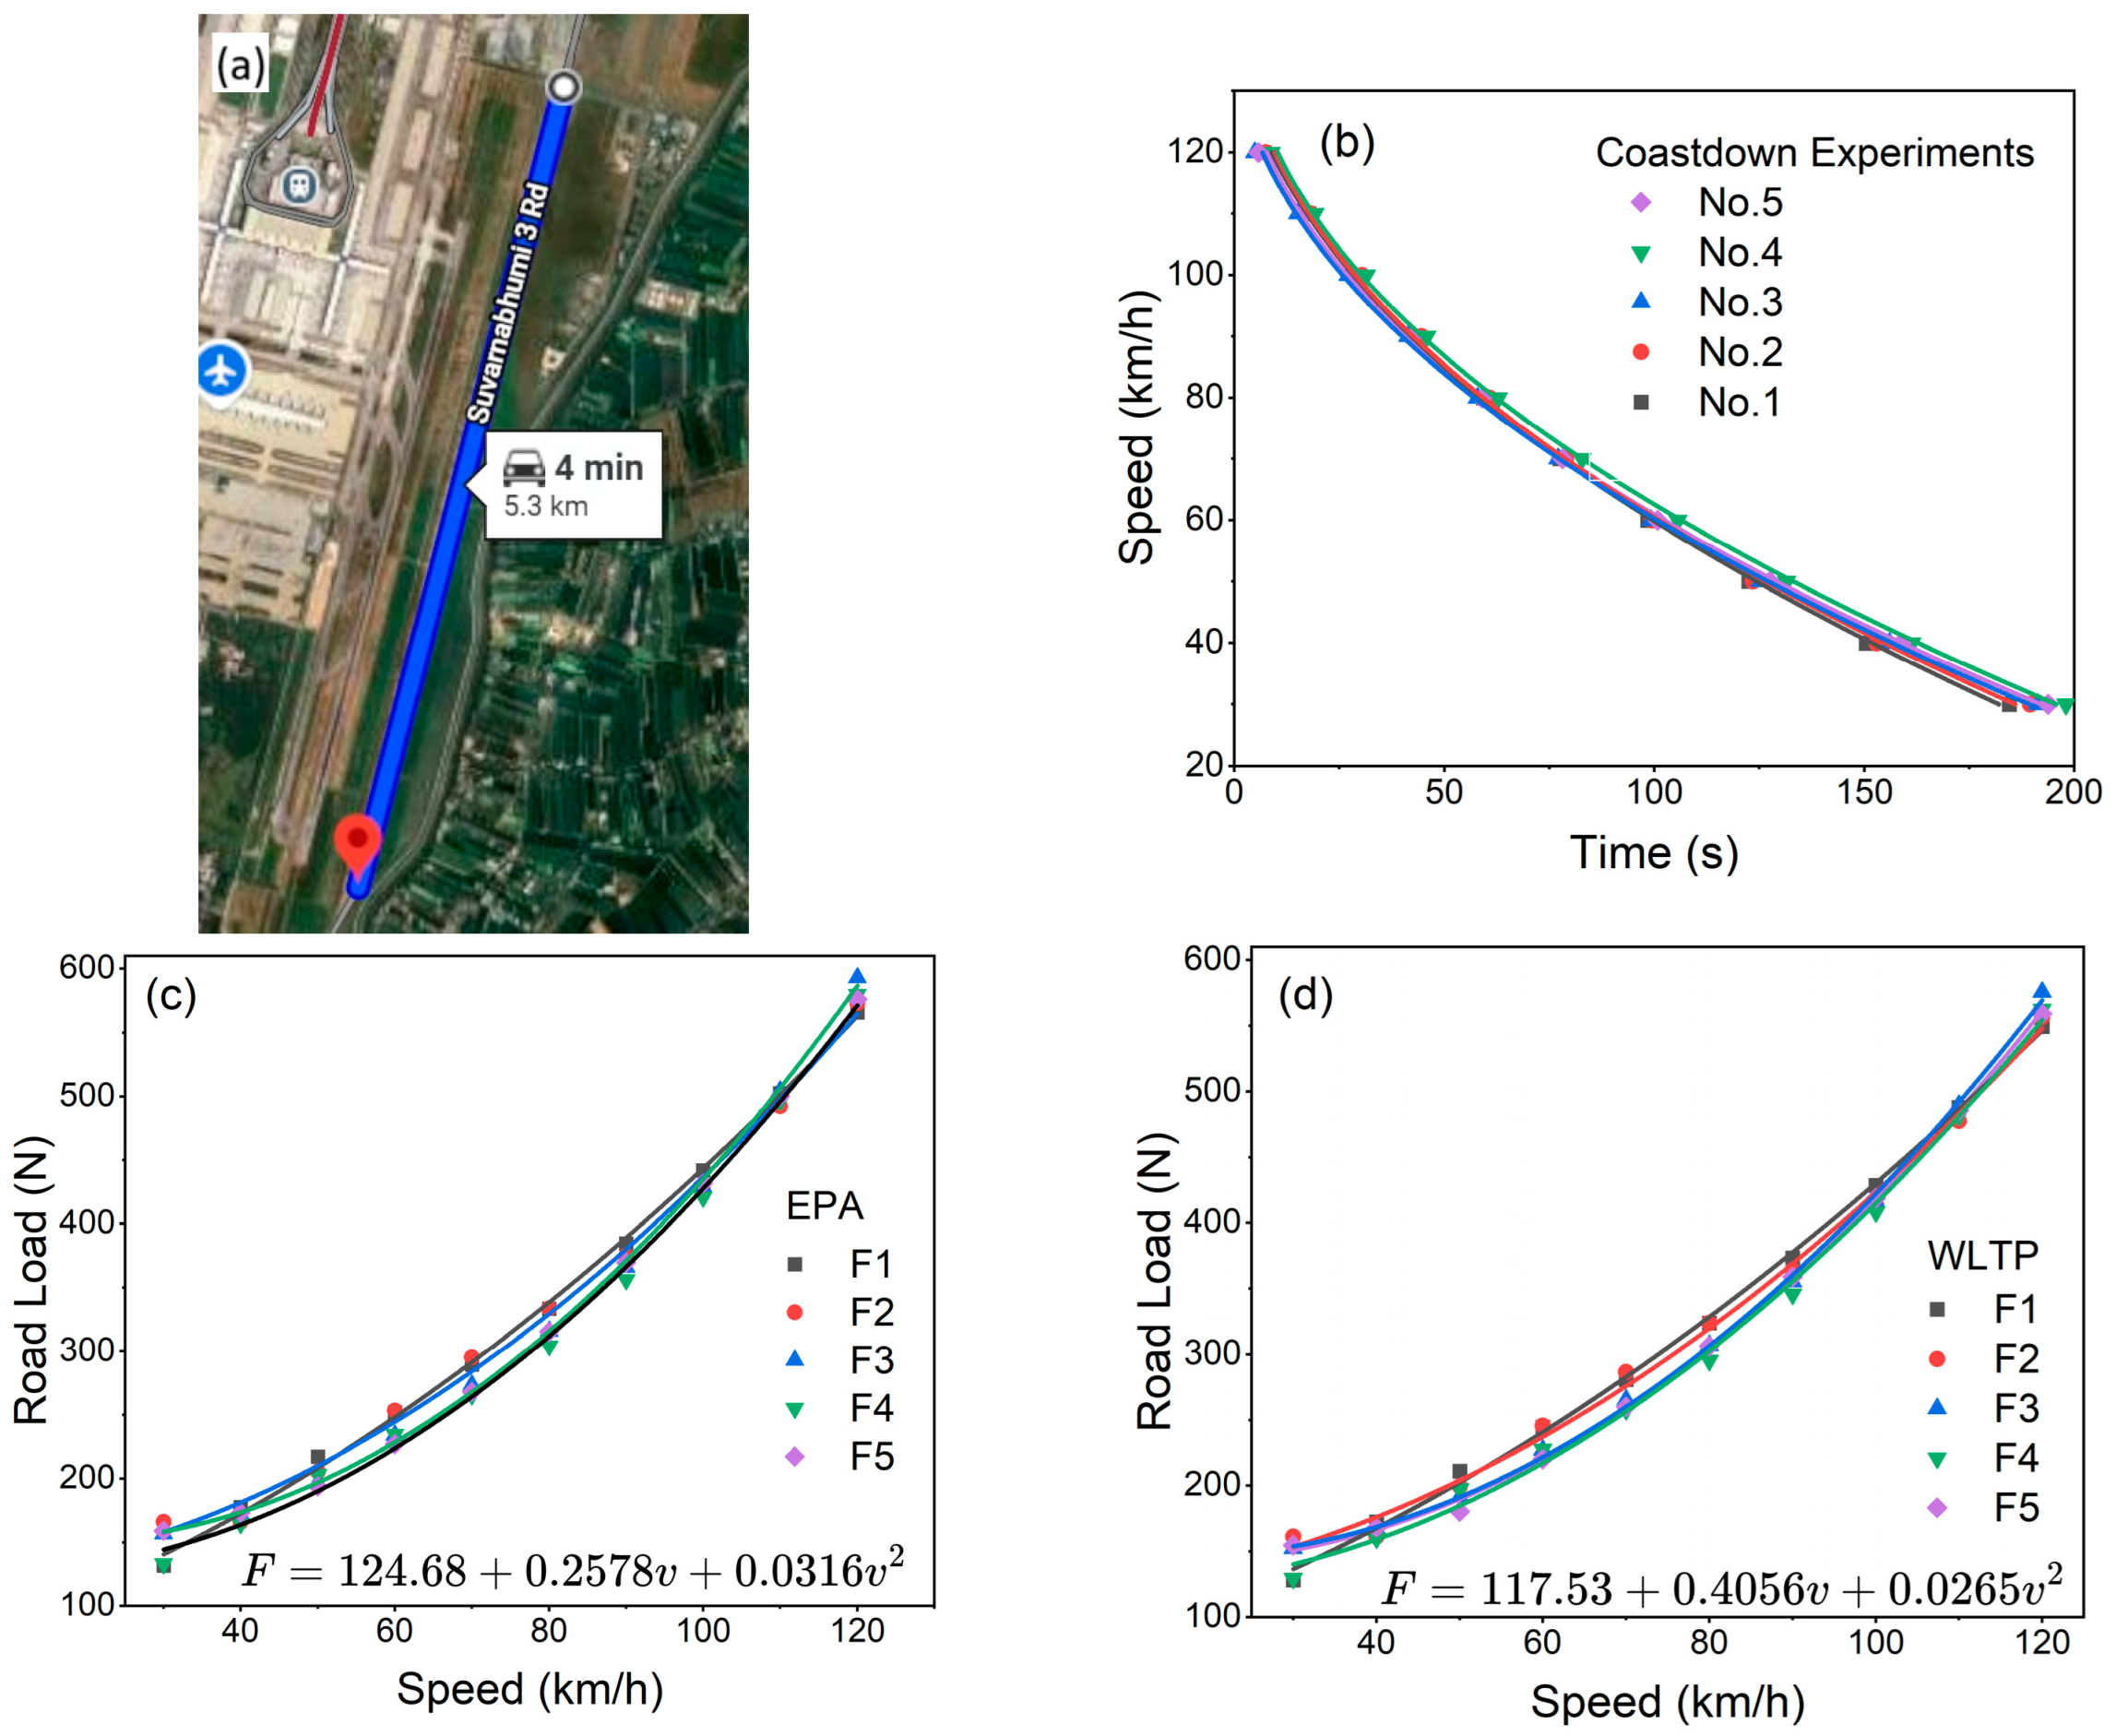
3. Experiment
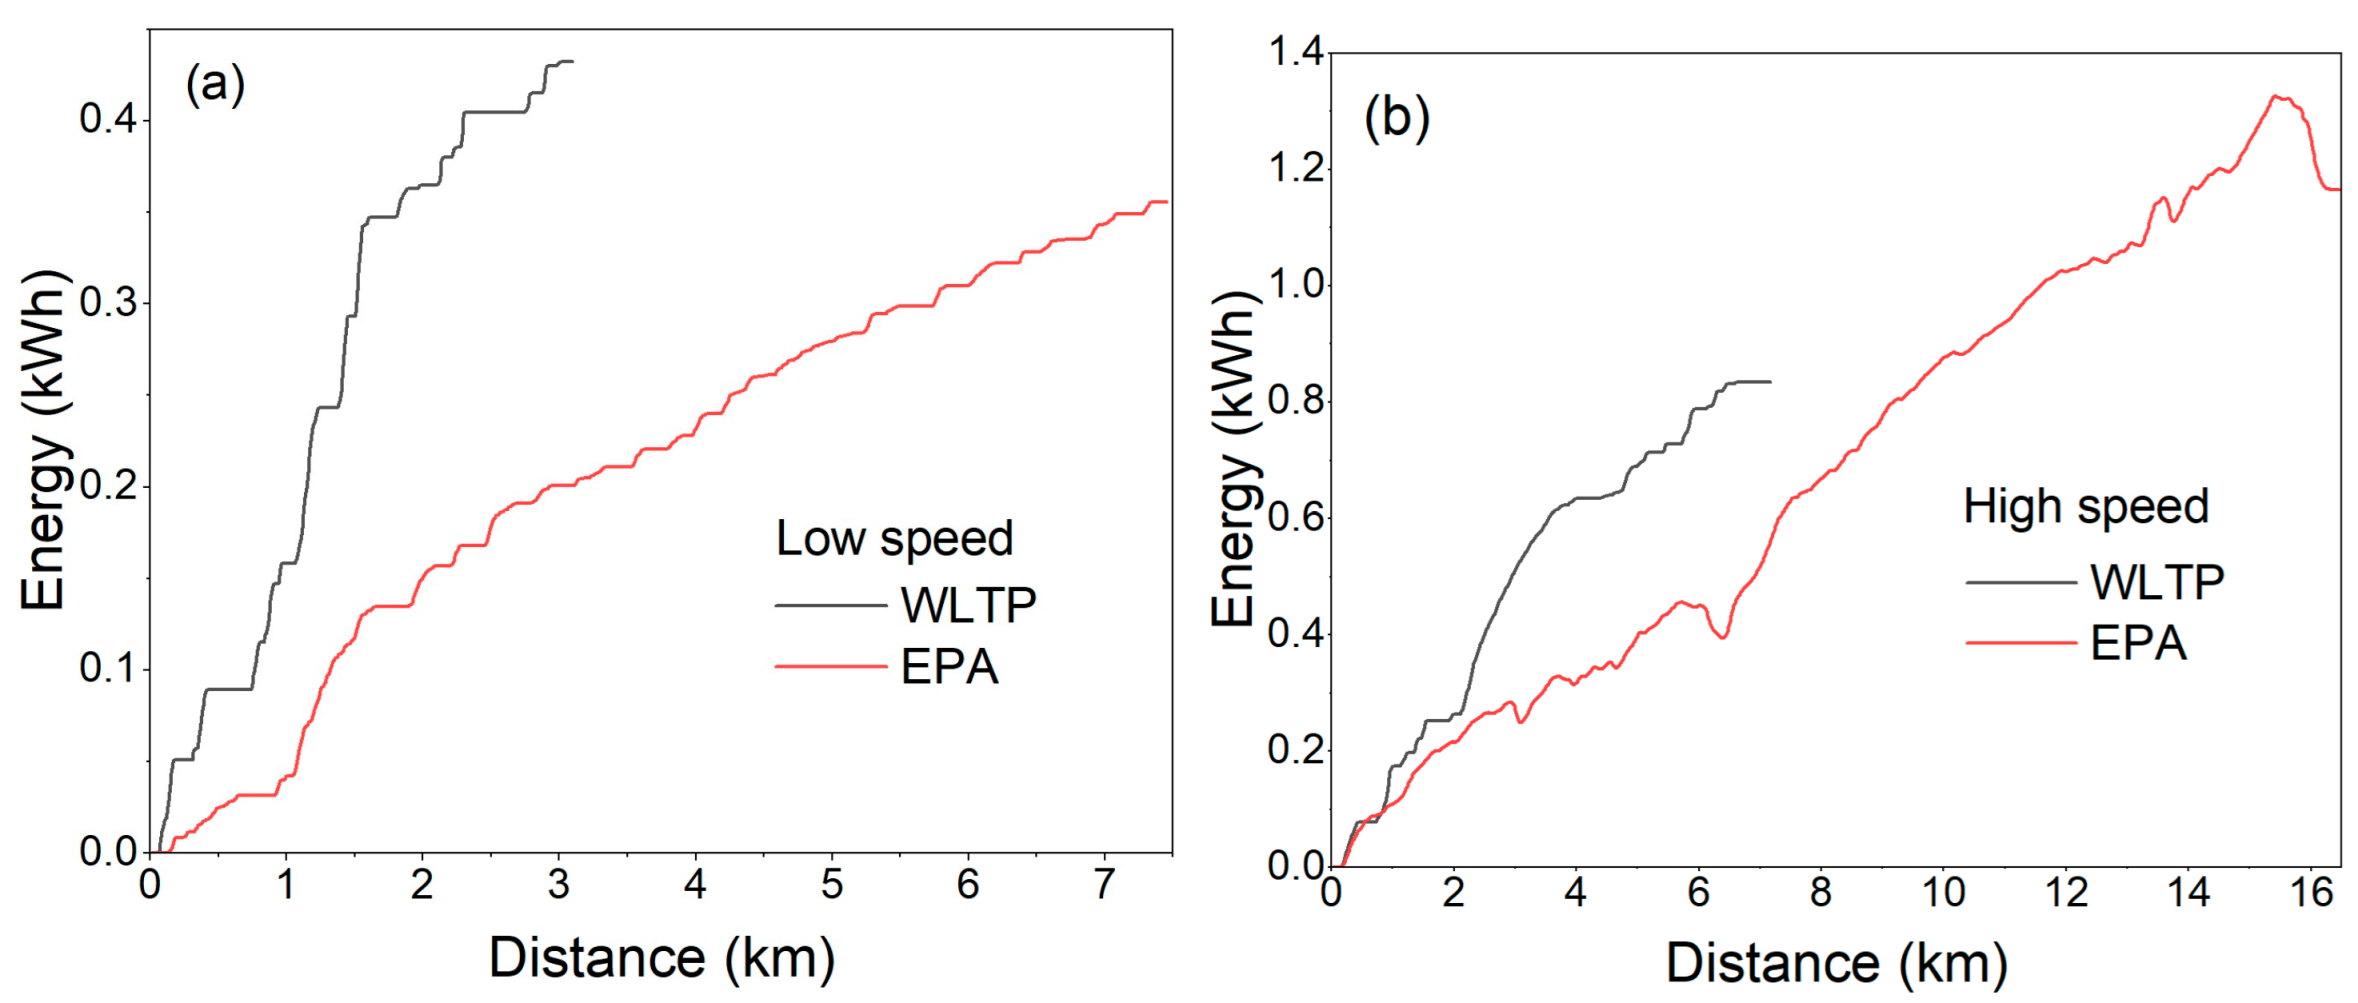
4. Results and Discussion
5. Conclusions
Author Contributions
Funding
Data Availability Statement
Conflicts of Interest
Abbreviations
| BEV | Battery Electric Vehicle |
| BMS | Battery Management System |
| DYNO | Chassis Dynamometer |
| EPA | Environmental Protection Agency |
| EV | Electric Vehicle |
| HPPC | Hybrid Pulse Power Characterization |
| IP67 | Ingress Protection Rating 67 (Dust-tight and water immersion protection) |
| LIB | Lithium Ion Battery |
| NEDC | New European Driving Cycle |
| OBD-II | On-Board Diagnostics II |
| WLTP | Worldwide Harmonized Light Vehicles Test Procedure |
Appendix A

| Symbol | Description | Unit |
|---|---|---|
| Air density | kg/m3 | |
| Drag coefficient | - | |
| Frontal area of the vehicle | m2 | |
| Vehicle velocity | m/s | |
| Rolling resistance coefficient | - | |
| Mass of the vehicle | kg | |
| Gravitational acceleration | 9.81 m/s2 | |
| Road slope angle | radians or ° | |
| Acceleration | m/s2 | |
| Total tractive force | N | |
| Aerodynamic drag force | N | |
| Rolling resistance force | N | |
| Gravitational force | N | |
| Acceleration force | N | |
| Road load force | N | |
| Power drawn from the battery | W | |
| Power delivered at the wheels | W | |
| Regenerative braking power | W | |
| Drivetrain efficiency | - | |
| Energy consumption | kWh | |
| Time | s | |
| Road load coefficients (polynomial terms in resistance model) | N, N/(m/s), N/(m/s)2 |
References
- Basso, R.; Kulcsár, B.; Egardt, B.; Lindroth, P.; Sanchez-Diaz, I. Energy Consumption Estimation Integrated into the Electric Vehicle Routing Problem. Transp. Res. D Transp. Environ. 2019, 69, 141–167. [Google Scholar] [CrossRef]
- Younes, M.B.; Boukerche, A. Towards a Sustainable Highway Road-Based Driving Protocol for Connected and Self-Driving Vehicles. IEEE Trans. Sustain. Comput. 2022, 7, 235–247. [Google Scholar] [CrossRef]
- Meng, X.; Cassandras, C.G. Eco-Driving of Autonomous Vehicles for Nonstop Crossing of Signalized Intersections. IEEE Trans. Autom. Sci. Eng. 2022, 19, 320–331. [Google Scholar] [CrossRef]
- Fiori, C.; Arcidiacono, V.; Fontaras, G.; Makridis, M.; Mattas, K.; Marzano, V.; Thiel, C.; Ciuffo, B. The Effect of Electrified Mobility on the Relationship between Traffic Conditions and Energy Consumption. Transp. Res. D Transp. Environ. 2019, 67, 275–290. [Google Scholar] [CrossRef]
- Smith, R.; Shahidinejad, S.; Blair, D.; Bibeau, E.L. Characterization of Urban Commuter Driving Profiles to Optimize Battery Size in Light-Duty Plug-in Electric Vehicles. Transp. Res. D Transp. Environ. 2011, 16, 218–224. [Google Scholar] [CrossRef]
- Speidel, S.; Bräunl, T. Driving and Charging Patterns of Electric Vehicles for Energy Usage. Renew. Sustain. Energy Rev. 2014, 40, 97–110. [Google Scholar] [CrossRef]
- Baek, D.; Chang, N.; Kim, J. Build Your Own EV: A Rapid Energy-Aware Synthesis of Electric Vehicles. IEEE Des. Test 2019, 36, 40–47. [Google Scholar] [CrossRef]
- Noval, R.; Sumarsono, D.A.; Adhitya, M.; Heryana, G.; Zainuri, F.; Tullah, M.H.; Todaro, M. Performance Evaluation and Accuracy Analysis of a Chassis Dynamometer for Light Electric Vehicles. World Electr. Veh. J. 2025, 16, 170. [Google Scholar] [CrossRef]
- Liu, K.; Wang, J.; Yamamoto, T.; Morikawa, T. Exploring the Interactive Effects of Ambient Temperature and Vehicle Auxiliary Loads on Electric Vehicle Energy Consumption. Appl. Energy 2018, 227, 324–331. [Google Scholar] [CrossRef]
- Bingham, C.; Walsh, C.; Carroll, S. Impact of Driving Characteristics on Electric Vehicle Energy Consumption and Range. IET Intell. Transp. Syst. 2012, 6, 29–35. [Google Scholar] [CrossRef]
- Yuan, X.; He, J.; Li, Y.; Liu, Y.; Ma, Y.; Bao, B.; Gu, L.; Li, L.; Zhang, H.; Jin, Y.; et al. Data-Driven Evaluation of Electric Vehicle Energy Consumption for Generalizing Standard Testing to Real-World Driving. Patterns 2024, 5, 100950. [Google Scholar] [CrossRef] [PubMed]
- Han, D.; Zamee, M.A.; Choi, G.; Kim, T.; Won, D. Optimal Electrical Vehicle Charging Planning and Routing Using Real-Time Trained Energy Prediction with Physics-Based Powertrain Model. IEEE Access 2024, 12, 123250–123266. [Google Scholar] [CrossRef]
- Vatanparvar, K.; Al Faruque, M.A. Path to Eco-Driving: Electric Vehicle HVAC and Route Joint Optimization. IEEE Des. Test 2018, 35, 8–15. [Google Scholar] [CrossRef]
- Croce, A.I.; Musolino, G.; Rindone, C.; Vitetta, A. Traffic and Energy Consumption Modelling of Electric Vehicles: Parameter Updating from Floating and Probe Vehicle Data. Energies 2021, 15, 82. [Google Scholar] [CrossRef]
- Wang, P.; Liu, Q.; Xu, N.; Ou, Y.; Wang, Y.; Meng, Z.; Liu, N.; Fu, J.; Li, J. Energy Consumption Estimation Method of Battery Electric Buses Based on Real-World Driving Data. World Electr. Veh. J. 2024, 15, 314. [Google Scholar] [CrossRef]
- Younes, M.B. Towards Green Driving: A Review of Efficient Driving Techniques. World Electr. Veh. J. 2022, 13, 103. [Google Scholar] [CrossRef]
- Tippannavar, S.S.; Yashwanth, S.D. Self-Driving Car for a Smart and Safer Environment—A Review. J. Electron. Inform. 2023, 5, 290–306. [Google Scholar] [CrossRef]
- Grano, E.; Villani, M.; de Carvalho Pinheiro, H.; Carello, M. Are We Testing Vehicles the Right Way? Challenges of Electrified and Connected Vehicles for Standard Drive Cycles and on-Road Testing. World Electr. Veh. J. 2025, 16, 94. [Google Scholar] [CrossRef]
- Sun, Z.; Wen, Z.; Zhao, X.; Yang, Y.; Li, S. Real-World Driving Cycles Adaptability of Electric Vehicles. World Electr. Veh. J. 2020, 11, 19. [Google Scholar] [CrossRef]
- Cheng, R.; Zhang, W.; Yang, J.; Wang, S.; Li, L. Analysis of the Effects of Different Driving Cycles on the Driving Range and Energy Consumption of BEVs. World Electr. Veh. J. 2025, 16, 124. [Google Scholar] [CrossRef]
- Hou, J.; Li, T.; Zhou, F.; Zhao, D.; Zhong, Y.; Yao, L.; Zeng, L. A Review of Critical State Joint Estimation Methods of Lithium-Ion Batteries in Electric Vehicles. World Electr. Veh. J. 2022, 13, 159. [Google Scholar] [CrossRef]
- Moskalik, A. Using Transmission Data to Isolate Individual Losses in Coastdown Road Load Coefficients. SAE Int. J. Adv. Curr. Pract. Mobil. 2020, 2, 2156–2171. [Google Scholar] [CrossRef] [PubMed]
- Paulina, C.; McBryde, D.; Matthews, M. Steady State Speeds Load Determinations Using Electric Vehicle Power or Dynamometer Measurements on Conventional Vehicles. SAE Int. J. Engines 2017, 10, 1820–1828. [Google Scholar] [CrossRef]
- Light Duty Vehicle Performance and Economy Measure Committee. Road Load Measurement and Dynamometer Simulation Using Coastdown Techniques; SAE International: Warrendale, PA, USA, 2017. [Google Scholar]
- von Jouanne, A.; Adegbohun, J.; Collin, R.; Stephens, M.; Thayil, B.; Li, C.; Agamloh, E.; Yokochi, A. Electric Vehicle (EV) Chassis Dynamometer Testing. In Proceedings of the 2020 IEEE Energy Conversion Congress and Exposition (ECCE), Detroit, MI, USA, 11–15 October 2020. [Google Scholar]
- WLTP Range Testing. Available online: https://evkx.net/guides/understandingrange/wltp/ (accessed on 4 June 2025).
- EPA Range Testing. Available online: https://evkx.net/guides/understandingrange/epa/ (accessed on 4 June 2025).
- Boyack, J.; Choi, J.B.; Jeong, J.; Park, H.; Kim, S. LogPath: Log Data Based Energy Consumption Analysis Enabling Electric Vehicle Path Optimization. Transp. Res. D Transp. Environ. 2024, 135, 104387. [Google Scholar] [CrossRef]
- Husain, I. Electric and Hybrid Vehicles: Design Fundamentals, 3rd ed.; CRC Press: London, UK, 2021; ISBN 9780429490927. [Google Scholar]

| Dimensions and Weight | |
| Length:Width:Height | 4612 mm:1852 mm:1640 mm |
| Wheelbase (front/rear) | 2765 mm |
| Vehicle weight | 2120 kg |
| Wheel and tire size | 20-inch alloy wheels, 235/50R20 (front), 255/50R20 (rear) |
| Performance | |
| Electric motor type | Permanent magnet synchronous motor |
| Battery type | Lithium-ion battery |
| Max power | 201 hp (150 kW) |
| Max torque | 310 N-m |
| Battery capacity | 83.4 kWh |
| Max range (NEDC mode) | 555 km |
| Driving modes | Sport/Normal/Eco/Comfort |
| Battery Cell | Type | Lithium Iron Phosphate (LiFePO4) |
| Cathode/Anode materials | Lithium Iron Phosphate/Graphite | |
| Nominal Voltage (Volts) | 3.2 | |
| Nominal Capacity (Ah) | 131 | |
| Battery Pack | Battery Dimensions (mm) | 1853 × 1129 × 183.5 |
| Total Voltage Range (Volts) | 300–438 | |
| Nominal Capacity (Ah) | 131 | |
| Nominal Voltage (Volts) | 384 | |
| Weight (kg) | 396 | |
| Water Protection Level | IP67 (Dust-tight and protected against immersion in water up to 1 m for 30 min) |
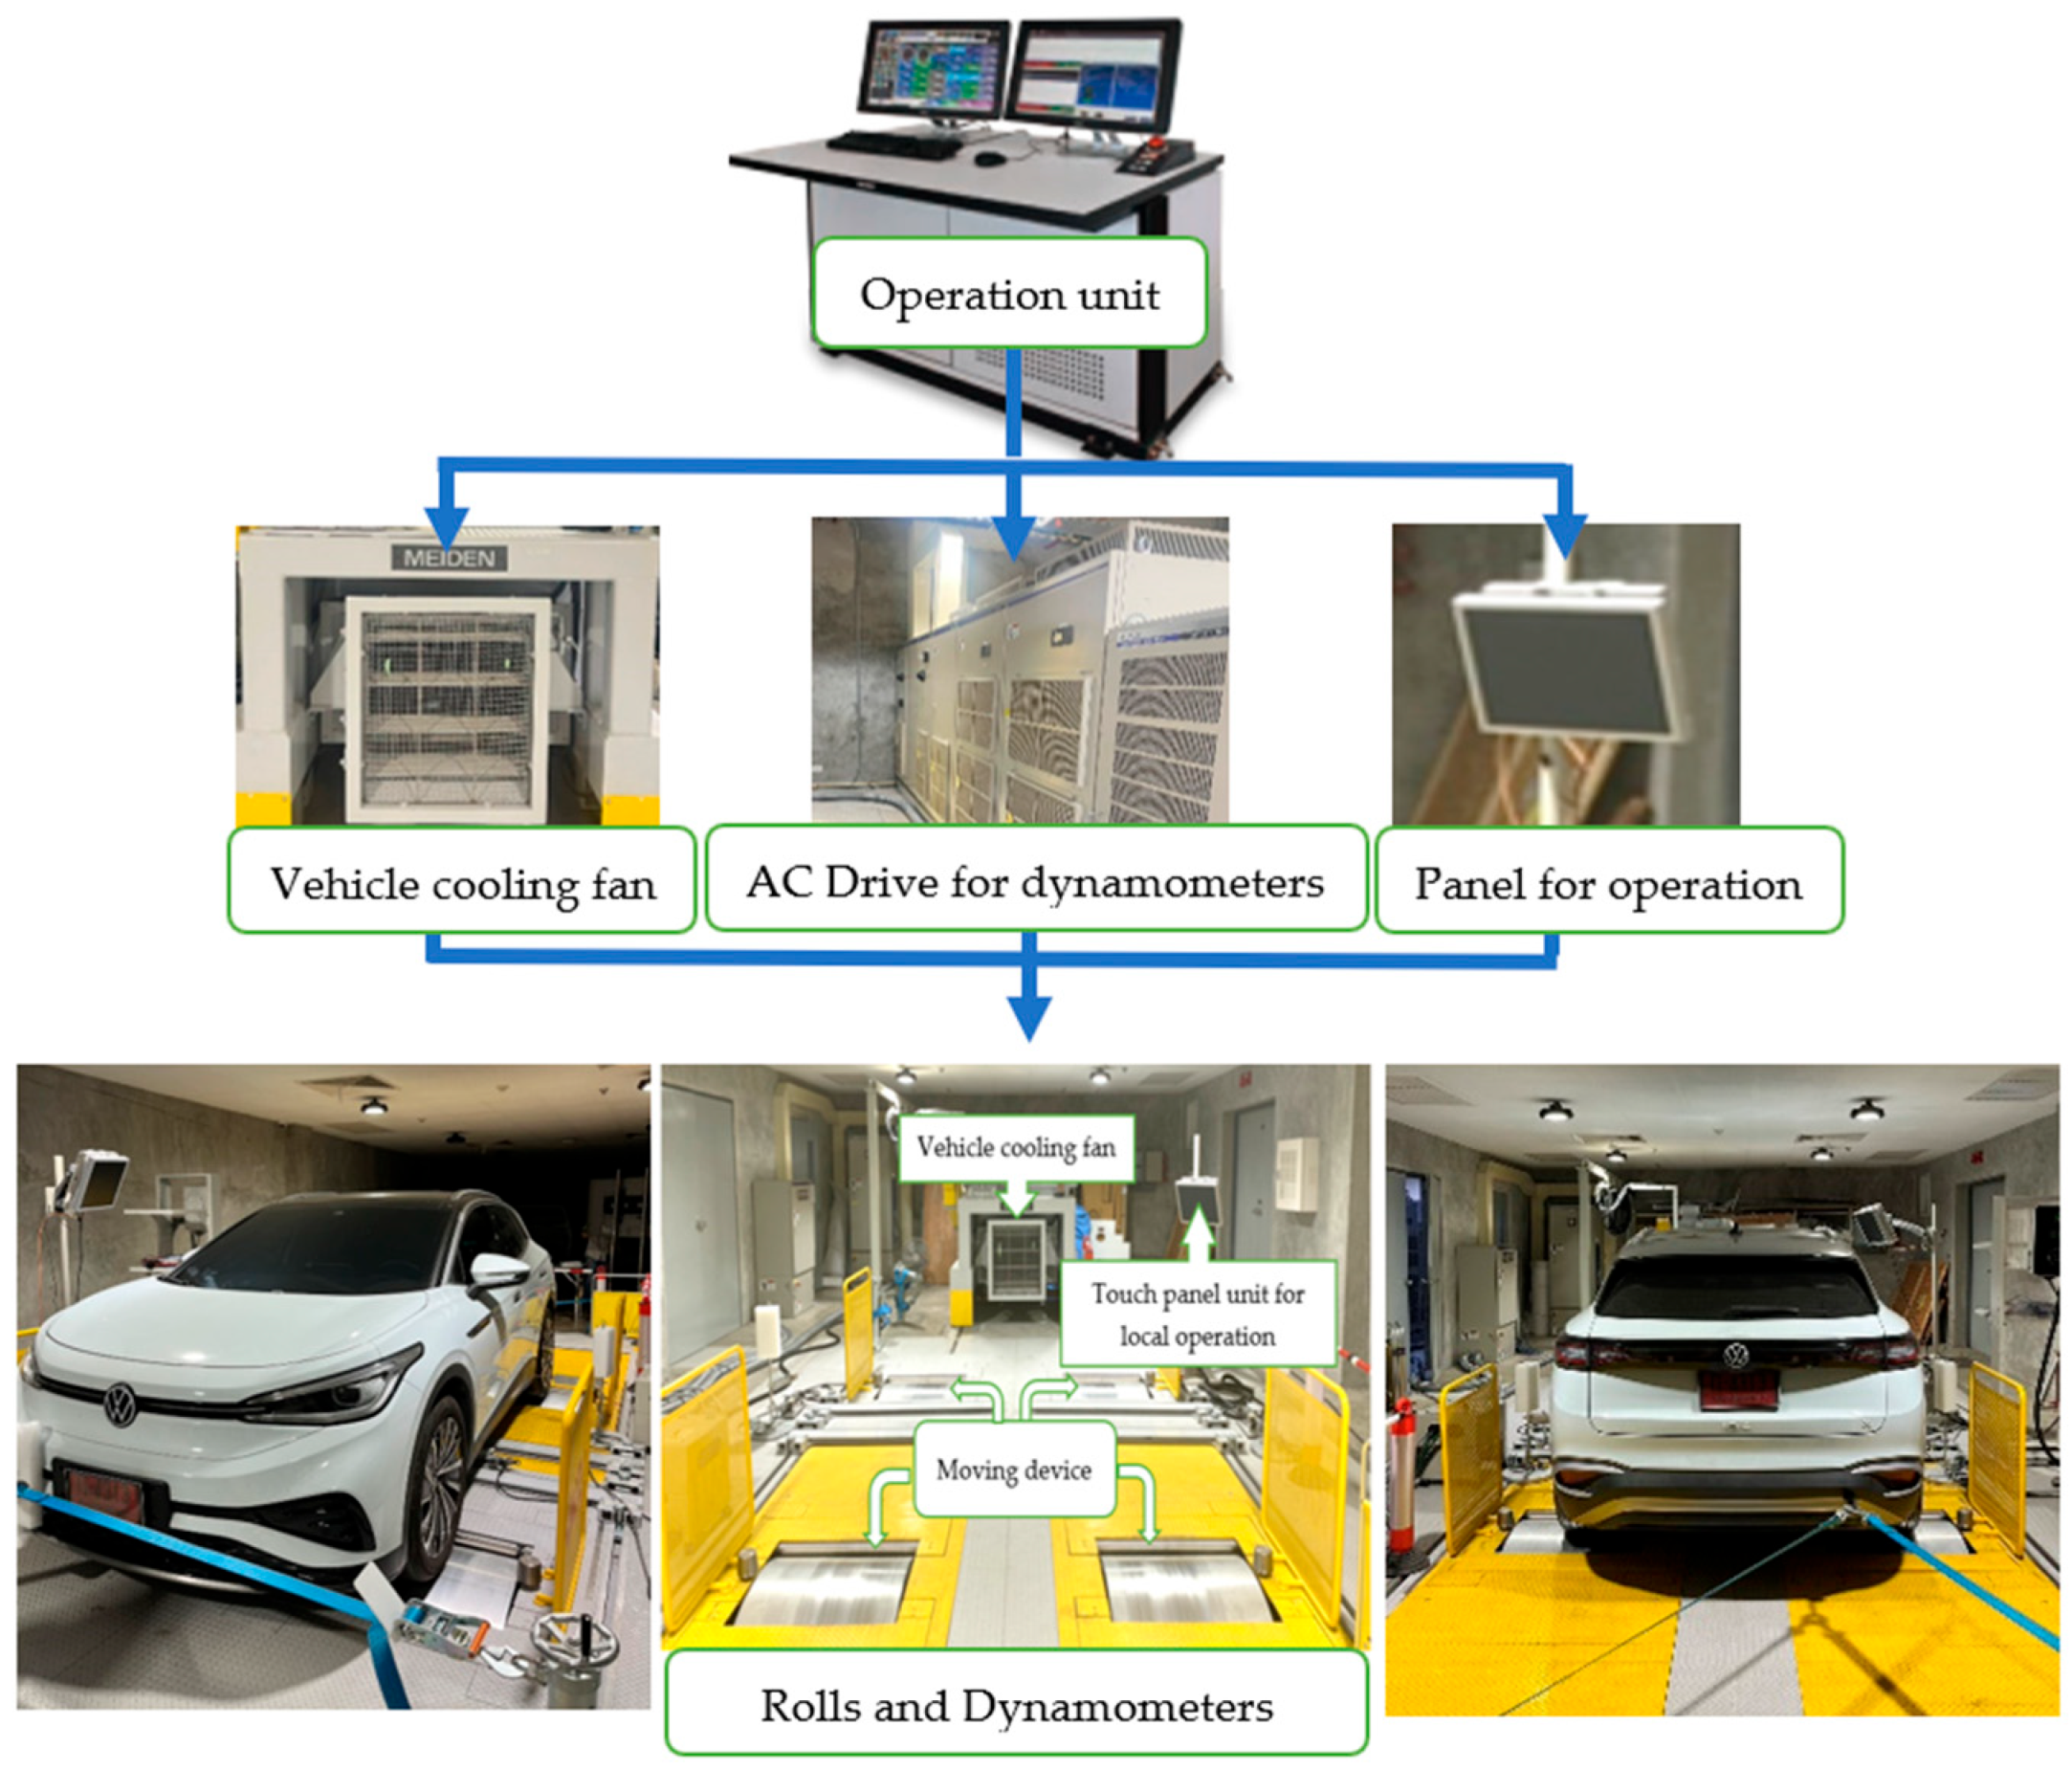
| Unit | System Configuration | Specification |
|---|---|---|
| Dynamometer | ||
| Mechanical | Dyno structure | Frame floated roller over—huge type, with remote torque calibration unit, 2-axle configuration (Front and Rear axle) |
| Roller diameter | 1219.2 mm (48 inch) | |
| Maximum speed | 250 km/h | |
| Absorbing (kW/Nm) | 2WD: 150 kW/5400 N | |
| Motoring (kW/Nm) | 2WD: 110 kW/3960 N | |
| Tire centering device | Centering method: Air cylinder type Lifting force: 20 kN per axle | |
| Electric | Dyno control unit (AC drive) | VT340DY-H4700 series |
| Operation unit | Desktop console type with touch panel | |
| Measuring rack | 19-inch rack type (2 sets) | |
| Computer system | MEIDACS-DY 6200 P | |
| Other | Vehicle cooling fan | Simulates frontal airflow; wind speed (up to 140 km/h) is controlled according to the driving profile |
| Vehicle restrain device | Forward rush-out prevention (2 sets, Font and Rear) Side run-out prevention (2 sets, Font and Rear) | |
| Tire restraint device | Fix on-drive wheel of 2WD vehicle | |
| Drive robot | Seat mount type drive robot system (Accel, Clutch, Brake, Shift, Select) | |
| Driver’s aid | Driver’s monitor with stand, remote controller | |
| Measuring tool | ||
| Power meter | WT1800 (Yokogawa) | |
| DC power supply and discharging unit (Load bank) | DC power supply for electric device: PAT60-133T (×2 sets) (Kikusui) DC load unit electric device: PLZ12005WH (Kikusui) | |
| Battery simulator | BS3030 (MEIDENSHA), Voltage: 500 V, Current: 500 A, Power: max. 200 kW | |
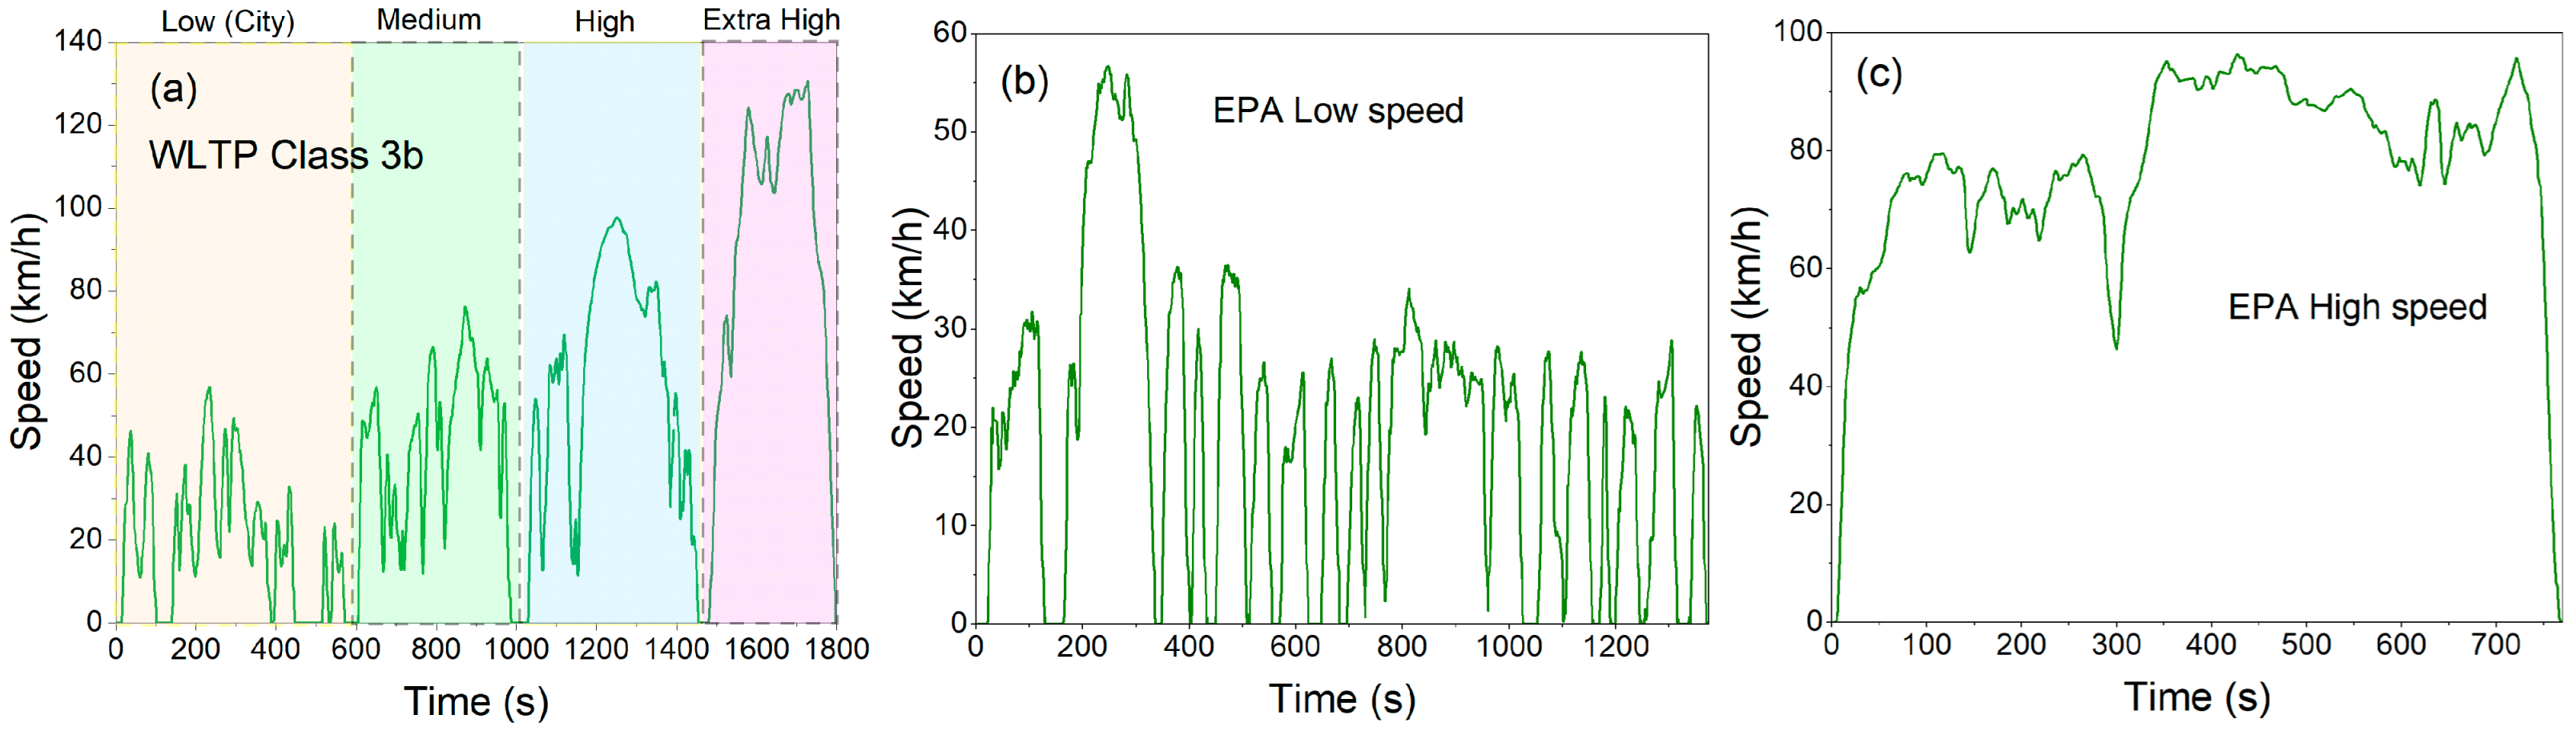
| Test Standards | Speed Ranges | Distance (km) | Average Speed (km/h) | Energy Consumption at Battery Level (kWh/km) | Energy Consumption at Wheel Level (kWh/km) |
|---|---|---|---|---|---|
| WLTP Class 3b | low | 3.09 | 18.9 | 0.224 | 0.140 |
| high | 7.16 | 56.7 | 0.125 | 0.116 | |
| EPA | low | 7.45 | 21.2 | 0.168 | 0.134 |
| high | 16.51 | 77.7 | 0.210 | 0.189 |
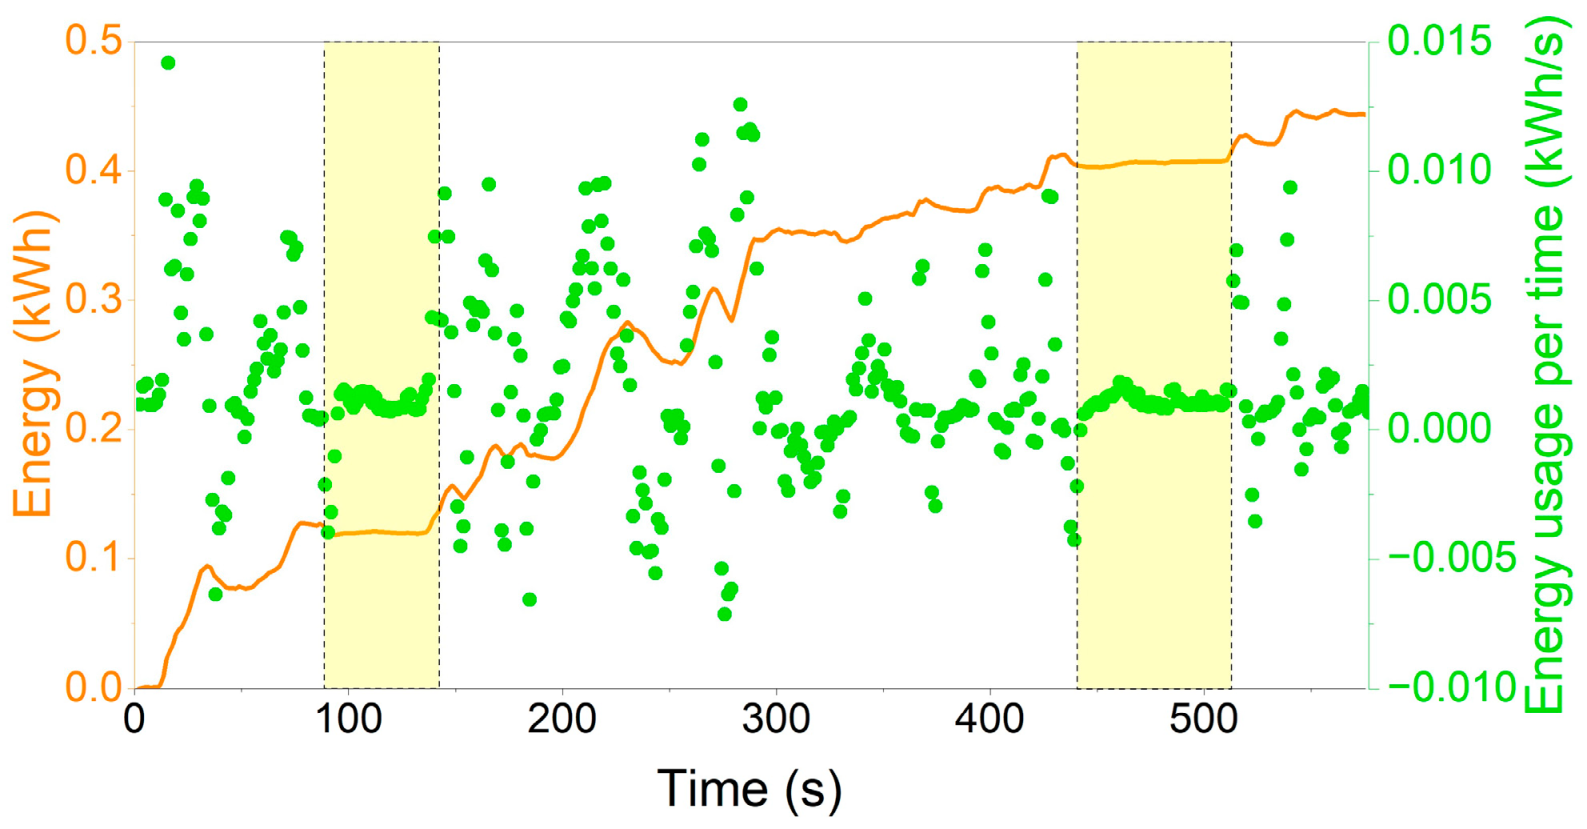
| Test Standards | Speed Ranges | Energy Drawn from the Battery (kWh) | Energy Usage Measured at the Wheels (kWh) | Efficiency (%) |
|---|---|---|---|---|
| WLTP | low | 0.692 | 0.432 | 62.42 |
| high | 0.898 | 0.835 | 92.98 | |
| EPA | low | 0.421 | 0.355 | 84.52 |
| high | 1.502 | 1.397 | 93.00 |
Disclaimer/Publisher’s Note: The statements, opinions and data contained in all publications are solely those of the individual author(s) and contributor(s) and not of MDPI and/or the editor(s). MDPI and/or the editor(s) disclaim responsibility for any injury to people or property resulting from any ideas, methods, instructions or products referred to in the content. |
© 2025 by the authors. Published by MDPI on behalf of the World Electric Vehicle Association. Licensee MDPI, Basel, Switzerland. This article is an open access article distributed under the terms and conditions of the Creative Commons Attribution (CC BY) license (https://creativecommons.org/licenses/by/4.0/).
Share and Cite
Phophongviwat, T.; Poopanya, P.; Sivalertporn, K. Quantitative Assessment of EV Energy Consumption: Applying Coast Down Testing to WLTP and EPA Protocols. World Electr. Veh. J. 2025, 16, 360. https://doi.org/10.3390/wevj16070360
Phophongviwat T, Poopanya P, Sivalertporn K. Quantitative Assessment of EV Energy Consumption: Applying Coast Down Testing to WLTP and EPA Protocols. World Electric Vehicle Journal. 2025; 16(7):360. https://doi.org/10.3390/wevj16070360
Chicago/Turabian StylePhophongviwat, Teeraphon, Piyawong Poopanya, and Kanchana Sivalertporn. 2025. "Quantitative Assessment of EV Energy Consumption: Applying Coast Down Testing to WLTP and EPA Protocols" World Electric Vehicle Journal 16, no. 7: 360. https://doi.org/10.3390/wevj16070360
APA StylePhophongviwat, T., Poopanya, P., & Sivalertporn, K. (2025). Quantitative Assessment of EV Energy Consumption: Applying Coast Down Testing to WLTP and EPA Protocols. World Electric Vehicle Journal, 16(7), 360. https://doi.org/10.3390/wevj16070360