Article

Optimization of Thermoelectric Module Configuration and Cooling Performance in Thermoelectric-Based Battery Thermal Management System

1
School of Automotive Technology, Zhejiang Agricultural Business College, Shaoxing 312088, China
2
Intelligent Vehicle Team, Hunan University, Changsha 410082, China
*
Author to whom correspondence should be addressed.
World Electr. Veh. J. 2025, 16(7), 344; https://doi.org/10.3390/wevj16070344
Submission received: 8 May 2025 / Revised: 16 June 2025 / Accepted: 20 June 2025 / Published: 22 June 2025
(This article belongs to the Special Issue Thermal Management System for Battery Electric Vehicle)

Abstract

A good thermal management system for batteries is the key to solving potential risks such as the thermal runaway of batteries and ensuring that the batteries work within the appropriate temperature range. To resolve the conflict between cooling efficiency and input power in existing battery thermal management systems based on thermoelectric cooling, this paper proposes an optimization method for the layout of thermoelectric devices. Using a multi-physics coupling numerical model, this study focuses on analyzing the impact of the quantity of thermoelectric devices and input current on battery temperature. The optimal arrangement structure and system response characteristics are investigated from four aspects: maximum temperature, maximum temperature difference, temperature difference uniformity, and cooling coefficient. The research results show that the optimized system is capable of reducing both the maximum temperature and the maximum temperature difference within the battery pack, and reduces the input power consumption by 19.8%, effectively enhancing the energy efficiency of the system.

1. Introduction

In the process of the rapid development of electric vehicles, there are both opportunities and challenges, among which the problem of electric vehicle fire is particularly prominent. The main causes of fires include spontaneous battery combustion and charging problems. For batteries, the temperature of the working environment has a significant influence on their safety and performance. Low temperatures reduce battery life and capacity, while high temperatures increase the thermal runaway risk. Therefore, a well-designed thermal management system is crucial for maintaining batteries in a suitable temperature range, and this has become a key area of research in the electric vehicle industry.
Currently, thermal management techniques include air cooling, liquid cooling, thermoelectric cooling, and other thermal management techniques. Current air cooling technology usually refers to forced convection heat transfer technology. Relevant studies mainly focus on the arrangement of cells, the design of air duct structure, the position of air inlet and outlet, and power consumption. Yan et al. [1] determined the optimal operating conditions for the wet pad-assisted air cooling battery thermal management system. Wrapping each battery in a 0.5 mm aluminum sheet can reduce the maximum surface temperature and temperature difference in the battery pack. Na et al. [2] arranged the cooling spacer transversely in the battery box, in which the flow channels were divided into multiple layers and adjacent channels flowed in opposite directions, and this arrangement structure could reduce the maximum average temperature difference by 54.5%. Su et al. [3] proposed an air-cooled energy storage battery composite thermal management system, which aimed to overcome the high cost, complex structure, and poor stability of battery packs. Zhang et al. [4] made a transient model for the thermal management system of air-cooled batteries and designed the widths of the parallel and diverging channels through this model to significantly improve the cooling performance. Amir et al. [5] researched the effects of pulsating and non-pulsating flows on the thermal performance of battery packs. During discharge, lower Strouhal numbers resulted in poorer cooling performance but were the most energy-efficient configuration. However, higher Strouhal numbers, while achieving optimal thermal performance, led to increased pump power requirements. Zhou et al. [6] used air piping for the forced cooling of a battery to improve the cooling efficiency of the system. Zhang et al. [7] made a battery thermal management system based on a micro heat pipe array. It can effectively regulate the battery temperature.
Compared with an air-cooled thermal management system, a liquid-cooled thermal management system has a higher convective heat transfer. Liquid cooling thermal management systems are mainly classified into direct-cooled and inter-cooled systems. A direct-cooling thermal management system mainly refers to the direct contact between the coolant and the battery to enhance the battery homogeneity through the phase transition heat of the coolant [8,9]. Liu et al. [10] proposed a composite battery thermal management method based on phase change materials and oil immersion cooling. Tang et al. [11] made a novel parallel flow immersion cooling battery thermal management system. Their research found that baffles can significantly reduce the maximum temperature. Wei et al. [12] proposed an inlet coolant variable temperature cooling scheme that can reduce the maximum temperature from 48.73 °C to 30.75 °C. Luo et al. [13] proposed an immersion-type thermal management system based on synthetic ester fluid. Compared with the air battery thermal management system, the temperature dropped significantly.
Compared with direct cooling systems, indirect cooling systems for batteries maintain good cooling performance for liquid components. In addition to common coolants, scholars at home and abroad have separately studied different coolant workmasses, such as liquid metal [14], PCS (phase change slurry) [15], polymerized fibers [16], and nanofluids [17], and many other fluid workmasses, which can exhibit excellent heat dissipation performance for battery packs. Li et al. [18] made a U-shaped channel to place the battery and cooling plate in a stack, and analyzed the influence of coolant mass flow rate as well as discharge multiplier on the heat dissipation effect. Sheng et al. [19] developed a honeycomb cooling jacket structure and analyzed the effects of fluid flow rate and cooling channel size on the thermal performance. Al-Zareer et al. [20] fabricated a curvilinear cooling channel based on 3D printing additive materials and investigated the performance at different charge multiples. Xie et al. [21] used an improved topological technique in the literature to enhance the performance of liquid cooling plates. This resulted in reductions in both the effective thermal resistance and pump power. Liu et al. [22] designed and optimized a hybrid cooling system combining phase change material and liquid cooling, and analyzed and investigated the coupling effect of composite material, fin arrangement, and ambient temperature on the battery pack.
Thermoelectric coolers (TECs) refer to the use of the Peltier effect to achieve thermal management of the battery temperature, with the advantages of good initiative, non-pollution, and high reliability. In a study of heat dissipation in automotive power batteries, Yu et al. [23] researched the effect of the cold end temperature of thermoelectric coolers on the battery packs. By adjusting the cold end temperature, the heat dissipation efficiency of systems was improved. Lyu et al. [24] coupled liquid cooling with thermoelectric cooling and showed that this method can result in up to a 70% reduction in cell wall temperature. Park et al. [25] embedded a filler material with a large power factor into the TEC, which could lead to a 42.5% increase in effective thermal conductivity. Jiang et al. [26] studied the transient and steady-state thermal properties of thermoelectric materials and compared them with liquid and air cooling. Increasing the number of thermoelectric arms had a good effect on improving the performance of thermoelectric modules. Zhang et al. [27] combined phase change materials with thermoelectric cooling pads to improve cell temperature uniformity. Liu et al. [28] combined TEC and PCM in a hybrid BTMS. Through comparative analysis, it was found that adding PCM improves temperature uniformity. Liu et al. [29] combined TEC and PCM. The results showed that when the fin thickness was 8 mm and the current was 6 A, the temperature control time increased. Luo et al. [30] made a novel battery thermal management system combining thermoelectric cooling and liquid cooling. Pan et al. [31] designed a battery thermal management system based on thermoelectric cooling and liquid cooling plates for cooling or heating batteries.
At present, scholars at home and abroad have made many achievements in the field of the thermal management systems of batteries, but there are still the following shortcomings: On the one hand, the existing thermal management system is mostly passive heat dissipation, so it is difficult to regulate the uniformity of the battery temperature distribution actively, and there are problems such as low thermal conductivity and large space occupation. On the other hand, although the thermoelectric cooling system has been applied, there is a contradiction between cooling performance and input power.
In response to the above issues, this study aims to improve the cooling efficiency of the thermoelectric management system and reduce its input power by optimizing the layout of thermoelectric elements.

2. Structural Components and Optimization Methods of Thermoelectric Cooling Thermal Management Systems

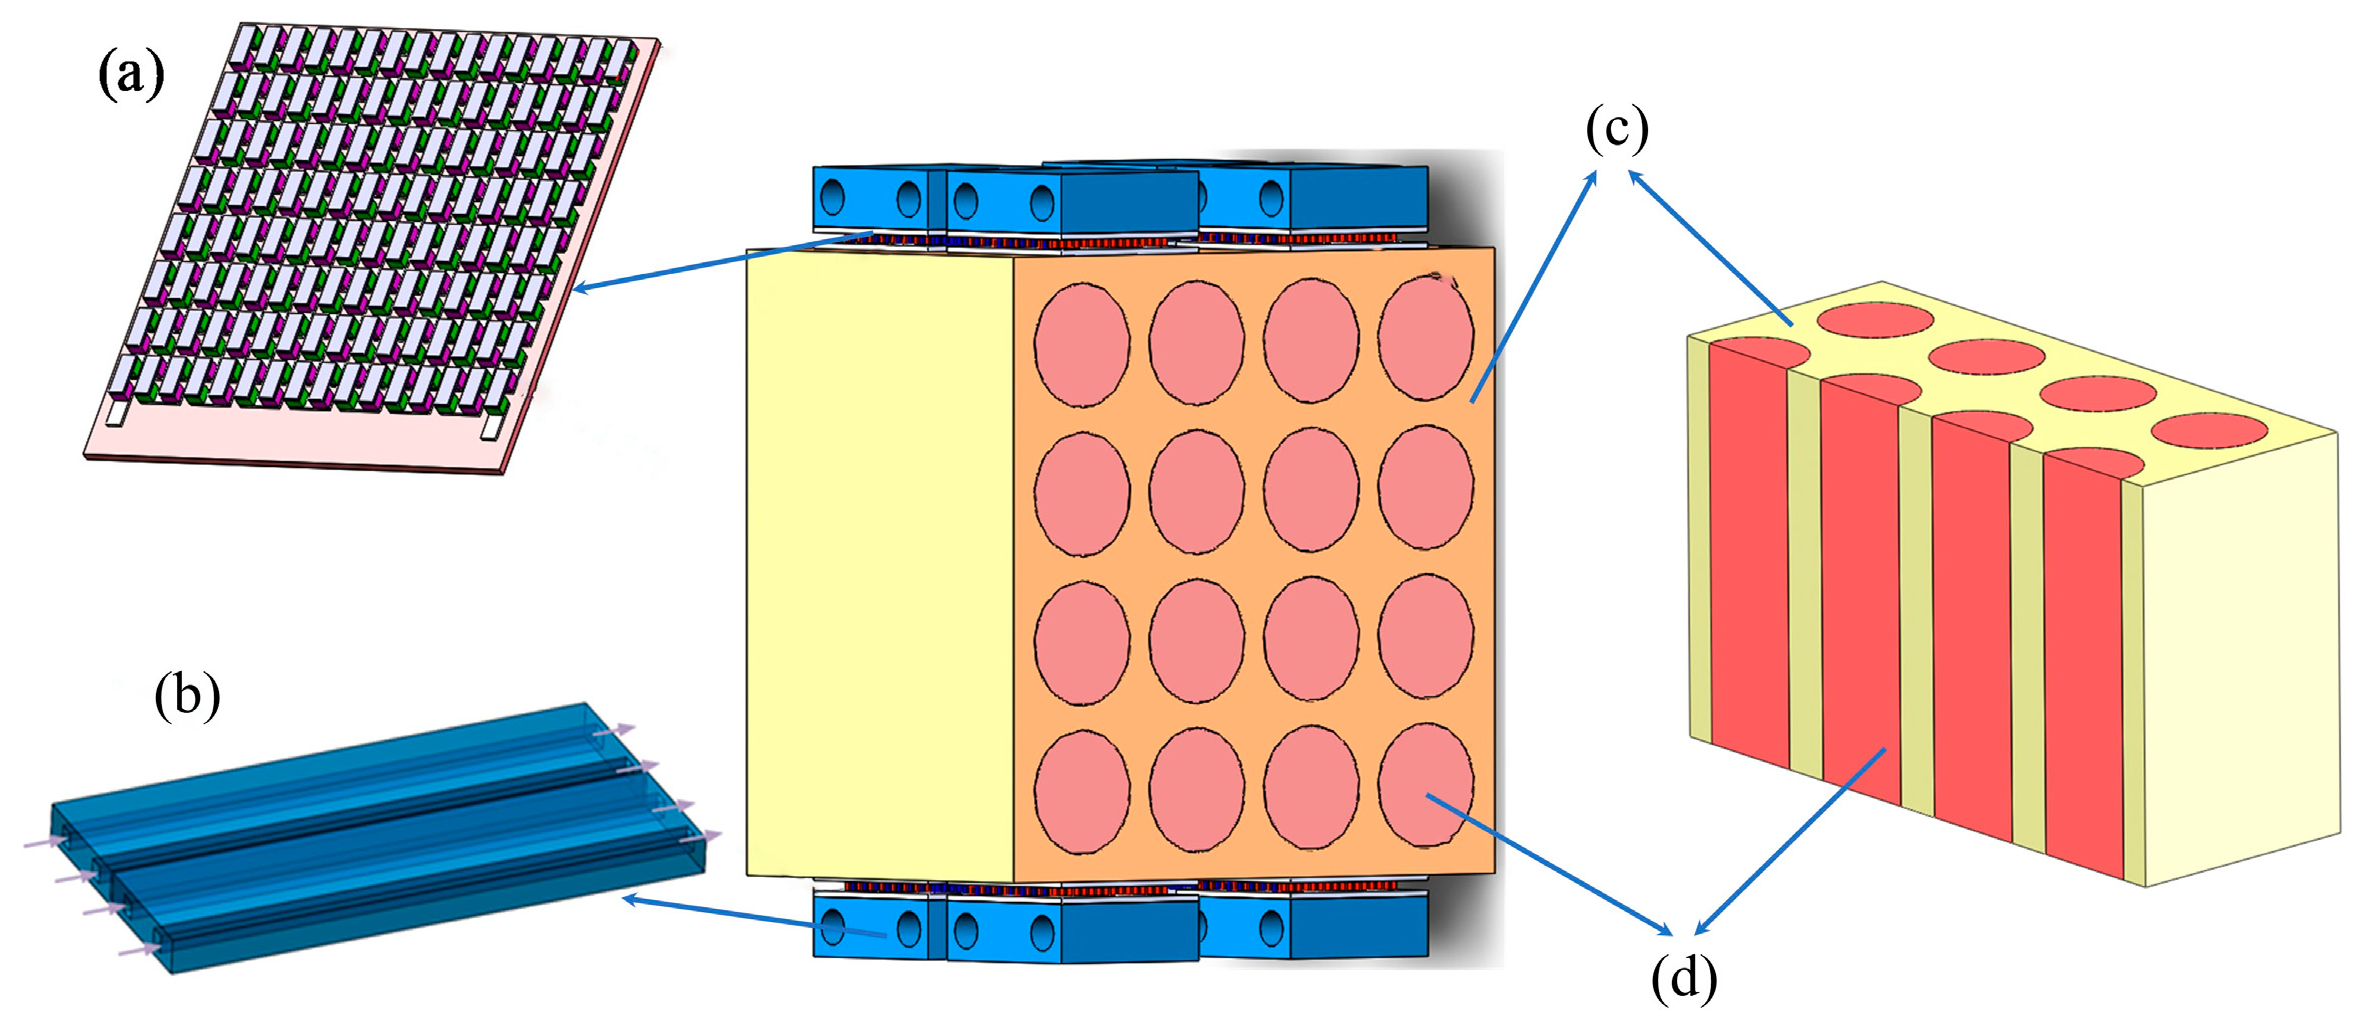
2.1. Structural Components

The thermoelectric cooling thermal management system is composed of four parts: a thermoelectric cooler (TEC), water-cooled plates, batteries, and a thermal conductivity framework. Its structure is schematically shown in Figure 1.
This paper studies a battery pack formed by connecting 16 batteries in series. The batteries are fixed using an aluminum thermal conductivity framework, and identical TECs are arranged at both ends of the thermal conductivity framework. Adjacent TECs share a water-cooled plate. The thermal conductivity framework transfers the heat generated inside the batteries to the cold end of the TECs. The parameters of the TECs and the 18650 battery used in this paper are shown in Table 1 and Table 2, respectively.

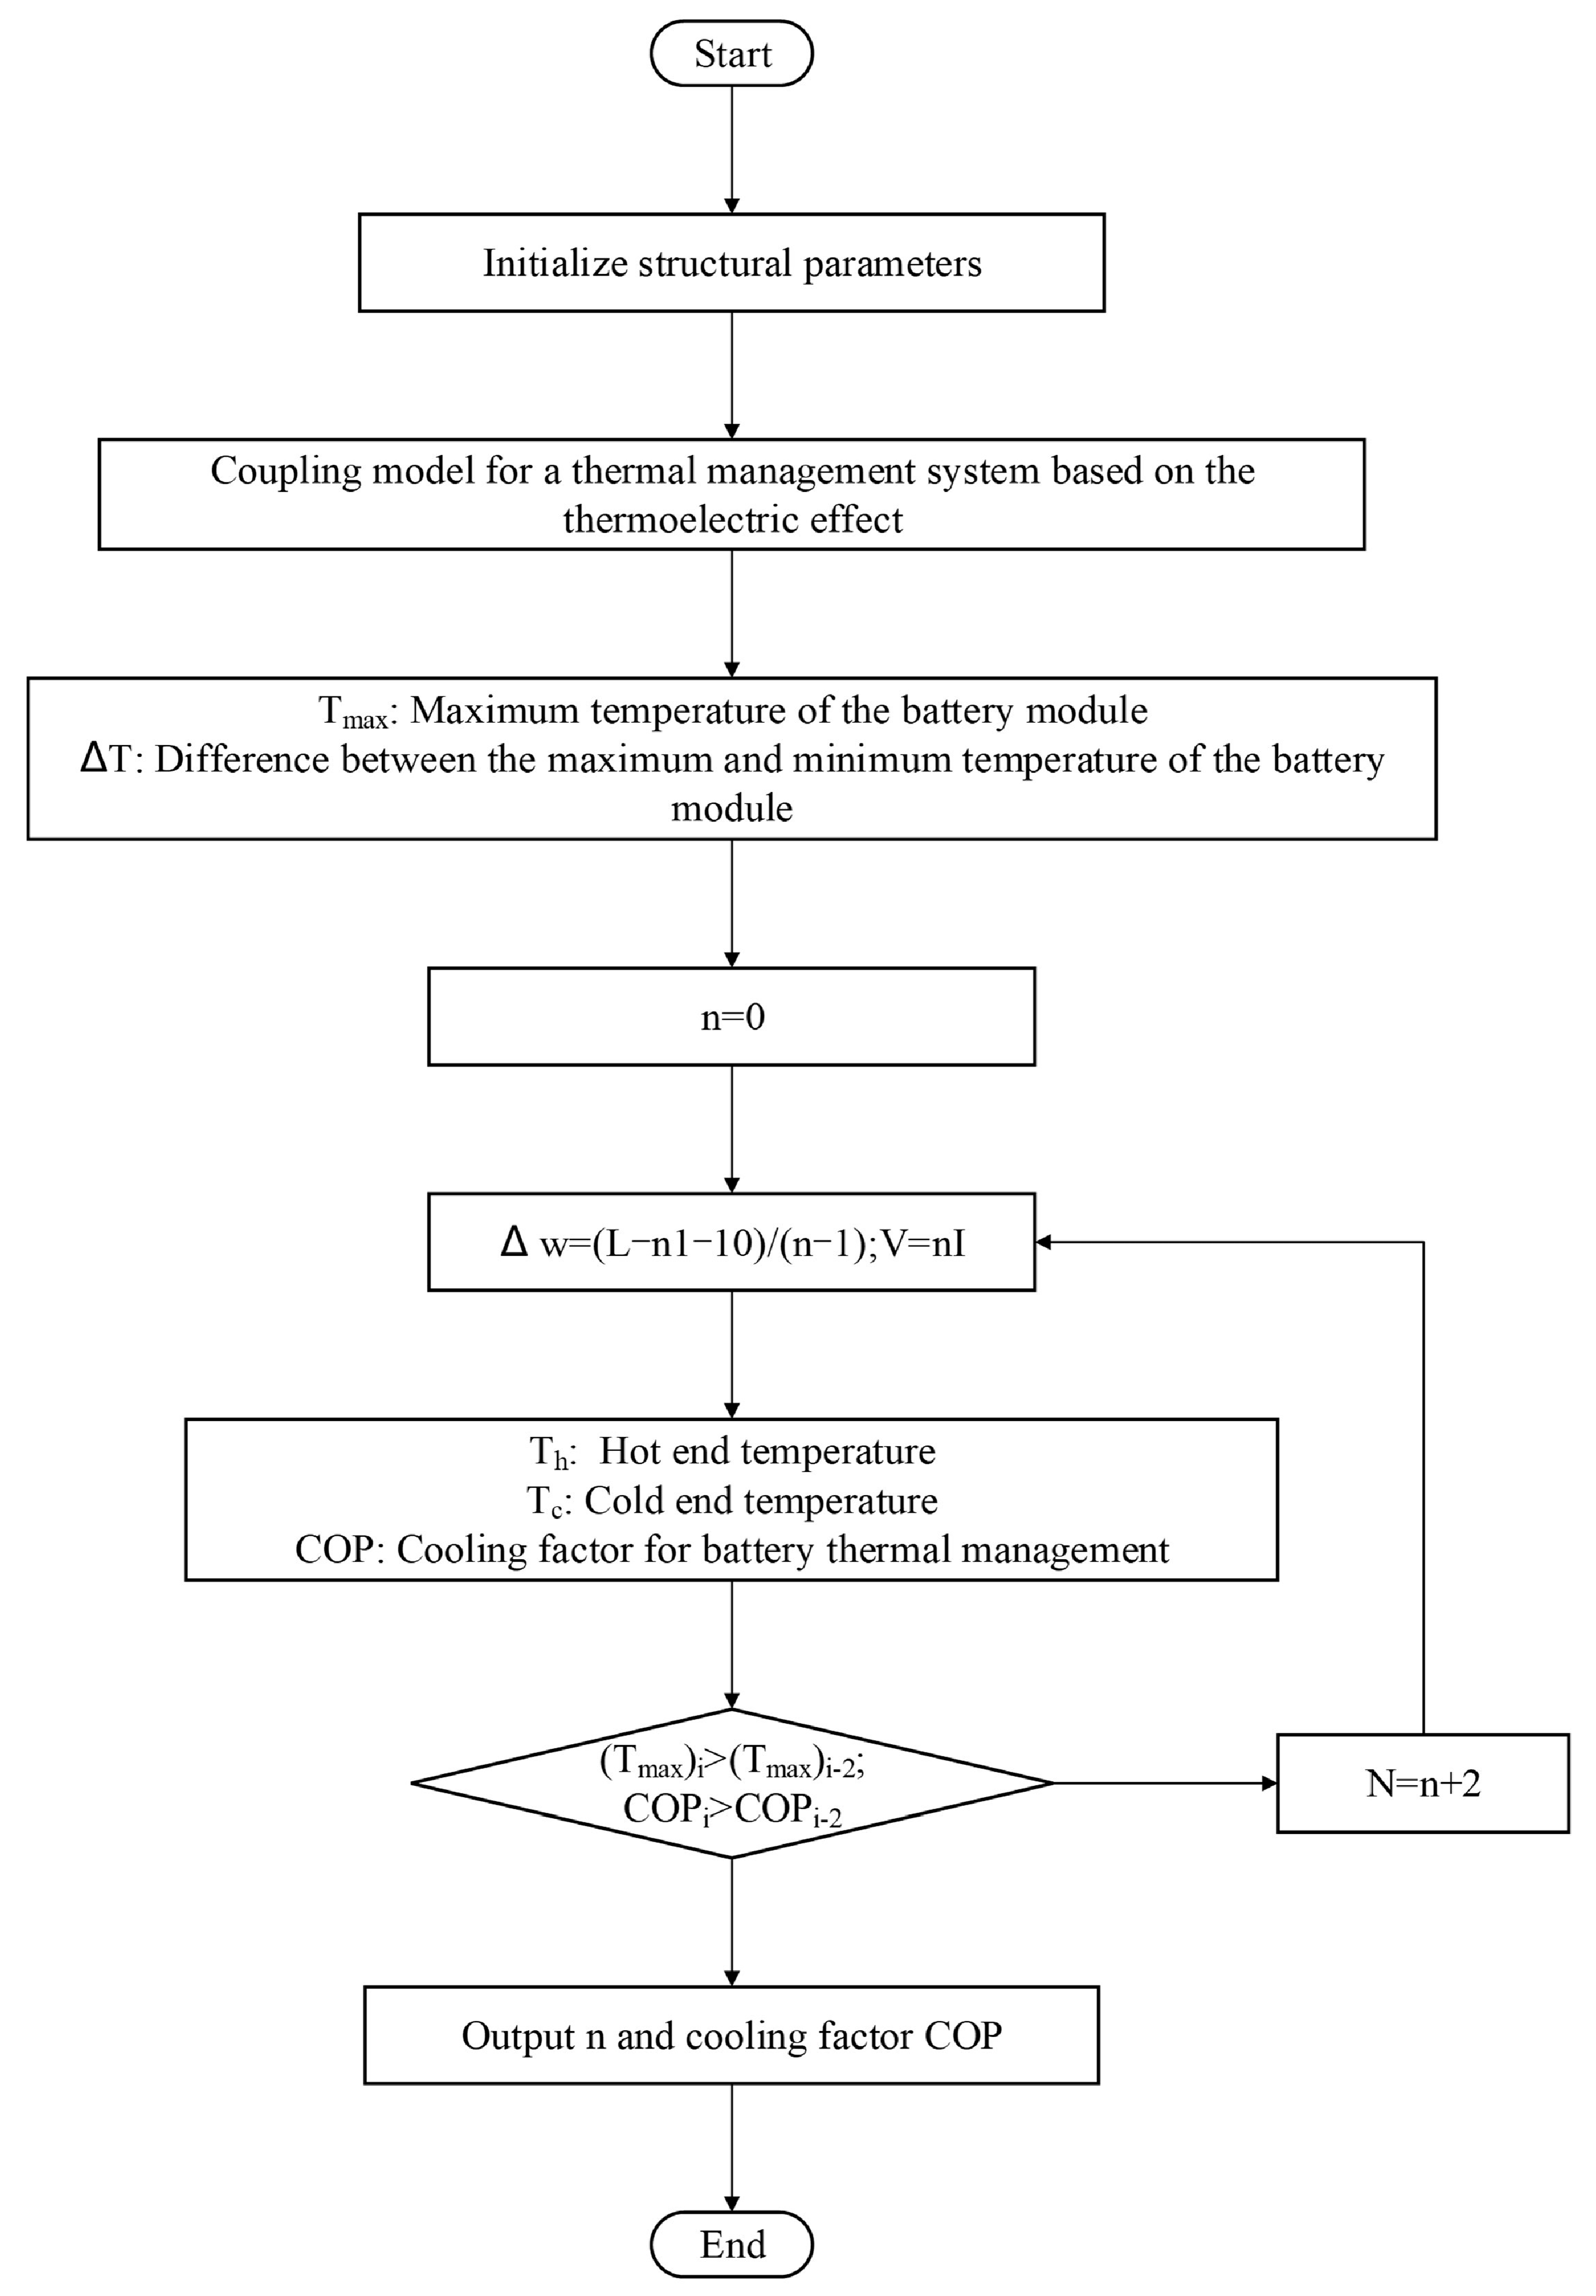
2.2. Optimization Methods

The process for determining the optimal number of TECs in the battery thermal management system studied in this research is shown in Figure 2.
First, the three-dimensional structural model of the battery is constructed, which mainly consists of two parts: a thermal conductivity framework for structural fixation of the battery and the enhancement of heat transfer, and 16 batteries. Among the important dimensional parameters are the length (Lf) and width (Lw) of the thermal conductivity framework; the spacing between individual batteries (Lspace); and the spacing from individual batteries to the thermal conductivity framework (Lwall). The structure of the system based on the thermoelectric effect is schematically illustrated for each parameter in Figure 3 below.
Secondly, the variable of the thermoelectric effect-based thermal management system is the number of TECs n. In this paper, by changing the position of the TECs to make them uniformly distributed at the surface of the battery, the temperature uniformity is improved as much as possible, which in turn improves the cooling efficiency of the system. Since the number of TECs at both ends of the thermal conductivity framework is the same, the n appearing in the rest of this article represents the number of TECs on one side of the thermal conductivity framework. As shown in Figure 3b,c, the arrangement of TECs in this study is mainly divided into two types of arrangements with even and odd numbers, i.e., n = 1, 3, 5 and n = 0, 2, 4, 6. When n is odd, the TECs are centered uniformly in the lateral direction, i.e., the TECs are equidistant from both sides. If n is even, the TECs are divided into two columns, uniformly distributed at the top and bottom of the thermal conductivity framework.
Finally, the optimal number of TECs is determined. Based on the COMSOL 6.1 simulation software platform, the simulation analysis of the system based on the thermoelectric effect is carried out to obtain the distribution of the thermal, flow, electric, and electrochemical fields of the system with different numbers of TECs, and then the maximum temperature T m a x , the maximum temperature difference Δ T , the average temperature T a v e , and the cooling coefficient COP of the system can be calculated for different numbers of TECs of the battery pack.

3. Numerical Modeling and Evaluation Indicators

To save time and cost, the following assumptions were made before constructing an electrochemical–electrical–fluid–thermal multiphysics field model for the thermoelectric heat management system:
(1) To simplify the calculations, the flow of the thermal fluid is set to a steady state condition (with parameters such as heat capacity, thermal conductivity, and density remaining stable) in the course of multi-physical field analysis;
(2) The heat generated by the battery is evenly distributed in the radial direction and diffuses evenly in all directions in the axial direction;
(3) The influence of gravity on fluid flow is not considered;
(4) The effects of thermal radiation are not taken into account.

3.1. Numerical Modeling

The heat generation of the batteries in column coordinates follows the heat transfer equation in Equation (1) below:
ρ C p T t = λ r r r ( r T r ) + λ φ r 2 2 T φ 2 + λ z 2 T z 2 + Q
where ρ and C p are the equivalent density and specific heat capacity of the batteries, and λ r , λ φ , and λ z are the thermal conductivity of the thermal conductivity along the radial, circumferential, and axial directions, respectively.
For the solid region at the liquid-cooled end of the system, the law of the conservation of energy needs to be followed to satisfy the following Equation (2):
( λ T ) = 0
The TEC follows the thermoelectric coupling effect during its operation. Equations (3)–(6) are the energy conservation equations for semiconductors, copper electrode plates, and ceramic plates, respectively:
t ( ρ p c p , P T p ) = ( λ p ( T ) T P ) + σ P 1 ( T ) J 2 α P ( T ) J T P α P ( T ) T P T P J T
t ( ρ N c p , N T N ) = ( λ N ( T ) T N ) + σ N 1 ( T ) J 2 α N ( T ) J T N α N ( T ) T N T N J T
t ( ρ c o c p , c o T c o ) = ( λ c o ( T ) ) + σ c o 1 J 2
t ( ρ c e c p , c e T c e ) = ( λ c e ( T ) )
where J 2 , σ 1 , and α represent the current density vector, resistivity, and Seebeck coefficient, respectively. In the energy saving equations for P-type and N-type semiconductors, the rightmost three terms represent, in order from left to right, Joule heat, Peltier heat, and Thomson heat. The thermoelectric effect does not exist in the copper electrode plate; therefore, Peltier heat and Thomson heat are not generated. The ceramic plate itself is insulated, so there is only a heat conduction process.
In addition, semiconductors and copper electrodes should follow the following equations for the conservation of electric field as well as for the continuity of current:
J = σ E
E = ϕ + α T
Δ J = 0
Δ ( σ ϕ ) = 0
where E is the current density vector and ϕ is the potential.
A liquid cooling system above the TECs can accelerate the cooling efficiency of the cold side and increase the efficiency. The liquid cooling system coolant in this study is water. In general, water is incompressible. Therefore, for incompressible fluid the following equations of the conservation of mass, momentum, and energy apply:
v = 0
( v v ) = 1 ρ p + ( μ v )
( λ T ) = ρ c v T
where v is the cooling water flow rate in m/s; p is the cooling water pressure in Pa; ρ is the fluid material density; μ is the cooling water dynamic viscosity in Pa-s; λ is the material thermal conductivity coefficient; T is the cooling water temperature in K; and c is the cooling water specific heat capacity.
The cooling water at the cooling end presents a turbulent flow pattern, so this paper uses the k-ε model to characterize its fluid flow, and its control equations are as follows:
t ( ρ k ) + x j ( ρ k μ i ) = x j μ + μ t σ k k x j + G k + G b ρ ε Y M + S K
t ( ρ ε ) + x j ( ρ ε u i ) = x j μ + μ t σ ε ε x j + C 1 ε ε k ( G k + C 3 ε G b ) C 2 ε ρ ε 2 k + S e
Equations (13) and (14) represent turbulent kinetic energy and turbulent kinetic energy dissipation rate, where G k and G b represent the turbulent kinetic energy generation terms caused by average velocity gradient and buoyancy, respectively; and Y M denotes the degree of contribution of fluctuating expansion to the dissipation rate.

3.2. Heat Generation Mechanism of Lithium Batteries

During normal operation, batteries convert chemical energy into electrical energy, while a portion of the energy is converted into heat, Q1. In addition, battery heat generation also includes Joule heat, Q2, polarization heat, Q3, and heat from side reactions, Q4, with the heat from side reactions typically being small and negligible.
Q 1 = n m Q e I M F
Q 2 = I 2 R Ω
Q 3 = I 2 R p
where n is the number of charges transferred during the reaction; m is the electrode mass; Qe is the total heat generated; I is the current; M is the molar mass; F is the Faraday constant; RΩ is the internal resistance; and Rp is the polarization internal resistance.
In summary, the total heat generated by the battery is:
Q = Q 1 + Q 2 + Q 3

3.3. Evaluation Indicators

The cooling coefficient COP is an important indicator for evaluating the cooling capacity in the system, and refers to the ratio of the cooling capacity and the average power consumed in the thermal management system.
COP = Q c o o l i n g P T E C + P p u m p
where Q c o o l i n g is the heat absorption capacity of the cold end of the TEC, and P p u m p is the pump power required to maintain the cooling water mass flow rate.
The maximum temperature is the temperature of the whole battery pack, the maximum temperature difference is the difference between the highest temperature and the lowest temperature in the battery pack, calculated as follows:
T = T m a x T m i n
The uniform temperature refers to the arithmetic mean of the average temperature of each battery, i.e.:
T a v e = 1 m m = 1 16 T i a v e
where T i a v e is the average temperature of battery number i.

3.4. Boundary Conditions

The boundary conditions primarily include the battery boundary conditions and the fluid thermal boundary conditions. This paper utilizes COMSOL Multiphysics to establish a multi-physics coupling model for the thermoelectric thermal management system, integrating electrochemical, electrical, thermal, and fluid dynamics. The coupling relationships among these multi-physics domains are primarily manifested through the temperature distribution generated by the battery’s transient state, as analyzed via the electrochemical field, which serves as the temperature boundary condition for the thermoelectric thermal management system, thereby enabling fluid thermal performance analysis. The boundary conditions are set as follows: A one-dimensional battery heat generation model is established and connected to the three-dimensional battery structure. The heat generated by the battery is transferred to the thermoelectric module via solid heat conduction, and then the thermoelectric module transfers heat to the cooling end via fluid–solid coupling to dissipate the heat. The parameters of the boundary conditions involved are detailed in Table 3 below.

3.5. Mesh Independence Verification

As shown in Figure 4, to ensure the accuracy of the computational simulation of the finite element model, a tetrahedral mesh is used in this study for the single cell and the liquid-cooled part, and a hexahedral mesh with higher accuracy is used for the regularly shaped TEC. Given that the size of the battery is larger than the TEC part, and the heat transfer between the TEC, the thermal conductive frame and the liquid-cooled part needs to be considered. This paper selects four mesh densities of 420,000, 470,000, 520,000, and 570,000 to be classified, using the battery’s maximum temperature and maximum temperature difference as evaluation criteria. As shown in Table 4, the results show that when the density of mesh division is 520,000, the performance of the battery tends to stabilize, which indicates that the mesh division at this time has reached the optimum, and can balance the calculation accuracy and efficiency.

4. Results and Discussion

4.1. Optimization of the Number of TECs

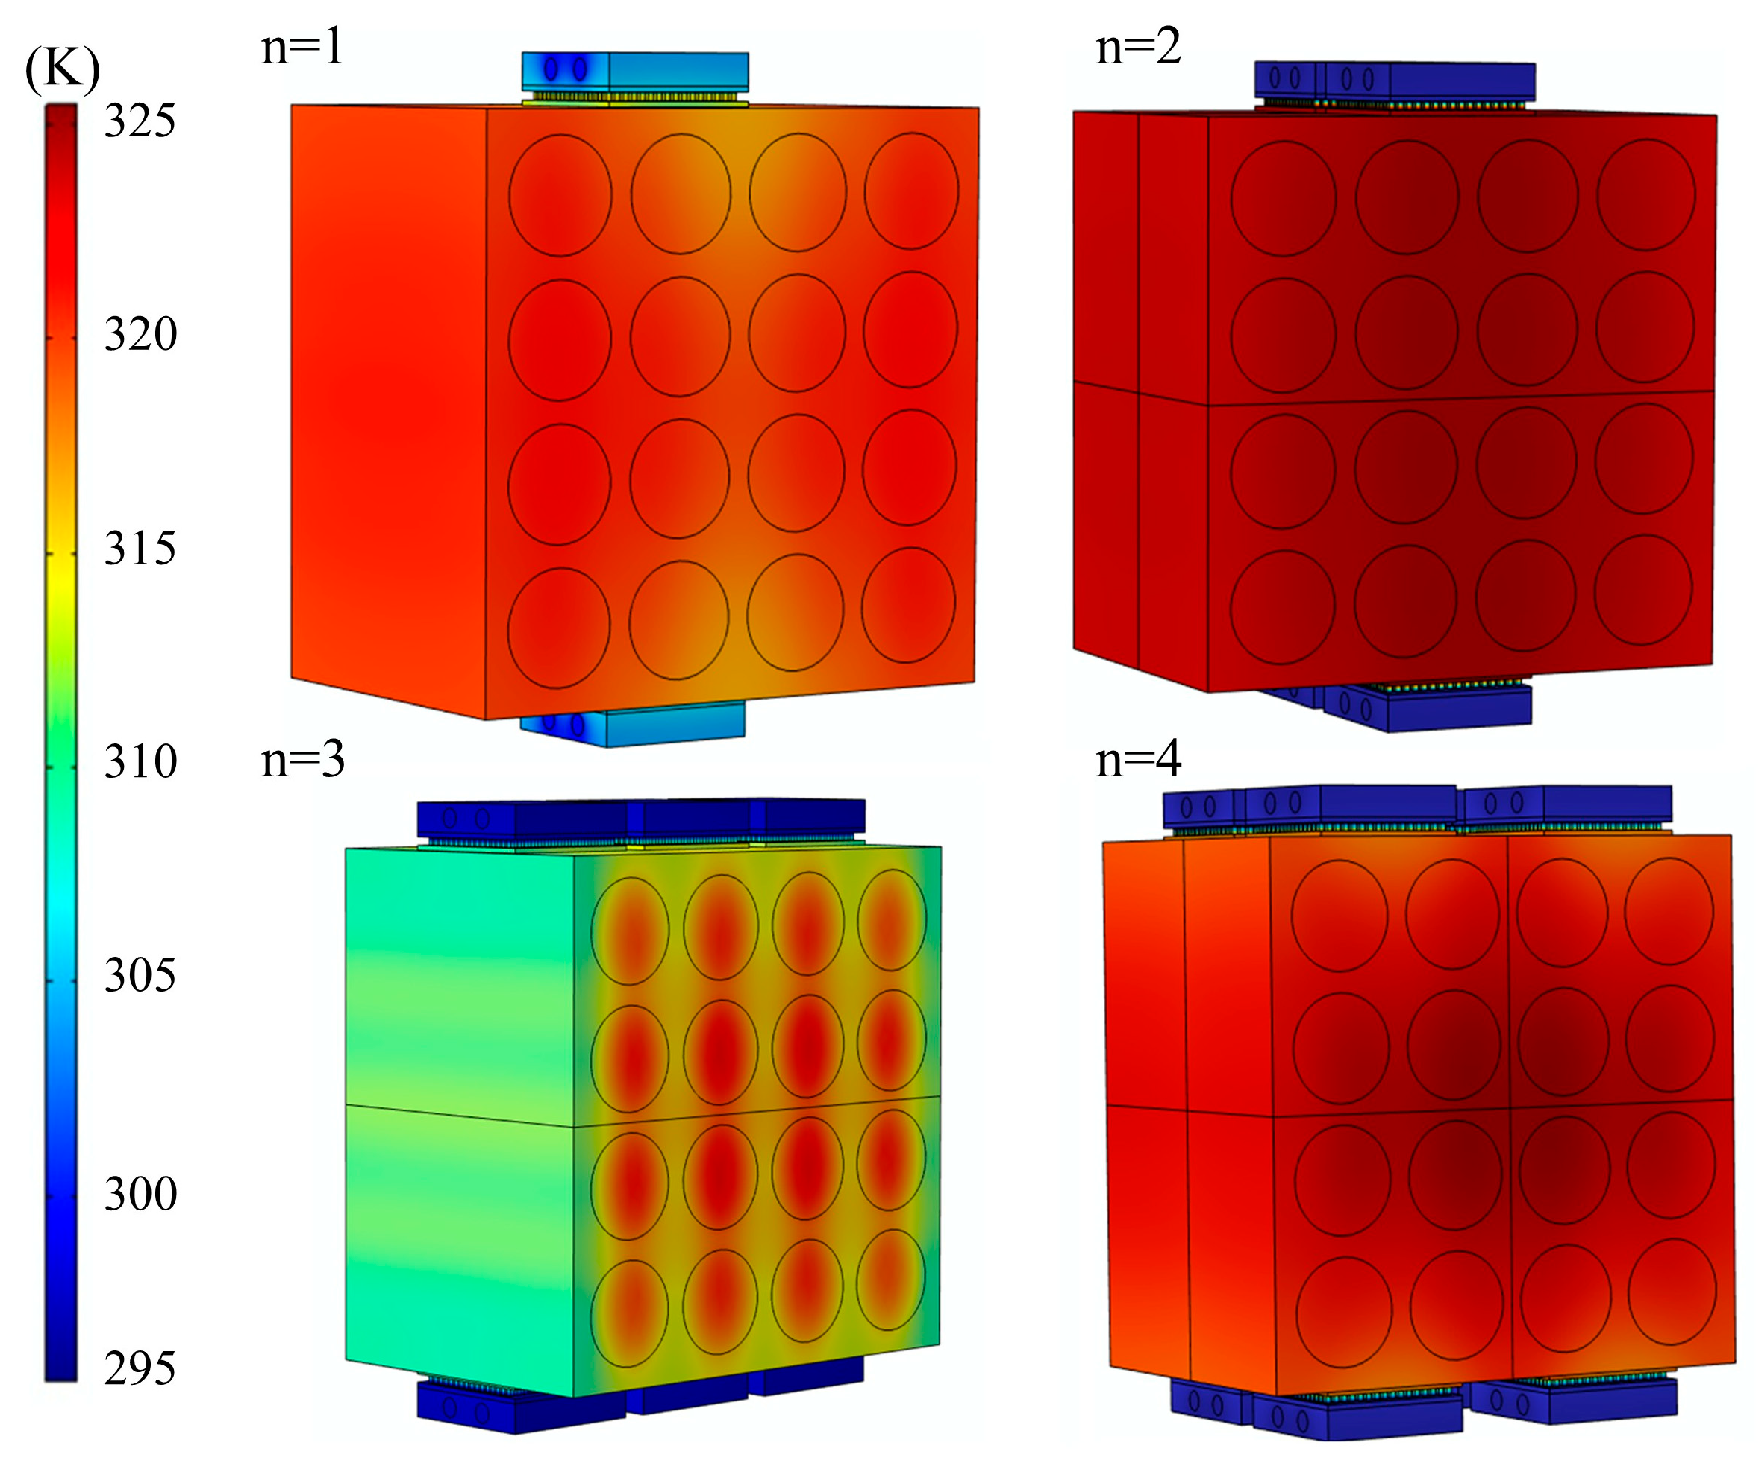
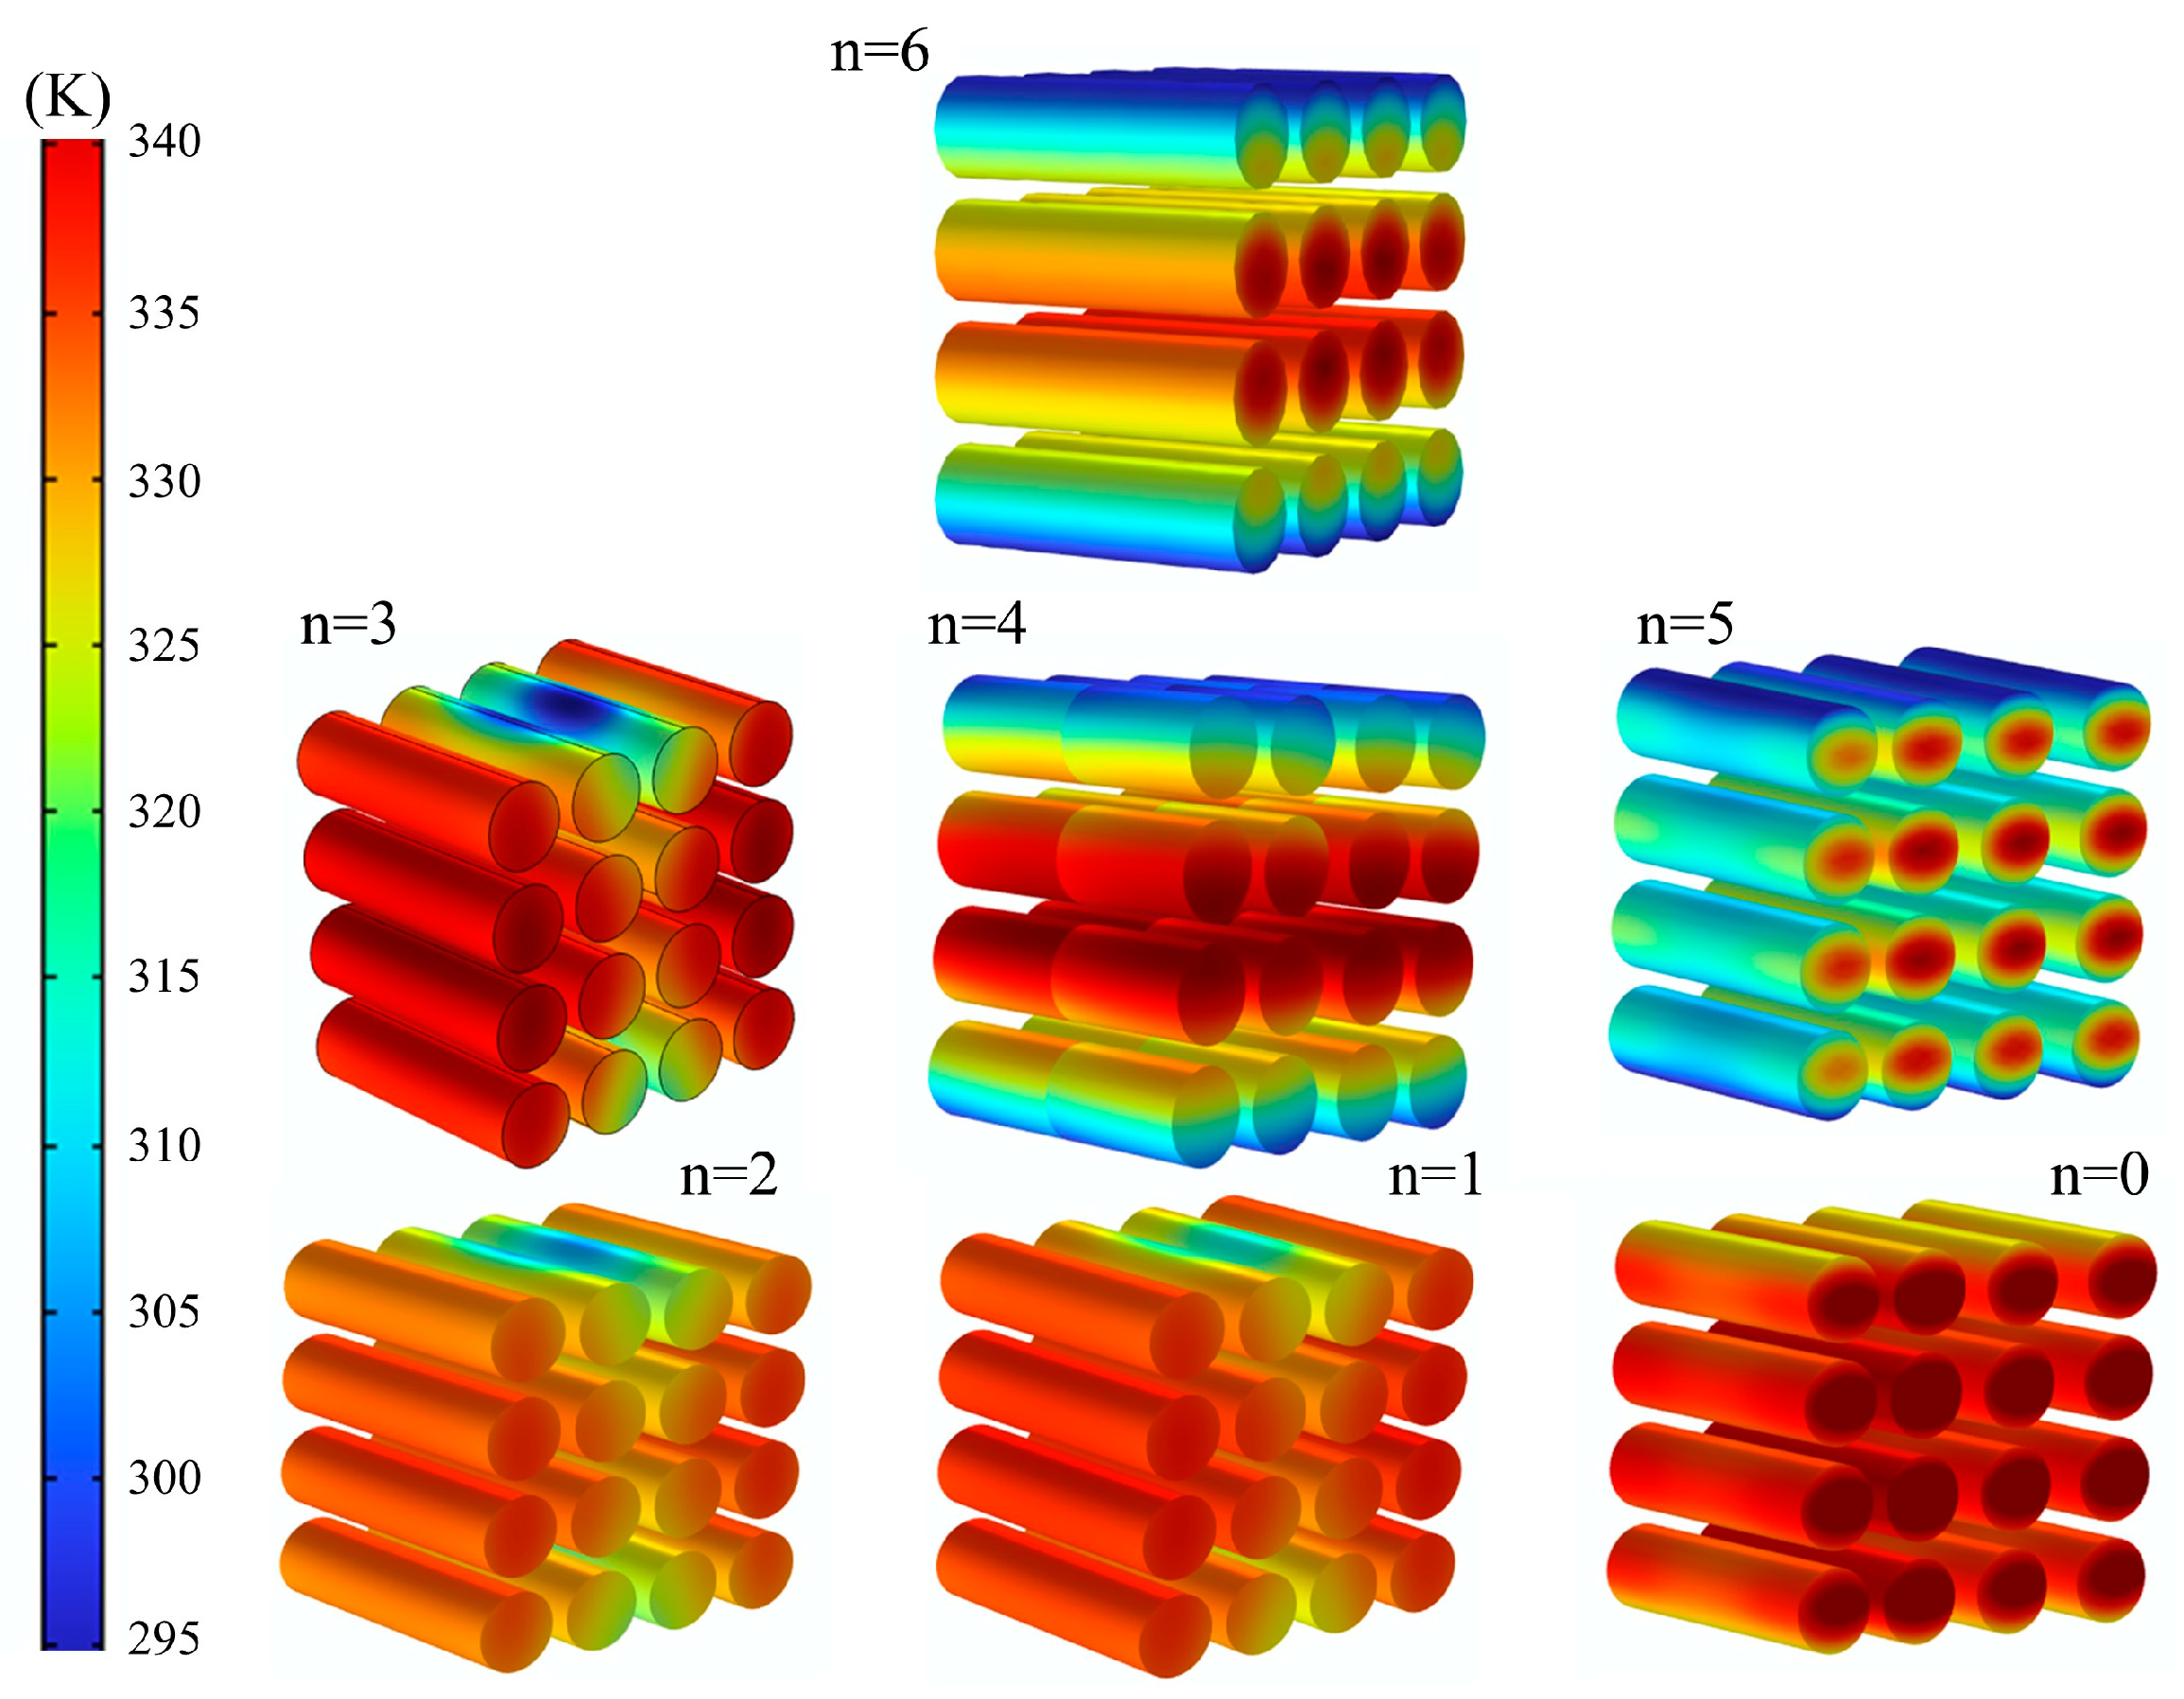
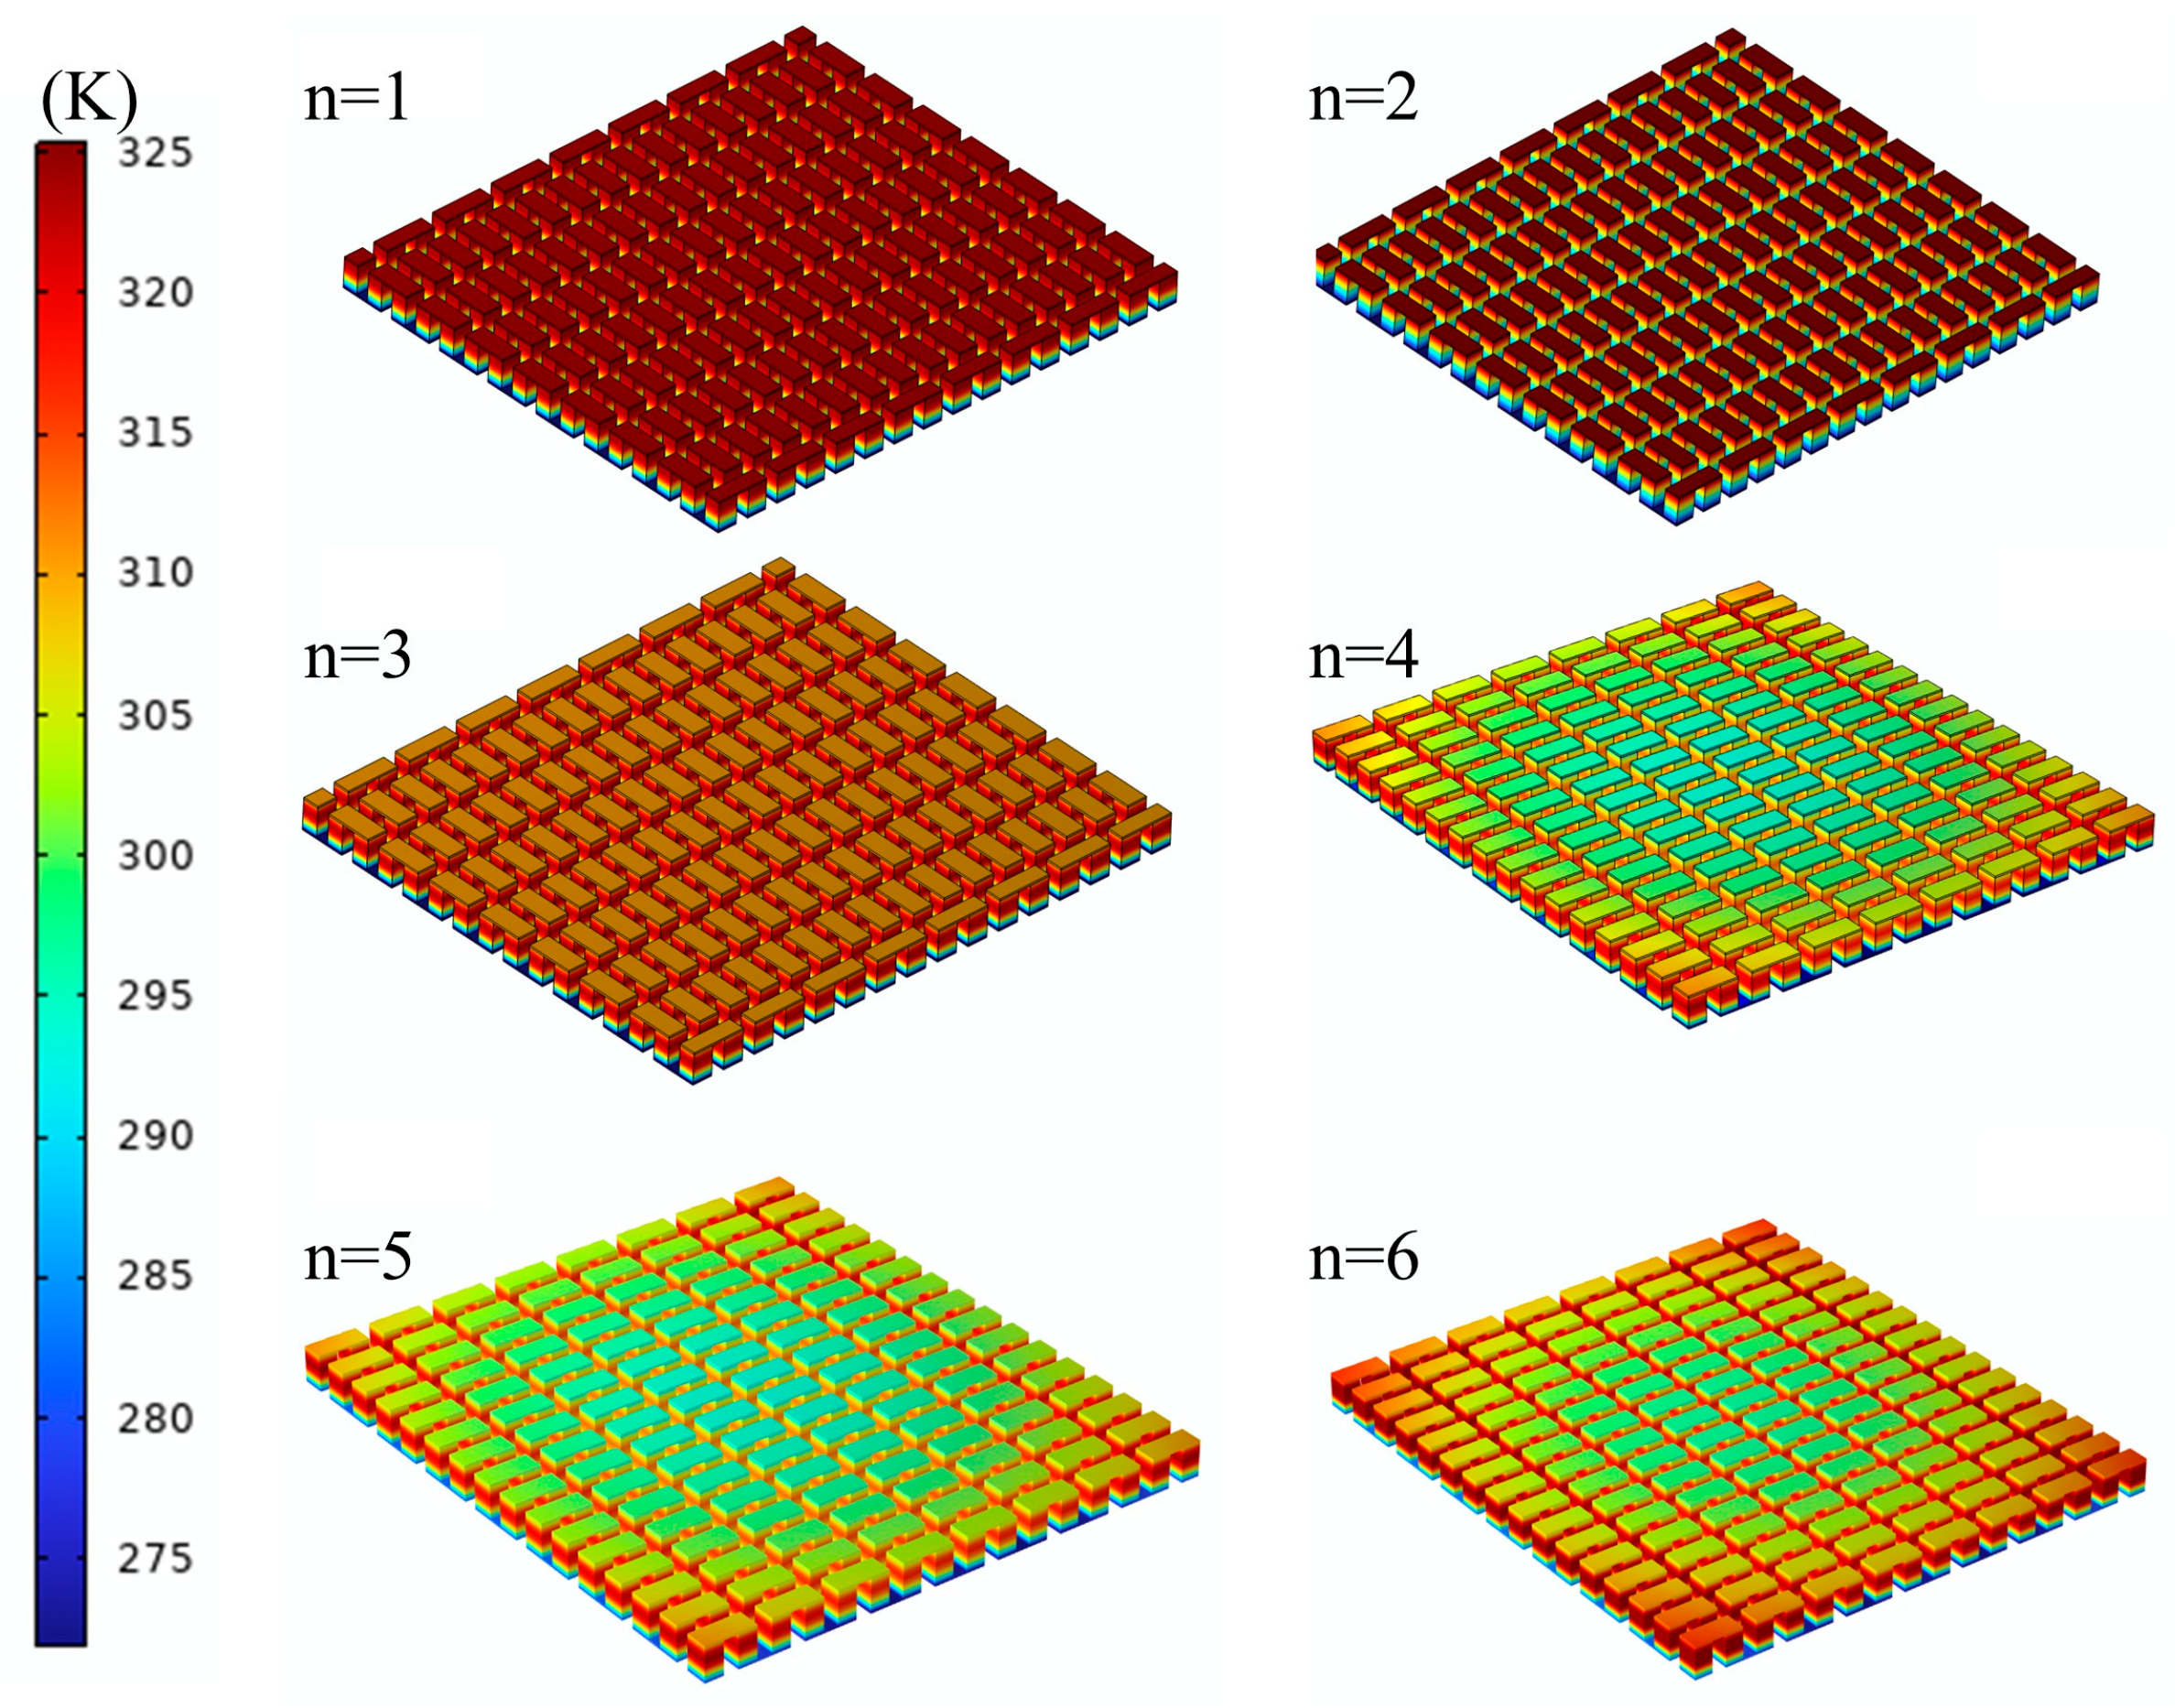
4.1.1. The System Temperature Distribution

The temperature distribution of the system can intuitively reflect the energy distribution and optimization focus of the system, and provide an important basis for the improvement of the arrangement structure of the TECs, so it has important research significance. Under the boundary conditions of a battery discharge rate of 4C, TEC input current I = 3 A, cooling water temperature = 293 K, and cooling water mass flow rate of 50 g/s, this paper reveals the energy distribution characteristics by analyzing the overall temperature field distribution when the number of TECs in the system gradually increases from 0 (as shown in Figure 5).
Figure 5 shows the overall temperature distribution when the number of TECs is n = 1, 2, 3, and 4, respectively. Compared with the battery without TECs, the maximum temperature was significantly reduced after adding TECs. The temperature of the central battery was higher than that of the edge batteries, indicating that TEC effectively reduced the temperature and verified the feasibility of the thermoelectric cooling system. With the increase in the number of TECs, the heat is gradually dispersed to the upper and lower ends of the module, and the cooling capacity is enhanced, but the input power also increases, and the improvement of the cooling effect is gradually weakened, indicating that there is an optimal value of n, which can realize the best cooling effect under a lower power consumption. Figure 6 further shows the distribution of the temperature field of the single battery under different n values.
Figure 6 shows the temperature distribution for the number of TECs n = 0, 1, 2, 3, 4, 5, and 6. The analysis results show that as the number of TECs increases, the maximum temperature decreases significantly. The center temperature is higher than the edge temperature due to the closer proximity of the edge monobloc batteries to the system and the higher heat exchange efficiency. As the number of TECs increases, the maximum temperature continues to decrease, but the heat exchange efficiency between the marginal single battery and the thermal management system is enhanced, resulting in poorer temperature uniformity of the battery.
The above analysis shows that the number of TECs has a significant effect on the temperature distribution of the thermoelectric cooling thermal management system as a whole and of the battery module. However, the cooling coefficient of the system needs to calculate the cooling amount based on the temperature difference, so it is important to study the temperature distribution of the TECs. Figure 7 illustrates the temperature distribution for different numbers of TECs. Specifically, as the number of thermoelectric devices increases, the electric field distribution becomes more uniform, which helps improve the cooling efficiency. Additionally, the temperature field distribution also shows a more pronounced cooling effect, further validating the effectiveness of the optimized design.

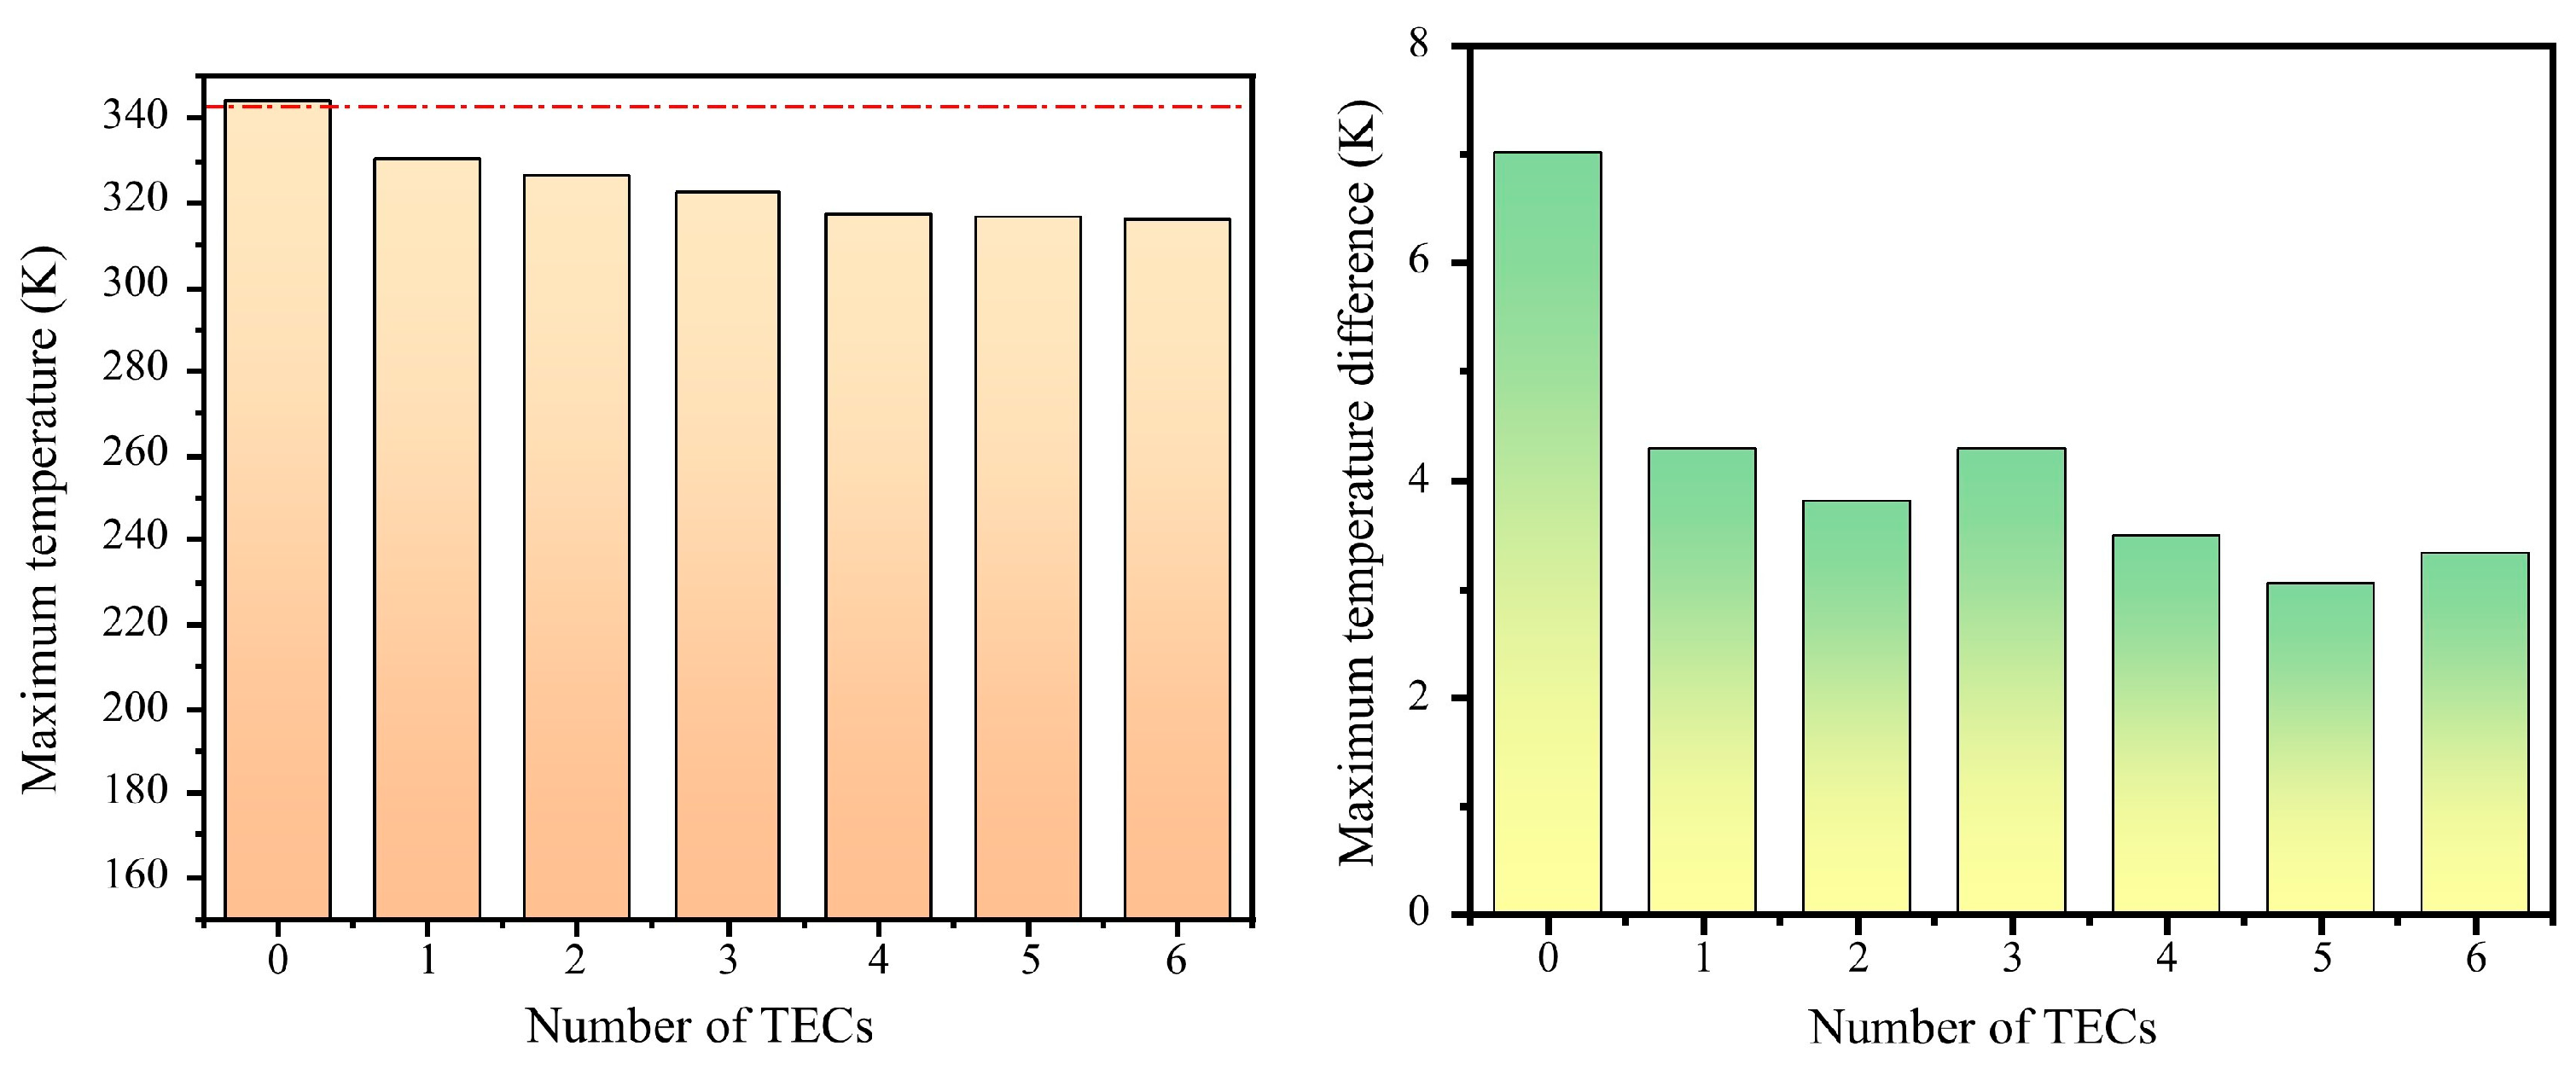
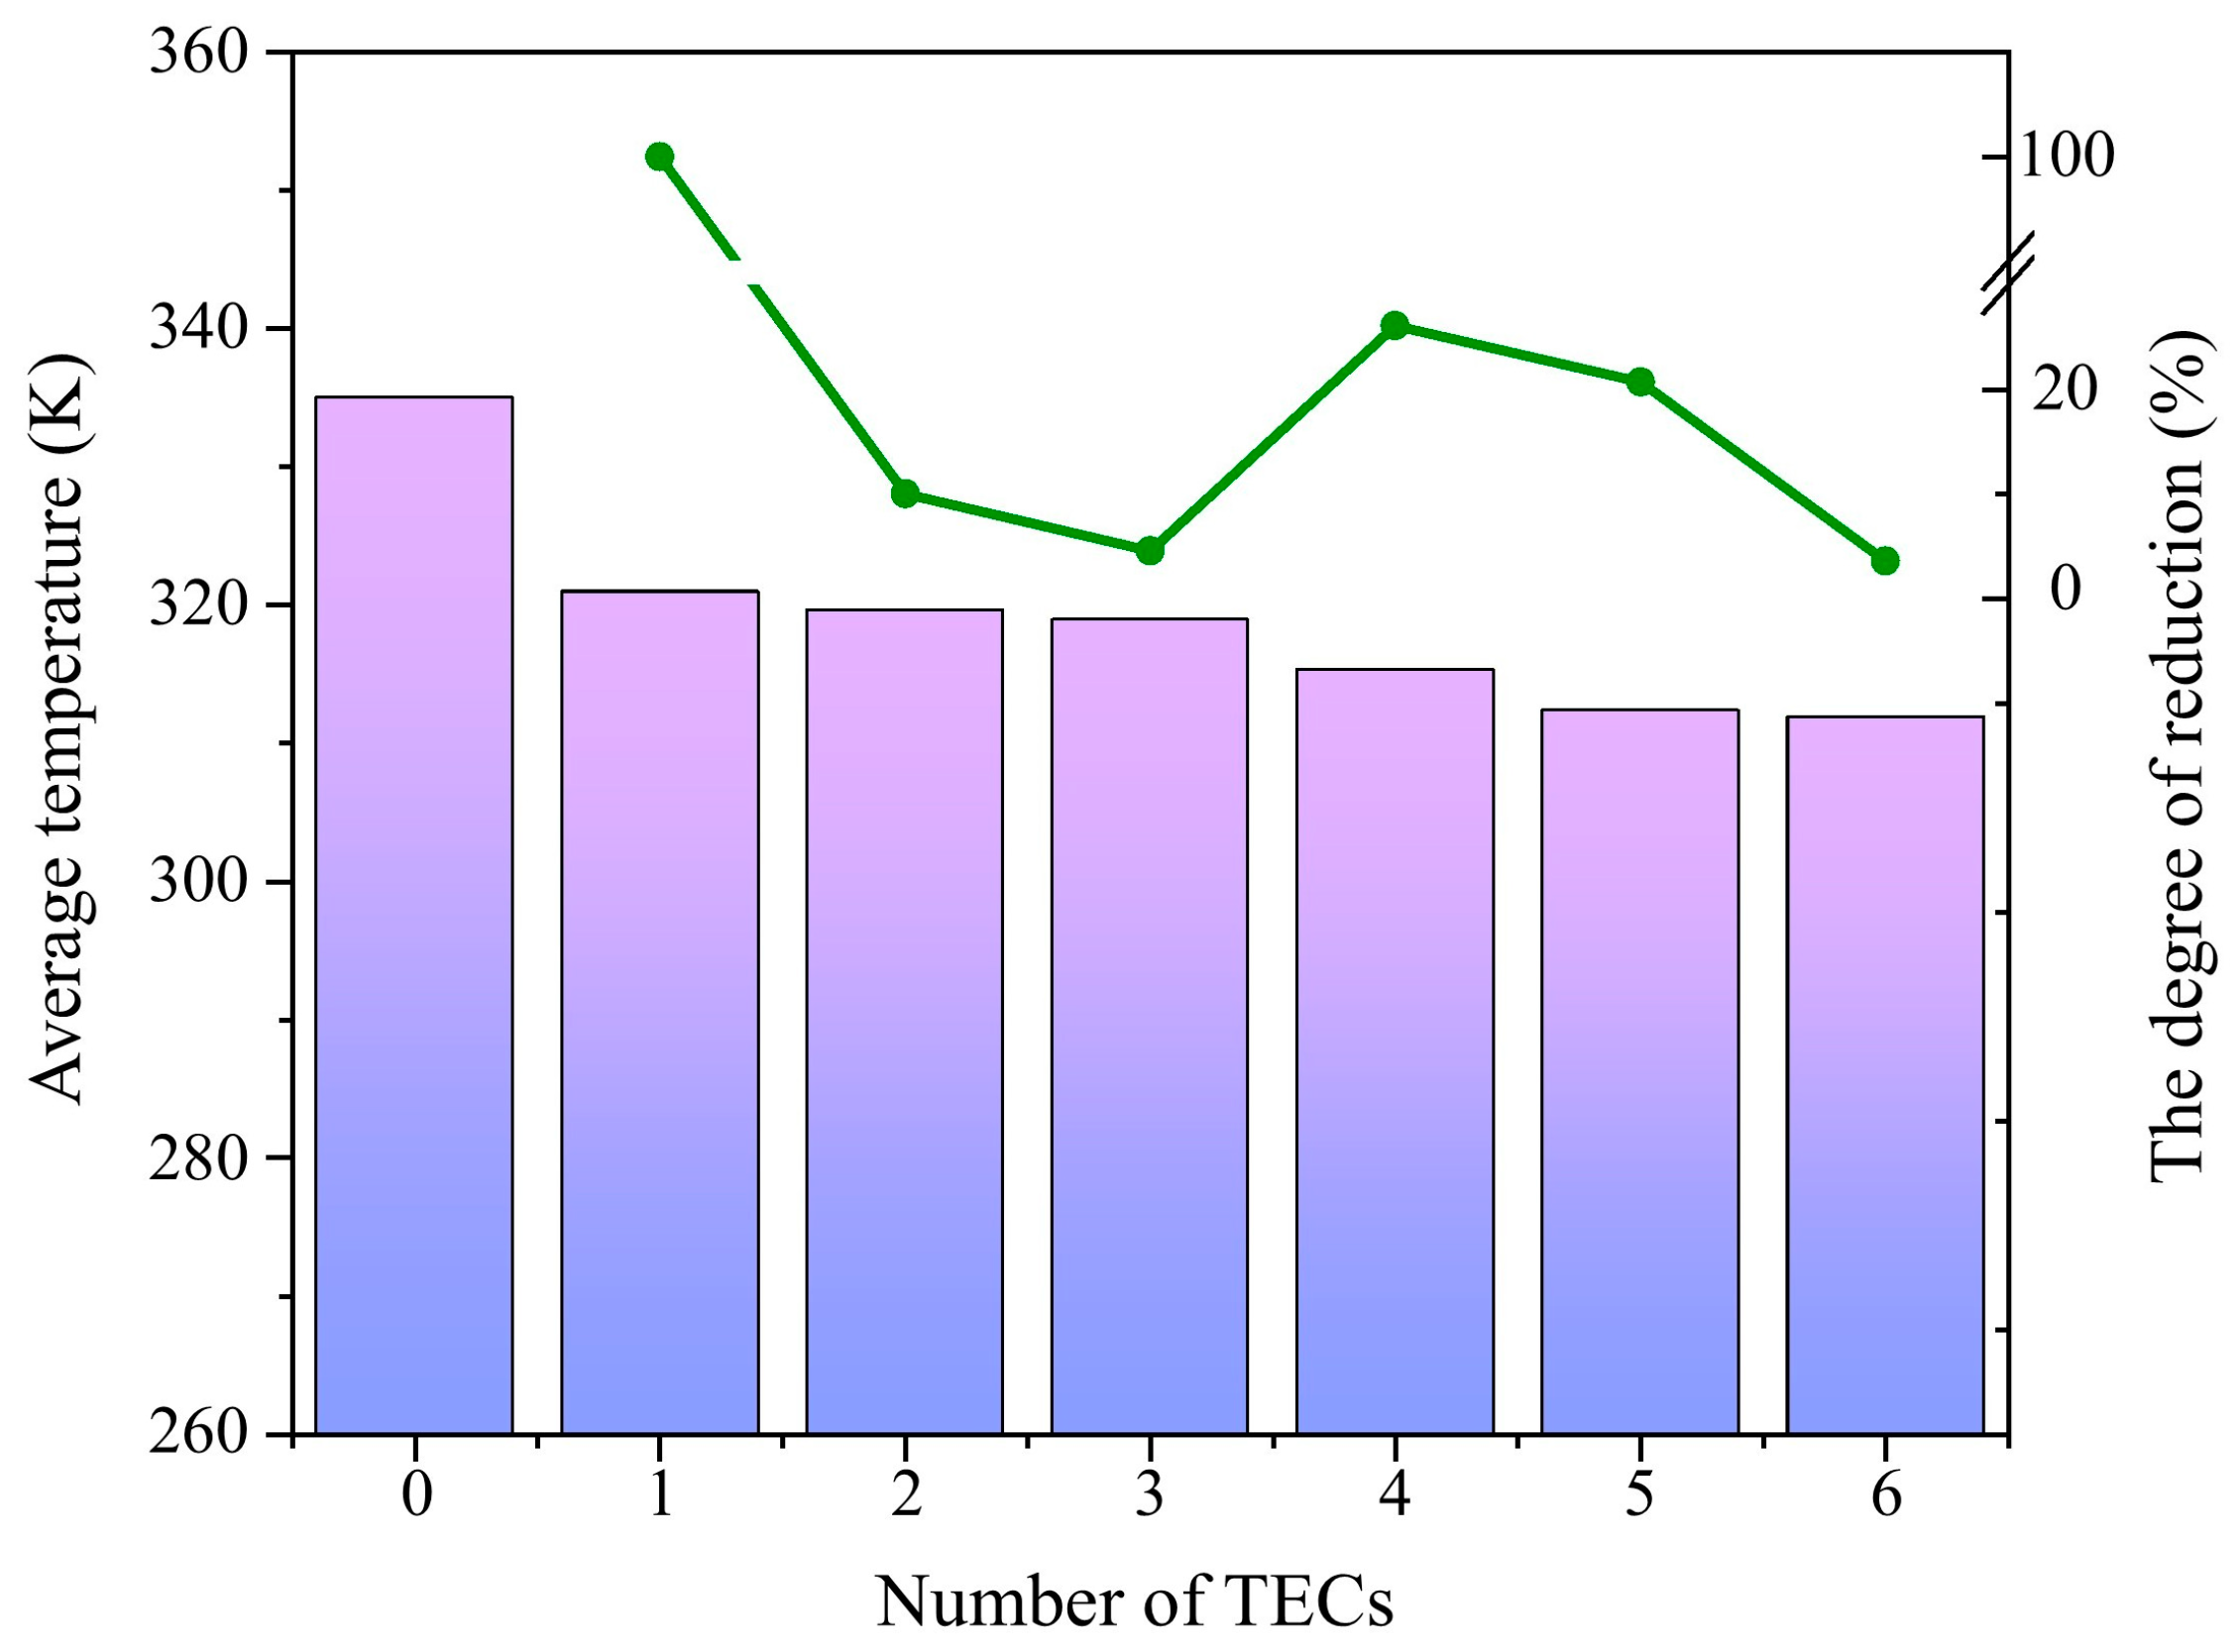
4.1.2. Analysis of Temperature Distribution for Thermal Management Systems

As the number of TECs increases, the contact area between the battery and the thermal management system gradually increases, and the cooling capacity also increases, which will undoubtedly affect the battery. The data on the battery temperature are shown in Figure 8.
The figure shows that as the number of TECs increases, the battery temperature gradually decreases. This is because the increased number of TECs enhances the cooling capacity, thereby increasing the temperature difference between the inner and outer ends of the thermal conductivity framework, accelerating heat transfer, and gradually reducing the maximum temperature. However, as the number of TECs continues to increase, the rate of decrease in maximum temperature gradually slows down. The maximum temperature difference in the battery first decreases and then increases with the increase in the number of TECs, reaching the lowest maximum temperature difference at n = 4. Therefore, considering both the maximum temperature and the maximum temperature difference, selecting n = 4 as the number of TECs is the most optimal choice. Using the maximum temperature and maximum temperature difference at n = 0 as the baseline values, the improvement capabilities of the maximum temperature and maximum temperature difference were calculated, with the results shown in Table 5. Among them, the maximum temperature difference is most obviously enhanced at n = 4. When comparing the maximum temperatures of different numbers of TECs, respectively, we can find that the reduction in the maximum temperature is almost negligible at n = 4 and n = 5. Considering the above and the cost issue, the optimal number of TECs should be n = 4.

4.1.3. Thermal Management System Battery Temperature Uniformity Analysis

With the increase in the number of TECs, the cooling capacity is gradually enhanced, and the average temperature at different numbers of TECs is shown in Figure 9.
Figure 9 shows that as the number of TECs increases, the average temperature gradually decreases. This is because the increase in the number of TECs expands the contact area between the system and the battery module, while more TECs act as cooling sources, gradually improving the cooling efficiency. However, the rate of temperature reduction gradually decreases, because the increase in the number of TECs causes the cold end temperature to decrease, which affects the degree of cooling of the system. When the number of TEMs n = 4, the degree of reduction varies the most when the average temperature is lower, so considering the gradual increase in cost and the cooling effect gradually reduced at this time, this is the optimal number of arrangements.

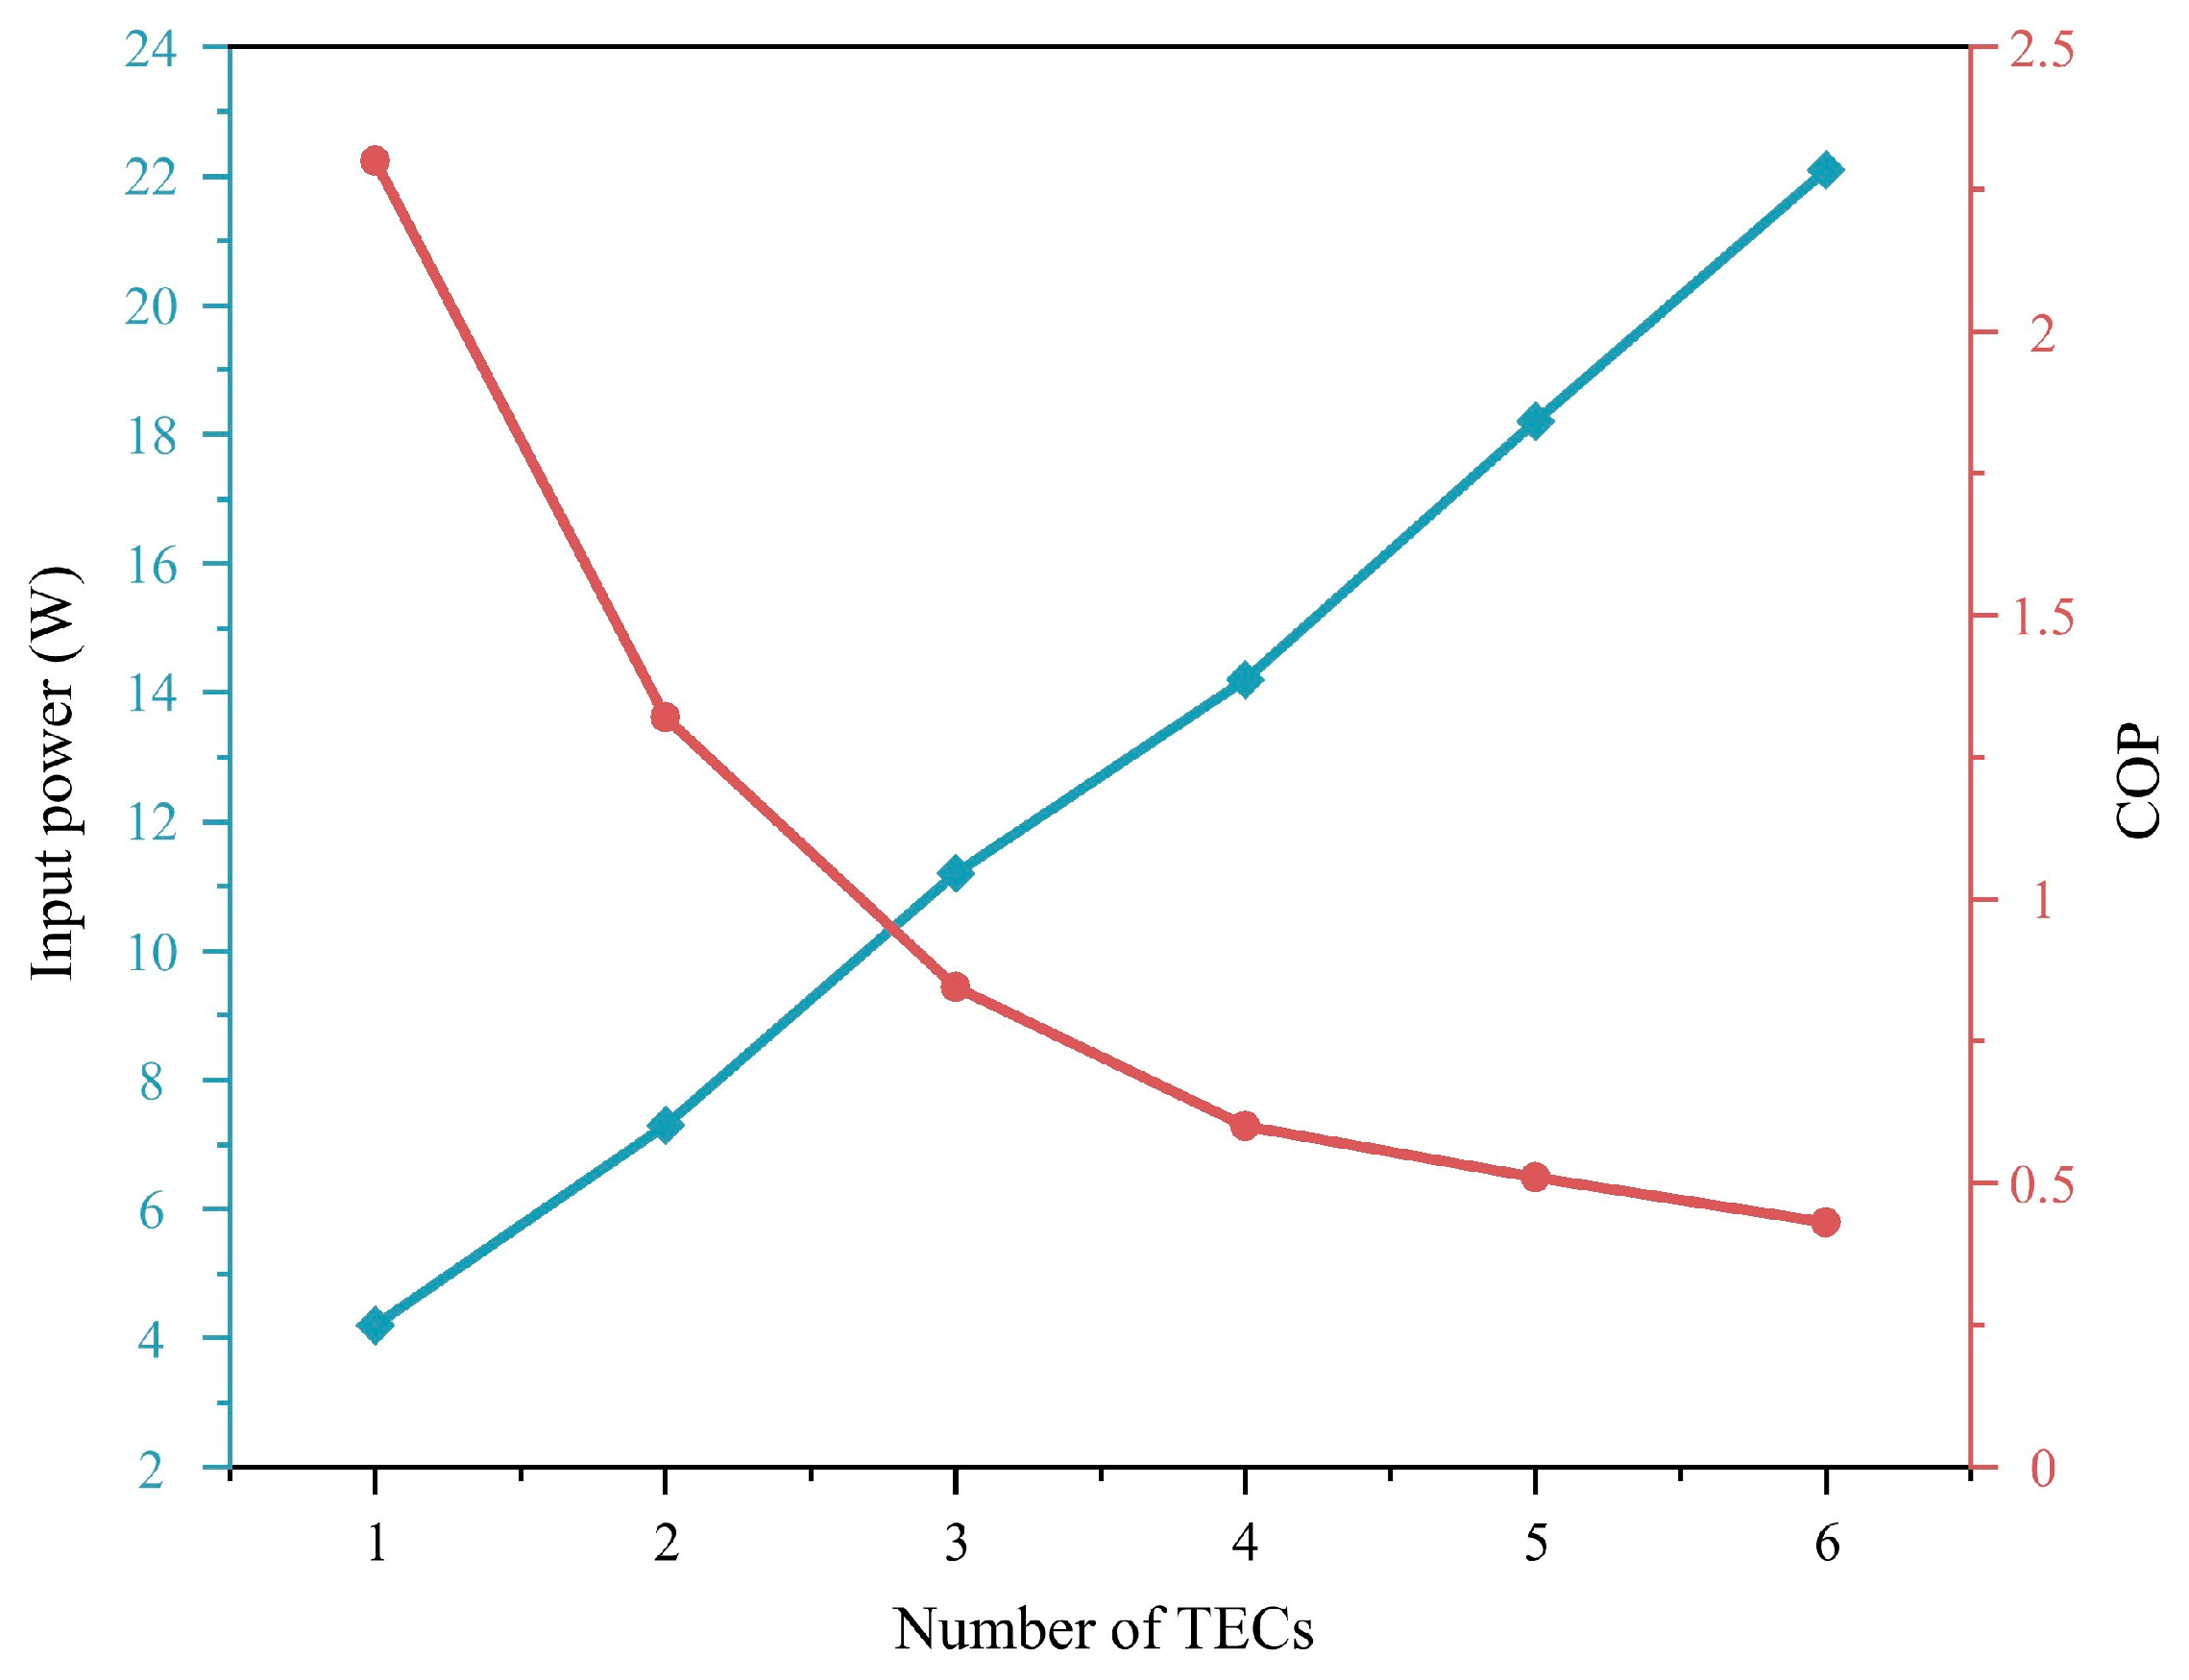
4.1.4. Analysis of Refrigeration Coefficients for Systems

The use of different numbers of TECs will inevitably affect the cooling coefficient of the system. The average temperature can be calculated, as well as the input voltage, and the input power of the TECs and the COP is shown in Figure 10.
Figure 10 shows that with the increase in the number of TECs, input power gradually increased. In contrast, the COP shows a decreasing trend; this is because, with the rise in the number of TECs, cooling capacity gradually increased to a certain value, and the input power is still gradually increased and the rate of increase in refrigeration efficiency slowed down, so it will show a decreasing trend, which is when the number of TECs n = 4 and n = 5 show a similar refrigeration effect, and the input power decreases by 19% and the input power is reduced by 19.8%. From the point of view of the refrigeration coefficient, the optimum number of TECs is n = 4.

4.2. Analysis of TEC Input Current

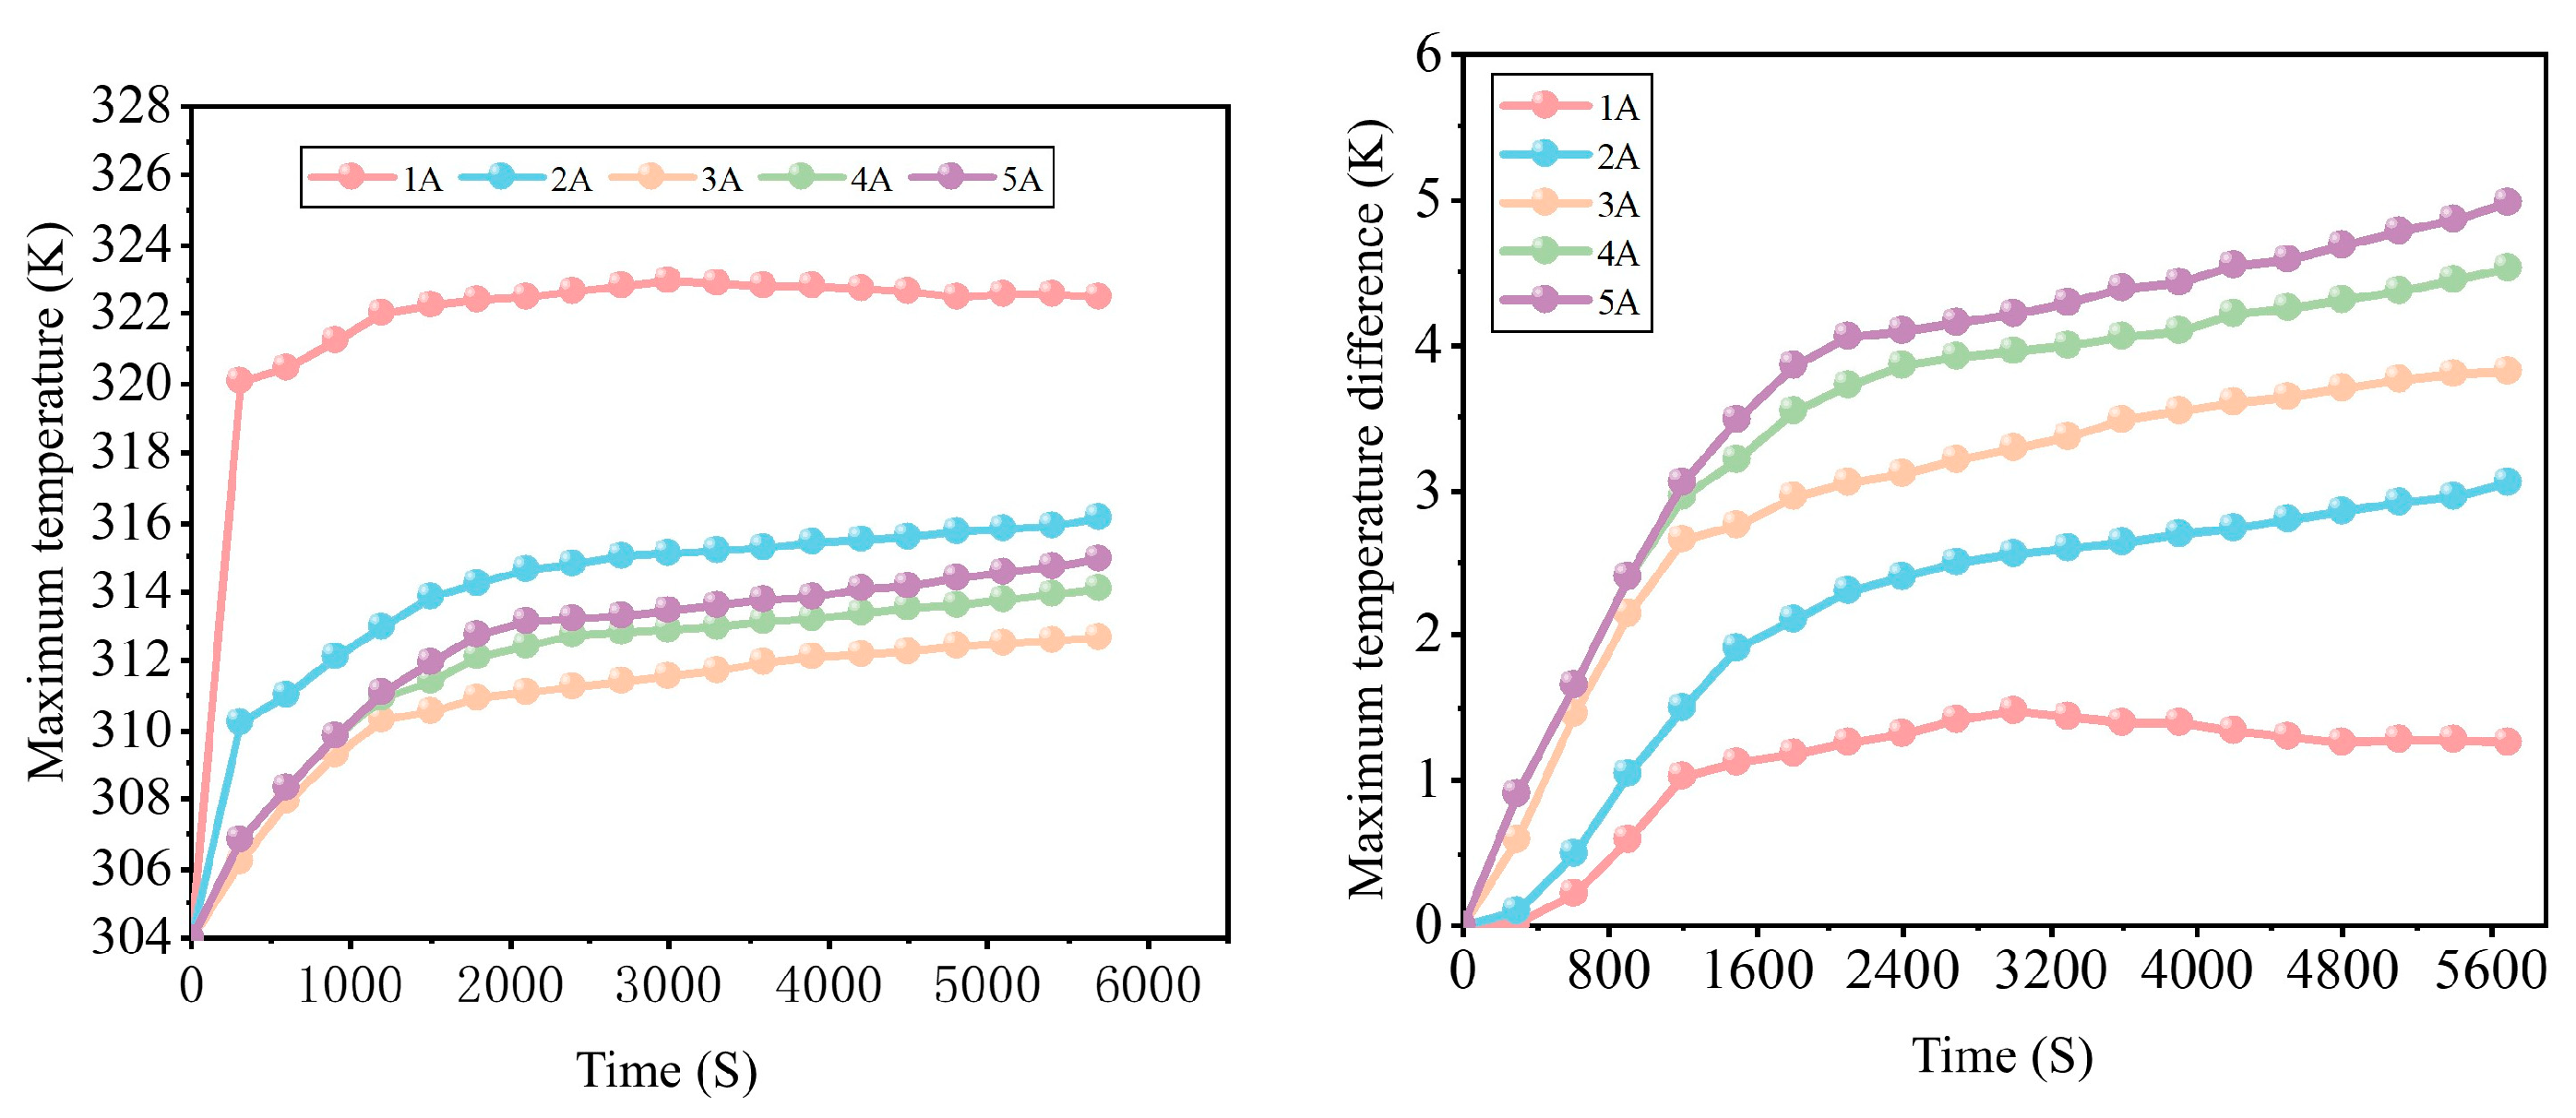
4.2.1. Analysis of Temperature of Battery Under Different Input Currents

The input current of the TEC is a key parameter affecting the cooling performance of the thermoelectric cooling system. To study the effect of input current on the response characteristics of this system, this paper analyzes the distribution of the maximum temperature and maximum temperature difference under different input currents, under the boundary conditions of 4C discharge and a cooling water mass flow rate of 50 g/s. The corresponding results are shown in Figure 11.
The maximum temperature of the battery first increases and then decreases as the TEC input current increases. When the input current increases from 1 A to 5 A, the maximum temperature decreases significantly, from 322.8 K to 311.2 K, and the maximum temperature never exceeds 324 K. It is important to note that when the input current is too high, the maximum temperature actually increases. The TEC responds more quickly, and the temperature difference increases with the input current, but the rate of increase slows down thereafter. The maximum temperature difference ranges from 2.4 K to 9.2 K. From this, it can be concluded that the input current has a significant impact on the maximum temperature but a relatively minor impact on the maximum temperature difference. Considering both the maximum temperature and the maximum temperature difference, the optimal input current is 3 A to 4 A.

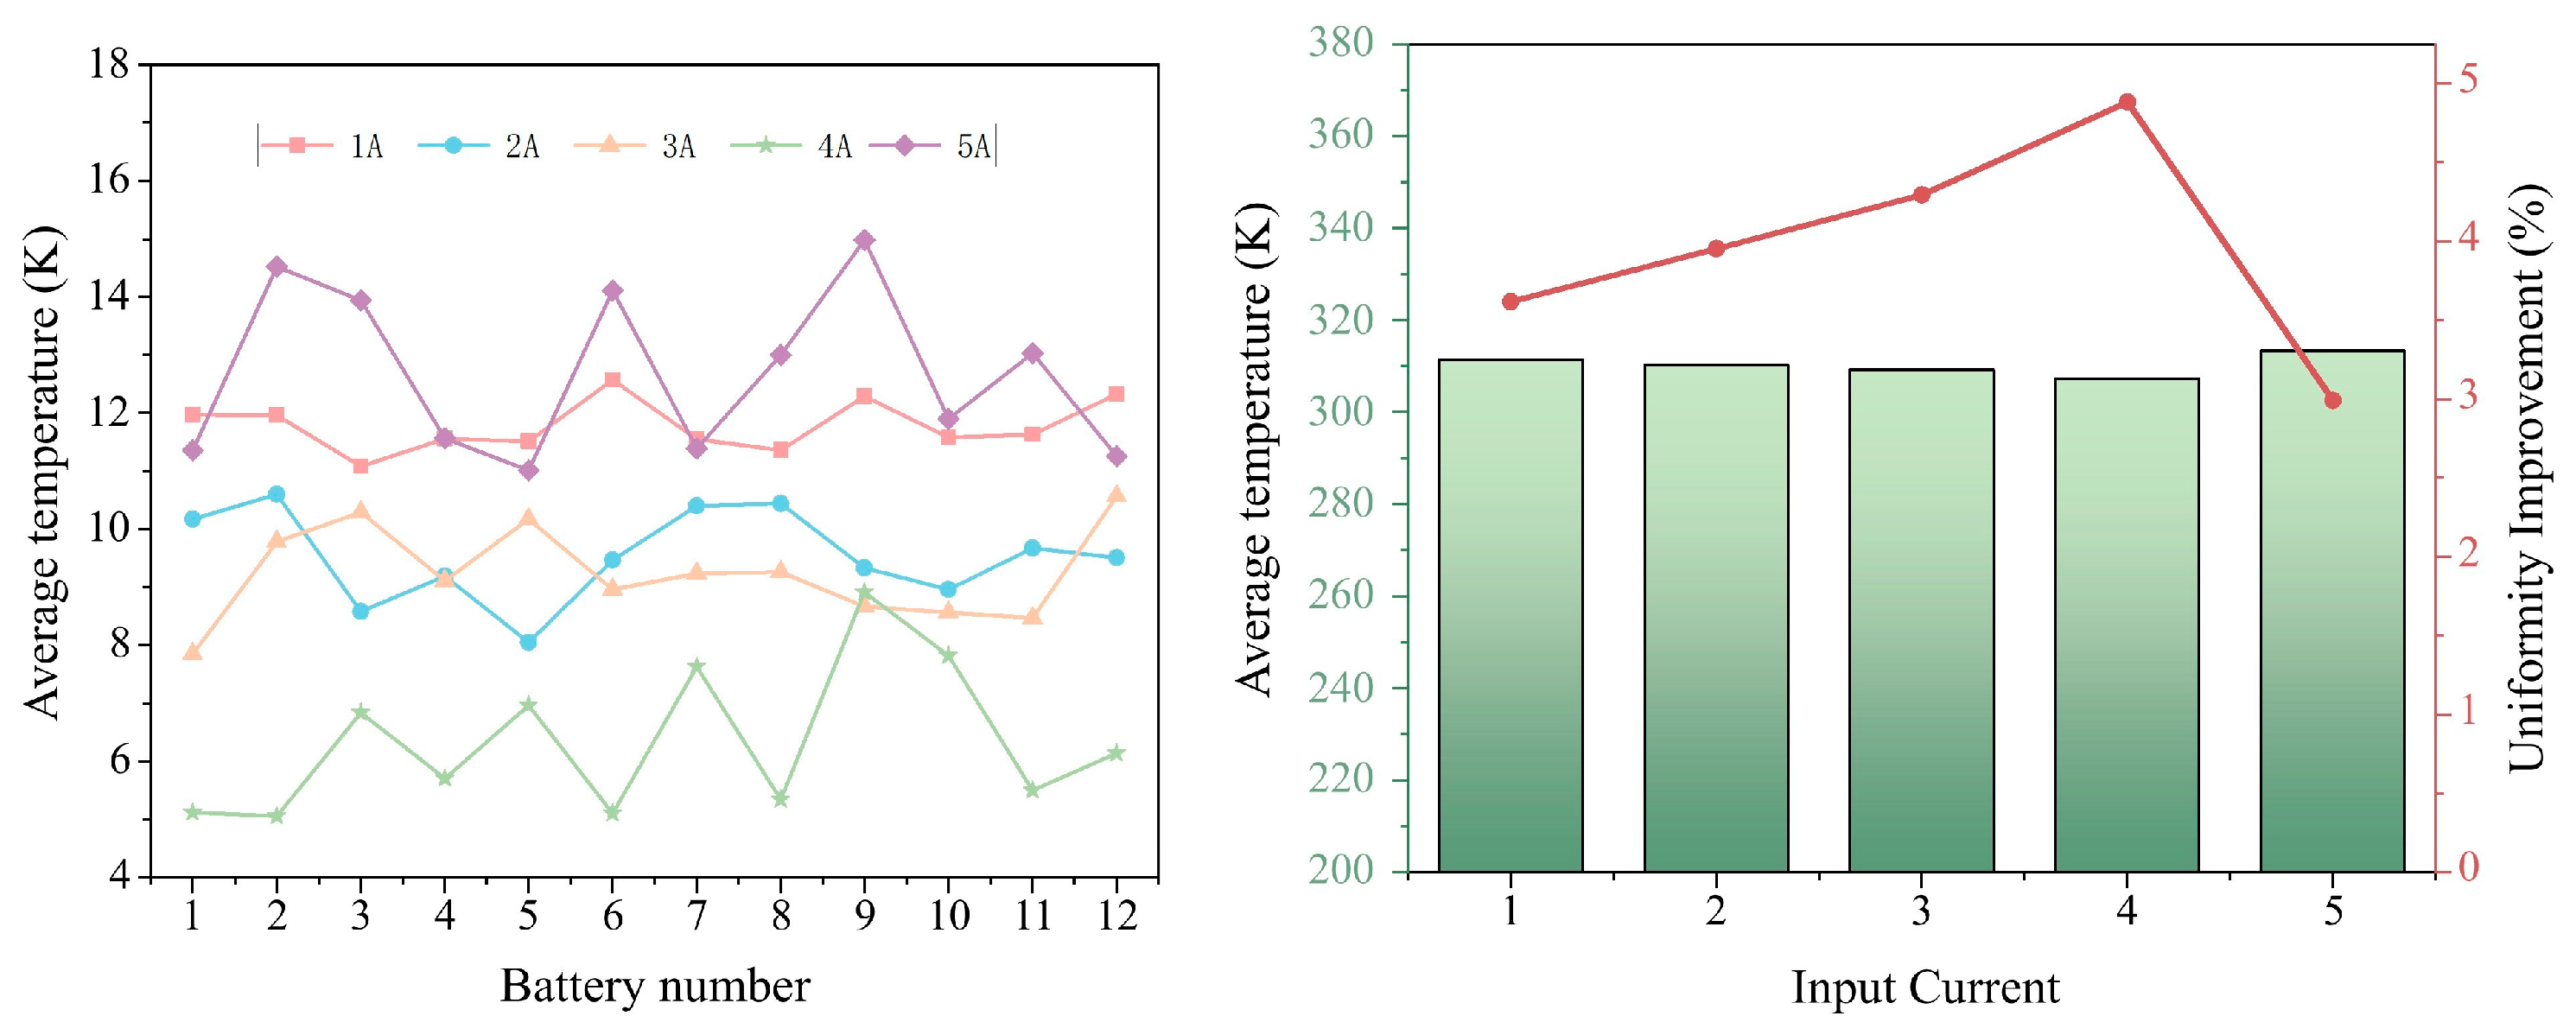
4.2.2. Battery Temperature Uniformity Analysis Under Different Input Currents

Temperature uniformity affects battery safety. Battery temperature uniformity and temperature change rates are affected by different input currents. Figure 12 shows these effects.
The graphical results show that the average temperature increases with the increase in input current, and the temperature variance among batteries increases. Among them, the no. 6, 7, 10, and 11 single batteries are located in the center of the module, and are not in direct contact with the thermal management system and have higher temperatures. When the input current reaches 5 A, the average temperature is higher than that at 1 A. This is due to the enhanced Seebeck effect and Joule effect caused by the increased current, which reduces the cooling efficiency of the thermoelectric parts. The temperature uniformity varies under different input currents, and the optimization effect first increases and then decreases as the current increases. When the input current is 3 A, the optimization effect is the best, and the degree of improvement is 13.4%. Therefore, when the number of TECs is 4, the optimal input current is 3 A.

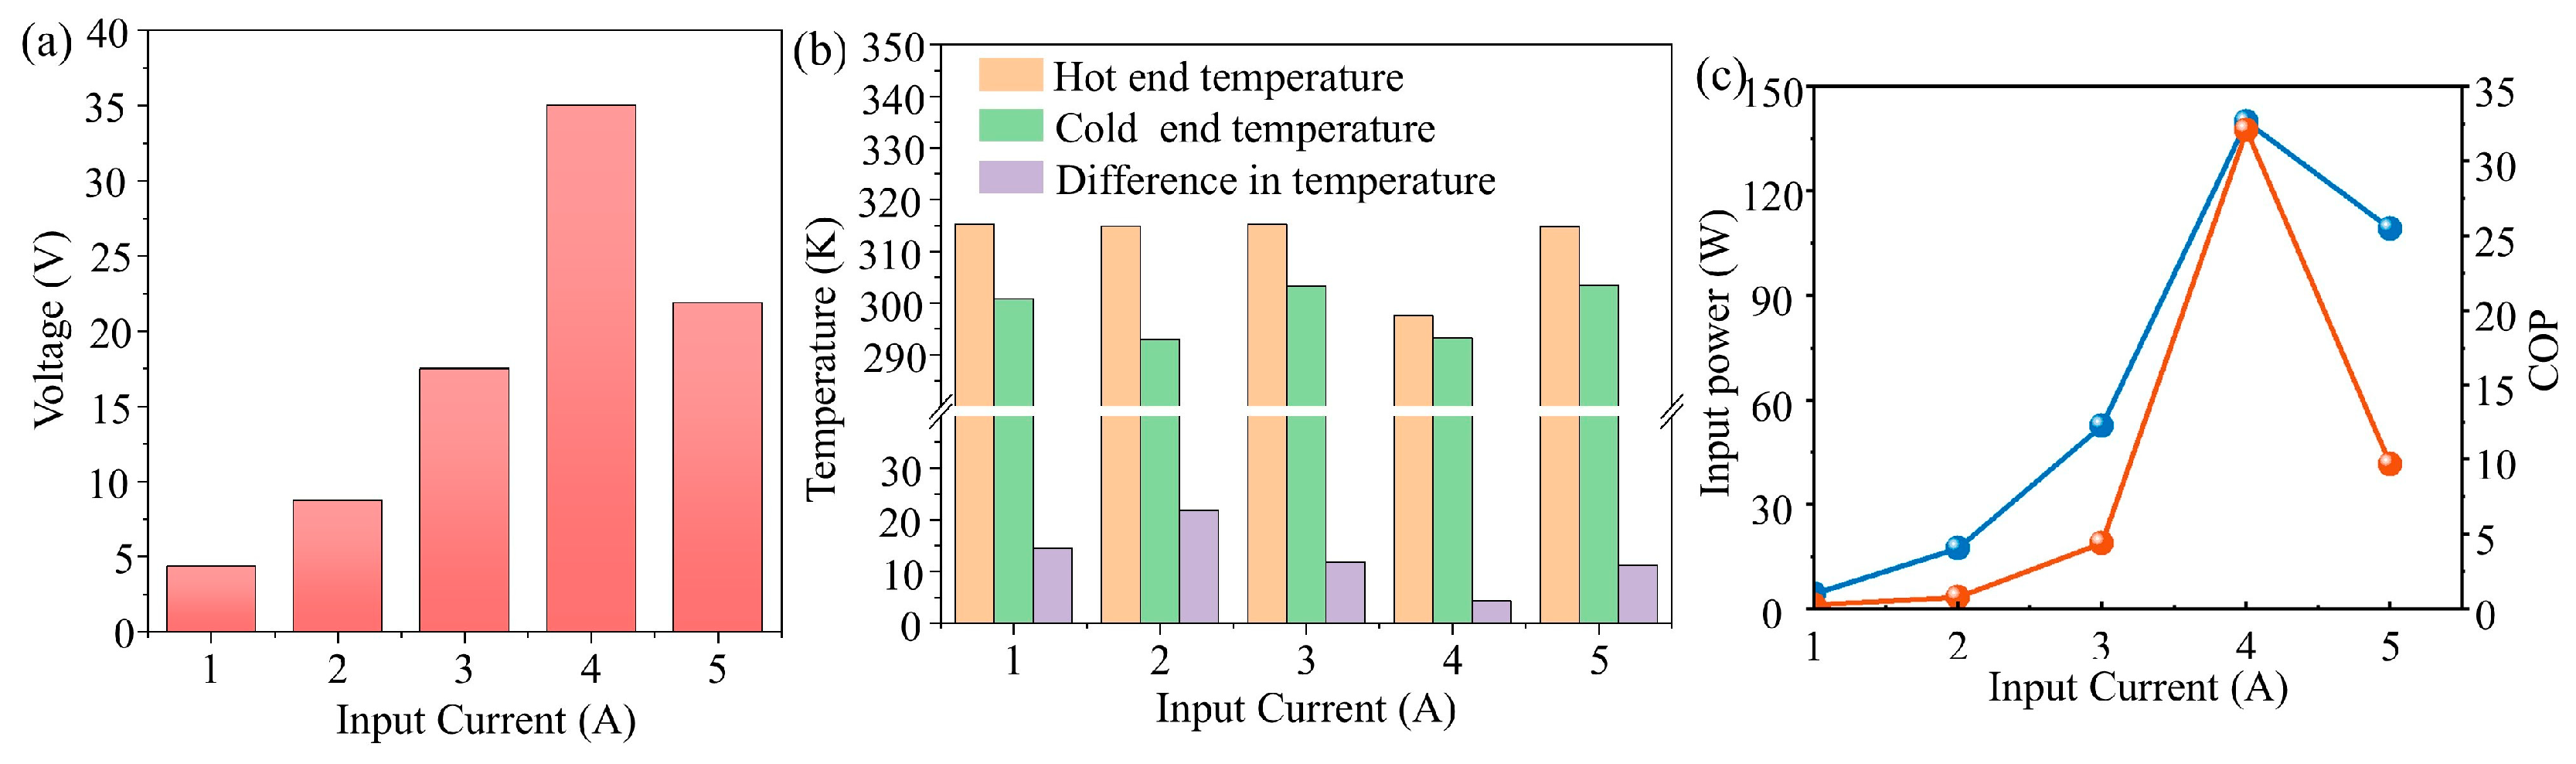
4.2.3. Analysis of Cooling Coefficients of TECs at Different Input Currents

The input current of TECs is one of the important factors affecting the refrigeration coefficient. For this reason, this paper investigates the output performance under different input currents and analyzes them in comparison with each other. The voltage distribution of the TECs and the temperature distribution of the hot and cold ends at different input currents are shown in Figure 13 below.
The maximum temperature difference in the TECs first increases and then decreases as the input current increases. As the input current increases, the Seebeck effect-induced heat generation in the TECs gradually increases, affecting the cooling efficiency of the Peltier effect. Figure 13 shows the changes in input power and cooling coefficient under different input currents. The figure indicates that as the current increases, the overall performance first gradually increases and then gradually decreases, with the rate of increase slowing down. The cooling coefficient reaches its maximum value of 32 when the input current I is 4 A, at which point the input power also reaches its maximum value of 13 W.

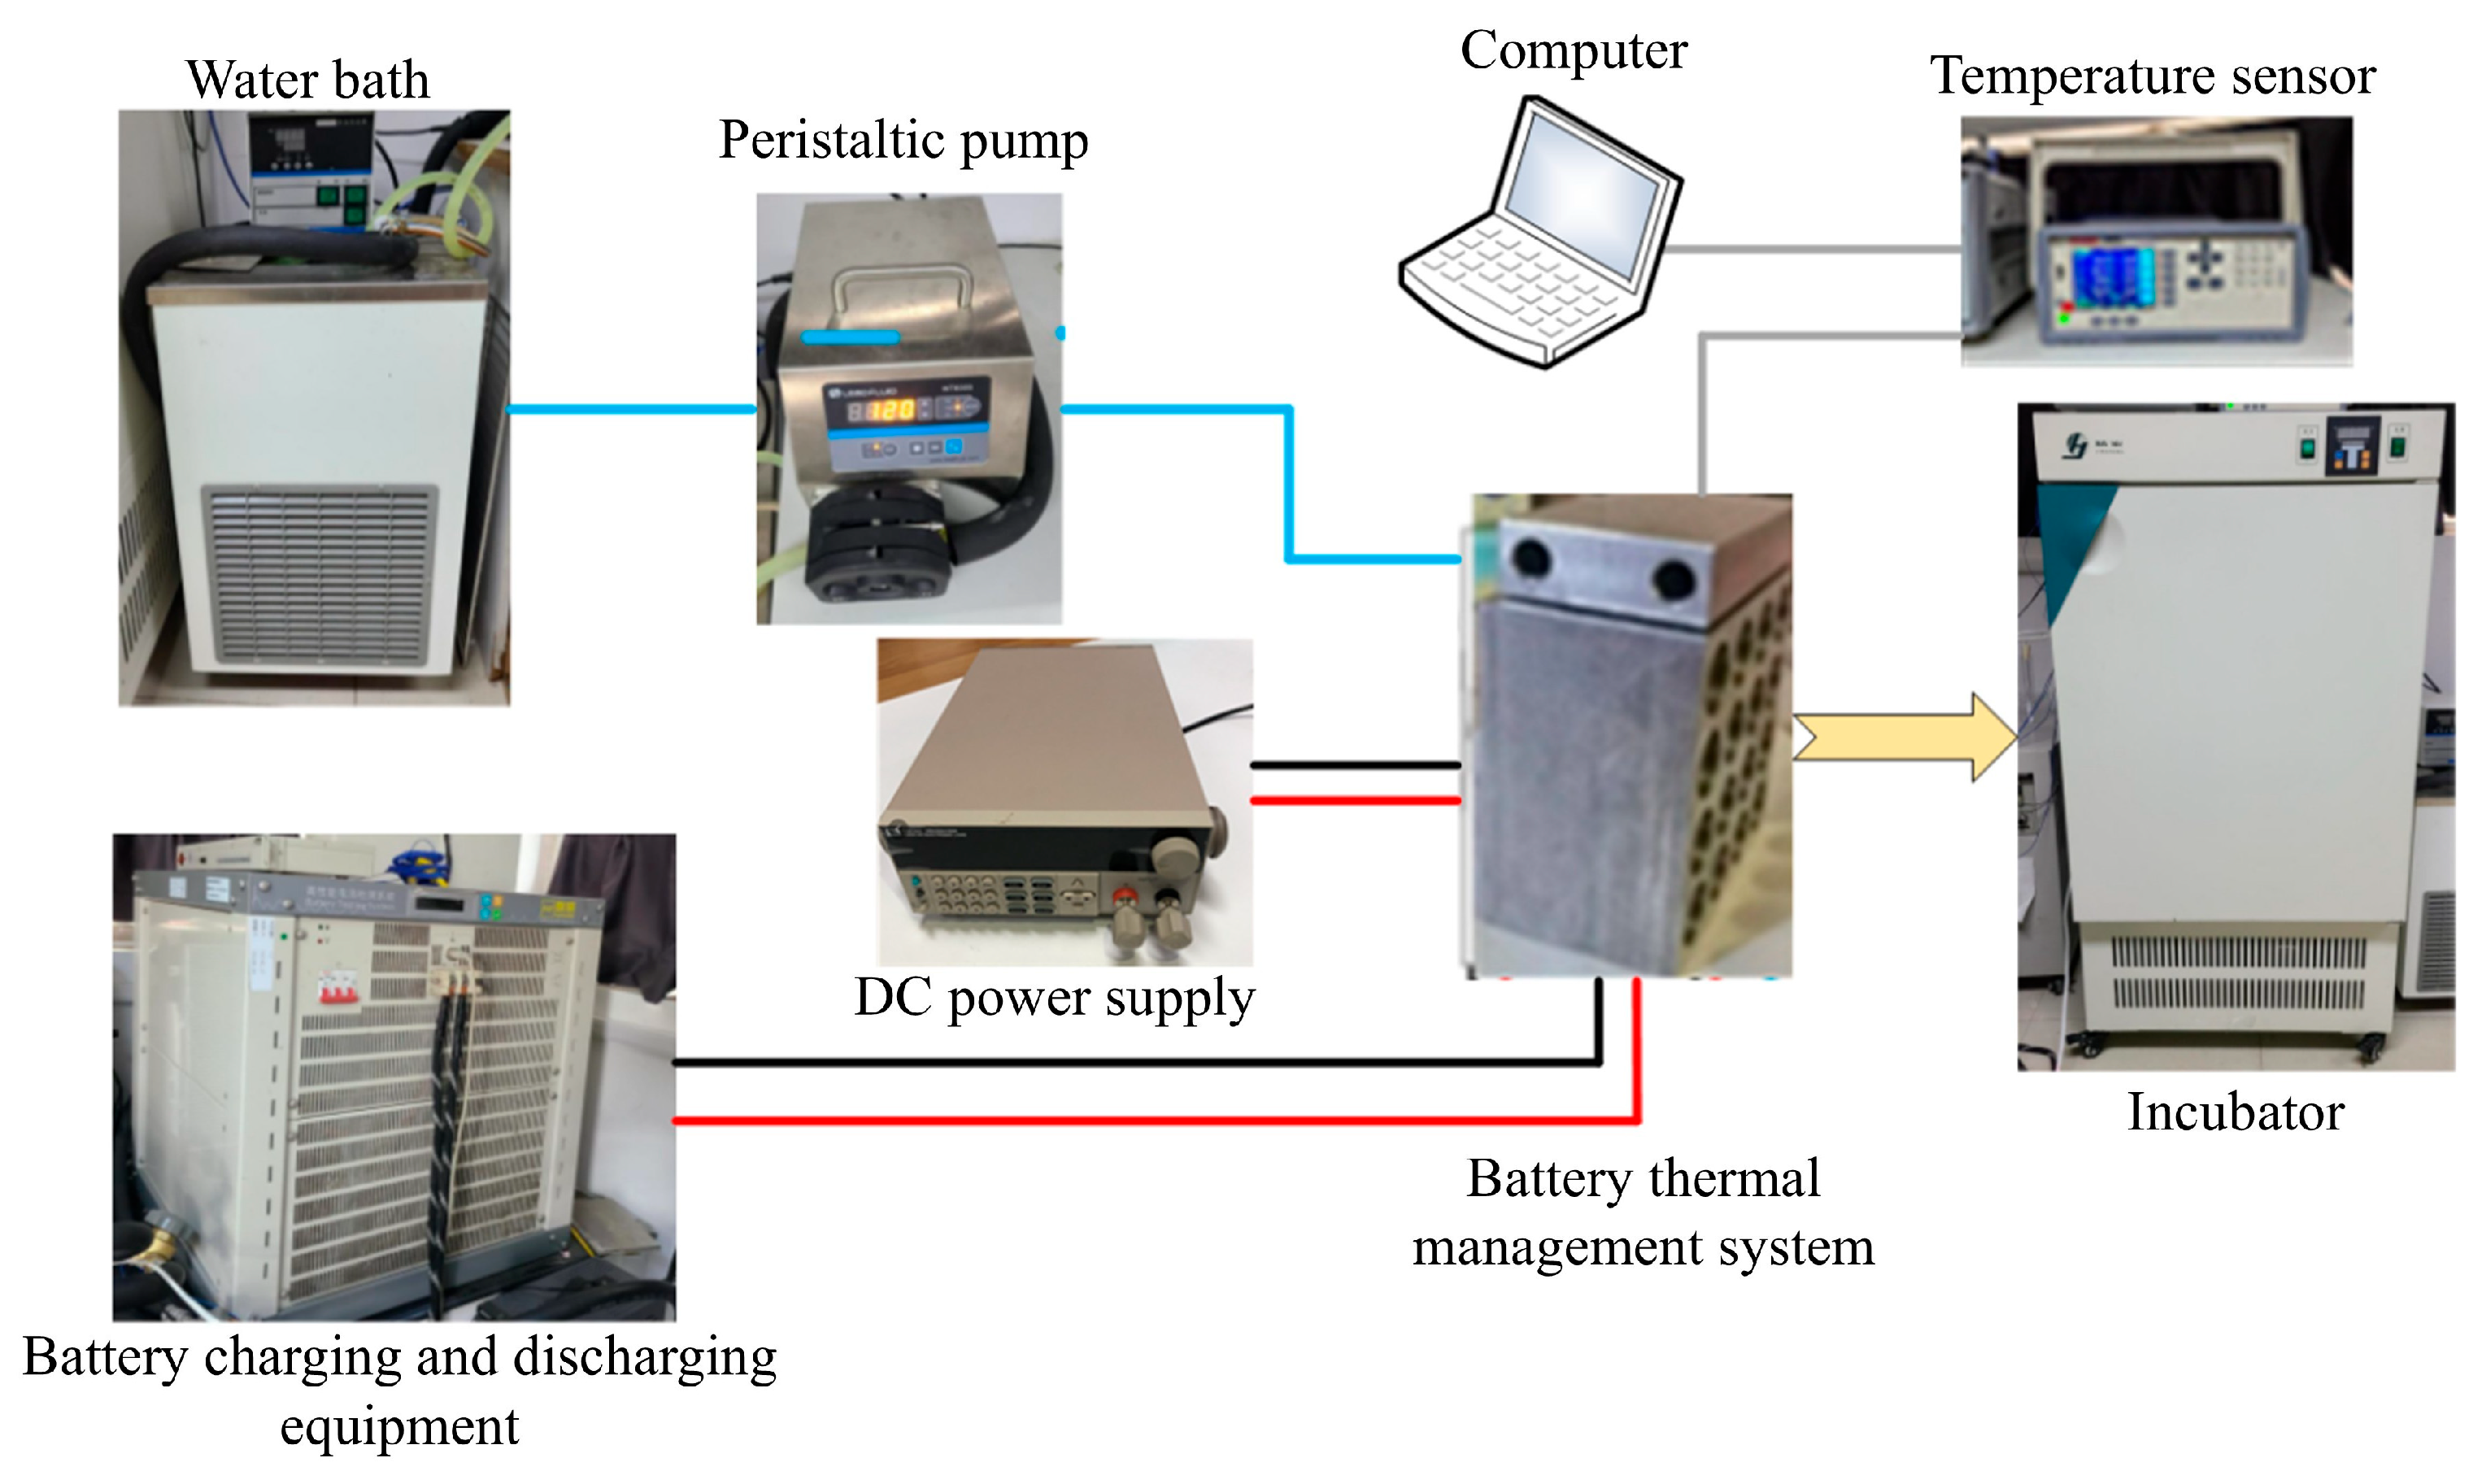
4.3. Experimental Verification

To test and validate the system, a test bench was set up as shown in Figure 14: the battery charging and discharging equipment is connected to the battery pack to control the battery charging and discharging rate; the DC power supply is connected to the thermal devices to provide the system working current input; the constant temperature water tank controls the temperature of the cooling water, which is then connected to the cooling end after the flow rate is controlled by a peristaltic pump; the temperature detector is connected to the computer and the thermal management system to detect and record the surface temperature.
Under the boundary conditions of a battery charge rate of 3C and a cooling water mass flow rate of 50 g/s, by varying the system input current, the maximum temperature and maximum temperature difference were obtained through experiments and numerical simulations, as shown in Figure 15 below.
The model results and experimental results show good consistency, with the experimental data showing a trend of experimental results being higher than the numerical simulation model results. The calculations show that under input currents of 2 A and 3 A in the system, the maximum temperature errors are 5.32% and 5.45%, respectively, and the maximum temperature difference errors are 4.32% and 4.36%, respectively, all within an acceptable range.

5. Conclusions

Aiming at the problems of poor cooling performance and high input power of the current thermoelectric-cooled battery thermal management system, this paper designs an optimization method based on the arrangement of TECs, to make the battery module work in a suitable operating temperature range, and at the same time optimize the input power to reduce the input power. The main research content of this paper is as follows:
(1) The electrochemical–electrical–thermal–fluid multi-physical field coupling mechanism of the battery thermal management system based on the thermoelectric effect is analyzed, and then the numerical model is constructed.
(2) Aiming at the problem that the increase in the number of TECs leads to the increase in input power and the gradual decrease in cooling efficiency improvement, this paper proposes a method for determining the optimal number of TECs in the arrangement structure. The results show that when the number of TECs is 4, the cooling coefficient of the system effect is maximized. Therefore, for the structural and physical parameters of the battery model studied in this paper, the optimal number of TECs is 4.
(3) The effect of the TECs’ input current on the output performance was investigated. Among the different TEC input currents, the trend of increasing and then decreasing with the increase in input current is shown, and the optimal value is reached when the input current is 3 A.

Author Contributions

Conceptualization, S.F. and H.Q.; methodology, S.F. and H.Q.; software, S.F.; validation, S.F. and H.Q.; formal analysis, S.F.; investigation, S.F.; resources, S.F.; data curation, S.F.; writing—original draft preparation, H.Q.; writing—review and editing, H.Q.; visualization, H.Q.; supervision, H.Q.; project administration, H.Q. All authors have read and agreed to the published version of the manuscript.

Funding

This research was funded by the Master Technician’s Automotive Workshop (SGZS202301-1).

Data Availability Statement

The original contributions presented in this study are included in the article. Further inquiries can be directed to the corresponding author.

Conflicts of Interest

The authors declare no conflicts of interest.

References

  1. Yan, H.; Ma, X.; Chen, Y.; Tao, Q.; Song, M. Performance analysis of a wet pad assisted air-cooled battery thermal management system with varying number of battery cells. Appl. Therm. Eng. 2025, 259, 124747. [Google Scholar] [CrossRef]
  2. Na, X.; Kang, H.; Wang, T.; Wang, Y. Reverse layered air flow for Li-ion battery thermal management. Appl. Therm. Eng. 2018, 143, 257–262. [Google Scholar] [CrossRef]
  3. Su, Q.; Kang, F.; Li, J.; Ma, Q.; Wang, Y.; Duan, J.; Zhang, C. Experimental and numerical investigation of a composite thermal management system for energy storage battery based on air cooling. Appl. Therm. Eng. 2025, 262, 125184. [Google Scholar] [CrossRef]
  4. Zhang, J.; Wu, X.; Chen, K.; Zhou, D.; Song, M. Experimental and numerical studies on an efficient transient heat transfer model for air-cooled battery thermal management systems. J. Power Sources 2021, 490, 229539. [Google Scholar] [CrossRef]
  5. Sofi, A.Y.; Qayoum, A. Design optimization and cooling performance assessment of a pulsating Air-Cooled Lithium-Ion battery thermal management System. Therm. Sci. Eng. Prog. 2025, 59, 103391. [Google Scholar] [CrossRef]
  6. Zhou, H.; Zhou, F.; Xu, L.; Kong, J.; Yang, Q. Thermal performance of cylindrical Lithium-ion battery thermal management system based on air distribution pipe. Int. J. Heat Mass Transf. 2019, 131, 984–998. [Google Scholar] [CrossRef]
  7. Zhang, G.; Liu, Z.; Wu, Z.; Lu, W.; Yang, Q. Experimental investigation of battery thermal management system based on micro heat pipe array coupled air cooling. Therm. Sci. Eng. Prog. 2025, 60, 103493. [Google Scholar] [CrossRef]
  8. Al-Zareer, M.; Dincer, I.; Rosen, M.A. Novel thermal management system using boiling cooling for high-powered lithium-ion battery packs for hybrid electric vehicles. J. Power Sources 2017, 363, 291–303. [Google Scholar] [CrossRef]
  9. Deng, Y.; Feng, C.; Zhu, H.; Chen, J.; Wen, M.; Yin, H. Effects of different coolants and cooling strategies on the cooling performance of the power lithium ion battery system: A review. Appl. Therm. Eng. 2018, 142, 10–29. [Google Scholar] [CrossRef]
  10. Liu, J.; Yang, Q.; Huang, S.; Wang, H. Optimization of battery thermal management system based on phase change materials coupled with immersion cooling. J. Energy Storage 2025, 127, 117118. [Google Scholar] [CrossRef]
  11. Tang, Z.; Li, X.; Li, Y.; Cheng, J. Multi-objective optimization of parallel flow immersion cooling battery thermal management system with flow guide plates based on artificial neural network. Appl. Therm. Eng. 2025, 274, 126833. [Google Scholar] [CrossRef]
  12. Wei, W.; Luo, Z.; Qiao, S.; Zhai, J.; Lei, Z. Analysis and design of module-level liquid cooling system for rectangular Li-ion batteries. Int. J. Heat Mass Transf. 2024, 225, 125435. [Google Scholar] [CrossRef]
  13. Luo, Y.; Zhu, C.; Zang, M.; Wang, S. Experimental and theoretical study of an immersion battery thermal management system based on synthetic ester fluid. Int. J. Heat Mass Transf. 2025, 250, 127332. [Google Scholar] [CrossRef]
  14. Keyinci, S.; Ilinčić, P.; Tosun, E.; Uzun, M.; Yakaryilmaz, A.C.; Ozcanli, M. Design and performance analysis of a curved channel liquid cooling system for battery thermal management. Therm. Sci. Eng. Prog. 2025, 63, 103690. [Google Scholar] [CrossRef]
  15. Bai, F.; Chen, M.; Song, W.; Yu, Q.; Li, Y.; Feng, Z.; Ding, Y. Investigation of thermal management for lithium-ion pouch battery module based on phase change slurry and mini channel cooling plate. Energy 2019, 167, 561–574. [Google Scholar] [CrossRef]
  16. Bohacek, J.; Raudensky, M.; Karimi-Sibaki, E. Polymeric hollow fibers: Uniform temperature of Li-ion cells in battery modules. Appl. Therm. Eng. 2019, 159, 113940. [Google Scholar] [CrossRef]
  17. Liu, H.; Chika, E.; Zhao, J. Investigation into the effectiveness of nanofluids on the mini-channel thermal management for high power lithium ion battery. Appl. Therm. Eng. 2018, 142, 511–523. [Google Scholar] [CrossRef]
  18. Li, Y.; Zhou, Z.; Wu, W.-T. Three-dimensional thermal modeling of Li-ion battery cell and 50 V Li-ion battery pack cooled by mini-channel cold plate. Appl. Therm. Eng. 2019, 147, 829–840. [Google Scholar] [CrossRef]
  19. Sheng, L.; Zhang, H.; Su, L.; Zhang, Z.; Zhang, H.; Li, K.; Fang, Y.; Ye, W. Effect analysis on thermal profile management of a cylindrical lithium-ion battery utilizing a cellular liquid cooling jacket. Energy 2021, 220, 119725. [Google Scholar] [CrossRef]
  20. Al-Zareer, M. Numerical Study of Flow and Heat Transfer Performance of 3D-Printed Polymer-Based Battery Thermal Management. Int. J. Heat Mass Transf. 2020, 158, 119995. [Google Scholar] [CrossRef]
  21. Xie, L.; He, Z.; Zhao, Y.; Vulin, D.; Bhayo, B.A. Research on topology optimization of liquid-cooled plates based on multi-level optimization. Int. Commun. Heat Mass Transf. 2024, 155, 107495. [Google Scholar] [CrossRef]
  22. Liu, Z.; Wang, B.; Tan, Y.; Li, P. Thermal management of lithium-ion battery pack under demanding conditions and long operating cycles using fin-enhanced PCMs/water hybrid cooling system. Appl. Therm. Eng. 2023, 233, 121214. [Google Scholar] [CrossRef]
  23. Yu, H.; Zhu, X.; Ma, X.; Yan, H. Cooling performance analysis and sensitivity analysis of thermoelectric cooling for an 18650 battery pack thermal management. Case Stud. Therm. Eng. 2025, 72, 106394. [Google Scholar] [CrossRef]
  24. Lyu, Y.; Siddique, A.R.M.; Majid, S.H.; Biglarbegian, M.; Gadsden, S.A.; Mahmud, S. Electric vehicle battery thermal management system with thermoelectric cooling. Energy Rep. 2019, 5, 822–827. [Google Scholar] [CrossRef]
  25. Park, S.J.; Park, J.; Bang, K.M.; Lee, J.M.; Park, W.; Ziolkowski, P.; Jin, H. Thermoelectric hotspot cooling using thermally conductive fillers. Appl. Therm. Eng. 2023, 232, 120994. [Google Scholar] [CrossRef]
  26. Jiang, L.; Zhang, H.; Li, J.; Xia, P. Thermal performance of a cylindrical battery module impregnated with PCM composite based on thermoelectric cooling. Energy 2019, 188, 116048. [Google Scholar] [CrossRef]
  27. Zhang, C.-W.; Chen, S.-R.; Gao, H.-B.; Xu, K.-J.; Xia, Z.; Li, S.-T. Study of Thermal Management System Using Composite Phase Change Materials and Thermoelectric Cooling Sheet for Power Battery Pack. Energies 2019, 12, 1937. [Google Scholar] [CrossRef]
  28. Liu, X.; Zhang, C.-F.; Zhou, J.-G.; Xiong, X.; Zhang, C.-C.; Wang, Y.-P. Numerical simulation of hybrid battery thermal management system combining of thermoelectric cooler and phase change material. Energy Rep. 2022, 8, 1094–1102. [Google Scholar] [CrossRef]
  29. Liu, X.; Zhang, C.-F.; Zhou, J.-G.; Xiong, X.; Wang, Y.-P. Thermal performance of battery thermal management system using fins to enhance the combination of thermoelectric Cooler and phase change Material. Appl. Energy 2022, 322, 119503. [Google Scholar] [CrossRef]
  30. Luo, D.; Zhao, Y.; Cao, J.; Chen, W.-H.; Zhao, Y.; Cao, B. Performance analysis of a novel thermoelectric-based battery thermal management system. Renew. Energy 2024, 224, 120193. [Google Scholar] [CrossRef]
  31. Pan, Y.; Tang, A.; Liu, Z.; Shan, C. Experimental analysis of power battery preheating system based on thermoelectric elements. Appl. Therm. Eng. 2023, 230, 120860. [Google Scholar] [CrossRef]
Figure 1. Structure of system. (a) Thermoelectric cooler, (b) water-cooled plate, (c) thermal conductivity framework, (d) battery.
Wevj 16 00344 g001
Figure 2. Determination of the optimal number of TECs for the system.
Wevj 16 00344 g002
Figure 3. Schematic diagram of thermal management system structural parameters and TECs layout. (a) Main view, (b) layout when n is even, (c) layout when n is odd.
Wevj 16 00344 g003
Figure 4. Thermal management system meshing. (a) Main view, (b) top view, (c) local enlarged view.
Wevj 16 00344 g004
Figure 5. Comparison of the temperature field of the system with different numbers of TECs.
Wevj 16 00344 g005
Figure 6. Temperature distribution of the battery at different numbers of TECs.
Wevj 16 00344 g006
Figure 7. Comparison of temperature field distributions of different numbers of TECs.
Wevj 16 00344 g007
Figure 8. The battery temperature for different numbers of TECs.
Wevj 16 00344 g008
Figure 9. Average temperature and the degree of reduction at different number of TECs.
Wevj 16 00344 g009
Figure 10. Input power and COP of the system for different numbers of TECs.
Wevj 16 00344 g010
Figure 11. Distribution of temperature of the battery under different input currents.
Wevj 16 00344 g011
Figure 12. Average battery temperature under different input currents.
Wevj 16 00344 g012
Figure 13. (a) Voltage distribution, (b) hot end temperature distribution, (c) power and cooling factor at different input currents.
Wevj 16 00344 g013
Figure 14. Battery thermal management system test bench.
Wevj 16 00344 g014
Figure 15. Analysis of input current change and output response in thermal management system.
Wevj 16 00344 g015
Table 1. Material parameters for TECs.
ParametersThermal
Conductivity
λ (W/m∙k)
Seebeck Coefficient
α (μV/K)
Electrical Conductivity
σ−1 (10−5 Ω∙m)
Ceramic plates20NANA
Copper electrode plates397NA0.00175
P-type semiconductor λ P = 3.2 × 10 5 T 2 0.0216 T + 4.949 α P = 6.373 × 10 6 T 3 + 0.00359 T 2 0.0924 T + 84.605 σ P 1 = 1.263 × 10 7 T 3 + 1.327 × 10 4 T 2 0.0376 T + 3.838
N-type semiconductor λ N = 2.36 × 10 5 T 2 0.015 T + 3.806 α N = 1.045 × 10 5 T 3 0.00933 T 2 + 2.649 T 446.029 σ N 1 = 2.147 × 10 7 T 3 + 2.551 × 10 4 T 2 0.0962 T + 12.711
Table 2. Electrical parameters of the 18650 battery.
ParametersValue
Size (mm)18 × 65
Average density (kg·m−3)2631.4
Mass (g)64
Rated voltage (V)3.7
Rated capacity (mAh)4000
Discharge cutoff voltage (V)2.75
Max. discharge current (A)12
Optimum operating temperature during discharge (K)293.15–318.15
Anode materialGraphite
Cathode materialLix(Ni0.33Mn0.33Co0.33)O2
Table 3. Boundary conditions and parameters.
ParametersValueUnit
Ambient temperature300K
Environmental heat transfer coefficient15 W / ( m 2 K )
Specific heat capacity of water4.177 k J / ( k g K )
Kinetic energy of turbulent flow8.623 10 4   P a s
Thermal conductivity of water0.612 W / ( m K )
Thermal conductivity of aluminum217.7 W / ( m K )
Air thermal conductivity 3.1780 × 10 12 T 4 1.1708 × 10 8 T 3 + 1.6237 × 10 5 T 2 1.051 × 10 2 T + 3.1589 k g / m 3
Specific heat of air 2.8163 × 10 13 T 4 1.0838 × 10 9 T 3 + 1.4411 × 10 6 T 2 5.7059 × 10 4 T + 1.073 k J / ( k g K )
Air turbulence kinetic energy 7.0048 × 10 9 T 3 2.8219 × 10 5 T 2 + 6.0982 × 10 2 T + 2.68 10 6   P a s
Air thermal conductivity 1.4149 × 10 11 T 3 5.2381 × 10 8 T 2 + 1.085 × 10 4 T 1.8174 × 10 3 W / ( m K )
Table 4. Changes in maximum temperature and maximum temperature difference under different grid numbers.
Number of GridsMaximum Temperature (K)Maximum Temperature
Difference (K)
420,000315.83.1
470,000318.13.4
520,000319.23.5
570,000319.23.5
Table 5. Battery module maximum temperature and maximum temperature difference enhancement capability.
Number of Thermoelectric Components (n)Maximum Temperature Boosting Capability (%)Maximum Temperature
Lift Capacity (%)
0--
18.9314.48
23.4538.06
39.2314.63
410.3466.37
510.6439.30
69.5833.68
Disclaimer/Publisher’s Note: The statements, opinions and data contained in all publications are solely those of the individual author(s) and contributor(s) and not of MDPI and/or the editor(s). MDPI and/or the editor(s) disclaim responsibility for any injury to people or property resulting from any ideas, methods, instructions or products referred to in the content.

