Article

Understanding Behavioral Intention to Adopt Electric Vehicles Among Motorcycle Taxi Pilots: A PLS-SEM Approach

1
Post Graduate Department of Commerce, Government College of Arts, Science and Commerce, Khandola 403107, Goa, India
2
Department of Commerce, Rosary College of Commerce and Arts, Navelim 403707, Goa, India
3
Goa Business School, Goa University, Durgavado 403206, Goa, India
4
Department of Commerce, Vidya Prabodhini College, Alto Porvorim 403521, Goa, India
*
Author to whom correspondence should be addressed.
World Electr. Veh. J. 2025, 16(6), 309; https://doi.org/10.3390/wevj16060309
Submission received: 26 April 2025 / Revised: 24 May 2025 / Accepted: 26 May 2025 / Published: 31 May 2025

Abstract

Progressive advancements in the global economy and technology have propelled human civilization forward; however, they have also inflicted significant harm on the global ecological environment. In the present era, electric vehicle (EV) technology is playing a vital role due to its environmentally friendly technological advances. However, widespread adoption of EVs has been hindered by their limited travel range, inadequate charging infrastructure, and high costs. This can be closely observed when we assess the adoption of electric vehicles (EVs) among motorcycle taxi drivers, commonly called ‘pilots,’ in Goa, India. Motorcycle taxis are crucial in Goa’s transportation network, providing affordable, efficient, and door-to-door services, especially in regions with limited public transport options. However, the rising costs of petrol and vehicle maintenance have adversely affected the income of these pilots, prompting concerns about their willingness to adopt EVs. This study aims to analyze the factors prompting the behavioral intention to adopt EVs by motorcycle taxi pilots in Goa, India, focusing on six key determinants: charging infrastructure, effort expectancy, performance expectancy, price value, social influence, and satisfaction with incentive policies. A quantitative approach was employed, utilizing stratified proportionate random sampling techniques to collect data from 242 motorcycle taxi pilots registered with the Goa State Government Transport Department. It was analyzed using partial least squares-structural equation modeling (PLS-SEM) through Smart-PLS 4.0 software. The research highlights that performance expectancy and price value are the potential motivators for the adoption of electric vehicles. These findings suggest that pilots are more likely to embrace EVs when they perceive tangible benefits in performance and find the cost reasonable in relation to the value offered. The results offer actionable insights for policymakers, manufacturers, and other stakeholders. These insights can guide strategic decisions and policy frameworks aimed at fostering a sustainable and user-centric transportation ecosystem.

1. Introduction

1.1. Role of Electric Vehicles (EVs) in the Transportation Sector

Ongoing advancements in infrastructure, automation, transportation, and technology have led to a significant increase in harmful emissions being disseminated into the environment, thereby contributing to the release of greenhouse gases, accelerating climate change and intensifying global warming [1]. These global warming and rising emissions increasingly deteriorate air quality [2,3]. In this regard, the transportation sector is one of the leading contributors to climate change, due to its heavy reliance on fossil fuels and high greenhouse gas (GHG) emissions [2,4,5]. Since human health, ecosystems, and global financial prudence are all totally threatened by climate change, many contemporary transportation policies are concentrating more on reducing their effects [4]. Mobility is crucial for the survival and growth of urban populations. Without organized public transportation, alternatives like motorbikes, minibuses, and rickshaws have rapidly proliferated in cities across Asia, Africa, and South America to meet rising demand. These unregulated and non-traditional modes of transport are referred to as informal transport, with flexible routes, pricing, and schedules [6].
The transportation industry was found to release close to a quarter of carbon dioxide emissions [7], and worldwide, it is responsible for approximately 24% of global CO2 emissions, primarily from road transportation [4]. Climate change issues and their impacts are increasingly capturing the attention of politicians globally [8]. Carbon dioxide, a key contributor to global warming, has led to significant challenges such as reduced water availability, flooding in coastal regions, and malnutrition [9]. Additionally, A. Khurana et al. [10] highlight that the automobile industry, which has been operating for over a century, is on the verge of transformative changes. The rising prices of fossil fuels and their detrimental emissions are prompting individuals to reconsider their modes of transportation [11].
The transportation paradigm is undergoing a radical shift driven by the global force for sustainable energy solutions, emphasizing long-term efficiency, enhanced safety, and environmental responsibility [5]. Notably, this shift is pointing in the direction of the widespread use of electric vehicles (EVs) with energy-efficient rechargeable batteries, resulting in lower GHG emissions [10]. India ranks third among global GHG emitters, accounting for 7.45% of emissions, following China (25.9%) and the United States (13.87%) [4,10]. The aim is to transition to EVs by 2030 to control pollution and reduce their carbon footprint. The government advocates for automobile manufacturers to produce EVs, which are expected to save USD 60 billion on oil expenditures, lower emissions by 37%, and decrease dependence on imported fuel [12]. This initiative also shields against volatile crude oil prices and currency fluctuations [10]. Furthermore, the surge in crude oil prices resulting from geopolitical tensions, such as the ongoing Russia–Ukraine conflict, has prompted India to accelerate the adoption of EVs as its primary mode of transportation [13]. Apart from ground transportation via passenger cars, heavy-duty commercial vehicles make up a significant portion of EVs in use today, while lightweight battery EVs represent only 2.5% of total vehicle sales [13,14]. Based on this, understanding consumer behavioral intention to adopt new technologies is an important condition for the EV automobile industry [15].
Earlier research on promoting EVs in transportation can significantly reduce GHG emissions and decrease reliance on oil and gas [16,17]. As taxis are the primary source of roadside pollutants, transitioning the taxi fleet to EVs is an effective solution strategy [18]. Around the world, many cities have been using electric taxis, such as New York City in the USA [19,20], Tokyo in Japan [20], Stockholm in Sweden [21], Seoul in South Korea [22], and Shenzhen in China [11]. Replacing traditional taxis with EVs in Manhattan could significantly reduce GHG emissions by 73% and energy consumption by 58% [23,24]. J. Pawlak et al. [25] utilized real-world data from Kenya to examine motorcycle taxi trip patterns, concluding that Kenya’s electricity supply can accommodate the additional demand from electric motorcycle taxis, except for long and hilly trips. These scenarios evaluate whether current demand can be met with emerging electric two-wheeler (E2W) technologies [25]. Research shows that supporting the transition to electric vehicles in developing countries requires appropriate legislation, financial incentives, and international collaboration [12].
Only 27.1% of internal combustion engine vehicle (ICEV) taxi drivers express interest in buying an electric taxi, and just 7.6% of the sample plan to acquire a new EV [26]. H. Xia [27] noted that the emergence of the e-bike taxi business around metro stations is attributed to the mismatch between public transport projects and land development, the spatial fragmentation of transport governance, and the uncoordinated spatial configuration surrounding metro stations. J. Yang et al. [18] emphasized the importance of charger network coverage and the potential for government subsidies to reduce the total cost of owning and operating EVs compared to conventional gasoline vehicles. It was indicated that drivers held favorable views towards recharging compared to refueling, and their comfort with the frequency of recharging increased over time [28].

1.2. Current Status of Electric Vehicles (EVs) in India

Over the past decade, India’s EV industry has undergone a profound transformation, characterized by several emerging trends, innovative vehicle models, and the adoption of efficient design principles [5]. A rapid expansion of charging infrastructure has further supported this evolution, as has the implementation of tax-saving schemes and various incentives aimed at consumers and manufacturers. While considering the Indian market sales of the EV segment, three-wheelers have shown the highest sales at 48%, two-wheelers at 47%, and four-wheelers at only 4%, despite different brands with innovative technologies. Finally, the commercial vehicles have shown only 1% sales. As a result, these developments have played a crucial role in attracting a diverse consumer base and fostering a more sustainable transportation ecosystem in the country. It was found that compared to commuters, rideshare drivers exhibited a weaker reliance on symbolic attributes but a stronger emphasis on instrumental factors, particularly perceiving lower purchase costs for EVs than gasoline-powered cars [29]. On a state-wise level, Goa leads the country in EV penetration, with 14.20% of all new EVs, followed by Tripura and Chandigarh. Delhi stands out with a 10.72% penetration, reflecting the capital’s push towards sustainable urban mobility [30]. India wants to catch up with the rest of the world in EV technology. The government has made plans to encourage the fusion of pure EVs, which are seen as ambitious and promising [2].
By 2030, India aims to have 40% of private vehicles and all public transport be electric [31]. Popularizing this concept and maximizing their use is necessary to achieve a future where EVs are ubiquitous [8]. Vital factors impacting the adoption of electric taxis were identified, including perceived benefits, challenges, psychological barriers, and satisfaction with incentives [24]. The potential benefits of digitalization and electrification, such as increased safety and reduced emissions, and the challenges of implementing these changes, including the high cost of electric motorcycles and the need for supportive policies and infrastructure, will lead to their adoption [32]. Furthermore, given a particular geographical distribution of a region and its demographics, the factors influencing EV adoption could vary [8]. Most of the studies conducted in developed countries had infrastructure and technological as well as financial factors available to them [33,34]. India, being geographically a large country, can change people’s perceptions of adopting EVs, which causes a knowledge gap in the study and influences the behavioral intention to adopt EVs.

1.3. Motorcycle Taxis in Goa

Goa is situated on the western coast of India. It is a popular tourist destination in the country [35]. For this reason, like many other popular holiday spots, it has a reliable transportation system that makes it easy for visitors to travel, with buses and taxis always readily available. Goa’s motorcycle taxi represents one of India’s most distinctive public transportation systems, combining efficiency with cultural heritage. These motorcycle taxis, easily identified by their yellow mudguards and yellow number plates, have become integral to Goan identity while offering practical transportation solutions to locals and tourists alike.
Considering the state of Goa’s tourism-driven economy, adopting EVs by motorcycle riders, commonly known as ‘motorcycle pilots’, could have significant implications for sustainable transportation. Numerous European and North American studies have also explored the adoption of EVs; however, research on this topic is limited. Additionally, individual-specific factors influencing EV adoption require further investigation [13]. In developed countries, most studies have focused on the availability of infrastructure, the technology of EVs, and financial aspects, as these resources are more readily accessible [8]. The adoption of EVs has gained momentum worldwide, driven by environmental concerns, rising fuel costs, and government incentives. Despite the increasing push towards electric mobility, motorcycle taxi pilots hesitate to adopt it. Hence, this study aims to identify the factors influencing behavioral intention to adopt electric vehicles among these motorcycle taxi pilots.
The rest of the study is organized as follows: Section 2 presents a theoretical framework and hypotheses development; Section 3 explains the materials and methods, including questionnaire design, sampling method, and statistical techniques and tools used; Section 4 describes the results, including demographic profile, descriptive statistics, measurement model, and structural model; Section 5 discusses the results, managerial implications, and scope for future research; and finally, Section 6 shows the conclusion of the study.

2. Theoretical Framework and Hypotheses Development

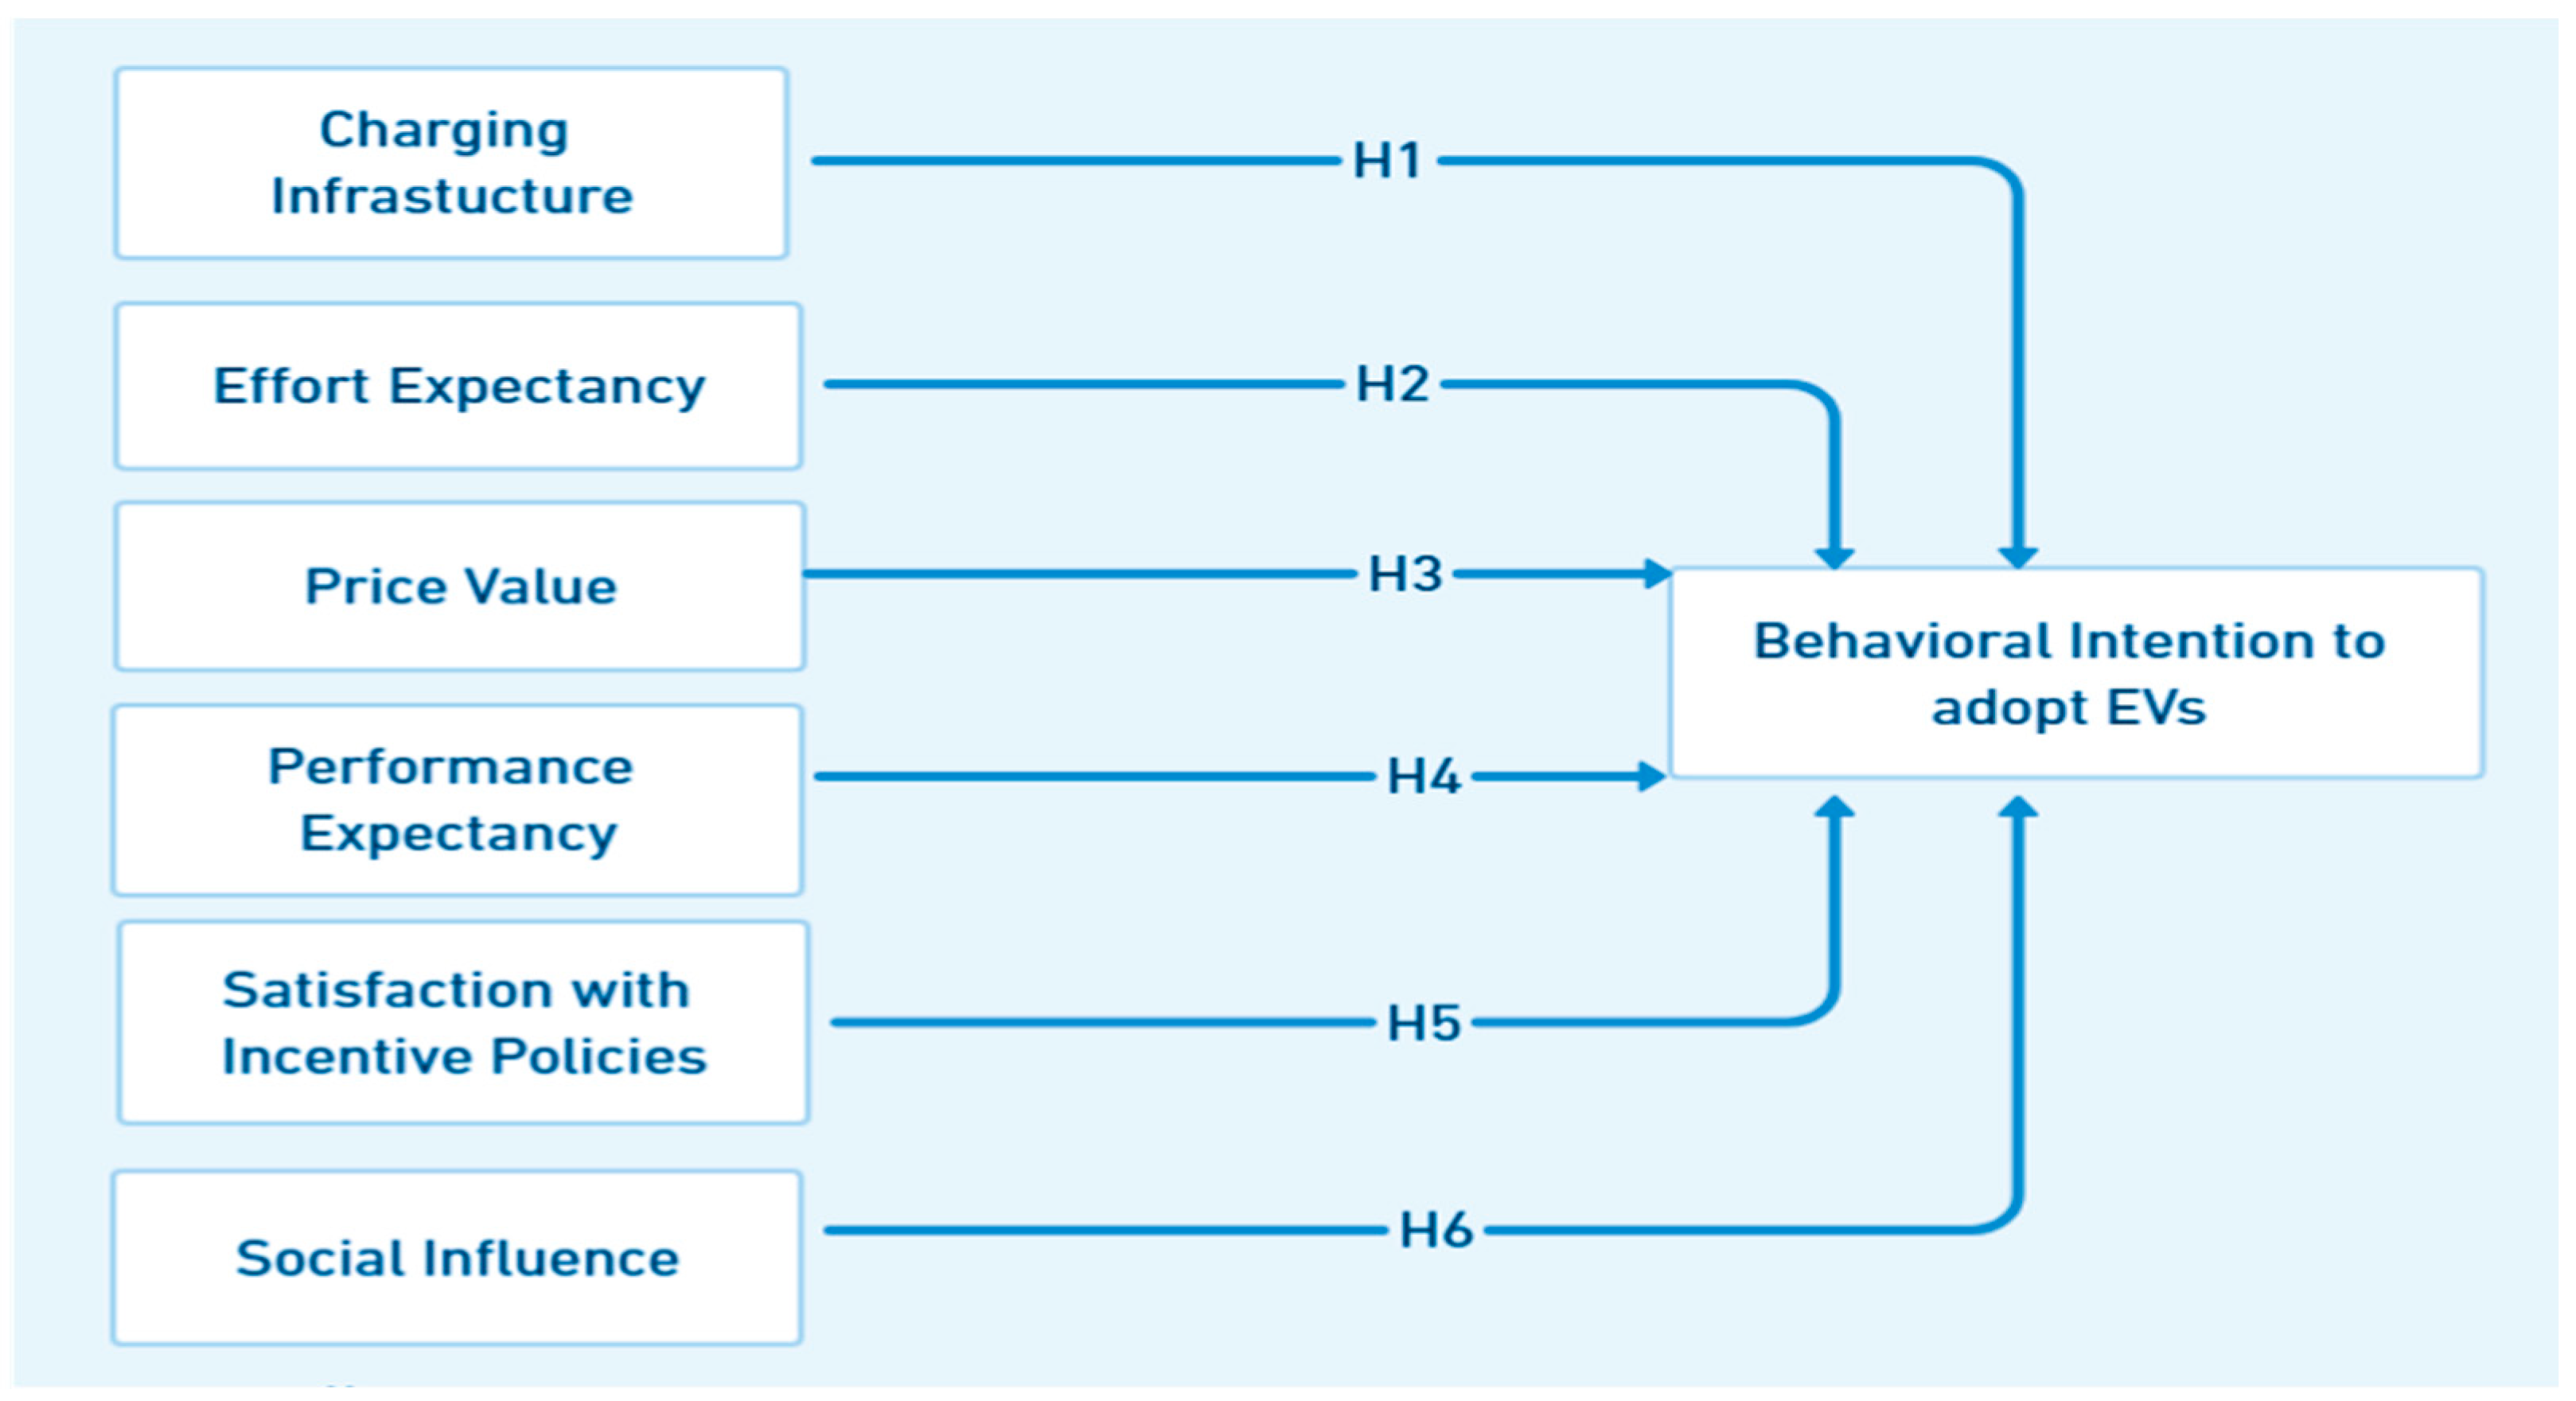
2.1. Theoretical Framework

The different theoretical models have been applied in the technology acceptance studies of EVs, with the theory of planned behavior (TPB) being notably used to analyze real purchasing behavior related to EVs [36]. The technology acceptance model (TAM) identifies key factors influencing consumers’ purchase of EVs [37], and the protection motivation theory (PMT) explains the policy incentives for EV adoption [38]. However, driving and riding are different behaviors influenced by social and economic factors. It is essential to select a comprehensive model that enables an understanding of decision-making behaviors to evaluate the factors influencing motorcycle taxi pilots’ adoption intentions for electric taxis. This study used the Unified Theory of Acceptance and Use of Technology 2 (UTAUT2) model. The original Unified Theory of Acceptance and Use of Technology (UTAUT) model has been widely studied [39], and the model has been further extended to UTAUT2 by adding consumer behavior factors [40]. It improves generalizability in the customer context. Taxi pilots’ behavioral intention is influenced by six constructs: charging infrastructure (CI), effort expectancy (EE), performance expectancy (PE), price value (PV), social influence (SI), and satisfaction with incentive policies (SIP), all of which are considered key antecedents.

2.2. Hypotheses Development

2.2.1. Behavioral Intention (BI) to Adopt the EVs

Behavioral intention is the intensity or the measure of an individual’s intention to perform a specific behavior [41]. Researchers shed light on what motivates Chinese taxi drivers to adopt electric taxis and reported the factors influencing their intentions [42]. Psychological factors have been shown to shape individual intentions towards adopting cleaner vehicles [43]. The evaluation of ownership and use of EVs influences the intention to adopt them [10]. Furthermore, both instrumental and symbolic attributes positively influenced individuals’ intent to adopt EVs [29].

2.2.2. Charging Infrastructure (CI)

The charging infrastructure refers to charging locations equipped with several charging stations. It consists of a battery charger, cables, attachment plugs, and all other fittings that enable a vehicle [44]. The divergent responses to time-based pricing among hired drivers and electric taxi carriers, and hired drivers prioritize faster yet pricier charging, emphasizing the importance of speed and convenience [21]. As the number of electric taxis increases, urban public charging may face a potential strain, potentially prompting more people to charge their vehicles at home. Expanding fast-charging infrastructure is a powerful incentive for ICEV drivers considering the adoption of EVs. The charging stations are preferred on streets (87.2%) and in public car parks (51.6%) [42]. The main concerns for electric taxi adoption were queuing/waiting times (91.6%), distance to charging stations (65.2%), and a lack of incentives (62.4%). It is also assumed to be an essential variable affecting behavioral intention [45]. Thus, the following hypothesis is proposed:
H1. 
Charging infrastructure significantly affects motorcycle taxi pilots’ intention to adopt EVs.

2.2.3. Effort Expectancy (EE)

Effort expectancy refers to the degree of ease associated with using the system [24]. The positive value and the perceived ease of use influence the user’s intention to accept the new system. EV drivers require a different style of operation from those of internal combustion engine (ICE) taxis, which involve frequent battery maintenance, among others. Some studies have shown that EE is expected to have a positive impact on consumers’ intention to use EVs, although it is not the most influential construct [16]. Thus, the hypothesis proposed is as follows:
H2. 
Effort expectancy (EE) significantly affects the behavioral intention of motorcycle taxi pilots to adopt EVs.

2.2.4. Price Value (PV)

E-taxis have a comparable or lower total cost of ownership and offer slightly higher profitability compared to conventional taxis [21]. EVs still face technical limitations, making it essential for taxi carriers and city administrators to understand the associated economic costs and benefits [46]. The study highlights that in Florence, the competitiveness of electric taxis is solely determined by their costs, as there are no special fares or privileges in place. It also examines potential financial losses for electric taxi operators due to limited driving range and discusses how purchase subsidies affect the cost competitiveness of electric taxis. Subsidies on vehicle purchase price, rental income, and battery lifespan were key factors influencing taxi owners’ decisions [18]. In contrast, taxi drivers were affected by fare income, rental costs, access to chargers, and range per charge. An equilibrium model was proposed to show how these factors interact and predict the switch percentage under different policies. When the benefits of using new technology are considered to be greater than the cost, the price value has a positive impact on the use behavior [45]. Thus, the proposed hypothesis is as follows:
H3. 
Price value significantly affects motorcycle taxi pilots’ behavioral intention to adopt the EVs.

2.2.5. Performance Expectancy (PE)

Performance expectancy is one of the most influential variables in behavioral intention to adopt new systems or technologies [47]. When drivers think electric taxis can improve service efficiency, they are more likely to accept and use them. It is also a prominent factor in electric vehicle research [39,40]. The studies are also concerned with technological and social/individual factors influencing the likelihood of EV adoption [48]. Thus, the hypothesis proposed is as follows:
H4. 
Performance expectancy significantly impacts motorcycle taxi pilots’ behavioral intention to adopt EVs.

2.2.6. Satisfaction with Incentive Policies (SIP)

Many countries and regions have developed policies for promoting EVs, and the literature also accounts for incentives to increase the market share of EVs [49]. Most measures for increasing EV adoption include incentives favoring EVs [17]. Incentives have been crucial for introducing alternative fuel vehicles [18]. Analysis indicates no significant difference in the time-to-buy for non-hybrid EV and hybrid EV taxi owners. Without government intervention, the taxi fleet is projected to comprise 9.35% EVs, resulting in a 2.29% reduction in carbon dioxide emissions. However, particulate matter may slightly increase due to a higher proportion of sport–utility hybrid taxis. The study suggests that government intervention, such as mandates or incentives, is necessary to improve the environmental impact of the taxi fleet [50]. M. Zhou et al. [24] have included satisfaction with incentive policies in their study, which shows a positive relationship with behavioral intention, thereby supporting the hypothesis. Thus, the hypothesis proposed is as follows:
H5. 
Satisfaction with incentive policies significantly impacts motorcycle taxi pilots’ intention to adopt the EVs.

2.2.7. Social Influence (SI)

Social influence plays a pivotal role in shaping consumer behavior, particularly in the context of adopting EVs. This influence manifests through various channels, including subjective norms, peer pressure, and cultural influence [10]. Families, friends, and relatives’ opinions influence the customers’ decisions [39]. Social networks influence an individual’s decision regarding EV adoption [51]. Social influence affects behavioral intention positively [15]. Hence, the proposed hypothesis is as follows:
H6. 
Social influence significantly affects motorcycle taxi pilots’ behavioral intention to adopt EVs.
The theoretical framework is illustrated with paths in Figure 1. The main factors influencing the adoption of EVs are reflected in a conceptual model with the following seven constructs: charging infrastructure, effort expectancy, price value, performance expectancy, satisfaction with incentive policies, representative exogenous constructs, and behavioral intention to adopt the EVs as an endogenous construct.

3. Materials and Methods

3.1. Questionnaire Design

The study is based on a survey and employs a quantitative approach, focusing on the state of Goa, India. A structured questionnaire, consisting of two sections, was developed. Section A collects demographic information about the respondents, while Section B gathers the opinions of motorcycle taxi pilots regarding the adoption of EVs. A total of 23 measurement items were derived from the existing literature. Responses were assessed using a five-point Likert scale, ranging from “strongly disagree” (1) to “strongly agree” (5).

3.2. Variables Used for the Study

Table 1 presents the constructs and statements used in the present study.

3.3. Sampling Method

Table 2 depicts the determination of sample size. The total population identified for this study comprises 2059 registered motorcycle taxi pilots across Goa. These data were obtained from the Department of Transport, Government of Goa, according to their place of registration. Accordingly, the sample locations were selected based on the state’s distribution of registered offices.
Cochran’s Formula was employed to determine the appropriate sample size. This formula is widely used to calculate the ideal sample size required for a desired level of precision, confidence level, and estimated proportion within a population. While the standard Cochran’s Formula is best suited for large populations and an adjusted formula for smaller populations, it is expressed as N = N0/{1 + (N0 − 1)/N}. Therefore, the following calculations are calculated based on Cochran’s Formula. Applying this formula, where N = 385/[1 + {385 – 1)/2059}]; N = 324.
Thus, the calculated sample size for this study was 324. A stratified proportionate random sampling method was then employed to select participants from the target population. To enhance accuracy and account for potential non-responses, structured questionnaires were distributed to 350 individuals. Out of which 280 responses were received. However, due to incomplete data and bias in some responses, 38 were excluded, resulting in 242 valid responses. This corresponds to a final response rate of 69.14%.

3.4. Techniques and Tools Used

Descriptive statistics with SPSS and structural equation modeling (SEM) with partial least squares (PLS) were employed to assess the data using measurement and structural models. SEM can be categorized into covariance- and variance-based [56]. Covariance-based SEM (CB-SEM) technique describes indicator variability and relationships. When estimating model parameters, the scores of these common variables are unknown and redundant. Meanwhile, PLS-SEM is an advanced statistical method for examining hypothesized relationships and proposed models. It is considered the most comprehensive and all-encompassing technique among variance-based SEM. PLS-SEM estimates complicated models with numerous observable and unobservable variables and also acquires solutions with limited sample sizes [57]. Hence, this study utilized Smart-PLS 4.0 statistical software to analyze the data using the algorithm and bootstrapping approaches [57].

4. Results

4.1. Demographic Profile

A comprehensive overview of the respondents’ demographic profile and descriptive statistics is crucial for accurate data analysis. This includes essential information such as age, gender, education level, and other key characteristics that may impact the study results. By understanding the composition of the sample population under study, researchers can more accurately interpret the data and draw meaningful conclusions. Therefore, a detailed examination of the respondents’ demographic profile is essential for a deeper understanding of the research findings and their implications.
Table 3 states that out of the total 242 motorcycle taxi pilots, the majority, 166 (68.6%), have completed their secondary education. This suggests that many motorcycle taxi pilots possess at least an essential educational qualification. Primary education is completed by 60 pilots (24.8%), and 10 pilots (6.60%) completed higher secondary education. This indicates that pilots have completed their basic education and can read, write, and do arithmetic. It is interesting to note that most of the pilots are from South Goa. Furthermore, it is worth noting that most respondents have purchased their vehicles through loans. This suggests that motorcycle taxi pilots may struggle to finance their vehicles or that loans are a standard means of financing for this occupation.

4.2. Descriptive Statistics

Table 4 shows that the average age of motorcycle taxi pilots was 52, ranging from 25 to 80 years. On an average day, these pilots earn around INR 564 while working for approximately 10 h, which is more than the typical working hours of a private service worker (8 h per day). Further, it was found that most of these pilots have an average of 22 years of experience.

4.3. Measurement Model

The assessment of the measurement model is the first stage in PLS-SEM analysis using SmartPLS 4.0, which tests the measurements’ reliability and validity. This model was used to test the link between indicators and latent variables. Within this approach, composite reliability, convergent validity, and discriminant validity were used to evaluate the model. The internal consistency reliability of the constructs is measured with the help of Cronbach’s alpha, and composite reliability is used, where the threshold limit of all the items should be 0.70 [57]. Secondly, validity is confirmed by examining the convergent validity and discriminant validity. Convergent validity is the extent to which the construct converges to explain the variance of its items. The metric used for evaluating a construct’s convergent validity is the average variance extracted (AVE) for all items on each construct. The threshold limit of AVE is 0.50 or higher, indicating that the construct explains at least 50% of item variance [57]. Discriminant validity is the extent to which a construct is empirically distinct from other constructs in the structural model. It is measured in two ways. In the case of the Fornell–Larcker criterion, the shared variance for all constructs should be larger than their AVE, and as a replacement, Henseler et al. [56] proposed the heterotrait–monotrait (HTMT) ratio of correlations, where the threshold limit of all the construct values should be lower than 0.85.
Table 5 demonstrates that all variable factor loadings surpass 0.70, with Cronbach’s alpha and composite reliability values also exceeding 0.70. Additionally, the average variance extracted (AVE) for all constructs exceeds 0.50, which aligns with the recommendations of [57]. Therefore, all constructs have successfully achieved reliability. Furthermore, since the AVE for each construct exceeds 0.5, both validity and reliability have been established for all constructs.
In Table 6, the researchers verified the discriminant validity, the extent to which a construct is empirically distinct from other constructs in the structural model [58], using the Fornell and Larker criterion, proposed the traditional metric, and suggested that each construct’s AVE should be compared to the squared inter-construct correlation (as a measure of shared variance) of that same construct and all other reflectively measured constructs in the structural model—the shared variance for all model constructs should not be larger than their AVEs [57]. Alternatively, in Table 7, discriminant validity is achieved using the HTMT ratio, where the threshold limit is less than 0.85, indicating that each construct has a unique fit for the study.

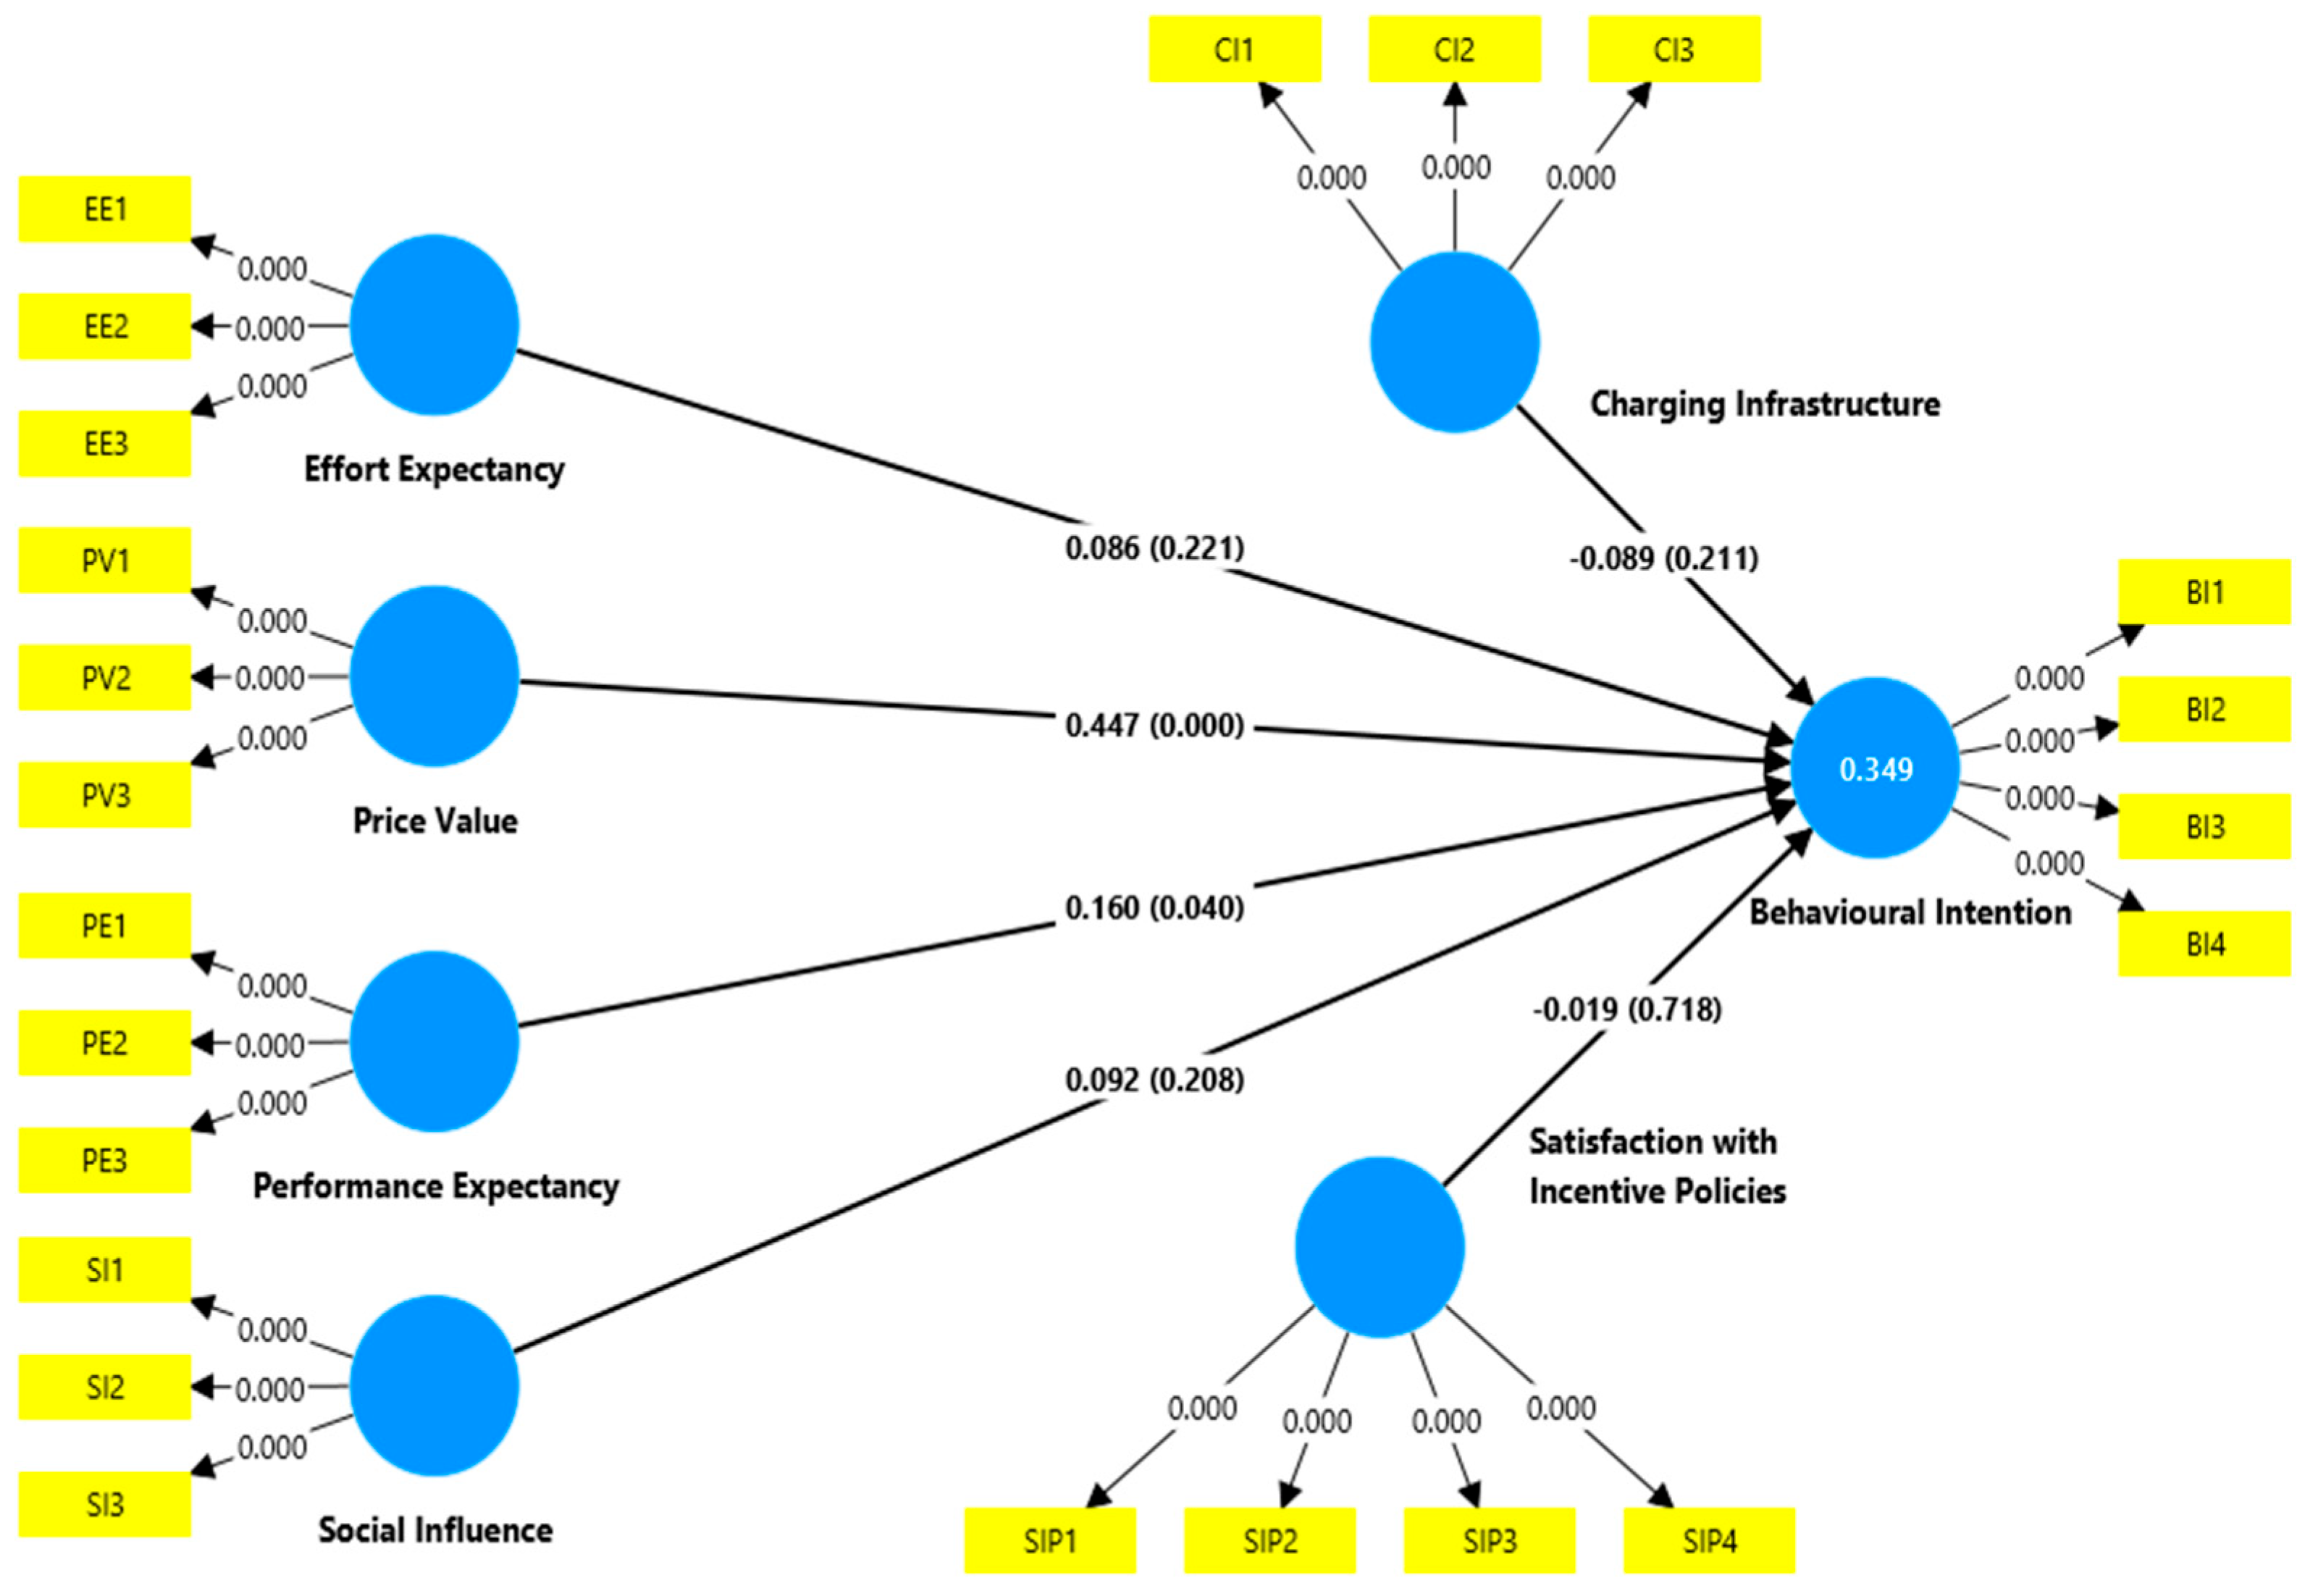
4.4. Structural Model

In the structural model, coefficients for the relationships between the constructs are derived from estimating a series of regression equations. Before assessing the structural relationship, collinearity should be examined with the variance accounted for (VIF) values, where the threshold limit is 3 or lower [57].
Table 8 presents the path coefficients and p-values tested at a 5% significance level. To assess the significance of the structural model paths, bootstrapping with 5000 subsamples was employed.
Results suggest that performance expectancy, which is an important factor with a significant and positive relationship with BI (β = 0.160; p-value = 0.040), if motorcycle taxi pilots believe that electric taxis perform well in terms of speed, comfort, range, and reliability, they are more likely to adopt them. Similarly, pilots are more likely to select electric taxis if they offer better price value, such as cheaper fares, fuel savings, and cost reduction. A highly significant and positive relationship exists between price value and behavioral intention (β = 0.447; p-value = 0.000). These findings provide valuable insights for policymakers and manufacturers to enhance electric vehicle adoption by focusing on factors influencing users’ perceptions and intentions.
On the other hand, the availability and accessibility of charging stations do not significantly impact taxi pilots’ intentions to adopt EVs (β= −0.089; p-value= 0.211). This suggests that the current charging infrastructure may not be significant to electric taxi adoption, possibly due to the availability of alternative charging options. The effort expectancy of using electric taxis, such as booking or driving, does not significantly influence the BI of pilots (β = 0.086; p-value = 0.221), indicating that they may not perceive electric taxis as more challenging to use than conventional taxis. Satisfaction with incentive policies does not significantly influence BI (β = 0.019; p-value = 0.718), which suggests that incentive policies may not be strong enough to drive BI. Social influences like family or media do not significantly affect the intention to adopt electric taxis (β = 0.090; p-value = 0.208). Decisions are based on preferences rather than societal pressure, and social influence may impair BI.
The R-squared value, which is also known as the coefficient of determination, indicates the amount of variance in the construct that is explained by one or more predictor variables. As shown in Figure 2, the R-squared value of the structural model was 0.349. This indicates that the independent constructs used in the model, together, explain 34.9% variance in the explanatory variable BI.
In addition to the R2, we also examined the effect sizes in the structural model, f2. Effect size shows the relative effect of a particular independent construct on the dependent variable using mean changes in R2. According to Hair et al. [57], an effect size of less than 0.02 indicates a small effect, values higher than 0.15 indicate a moderate effect, and values above 0.35 indicate a large effect. The results of f2 are shown in Table 9. As per the results, it is found that Price Value has a moderate effect size, and the remaining five latent exogenous variables have a small effect on the endogenous variable BI.

5. Discussion, Managerial Implications, and Future Scope

5.1. Discussion

The results show that the extracted R2 values account for 34.90% of the BI of motorcycle taxi pilots to adopt EVs. The study evaluated the factors influencing motorcycle taxi pilots’ BI to adopt EVs. It indicates that the model effectively explains pilots’ adoption of electric taxis. The results identify the most essential antecedents: performance expectancy and price value, which are significant factors in adopting EVs. Findings indicate that the availability and accessibility of charging stations do not significantly impact taxi drivers’ adoption intentions (β = −0.089, p = 0.211). This aligns with research by [59], who suggested that professional riders might rely more on depot-based charging solutions, thereby reducing dependence on public charging networks. It is reasonable that taxi operators have access to dedicated charging facilities or have integrated charging routines into their operational schedules, mitigating concerns about infrastructure accessibility.
The non-significant influence of effort expectancy (β = −0.086, p = 0.221) suggests that pilots do not perceive EVs as more challenging to operate than conventional vehicles. This finding resounds with the work of [11] who found that perceived operational difficulties diminish as users become more familiar with EV technology. The increasing integration of user-friendly interfaces and supportive technologies in EVs may further alleviate concerns related to their operation.
A significant positive relationship was observed between performance expectancy and adoption intention (β = 0.160, p = 0.040), indicating that pilots are more inclined to adopt EVs if they believe these vehicles offer superior speed, comfort, range, and reliability performance. This corroborates findings by [24] emphasizing that performance perceptions are critical in shaping EV adoption decisions. Enhancing these performance attributes and effectively communicating them to potential adopters could thus serve as a strategic approach to promote adoption.
The most pronounced determinant identified was price value (β = 0.447, p = 0.000), underscoring the paramount importance of economic considerations. This is consistent with the study by [46], which highlighted cost savings as a primary motivator for EV adoption among commercial drivers. The potential for reduced operational costs, stemming from lower fuel and maintenance expenses, appears to be a compelling incentive for taxi drivers contemplating the switch to electric taxis.
Satisfaction with incentive policies did not significantly affect adoption intentions (β = −0.019, p = 0.718). This finding suggests that existing incentives may lack the necessary appeal or awareness to influence pilots’ behavior effectively. Previous research by [17] indicates that while incentives can play a role in adoption, their design and communication are crucial to their effectiveness. Policymakers may need to reevaluate current incentive structures to ensure they are attractive and well publicized among target demographics.
The lack of a significant relationship between social influence and adoption intention (β = −0.090, p = 0.208) implies that taxi drivers’ decisions are predominantly individualistic, with minimal impact from societal or familial pressures. This contrasts with findings in contexts of private vehicle adoption, where social factors often play a more substantial role [52]. The professional nature of taxi operations may lead drivers to prioritize pragmatic considerations over social influences.

5.2. Managerial Implications

The research findings have valuable implications for policymakers and EV manufacturers in motivating taxi pilots to adopt electric taxis. To increase adoption rates, policymakers should emphasize cost-effectiveness by ensuring competitive pricing and fare subsidies, enhancing public awareness, and revising and promoting government incentives to exchange old two-wheelers with new EVs, as well as subsidies on purchases, fast-charging station facilities, and improved maintenance service station facilities. These could make them more effective in influencing user behavior to adopt electric taxis. EV manufacturers should consider region-specific strategies such as home charging promotions, flexible financing models, and targeted advertising emphasizing cost-saving benefits, in-person interactions with riders, enhancing energy management technology, and reducing recharging time.

5.3. Future Scope

This study provides valuable insights into strategies to encourage pilots to adopt EVs; however, several areas permit further exploration. Future research could conduct a comparative analysis across different Indian states. It could further investigate the various government incentive programs for the sustained adoption of electric taxis across different demographic segments, such as rural and urban contexts, that inform more inclusive policy and marketing strategies. Additionally, further studies could explore the factors such as trust, habit, technological self-efficacy, cost-related factors, or external facilitating conditions influencing pilots’ acceptance of electric mobility solutions. A longitudinal design would allow researchers to track changes in customer behavior.

6. Conclusions

India is a major untouched EV market. This research presents a novel perspective on the adoption of EVs from the point of view of motorcycle taxi pilots. Several studies in the past have examined factors influencing EV adoption, but very few studies have presented results from a focused perspective. Examining these factors by targeting a specific section of a larger population helps to reveal specific policy incentives that can have high effectiveness. Further, the study applied the UTAUT2 model to investigate behavioral intention towards EVs in the context of Goa, India. The use of PLS-SEM provided robust insights into the relative influence of constructs. Key findings of the study indicate that charging infrastructure, effort expectancy, satisfaction with incentive policy, and social influence did not show a significant effect in this regional context. Moreover, the government should promote EVs among motorcycle taxi operators in Goa to facilitate a transition to EVs by 2030.

Author Contributions

Conceptualization, S.S. and D.K.; methodology, R.F.; software, S.K.; validation, S.G., R.F., and S.K.; formal analysis, S.K.; resources, R.F. and D.K.; data curation, D.K.; writing—original draft preparation, S.K.; writing—review and editing, S.S. and S.G.; supervision, S.S. All authors have read and agreed to the published version of the manuscript.

Funding

This research received no external funding.

Institutional Review Board Statement

The study was conducted in accordance with the Declaration of Helsinki, and approved by the Ethics Committee of Government College of Arts, Science and Commerce, Khandola, Marcela, Goa (protocol code GCASCK/RF/MCTP/CC-03 dated 2/5/2024).

Informed Consent Statement

Informed consent was obtained from all subjects involved in the study.

Data Availability Statement

The data can be made available by the authors on request.

Acknowledgments

The authors would like to thank all the respondents who answered our questionnaire.

Conflicts of Interest

The authors declare no conflicts of interest.

Abbreviations

The following abbreviations are used in this manuscript:
BIBehavioral Intention
CO2Carbon Dioxide
CICharging Infrastructure
EEEffort Expectancy
E2WElectric Two-Wheeler
EVsElectric Vehicles
GHGGreenhouse Gas
HTMTHeterotrait–Monotrait
ICEVInternal Combustion Engine Vehicle
PLS-SEMPartial Least Squares-Structural Equation Modeling
PEPerformance Expectancy
PVPrice Value
UTAUTUnified Theory of Acceptance and Use of Technology
UTAUT 2Unified Theory of Acceptance and Use of Technology 2
SIPSatisfaction with Incentive Policies
SISocial Influence

References

  1. Barman, P.; Dutta, L.; Bordoloi, S.; Kalita, A.; Buragohain, P.; Bharali, S.; Azzopardi, B. Renewable Energy Integration with Electric Vehicle Technology: A Review of the Existing Smart Charging Approaches; Elsevier: Amsterdam, The Netherlands, 2023. [Google Scholar] [CrossRef]
  2. Le, T.T.; Jabeen, F.; Santoro, G. What Drives Purchase Behavior for Electric Vehicles Among Millennials in an Emerging Market. J. Clean. Prod. 2023, 428, 139213. [Google Scholar] [CrossRef]
  3. Degirmenci, K.; Breitner, M.H. Consumer Purchase Intentions for Electric Vehicles: Is Green More Important Than Price and Range? Transp. Res. D Transp. Environ. 2017, 51, 250–260. [Google Scholar] [CrossRef]
  4. Verma, A.; Harsha, V.; Subramanian, G.H. Evolution of Urban Transportation Policies in India: A Review and Analysis. Transp. Dev. Econ. 2021, 7, 25. [Google Scholar] [CrossRef]
  5. Singh, A.R.; Vishnuram, P.; Alagarsamy, S.; Bajaj, M.; Blazek, V.; Damaj, I.; Rathore, R.S.; AI-Wesabi, F.N.; Othman, K.M. Electric Vehicle Charging Technologies, Infrastructure Expansion, Grid Integration Strategies, and Their Role in Promoting Sustainable E-Mobility. Alex. Eng. J. 2024, 105, 300–330. [Google Scholar] [CrossRef]
  6. Evans, J.; O’Brien, J.; Ng, B.C. Towards a Geography of Informal Transport: Mobility, Infrastructure and Urban Sustainability from the Back of A Motorbike. Trans. Inst. Br. Geogr. 2018, 43, 674–688. [Google Scholar] [CrossRef]
  7. Fan, J.; Meng, X.; Tian, J.; Xing, C.; Wang, C.; Wood, J. A Review of Transportation Carbon Emissions Research Using Bibliometric Analyses; KeAi Communications Co.: Beijing, China, 2023. [Google Scholar] [CrossRef]
  8. Michael, L.K.; Sriram, K.V.; Hungund, S.S.; Fernandes, M. Factors Influencing Adoption of Electric Vehicles—A Case in India. Cogent Eng. 2022, 9, 2085375. [Google Scholar] [CrossRef]
  9. Mirzabaev, A.; Kerr, R.B.; Haseqawa, T.; Pradhan, P.; Wreford, A.; Pahlen, M.C.T.; Smith, H.G. Severe Climate Change Risks to Food Security and Nutrition. Clim. Risk Manag. 2023, 39, 100473. [Google Scholar] [CrossRef]
  10. Khurana, A.; Kumar, V.V.R.; Sidhpuria, M. A Study on the Adoption of Electric Vehicles in India: The Mediating Role of Attitude. Vision 2020, 24, 23–34. [Google Scholar] [CrossRef]
  11. Wang, J.; Azam, W.; Scarcity, N.R. Fossil Fuel Energy Consumption, and Total Greenhouse Gas Emissions in Top Emitting Countries. Geosci. Front. 2024, 15, 101757. [Google Scholar] [CrossRef]
  12. Kumar, R.; Kanwal, A.; Asim, M.; Pervez, M.; Mujtaba, M.A.; Fouad, Y.; Kalam, M.A. Transforming the transportation sector: Mitigating greenhouse gas emissions through electric vehicles (EVs) and exploring sustainable pathways. AIP Adv. 2024, 14, 035320. [Google Scholar] [CrossRef]
  13. Hema, R.; Venkatarangan, M.J. Adoption of EV: Landscape of EV and Opportunities for India. Meas. Sens. 2022, 24, 100596. [Google Scholar] [CrossRef]
  14. Deb, N.; Singh, R.; Brooks, R.R.; Bai, K.; Barrero, F.; Kao, M.H. A Review of Extremely Fast Charging Stations for Electric Vehicles. Energies 2021, 14, 7566. [Google Scholar] [CrossRef]
  15. Jansson, J.; Pettersson, T.; Mannberg, A.; Brännlund, R.; Lindgren, U. Adoption of Alternative Fuel Vehicles: Influence from Neighbors, Family and Coworkers. Transp. Res. D Transp. Environ. 2017, 54, 61–73. [Google Scholar] [CrossRef]
  16. Adnan, N.; Nordin, S.M.; Bahruddin, M.A.B.; Ali, M. How Trust Can Drive Forward the User Acceptance to the Technology? In-Vehicle Technology for Autonomous Vehicle. Transp. Res. Part. A Policy Pract. 2018, 118, 819–836. [Google Scholar] [CrossRef]
  17. Bjerkan, K.Y.; Nørbech, T.E.; Nordtømme, M.E. Incentives for Promoting Battery Electric Vehicle (BEV) Adoption in Norway. Transp. Res. D Transp. Environ. 2016, 43, 169–180. [Google Scholar] [CrossRef]
  18. Yang, J.; Dong, J.; Hu, L. Design Government Incentive Schemes for Promoting Electric Taxis in China. Energy Policy 2018, 115, 1–11. [Google Scholar] [CrossRef]
  19. Hu, L.; Dong, J.; Lin, Z.; Yang, J. Analyzing Battery Electric Vehicle Feasibility from Taxi Travel Patterns: The Case Study of New York City, USA. Transp. Res. Part. C Emerg. Technol. 2018, 87, 91–104. [Google Scholar] [CrossRef]
  20. Palmer, K.; Tate, J.E.; Wadud, Z.; Nellthorp, J. Total Cost of Ownership and Market Share for Hybrid and Electric Vehicles in the UK, US and Japan. Appl. Energy 2018, 209, 108–119. [Google Scholar] [CrossRef]
  21. Hagman, J.; Langbroek, J.H.M. Conditions for electric vehicle taxi: A case study in the Greater Stockholm region. Int. J. Sustain. Transp. 2019, 13, 450–459. [Google Scholar] [CrossRef]
  22. Kim, J.; Lee, S.; Kim, K.S. A study on the activation plan of electric taxi in Seoul. J. Clean. Prod. 2017, 146, 83–93. [Google Scholar] [CrossRef]
  23. Bauer, G.S.; Greenblatt, J.B.; Gerke, B.F. Cost, Energy, and Environmental Impact of Automated Electric Taxi Fleets in Manhattan. Environ. Sci. Technol. 2018, 52, 4920–4928. [Google Scholar] [CrossRef] [PubMed]
  24. Zhou, M.; Long, P.; Kong, N.; Zhao, L.; Jia, F.; Campy, K.S. Characterizing the Motivational Mechanism Behind Taxi Driver’s Adoption of Electric Vehicles for Living: Insights from China. Transp. Res. Part. A Policy Pract. 2021, 144, 134–152. [Google Scholar] [CrossRef]
  25. Pawlak, J.; Sivakumar, A.; Ciputra, W.; Li, T. Feasibility of Transition to Electric Mobility for Two-Wheeler Taxis in Sub-Saharan Africa: A Case Study of Rural Kenya. Transp. Res. Rec. 2023, 2677, 359–370. [Google Scholar] [CrossRef]
  26. Tamis, M.; van den Hoed, R. Moving a taxi sector to become electric: Characterizing taxi drivers interested in purchasing a full electric vehicle. World Electr. Veh. J. 2020, 11, 20. [Google Scholar] [CrossRef]
  27. Xia, H. Public transport or E-bike taxis: The implication of everyday mobilities in contemporary China. Mobilities 2020, 15, 828–843. [Google Scholar] [CrossRef]
  28. Bunce, L.; Harris, M.; Burgess, M. Charge Up Then Charge Out? Drivers’ Perceptions and Experiences of Electric Vehicles in the UK. Transp. Res. Part. A Policy Pract. 2014, 59, 278–287. [Google Scholar] [CrossRef]
  29. Sintov, N.D.; Abou-Ghalioum, V.; White, L.V. The partisan politics of low-carbon transport: Why democrats are more likely to adopt electric vehicles than Republicans in the United States. Energy Res Soc Sci. 2020, 68, 101576. [Google Scholar] [CrossRef]
  30. Electric Vehicle, India Brand Equity Foundation 2025. Available online: www.ibef.org (accessed on 20 May 2025).
  31. Maitra, B.; Schlosser, A.; Sempf, F.; Doerr, M.; Chaudhari, P.; Shah, R.; Tibrewal, C.; Maheswari, R. Unlocking India’s Electric Mobility Potential, Comprehensive Report on the Future of EVs in India. 2022. Available online: https://www.adlittle.com/en/insights/report/unlocking-india%E2%80%99s-electric-mobility-potential (accessed on 20 April 2025).
  32. Clairand, J.M.; González-Rodríguez, M. What is the level of people’s acceptance for electric taxis and buses? Exploring citizens’ perceptions of transportation electrification to pay additional fees. World Electr. Veh. J. 2022, 13, 3. [Google Scholar] [CrossRef]
  33. Brückmann, G.; Willibald, F.; Blanco, V. Battery Electric Vehicle adoption in regions without strong policies. Transp. Res. D Transp. Environ. 2021, 90, 102615. [Google Scholar] [CrossRef]
  34. Noel, L.; de Rubens, G.Z.; Kester, J.; Sovacool, B.K. Understanding the socio-technical nexus of Nordic electric vehicle (EV) barriers: A qualitative discussion of range, price, charging and knowledge. Energy Policy 2020, 138, 111292. [Google Scholar] [CrossRef]
  35. Gaonkar, S.; Sukthankar, S.V. Measuring and evaluating the influence of cultural sustainability indicators on sustainable cultural tourism development: Scale development and validation. Heliyon 2025, 11, e42514. [Google Scholar] [CrossRef] [PubMed]
  36. Yan, Q.; Qin, G.; Zhang, M.; Xiao, B. Research on real purchasing behavior analysis of electric cars in beijing based on structural equation modeling and multinomial logit model. Sustainability 2019, 11, 5870. [Google Scholar] [CrossRef]
  37. Tu, J.C.; Yang, C. Key factors influencing consumers’ purchase of electric vehicles. Sustainability 2019, 11, 3863. [Google Scholar] [CrossRef]
  38. Langbroek, J.H.M.; Franklin, J.P.; Susilo, Y.O. The effect of policy incentives on electric vehicle adoption. Energy Policy 2016, 94, 94–103. [Google Scholar] [CrossRef]
  39. Venkatesh, V.; Davis, F.D. Theoretical extension of the Technology Acceptance Model: Four longitudinal field studies. Manag. Sci. 2000, 46, 186–204. [Google Scholar] [CrossRef]
  40. Venkatesh, V.; Morris, M.G.; Davis, G.B.; Davis, F.D. User Acceptance of Information Technology: Toward a unified view. MIS Q. 2003, 27, 425–478. [Google Scholar] [CrossRef]
  41. Ajzen, I.; Fishbein, M. Attitude-Behavior Relations: A Theoretical Analysis and Review of Empirical Research. Psychol. Bull. 1977, 84, 888–918. [Google Scholar] [CrossRef]
  42. Wu, Y.A.; Lau, Y.Y.; Wong, L.M.; Wu, J. A Preliminary Feasibility Study of Electric Taxi Promotion in Hong Kong—Behavior Modelling of Driving Patterns and Preferences. Appl. Sci. 2023, 13, 1491. [Google Scholar] [CrossRef]
  43. Ozaki, R.; Sevastyanova, K. Going hybrid: An analysis of consumer purchase motivations. Energy Policy 2011, 39, 2217–2227. [Google Scholar] [CrossRef]
  44. Sellmair, R.; Schelo, T. Analysis of the effect of charging infrastructure design on electric taxi driving profiles: A case study approach on the example of Singapore. Int. J. Sustain. Transp. 2019, 13, 479–496. [Google Scholar] [CrossRef]
  45. Venkatesh, V.; Thong, J.Y.L.; Xu, X. Consumer Acceptance and Use of Information Technology: Extending the Unified Theory of Acceptance and Use of Technology. MIS Q. 2012, 36, 157–178. [Google Scholar] [CrossRef]
  46. Scorrano, M.; Danielis, R.; Giansoldati, M. Mandating the use of the electric taxis: The case of Florence. Transp. Res. Part. A Policy Pract. 2020, 132, 402–414. [Google Scholar] [CrossRef]
  47. Alalwan, A.A.; Dwivedi, Y.K.; Rana, N.P. Factors influencing adoption of mobile banking by Jordanian bank customers: Extending UTAUT2 with trust. Int. J. Inf. Manag. 2017, 37, 99–110. [Google Scholar] [CrossRef]
  48. Sierzchula, W.; Bakker, S.; Maat, K.; Van Wee, B. The influence of financial incentives and other socio-economic factors on electric vehicle adoption. Energy Policy 2014, 68, 183–194. [Google Scholar] [CrossRef]
  49. Leurent, F.; Windisch, E. Triggering the development of electric mobility: A review of public policies. Eur. Transp. Res. Rev. 2011, 3, 221–235. [Google Scholar] [CrossRef]
  50. Gao, H.O.; Kitirattragarn, V. Taxi owners’ buying preferences of hybrid-electric vehicles and their implications for emissions in New York City. Transp. Res. Part. A Policy Pract. 2008, 42, 1064–1073. [Google Scholar] [CrossRef]
  51. Axsen, J.; Orlebar, C.; Skippon, S. Social influence and consumer preference formation for pro-environmental technology: The case of a U.K. workplace electric-vehicle study. Ecol. Econ. 2013, 95, 96–107. [Google Scholar] [CrossRef]
  52. Hardman, S.; Jenn, A.; Tal, G.; Axsen, J.; Beard, G.; Daina, N.; Figenbaum, E.; Jakobsson, N.; Jochem, P.; Kinnear, N.; et al. A review of consumer preferences of and interactions with electric vehicle charging infrastructure. Transp. Res. D Transp. Environ. 2018, 62, 508–523. [Google Scholar] [CrossRef]
  53. Wang, D.; Locment, F.; Sechilariu, M. Modelling, simulation, and management strategy of an electric vehicle charging station based on a DC microgrid. Appl. Sci. 2020, 10, 2053. [Google Scholar] [CrossRef]
  54. Bhattacharyya, S.S.; Thakre, S. Exploring the factors influencing electric vehicle adoption: An empirical investigation in the emerging economy context of India. Foresight 2020, 23, 311–326. [Google Scholar] [CrossRef]
  55. Rajagopal, D.; Sawant, V.; Bauer, G.S.; Phadke, A.A. Benefits of Electrifying App-Taxi Fleet—A Simulation on Trip Data from New Delhi. Transp. Res. D Transp. Environ. 2022, 102, 103113. [Google Scholar] [CrossRef]
  56. Henseler, J.; Ringle, C.M.; Sarstedt, M. A New Criterion for Assessing Discriminant Validity In Variance-Based Structural Equation Modeling. J. Acad. Mark. Sci. 2015, 43, 115–135. [Google Scholar] [CrossRef]
  57. Hair, J.F.; Risher, J.J.; Sarstedt, M.; Ringle, C.M. When to Use and How to Report the Results of PLS-SEM; Emerald Group Publishing Ltd.: Leeds, UK, 2019. [Google Scholar] [CrossRef]
  58. Fornell, C.; Larcker, D.F. Evaluating Structural Equation Models with Unobservable Variables and Measurement Error. J. Mark. Res. 1981, 18, 39–50. [Google Scholar] [CrossRef]
  59. Nicholas, M.; Hall, D. Lessons Learned on Early Electric Vehicle Fast-Charging Deployments. 2018. Available online: www.theicct.org (accessed on 2 April 2025).
Figure 1. Conceptual research model.
Wevj 16 00309 g001
Figure 2. Research model using smart PLS.
Wevj 16 00309 g002
Table 1. Constructs and statements used.
ConstructsMeaningStatementsSource
Behavioral
Intention (BI)
It refers to an individual’s
or organisation’s expressed interest
or plan to use a particular product, service, or technology.
BI 1: I intend to adopt an electric taxi.
BI 2: I plan to use an electric taxi whenever possible.
BI 3: I predict I will adopt an electric taxi.
BI 4: I will always try to adopt an electric taxi for passenger transportation
[2,10,40]
Charging
Infrastructure (CI)
Charging infrastructure relates to the adequacy of the city’s public charging infrastructure.CI 1: The charging facilities for electric taxis are sufficient.
CI 2: Maintenance facilities for electric taxis are sufficient.
CI 3: The parking lots with charging piles for electric taxis are sufficient.
[52,53,54]
Effort Expectancy (EE)It refers to the degree of ease
associated with using the system.
EE 1: Learning to drive an electric taxi will be easy for me.
EE 2: I find it will be easy to charge an electric taxi.
EE 3: My interaction with electric taxis is clear and understandable.
[38,40]
Performance
Expectancy (PE)
It refers to the effectiveness and benefits that could be gained with innovative applications, e.g.,
saving time and effort, improving efficiency, accessibility, and
convenience, and providing
customised services
PE 1: Electric taxis will be an efficient tool for my work.
PE 2: I can provide service with electric taxis.
PE 3: More passengers will favour my electric taxi service.
[19,40,45,54,55]
Price Value (PV)It is defined as the consumer’s
cognitive trade-off between the
perceived benefits and the cost of using various applications.
PV 1: The price of using an electric taxi is reasonable.
PV 2: Using an electric taxi is worth the money.
PV 3: Electric taxis have a high use value at current prices.
[17,37,38]
Satisfaction with Incentive Policies (SIP)It is defined as the degree to which people are satisfied with the
incentive policies for electric taxis.
SIP 1: I will be satisfied with the purchase subsidy policies for electric taxis.
SIP 2: I will be satisfied with the operation subsidy policies for electric taxis.
SIP 3: I will be satisfied with the information provision policies of electric taxis.
SIP 4: I will be satisfied with the facilitation policies of electric taxis.
[8,37,54]
Social Influence (SI)It refers to the degree to which
others believe the user should adopt the new system or technology.
SI 1: People who are important to me think I should use an electric taxi.
SI 2: Drivers using electric taxis will be considered environmentally friendly.
SI 3: Drivers around me consider it appropriate to use electric taxis.
[17,40,45]
Table 2. Sample size determination.
DistrictPlace of Registration OfficesNo. of Registered PilotsTarget SampleActual Data Collected
North GoaPanaji3896150
Bicholim1011617
Mapusa3395334
South GoaMargao80312680
Ponda2163441
Vasco2113320
Total2059324242
Table 3. Demographic profile of the respondents (N = 242).
Demographic Frequency%
EducationUp to Primary6024.80
Secondary16668.60
Higher Secondary166.60
Place of residenceNorth Goa10141.70
South Goa14158.30
Source of funds to purchase vehiclesOwn Savings7430.60
Help from Friends/Family145.80
Funds Under the Scheme249.90
Loan12953.30
Others10.40
Table 4. Descriptive statistics (N = 242).
MinimumMaximumMeanStandard Deviation
Age (Years)258052.4310.02
Number of dependent members in the family1104.201.53
Working experience (Years)15421.9311.98
Working hours per day3189.652.48
Daily income (INR)1501000563.84188.97
Table 5. Internal consistency reliability.
ConstructsVariable CodeVariance Inflation Factor
(VIF)
Factor LoadingCronbach’s AlphaComposite Reliability (CR)Average Variance Extracted (AVE)
Behavioral Intention (BI)BI 11.4850.7490.8770.8810.733
BI 22.9660.903
BI 32.9840.877
BI 43.3050.887
Charging Infrastructure (CI)CI 11.8950.8890.8390.8710.753
CI 22.0890.846
CI 31.9710.868
Effort Expectancy (EE)EE 11.7540.8750.8210.8420.734
EE 21.8560.829
EE 31.9260.866
Performance Expectancy (PE) PE 12.3940.9010.8690.8710.792
PE 22.3890.889
PE 32.1140.879
Price Value (PV) PV 11.8600.8680.8030.8260.717
PV 21.9710.890
PV 31.5440.779
Satisfaction with Incentive Policies (SIP)SIP 12.4270.8730.8810.9220.729
SIP 22.6840.851
SIP 32.6660.846
SIP 41.7550.846
Social Influence (SI) SI 12.4140.8870.8720.8760.795
SI 22.1930.892
SI 32.3680.896
Table 6. Showing Fornell–Larcker criterion.
BICIEEPEPVSIPSI
Behavioral Intention (BI)0.856
Charging Infrastructure (CI)0.2390.868
Effort Expectancy (EE)0.2700.6740.857
Performance Expectancy (PE)0.4340.4920.4510.890
Price Value (PV)0.5570.3770.3490.5160.847
Satisfaction with Incentive Policies (SIP)0.2490.4460.4000.4360.3810.854
Social Influence (SI)0.3630.3380.2480.6140.4200.3500.892
Table 7. Heterotrait–monotrait (HTMT) ratio.
BICIEEPEPVSIPSI
Behavioral Intention (BI)
Charging Infrastructure (CI)0.270
Effort Expectancy (EE)0.3120.815
Performance Expectancy (PE)0.4940.5700.534
Price Value (PV)0.6520.4560.4300.627
Satisfaction with Incentive Policies (SIP)0.2640.5120.4680.4820.428
Social Influence (SI)0.4110.3930.2900.7050.5120.378
Table 8. Path coefficient analysis.
Relationshipsβ T-Statistics p-ValuesInference
H1: Charging Infrastructure -> Behavioral Intention−0.0891.2510.211Unsupported
H2: Effort Expectancy-> Behavioral Intention0.0861.2240.221Unsupported
H3: Performance Expectancy -> Behavioral Intention 0.1602.0560.040Supported
H4: Price Value-> Behavioral Intention0.4475.0300.000Supported
H5: Satisfaction with Incentive Policies -> Behavioral Intention−0.0190.3620.718Unsupported
H6: Social Influence -> Behavioral Intention0.0901.2600.208Unsupported
Table 9. Showing f2 values and effect sizes.
R-SquaredEffect Size (f2)Rating
Behavioral Intention:
Charging Infrastructure0.006Small
Effort Expectancy0.006Small
Performance Expectancy0.018Small
Price Value0.208Moderate
Satisfaction with Incentive Policies0.000Small
Social Influence0.008Small
Disclaimer/Publisher’s Note: The statements, opinions and data contained in all publications are solely those of the individual author(s) and contributor(s) and not of MDPI and/or the editor(s). MDPI and/or the editor(s) disclaim responsibility for any injury to people or property resulting from any ideas, methods, instructions or products referred to in the content.

