Article

Attention-Based LiDAR–Camera Fusion for 3D Object Detection in Autonomous Driving

1
School of Mechanical and Automotive Engineering, Shanghai University of Engineering Science, Shanghai 201600, China
2
Shanghai Yuetuo Electronic Technology Co., Ltd., Shanghai 201306, China
*
Author to whom correspondence should be addressed.
World Electr. Veh. J. 2025, 16(6), 306; https://doi.org/10.3390/wevj16060306
Submission received: 9 April 2025 / Revised: 20 May 2025 / Accepted: 27 May 2025 / Published: 29 May 2025
(This article belongs to the Special Issue Electric Vehicle Autonomous Driving Based on Image Recognition)

Abstract

:
In multi-vehicle traffic scenarios, achieving accurate environmental perception and motion trajectory tracking through LiDAR–camera fusion is critical for downstream vehicle planning and control tasks. To address the challenges of cross-modal feature interaction in LiDAR–image fusion and the low recognition efficiency/positioning accuracy of traffic participants in dense traffic flows, this study proposes an attention-based 3D object detection network integrating point cloud and image features. The algorithm adaptively fuses LiDAR geometric features and camera semantic features through channel-wise attention weighting, enhancing multi-modal feature representation by dynamically prioritizing informative channels. A center point detection architecture is further employed to regress 3D bounding boxes in bird’s-eye-view space, effectively resolving orientation ambiguities caused by sparse point distributions. Experimental validation on the nuScenes dataset demonstrates the model’s robustness in complex scenarios, achieving a mean Average Precision (mAP) of 64.5% and a 12.2% improvement over baseline methods. Real-vehicle deployment further confirms the fusion module’s effectiveness in enhancing detection stability under dynamic traffic conditions.

1. Introduction

Autonomous vehicles have emerged as transformative elements in modern transportation systems, achieving significant technological advancements in autonomous navigation. Contemporary systems integrate multi-sensor perception frameworks with hierarchical planning architectures and decision-making algorithms, demonstrating operational reliability comparable to human drivers. These developments substantially improve road safety while optimizing traffic efficiency through enhanced vehicular coordination. Within autonomous perception systems, 3D object detection in dynamic environments remains a critical research challenge. Current solutions require robust multi-sensor fusion frameworks to enable the precise real-time localization of surrounding objects, including their 3D dimensions, spatial coordinates, and motion patterns. These perceptual data form the foundation for collision avoidance systems and adaptive motion control, ensuring safe navigation in mixed traffic scenarios involving vehicles, cyclists, and pedestrians.
This study addresses the critical challenge of 3D vehicle detection in low-speed urban environments, particularly focusing on residential complexes and parking infrastructure. These operational domains present unique perception requirements characterized by: (1) heterogeneous road-user coexistence (encompassing pedestrians, cyclists, and micro-mobility vehicles) and (2) constrained vehicular dynamics with typical velocities below 25 km/h. Modern perception systems increasingly adopt heterogeneous sensor suites integrating monocular vision sensors with LiDAR modules to overcome modality-specific limitations. While RGB cameras deliver dense semantic encoding and high spatial resolution, they face inherent limitations in metric depth estimation due to projective geometry constraints. Conversely, LiDAR systems provide precise 3D spatial measurements but suffer from angular sparsity and lack photometric information. These complementary sensing characteristics [1,2,3] justify the implementation of multimodal fusion frameworks where (a) visual texture features mitigate LiDAR’s limited scene descriptiveness, particularly for distant/low-reflectivity targets, while (b) LiDAR-derived point clouds resolve camera-based depth ambiguity through explicit 3D coordinate registration. The synergistic combination of these modalities enables a more robust environmental perception, forming the methodological foundation for our 3D vehicle detection framework in complex traffic scenarios.
Recent advancements in LiDAR–camera fusion frameworks, exemplified by BEVFusion [2], demonstrate improved environmental perception through unified bird’s-eye-view (BEV) representations that align multi-sensor data. This approach addresses the critical limitations of individual sensors: it compensates for LiDAR’s vulnerability to signal interference in precipitation, fog, and other adverse meteorological conditions that typically induce spurious detections and missed objects while concurrently mitigating monocular cameras’ persistent challenges in depth perception accuracy. The synergistic sensor fusion consequently expands operational detection ranges for distant targets compared to single-modality systems. Emerging architectures like SparseFusionn [4] further enhance this paradigm through optimized fusion modules that maintain detection accuracy while reducing computational overhead. These developments underscore the critical importance of advancing camera–LiDAR fusion methodologies for robust 3D semantic scene understanding.
Modern sensor fusion approaches are broadly classified into three categories: data-level, feature-level, and decision-level fusion. Data-level fusion operates directly on raw sensor outputs, combining information at the pixel or point level. PointPainting [5] is a representative example that enhances LiDAR point clouds by projecting semantically labeled image features onto 3D coordinates prior to detection processing. MVX-Net [6] extends this concept through dual fusion pathways: PointFusion combines sparse point-wise features, while VoxelFusion integrates structured volumetric representations, effectively merging visual textures with spatial geometry. Recent innovations like ROBBEV [7] introduce deformable attention mechanisms to mitigate cross-modal interference, while BAFusion [8] achieves modality alignment through flexible feature matching without rigid geometric constraints. However, these methods primarily combine sensor outputs through post-processing stages, potentially neglecting inherent semantic relationships between modalities [1,9].
Feature-level fusion integrates multi-modal data within shared feature spaces, requiring complex processing to align heterogeneous features across modalities and scales [10,11]. Contemporary approaches typically leverage multi-view projections for cross-modal integration. The foundational MV3D framework [12] established a paradigm using pixelated point cloud features to generate 3D proposals, which are then projected onto LiDAR front-view and image planes for region-based feature fusion. While enabling 3D detection box regression, this target-centric approach incurs geometric information loss during spatial feature extraction. Diverging from MV3D’s approach, AVOD [13] adopts bird’s-eye-view (BEV) representations combining encoded image and point cloud data as unified network inputs, achieving simultaneous 3D detection, classification, and box regression through early fusion. More recent approaches have made significant contributions to this field. For instance, in CL-fusionBEV [14], the authors introduced a multi-modal cross-attention mechanism and a BEV self-attention mechanism that significantly enhanced feature interaction and integration. Similarly, MLF3D [15] proposed a multi-modal 3D object detection method based on multi-level fusion. MLF3D combines the strengths of data-level and feature-level fusion by generating virtual point clouds for data-level fusion and utilizing VIConv3D and ASFA for feature-level fusion. The cross-modality detection framework [16] introduces a hybrid fusion architecture combining feature-level interactions with joint 2D–3D proposal optimization. Compared to data-level fusion, these feature-level strategies maintain detection accuracy with improved computational efficiency, though partial information degradation persists due to incomplete cross-modal integration.
Decision-level fusion strategies optimize detection outputs through post-processing, as exemplified by CLOCs’ [17] two-stage refinement architecture. This framework first obtains independent 2D (camera) and 3D (LiDAR) detection results and then performs cross-modal verification through geometric consistency checks for bounding box alignment and false positive suppression. While theoretically sound, practical implementation encounters critical limitations, including non-differentiable post-processing stages and computational latency bottlenecks in real-time applications. These inherent constraints have significantly restricted the paradigm’s research progression and industrial adoption.
While existing fusion strategies demonstrate improved detection capabilities, their performance remains inferior to LiDAR-centric approaches. This performance gap arises from separate feature extraction pipelines for point clouds and images, which fail to maintain geometric consistency across modalities and limit generalization. To overcome these limitations, we present an attention-driven 3D detection framework with two core innovations:
  • Leveraging downsampled point cloud key points to guide the projection of image features onto corresponding point cloud representations, thereby minimizing geometric information loss during feature mapping and enabling efficient cross-modal alignment.
  • Harnessing the adaptive weighting capacity of the Squeeze-and-Excitation Network’s (SENet) channel-wise attention mechanism to generate discriminative multimodal feature maps with enhanced representational power. The fused features are subsequently processed through a center-based detection network to regress precise 3D bounding box parameters.
The structure of this paper is as follows: Section 2 describes the proposed methodology in detail, where LiDAR point clouds and image features are fused to generate detection feature maps. A novel two-stage framework combining a central point detection network is developed to regress 3D bounding boxes, enabling the precise localization of both static and dynamic vehicles in traffic scenarios. Section 3 evaluates the performance of the model on the nuScenes open dataset and performs a comprehensive validation using standard metrics, including precision, recall, and comparison with baseline models. Real-world validation further demonstrates deployment feasibility on autonomous platforms. Finally, Section 4 presents the conclusions and discusses potential research directions.

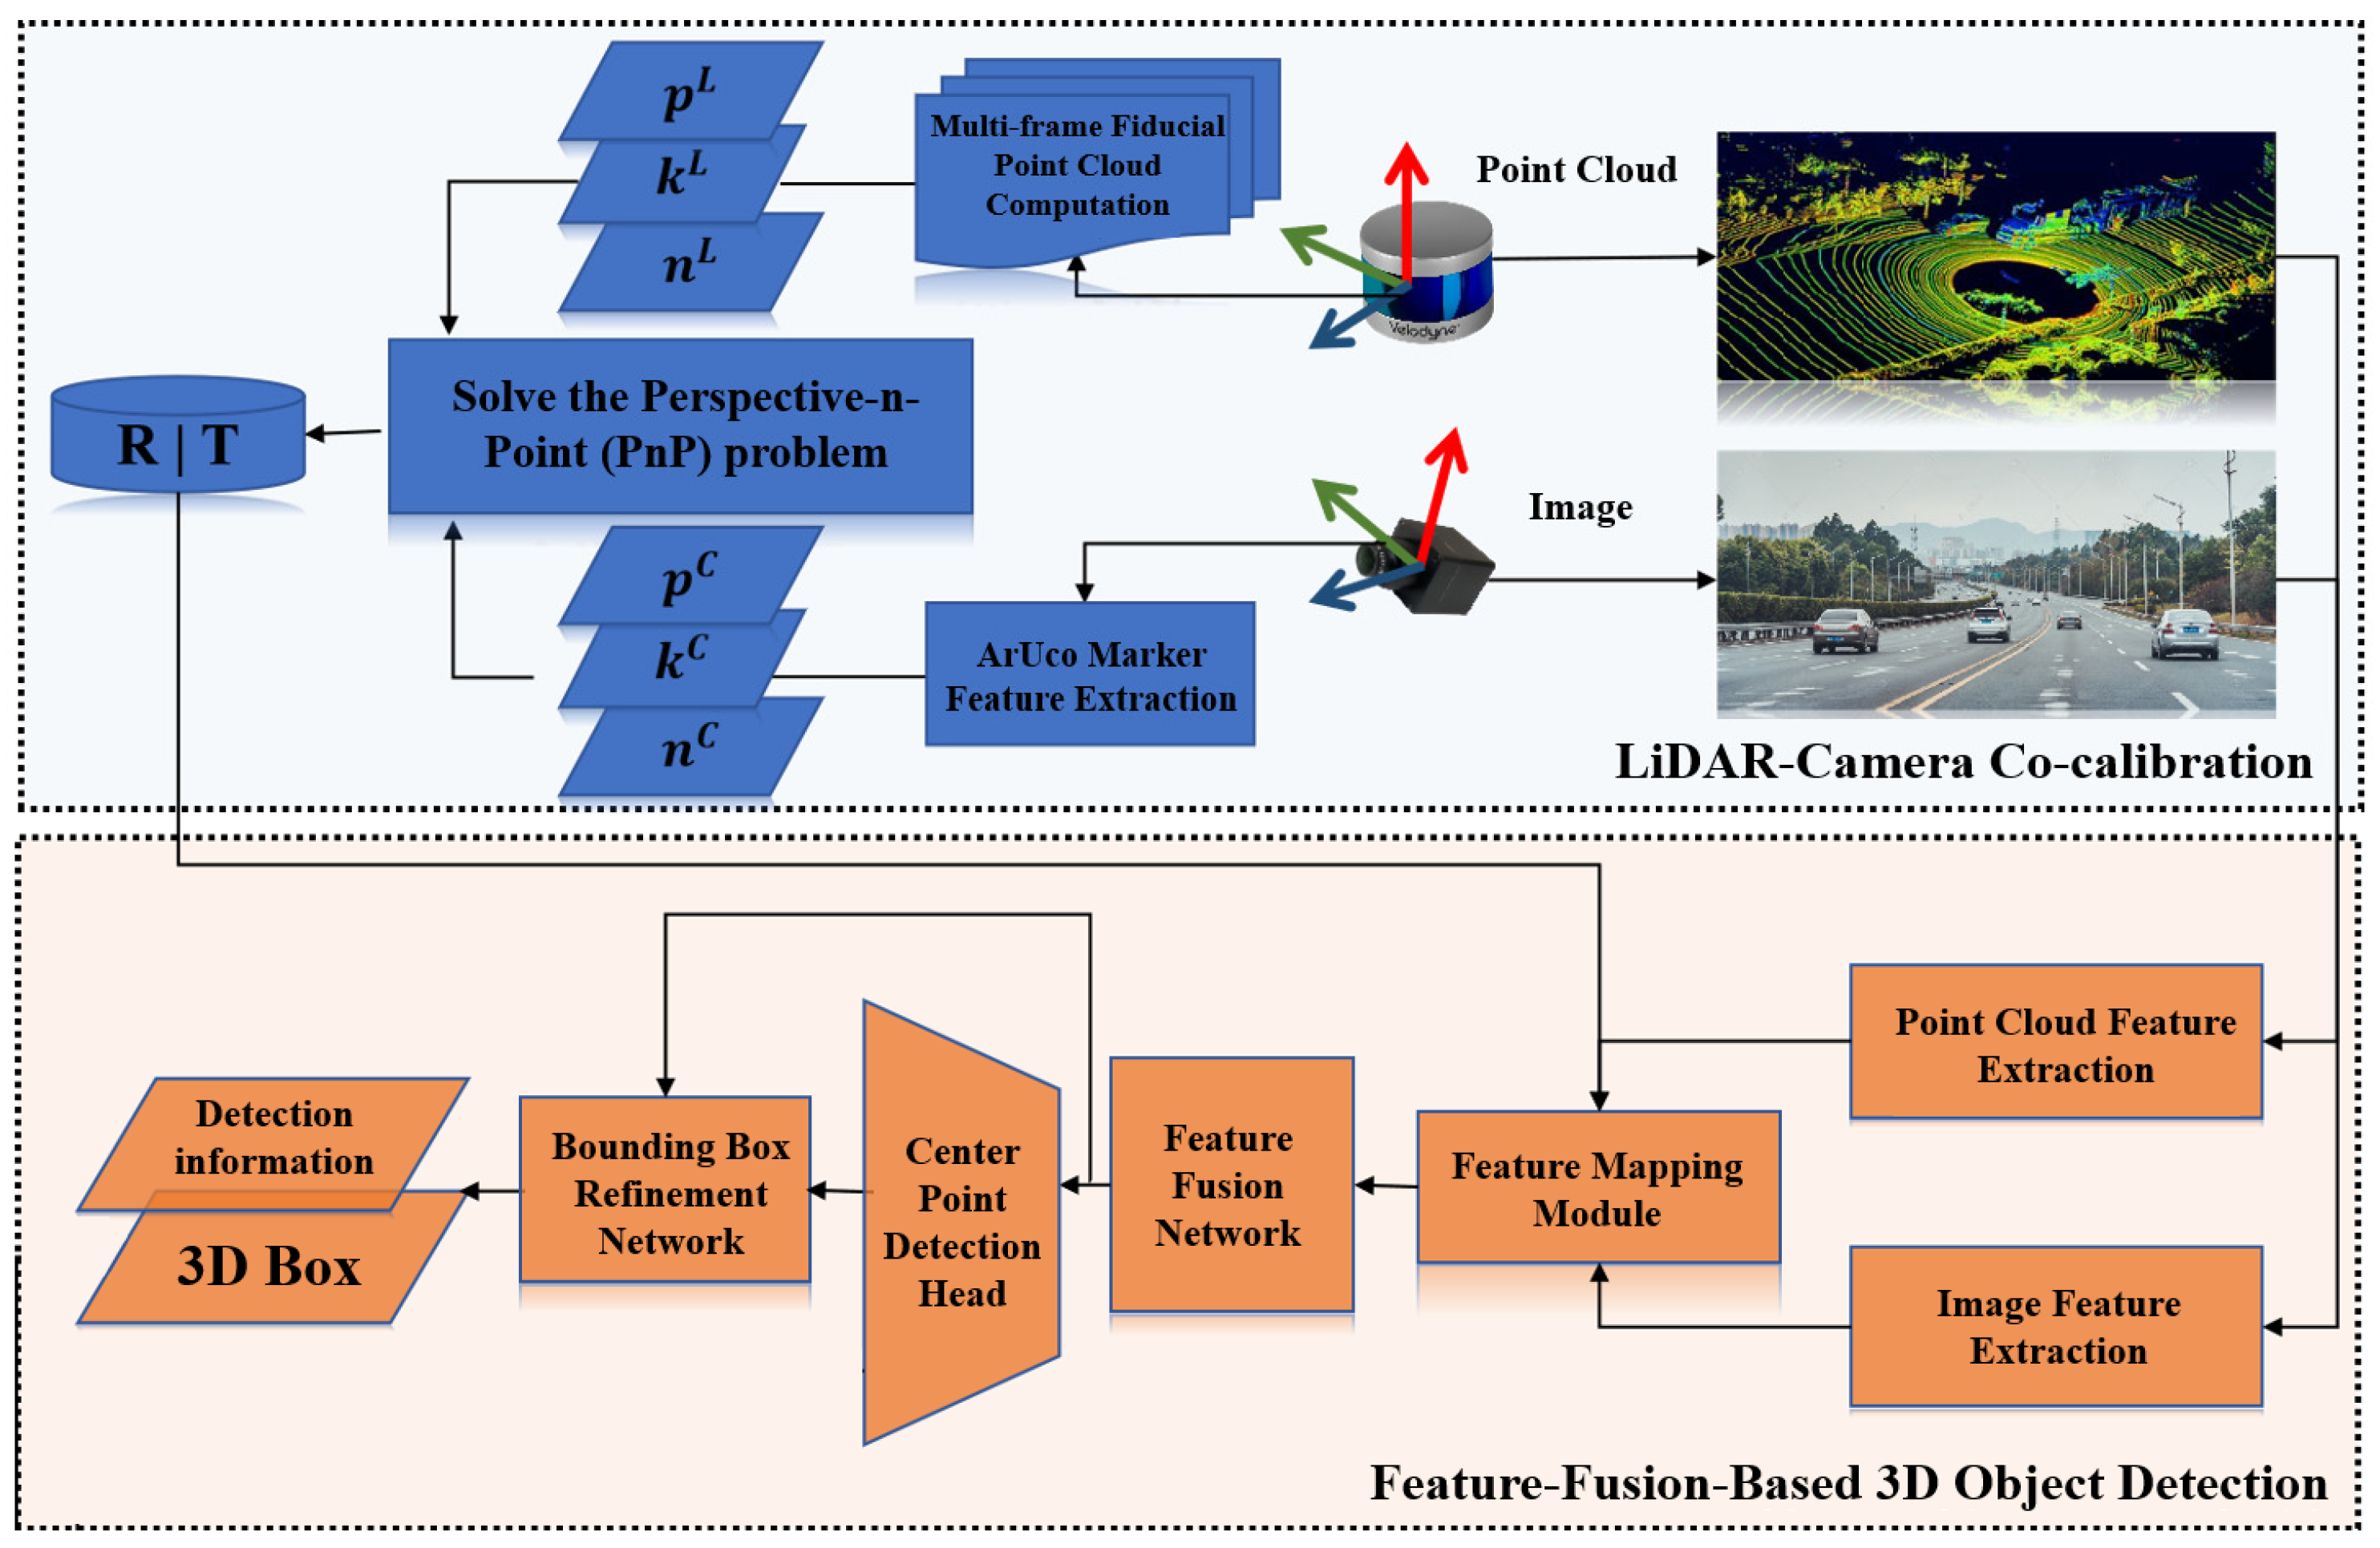
2. Materials and Methods

In the development of 3D object detection systems leveraging multi-sensor fusion, RGB cameras and LiDAR sensors demonstrate complementary characteristics. While visual data deliver rich semantic context through color and texture information, LiDAR point clouds provide precise geometric measurements with sparse spatial distribution. The fundamental challenge resides in establishing effective cross-modal feature interactions between these structurally divergent data representations, particularly when processing grid-structured point cloud features alongside convolutional image features, to improve detection robustness in complex traffic environments. Current fusion methodologies frequently convert point clouds into pseudo-image representations for alignment with 2D visual features. However, this projection-based approach inevitably induces geometric information loss during modality translation and fails to preserve critical spatial-semantic relationships between sensors. Furthermore, most existing frameworks employ anchor-based detection heads, whose parameter optimization becomes increasingly challenging due to rotational ambiguity and dimensional expansion in 3D space [18].
Figure 1 presents the architectural workflow of our proposed 3D object detection framework. This study employs standard square planar boards and ArUco markers as calibration targets to establish feature point correspondences between sparse point cloud domains and their corresponding camera image features. Through constrained optimization of geometric relationships (point-to-point, line-to-line, and plane-to-plane correspondences), we derive the optimal rigid transformation matrix governing LiDAR–camera extrinsic parameters. The proposed network architecture subsequently utilizes downsampled point cloud key points to guide the projection of image features onto corresponding point cloud representations, enabling efficient and accurate cross-modal feature alignment. By leveraging channel-wise attention mechanisms to adaptively reweight feature channels during fusion, the network generates discriminative multimodal feature maps with enhanced representational capacity. These fused features are processed through a center-based detection network to regress precise 3D bounding box parameters, including centroid coordinates, dimensions, and orientation angles.

2.1. Design of Feature Fusion Center Point Detection Network Based on Attention Mechanism

The proposed architecture comprises three core components: (1) a feature extraction and interaction layer, (2) a center point detection layer, and (3) an output refinement layer (as illustrated in Figure 2). The feature extraction stage processes synchronized LiDAR point clouds and camera images through dedicated backbone networks. Subsequent feature alignment via bilinear interpolation and attention-based fusion generates enhanced detection feature maps. The detection head then predicts 3D target heat maps through center point localization, simultaneously regressing object types, dimensions, and orientation. Finally, a multilayer perceptron (MLP) network refines the bounding box predictions for improved detection accuracy.
Suppose that the original point cloud input is denoted P k = x n k , y n k , z n k , n = 1 , 2 , , N , where x n k , y n k , z n k is the coordinate position of the three-dimensional space of the point cloud, and N is the total number of all contained point clouds in the set. The original image input is denoted as I = u m , v n , m = 1 , 2 , , W , n = 1 , 2 , , H . In the 3D target detection task, all the real targets, y i = T i , b i , i = 1 , 2 , , M , in the scene are located and classified, and T i and b i represent the categories and detection boxes of the targets respectively. The three-dimensional detection box adopts the representation method of the bottom center point coordinates, three-dimensional size, and orientation angle, so b i = x i , y i , z i , w i , l i , h i , θ i , where x i , y i , z i represents the center point coordinates corresponding to the i detection object; l i , w i , h i represents the length, width, and height corresponding to the i detection object; and θ i represents the orientation angle corresponding to the first detection object. I denotes the original image input. P represents the LiDAR point cloud input. For point clouds, n iterates over individual 3D points (1 ≤ n N ). For images, m and n index pixel coordinates along the width ( W ) and height ( H ) dimensions.

2.2. Multi-Sensor Data Feature Fusion Module

(1)
The original data encoding is aligned with the feature
To fully obtain the geometric information of the point cloud and the color information of the image in the data, this paper designs a corresponding backbone network for the original input image, I = I 1 , I 2 , , I n , and point cloud, P = P 1 , P 2 , , P m , for feature extraction. For the point cloud, the backbone network maps the features to the bird’s-eye-view (BEV) layer, generating a point cloud feature map. In terms of image processing, the image backbone network is based on a modified ResNet-18 [19] architecture with three key adaptations. First, the initial processing adheres strictly to the standard ResNet-18 configuration: a 7 × 7 convolutional layer (stride 2, padding 3) with 64 output channels, followed by batch normalization (BN), ReLU activation, and 3 × 3 max pooling (stride 2), leveraging the original parameter loading mechanism to maintain compatibility with pre-trained models. Second, in the first basic block of Stage 3, the skip connection employs a 1 × 1 convolutional layer (stride 2, 128 → 256 channels) with pre-trained weights, while the main path consists of sequential operations: 3 × 3 convolution (128 → 256, stride 2) → BN → ReLU → 3 × 3 convolution (256 → 256) → BN. This design ensures dimensional consistency for residual addition, preserving the benefits of the residual learning framework. Third, a progressive reduction module is introduced, which applies a 3 × 3 convolution, (256 → 192) → BN → ReLU, followed by a 1 × 1 convolution, (192 → 128) → BN → LeakyReLU (slope 0.1). This module is designed to reduce the number of feature channels while retaining critical information, with the LeakyReLU slope set to 0.1 to mitigate the dying ReLU problem and enhance training stability. The resulting 128 × 14 × 14 feature map, F I , is then upsampled to 56 × 56 through two transpose convolutional layers (kernel 4 × 4, stride 2, padding 1), with BN and ReLU applied after each layer, ensuring spatial resolution consistency between image and point cloud features for subsequent fusion and analysis.
The extraction of the point cloud feature, F p , is completed by the PointNet++ [20] module. The module connects multiple Set Abstraction (SA) modules to extract features, with each SA module consisting of a sampling layer, a point grouping layer, and a PointNet module [21]. The existing random sampling method has difficulty obtaining the global information of the point cloud; therefore, to extract the key points of the original point set more effectively, in this paper, the sampling layer uses 3D FPS, 3D Euclidean distance–furthest point sampling [21], to subsample the input point cloud, k , of frame P k , and N ^ points are obtained as the key points of the point cloud. The experimental results show that the 3D FPS layer has better coverage than the random sampling layer. In addition, because point clouds are densely distributed near and sparsely distributed far away, using the same spherical radius will result in too few points grouped far away. To solve this problem, this paper adopts multi-scale grouping to extract key points, as shown in Figure 3. For the same centroid point, the radius of different scales is set to generate local regions, and a PointNet module with different parameters is used for feature extraction in each region. For each key point, the spherical radius, r, is scaled proportionally to its distance from the LiDAR origin:
r = α x 2 + y 2 + z 2  
where α is a learnable scaling factor initialized to 0.1. Distant regions thus adopt larger radii to aggregate sufficient contextual information, while nearby regions use smaller radii to avoid over-sampling. Finally, the features extracted from each region are connected as the final output features, and the PointNet module codes the local regions as feature vectors. The input is a point set of N ^ × K × ( d + C ) , and the final point cloud outputs features of N ^ × ( d + C ) .
The inherent perspective discrepancy between camera and LiDAR sensors creates geometric ambiguities during 2D-to-3D feature projection, where a single image pixel maps to multiple potential 3D coordinates (injective mapping relationship). This geometric uncertainty, combined with potential misalignment between projected image coordinates and native LiDAR point cloud positions, necessitates explicit cross-modal feature reconciliation. The specific principle is shown in Figure 4. The module extracts the maximum height, minimum height, and intermediate height of the key points after downsampling according to the set grid as the feature mapping points of the grid. Downsampled LiDAR key points are projected onto the image plane using calibrated extrinsic parameters. Each 3D point is transformed into 2D image coordinates, u , v , through perspective projection. For the region where the key points match the image after projection, the three image features corresponding to the point cloud key points in the region are obtained, and the three features are connected as the image features of the region. Finally, the point cloud feature, F b e v , based on the key point mapping is obtained.
Considering that the value of the key points projected into the image is not necessarily an integer, the model needs to perform linear interpolation on the value. Let the projection point of the image be u , v , and the corresponding features of the pixels, u 1 , v 1 , u 1 , v 2 , u 2 , v 2 , u 1 , v 2 , on the adjacent feature map be F 11 , F 12 , F 22 , F 21 , respectively. The specific formula is derived as follows by linear interpolation [22]:
F b e v = i = 1 2 j = 1 2 F i j | u u i v v j | u 2 u v 2 v      
where F b e v is the image BEV feature corresponding to the key points in the point cloud coordinate system; u i and v j are the horizontal and vertical coordinates of the adjacent pixels of the image pixel corresponding to the key points, respectively; and F i j is the eigenvalue corresponding to adjacent pixel points.
(2)
Feature fusion module based on attention mechanism
In the fusion of point clouds and images, if only the image data are extracted, this process is easily affected by the external environment, such as changes in illumination. If only point cloud data are extracted, the distribution characteristics of near-dense and distant point clouds will lead to the loss of features of distant objects. Therefore, to make more effective use of the key features, the SE (Squeeze-and-Excitation) module [23] in the attention mechanism is introduced. It pays more attention to the relationship between different feature channels. By adjusting the weights of each type of feature, the importance of the features of different channels can be learned automatically. It can better adapt to the fusion requirements of the current aligned BEV feature, F b e v , and point cloud feature, F p . Secondly, its computational complexity is lower than other attention mechanisms, and it is more suitable for migration in various network structures. The SE module consists of two modules: feature extrusion and excitation. Firstly, each channel of the original feature is an AvgPool (Average Pool) to obtain n features. Then, the feature is stimulated and input to the network composed of a Fully Connected layer, a ReLU layer, another Fully Connected layer, and a Sigmoid layer, and the weight of each datum is obtained and multiplied by the original feature. Finally, the adjusted feature is obtained. Figure 5 shows the process description of the SE module.
To make the features of different modes make up for each other’s defects, higher weights are automatically assigned to important features, and lower weights are assigned to unimportant features through training so that feature data can be used efficiently. In this paper, a fusion method based on feature splicing is introduced, and an attention mechanism is introduced. First, the SE module is used to adjust image feature F I and mapped BEV feature F b e v and then splice them together as fusion features. Finally, the fusion feature, F F u s i o n , obtained can be described as follows, where C O N C A T ( · ) represents the step of feature splicing, and f s e · indicates the steps of the SE module.
F F u s i o n = C O N C A T { f s e [ F I ] ,   f s e [ F b e v ] }
x m i n + i Δ x , x m i n + i + 1 Δ x × y m i n + j Δ y , y m i n + j + 1 Δ y × z r a n g e

2.3. Design of Object Detection Network Based on the Central Point

Traditional anchor-based detection frameworks face inherent limitations in 3D object detection, particularly when handling arbitrarily oriented targets in three-dimensional space. The requirement to enumerate all possible orientations for anchor boxes leads to exponential growth in parameter space, while axis-aligned detection paradigms struggle with rotational ambiguity. Therefore, this paper adopts the target detection head based on the center point in the vehicle target detection task; converts the target detection problem into the prediction problem of the target center point; and uses the target center point as the expression formula of the target to predict the central position, target size, and direction of the vehicle target in the top view. The following will further elaborate on the target central point detection network input, output, and training details. The vehicle target detection head based on the center point takes the given fusion feature, F F u s i o n , as the feature input and predicts the target center point with two prediction branches, which are heat map prediction branches. The predicted central heat map, Y ^ ϵ   0 ,   1 W R × H R × K , in the K-dimension corresponds to K categories. Regression branches are used to return data to other target properties, including dimensions and orientation angles.
Before network training, the pre-processing needs to generate a Gaussian circular thermal map of the center point of the truth-valued target to represent the position and confidence of the center point of the truth-valued target, which is used to calculate the loss compared with the output of the network in subsequent training, to update the parameters. The process mainly includes the following:
(1)
Based on the set size and resolution, the center point of the truth-valued target frame in the three-dimensional space is scaled to correspond to the coordinates of the thermal map, and the low-resolution coordinate corresponding to the truth-valued coordinates of the target center point of K categories is calculated as p ~ ;
(2)
We calculate the radius of the Gaussian circle for each center point, as shown in Equation (5), where the width and height of the thermal map, p ~ x and p ~ y , respectively, are the coordinates of the center point after scaling, and σ p is the standard deviation of the adaptive target size.
Y x y c = e x p ( ( x p ~ x ) 2 + ( x p ~ y ) 2 2 σ p 2 )
(3)
We can draw a Y x y c Gaussian circle with the center point as the center and A as the radius. If the Gaussian circles of the same category overlap, the maximum value of the overlapping part is taken as the value there.
In addition, the processing method, similar to that in the image detection network of CenterNet [24], is applied to object detection in three-dimensional space, and sparse supervisory signals are generated so that most positions are considered the background. To offset this, this paper increases the positive supervision of the target heat map by expanding the Gaussian peak rendered in the center of each ground reality object so that the Gaussian radius of the center point heat map is adaptively computed based on the target size:
σ = m a x ( f w l , τ )
where f is the radius function defined in CornerNet. A minimum radius of τ = 2 is enforced to ensure supervision for small objects. In the actual network detection process, to improve the detection accuracy and refine the boundary box output of the network in the first stage, this paper uses the idea of CenterPoint to design the boundary box thinning network and also maps the center point of the boundary box and the midpoint of the four sides to the fused feature map as the feature of the target. The feature dimension is superimposed as the input of the boundary frame thinning network, and the position, and angle deviation of the boundary frame are returned through the MLP layer.

3. Results

3.1. Experiment Preparation

The experimental setup utilized an Intel® Xeon® E5-2630 v3 CPU (Intel Corporation, Santa Clara, CA, USA) with 16 GB RAM and an NVIDIA GeForce RTX 3060 Ti GPU (NVIDIAl Corporation, Santa Clara, CA, USA). We employed the Adam optimizer with a weight decay of 0.01, setting the initial learning rate to 0.001 and batch size to 8. A step learning rate scheduler was implemented for learning rate adjustment. All network parameters were randomly initialized using PyTorch 1.8.1’s default settings.
In this section, the nuScenes dataset [25] is employed to comprehensively evaluate the proposed algorithm’s performance across multiple dimensions. This benchmark dataset was collected using a specially equipped vehicle featuring (1) a 32-beam mechanical LiDAR with a 360° horizontal FOV (field of view) mounted on the roof and (2) six monocular cameras arranged in a panoramic configuration (front, rear, and left/right sides). The dataset contains 1000 annotated driving scenes, each comprising 20 s sequences with synchronized multi-sensor data.
Compared with KITTI, another automatic driving dataset, the nuScenes dataset has more comprehensive scenes, more reasonable evaluation criteria, and more extensive application in the testing of multi-sensor fusion algorithms. The point cloud and image projection visualization of part of the sample dataset are shown in Figure 6. In this paper, 32-line radar data and camera images are used as data sources to train and verify the model. In this paper, a point cloud with an axis range of [−51.2 m, 51.2 m], an axis range of [−51.2 m, 51.2 m], a Z-axis range of [−5 m, 3 m], and the images of six monocular cameras are selected as the network input dataset.

3.2. Evaluation Criteria and Loss Function for 3D Object Detection

The loss function primarily quantifies the deviation between model predictions and ground truth values while guiding optimization directions. To address sample imbalance challenges (including positive/negative sample ratios and hard examples), we employed Gaussian Focal Loss for heat map prediction in the vehicle target detection branch, with target dimensions, 3D positional offsets, and orientation angles supervised using L1 loss.
For class-independent confidence score prediction, this paper uses the intersection ratio between the prediction bounding box and the corresponding truth bounding box as a guide and uses the binary cross-entropy loss function for training [18]:
I = m i n ( 1 , m a x ( 0 ,   2 × I o U t 0.5 ) ) L s c o r e = I t log I ^ t ( 1 I t ) l o g ( 1 I ^ t )
where I t is the intersection ratio, I , between the t-th prediction boundary box and the true value boundary box, and its specific calculation formula is Formula (8); I ^ t is the confidence of the second-stage network prediction.
The total loss function of the final network is [24]
L t o t a l = λ s i z e L s i z e + λ o f f s e t L o f f s e t + λ h e a d i n g L h e a d i n g + L s c o r e
L o f f s e t = 1 N p O ^ p ~ p R p ~
L s i z e = 1 N k = 1 N S ^ p k s k
where L o f f s e t is the position offset loss function; L s i z e is the loss function of size prediction; L h e a d i n g is the loss function of orientation angle prediction; and L s c o r e is the loss function of confidence prediction. We denote the bias term in the backbone network’s output layer as O ^ R W R × H R × 2 , where p ~ = p R , p R p ~ represents the learnable bias parameter. S ^ R W R × H R × 2 denotes the final network output.
The evaluation framework employs the mean Average Precision (mAP) as the primary metric for benchmarking 3D object detection performance across multiple algorithms. The mAP metric represents the arithmetic mean of the Average Precision (AP) values across all object categories, serving as a robust indicator of the model’s detection consistency and cross-category generalization capability. Higher mAP scores correlate with superior balance between recall rates and positional accuracy across diverse object types, reflecting enhanced overall detection performance. In addition, the AP threshold matching here is not calculated using IoU but using 2D center distance on the ground plane to decouple the influence of object size and orientation on AP calculation.

3.3. Recognition Algorithm Comparison Experiment

To evaluate the detection performance of the proposed model, including real-time performance and accuracy, multiple baseline models are used for training in the same experimental environment as the algorithm in this section. These baseline models consist of MV3D [12], 3D-CVF [26], CenterPoint [18], PointPillars [27], mmFUSION [28], FB-BEV [29], BEVFormerv2 [30], and PolarBEVDet [31]. CenterPoint and PointPillars are 3D target detection models based on point clouds. CenterPoint designs a two-stage target detection model of central point detection based on point cloud data. PointPillars transform the point cloud into 2D pseudo-images for detection on 2D images to improve the overall detection performance. MV3D, 3D-CVF, and mmFUSION belong to the detection model of point cloud and image feature fusion. MV3D maps the point cloud and image data to three dimensions for fusion, namely, the top view of the point cloud, the front view of the point cloud, and the image data, to obtain more accurate positioning and detection results. 3D-CVF fuses the generated dense RGB voxel features with point cloud data to achieve fusion detection. mmFUSION integrates multi-scale LiDAR voxel features with camera-derived semantic features through adaptive attention mechanisms. FB-BEV, BEVFormerv2, and PolarBEVDet all belong to visual detection models. FB-BEV constructs a bird’s-eye-view (BEV) representation directly from multi-camera images. By utilizing a depth estimation network and a temporal fusion module. BEVFormerv2 employs a transformer-based architecture to model spatial relationships in BEV space. PolarBEVDet introduces polar parameterization to enhance BEV feature encoding, especially for radially distributed traffic targets. The 3D target detection performance of the above algorithms is compared based on the nuScenes dataset, and the final results are shown in Table 1.
According to the aforementioned test results, the model proposed in this paper has achieved a certain degree of improvement in the evaluated performance indicators. Compared to the CenterPoint network, which also employs CenterPoint detection, our algorithm demonstrates a significant increase of 1.1 in NDS, more reflective of detecting target orientation attributes, and a notable rise of 3.1 in the mAP value. This indicates that the early alignment and fusion of point cloud and image data in actual traffic scenarios are effectively performed. This further demonstrates that our model effectively captures richer data features, resulting in enhanced orientation regression and dimensional optimization during subsequent processing stages. The table data reveal that the detection networks based on LiDAR and camera fusion generally exhibit lower detection indices compared to 3D target detection networks that solely utilize point clouds. For instance, the mAP value of MV3D is only 54.6, significantly lower than that of CenterPoint. However, the detection network in this paper, which is based on attention mechanism fusion, surpasses the data of CenterPoint and PointPillars in most vehicle detection mAP values and final detection metrics (mAP and NDS). This demonstrates the superiority of the proposed algorithm over conventional feature fusion 3D detection networks. When benchmarked against mmFUSION, the mAP of the proposed model increases by 0.3. This suggests that our attention mechanism fusion method better integrates multi-scale LiDAR voxel features and camera-derived semantic features, thereby enhancing the model’s discriminative ability. However, the NDS is 5.9 lower, which is because mmFUSION adopts a dual mechanism of cross-attention and multi-modal attention to achieve pixel-level fine-grained feature interaction. Compared to the channel attention based on the SE module, the attention mechanism of mmFUSION can better dynamically learn the weight distribution in the spatial dimension, aligning LiDAR geometric features and image semantic features more accurately, albeit with a higher parameter amount. In comparison to FB-BEV, our model achieves a higher mAP value of 10.8 and a higher NDS of 1.3. This demonstrates that our fusion strategy is more effective in constructing bird’s-eye-view (BEV) representations from multi-camera images and better captures spatial relationships in BEV space. From Table 1, it can be observed that our proposed model outperforms other visual detection models in various performance metrics. Compared to BEVFormerv2, our model attains a higher mAP value of 8.9 and a higher NDS of 0.3. This shows that our fusion method better captures spatial relationships in BEV space, leveraging the transformer-based architecture more effectively. Furthermore, when contrasted with PolarBEVDet, our model achieves a higher mAP of 8.7 and a higher NDS of 0.2. This indicates that our approach to BEV feature encoding is more advantageous, especially for radially distributed traffic targets. The effective mapping alignment between image features and point cloud features in the proposed fusion module reduces the loss of key feature information during the fusion process. Additionally, the integration of an attention mechanism facilitates the prioritized weighting of discriminative feature channels within the cross-modal fusion space, thereby enhancing the model’s object recognition accuracy through adaptive feature recalibration.
To further verify the effectiveness of the attention-mechanism-based feature fusion module and the influence of different feature fusion methods on the fusion 3D target detection, the module in this paper is trained and tested on the same dataset with comparison methods A and B, where comparison method A is set to directly splice the original 2D features with the mapped 3D features. Comparison method B is set to concatenate the original features and then adjust the weight of each channel of features through the SE module. Comparison method C means to add the SE module adjustment weight based on the concatenated features of the SE module. Figure 7 shows the specific network structure of each comparison method.
Finally, the mAP and NDS accuracy of different fusion methods on the nuScenes verification set is shown in Figure 8. By observing the indicators of different methods, as shown in Figure 8, it can be seen that the detection index of the network with feature addition is much lower than that of the network with the attention module, which indicates the effectiveness of the attention module for point cloud and image feature fusion. However, in method B, the method combining two features and then adjusting the channel weight has a lower final detection index than the method using the SE module separately, although the fusion process can be completed faster in the technique using the SE module after concatenation and requires fewer computing resources and less time. However, this approach may lead to the loss of key features in the fusion process; by using the SE module to adjust the weight of image features and point cloud features, the advantages of the SE module can be better utilized, the importance of the channel can be effectively learned, and the loss of key features in the fusion process can be reduced. The change in detection accuracy and the final results show that the proposed method is superior to other types of combination forms and that the network can finally detect in different scenes with better detection performance. To sum up, the algorithm presented in this paper shows excellent performance in different categories of vehicle detection and has significantly improved multi-modal data fusion and detection indicators, providing valuable implications for vehicle detection in actual autonomous driving scenarios.

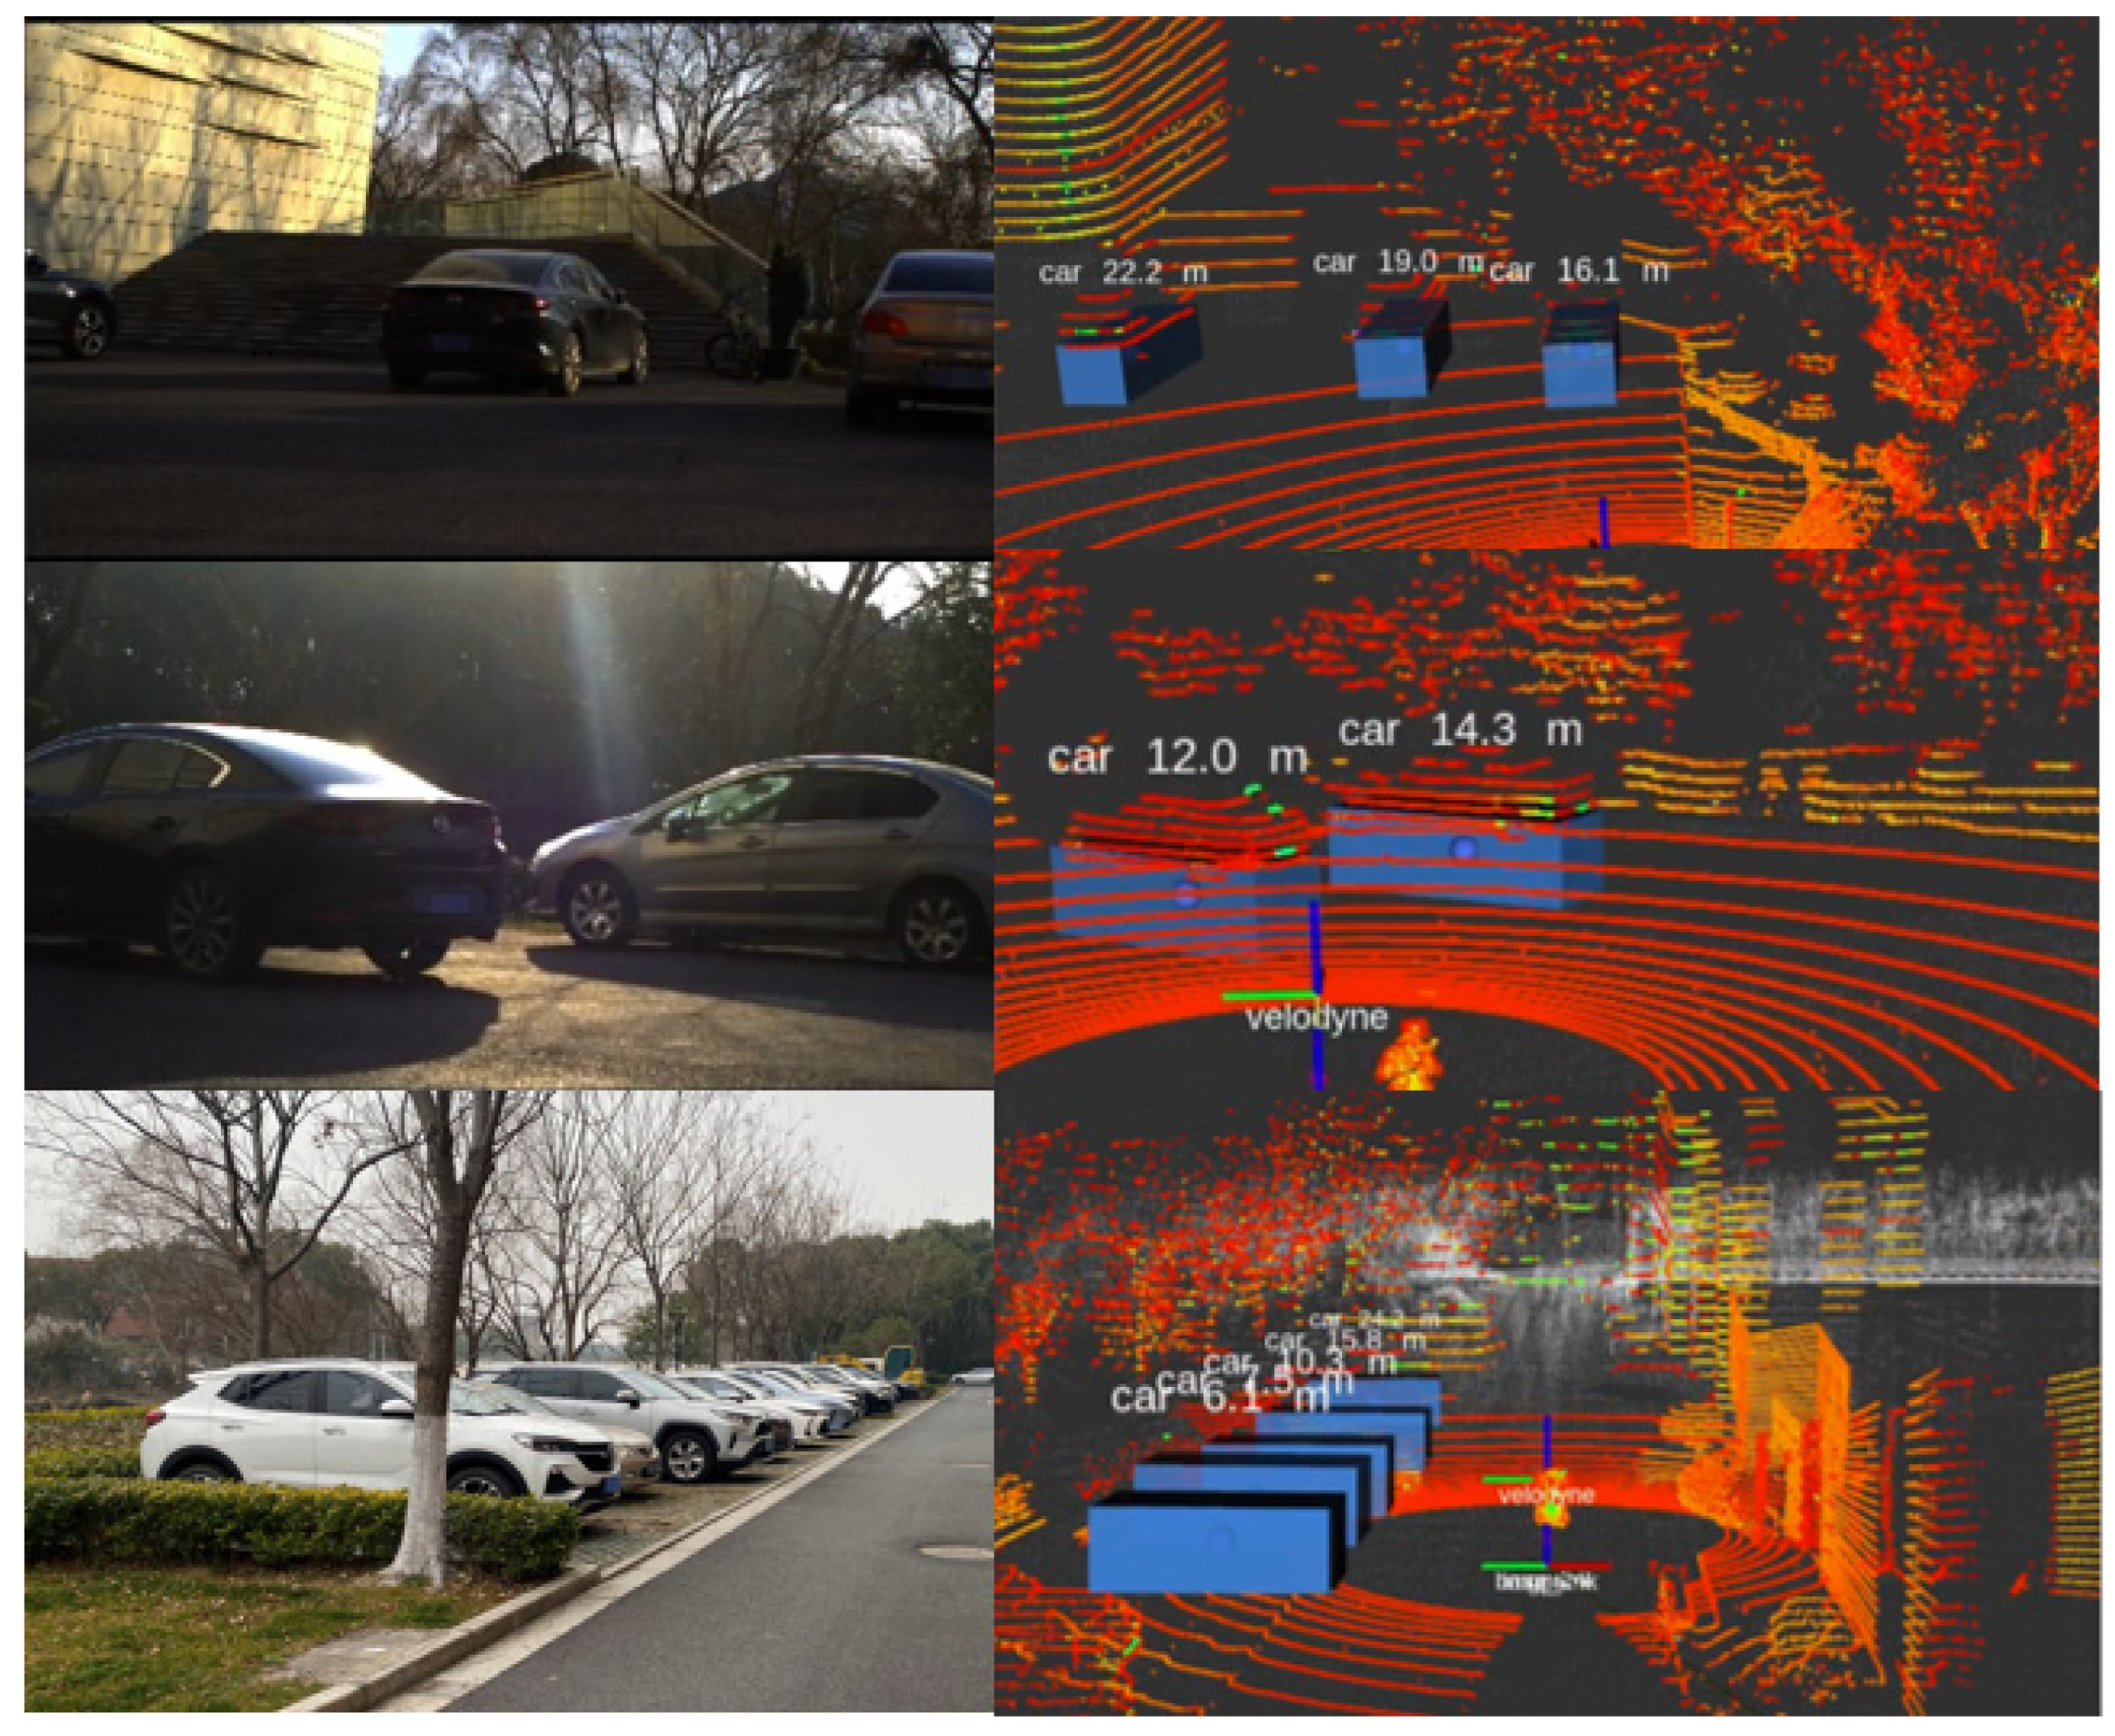
3.4. Analysis of Visual Results of the Recognition Algorithm

This section presents a qualitative evaluation of detection outcomes using the nuScenes dataset through representative scenario visualization. The typical scene samples in the detection results of three vehicle targets based on this algorithm are shown here, which are samples (a) to (c) in Figure 9. The upper and lower parts of each sample are the front view of the image and the corresponding original point cloud, where the white point represents the distribution of the point cloud, the orange box is the true value of vehicle target detection, and the yellow box is the model detection result.
From the visual detection boxes of each sample, we can see that the detection results from our algorithm closely match the actual size and orientation of the targets. For the data frame of scene (Figure 9a), in which multiple vehicles are interacting in front and left of the self-contained vehicle, the number of true values of vehicles in the scene is four, and the images of some vehicles in the data image are truncated; it is difficult to achieve effective detection with a detection algorithm only using images, but the 3D detection achieved by sensor fusion in this paper can complete the detection of most vehicles in a scene. This indicates that the sensor fusion method effectively overcomes the detection difficulties caused by image occlusion. However, the algorithm fails to detect the farthest vehicle in sample (Figure 9a), mainly because its distance leads to sparse LiDAR points and fewer pixels in the camera image, which makes it difficult to detect. (Figure 9b) The scene vehicle in the sample has irregular spatial rotation, and the detection frame of the algorithm can still accurately return the object frame of the vehicle. (Figure 9c) In the scene in this sample, the number of vehicles is larger, there is interference such as trees in the scene, and the mutual occlusion between vehicles in the image is more serious. In the final detection result, the algorithm can also achieve effective detection, reflecting its good generalization ability in different scenes. By comparing the scenes in Figure 9a–c, it can be seen that the algorithm proposed in this paper can realize effective detection in a variety of scenarios and has high accuracy and stability when dealing with the influence of factors such as occlusion and distance.
To verify the algorithm’s real-world effectiveness, tests were conducted on campus road data. Figure 10 presents the target detection results from the fusion of camera and LiDAR data. The algorithm can accurately recognize the category and distance of detected objects in various positions. In a partially occluded scene, the algorithm’s interface shows the detected vehicle’s point cloud and 3D detection box with category and distance information. This indicates that the algorithm can correctly detect and fuse camera and LiDAR data.
To further evaluate the real-world performance of our algorithm in autonomous driving test platforms, we deployed it in real-time on the ROS (Robot Operating System) platform. All sensor data were published at standard vehicular acquisition rates: the camera, equipped with a SONY IMX264 sensor (Sony Corporation, Tokyo, Japan) and a 6 mm focal length, operated at 25 Hz, while the LiDAR (RoboSense RS-Helios 32-line mechanical rotating LiDAR) emitted point clouds at 10 Hz. Following the joint calibration of the LiDAR and camera, the ROS message_filters module was employed to achieve the software-based synchronization of multi-sensor data reception timestamps. This ensured an up-to-date environmental perception of the test platform. The temporal performance data from the operational pipeline were visualized as a time-series curve (Figure 11), with the horizontal axis denoting the frame sequence and the vertical axis representing processing time. The proposed method maintained stable inference times, averaging 147 ms per frame, with only occasional higher latencies. Importantly, no cumulative time drift occurred during prolonged operation, indicating temporal stability. This inference speed meets the real-time requirements for vehicle detection in low-to-medium-speed campus road scenarios.

4. Discussion and Outlook

This study presents an attention-enhanced LiDAR–camera fusion framework for robust 3D object detection in autonomous driving scenarios. The principal advancements and empirical findings are threefold:
  • Our architecture achieves the adaptive recalibration of LiDAR geometric and camera semantic features by implementing Squeeze-and-Excitation channel attention mechanisms. Quantitative ablation studies (Figure 8) demonstrate this approach outperforms conventional concatenation fusion by 12.2% mAP. The proposed method effectively resolves the geometric inconsistency between sparse point clouds and high-resolution images, enabling precise alignment of multi-modal representations.
  • Through center-based regression in BEV space, our model achieves state-of-the-art performance using the nuScenes benchmark with 64.5% mAP and 63.7 NDS, surpassing LiDAR-only CenterPoint by 3.1% mAP.
  • Real-world testing on autonomous platforms (RoboSense RS-Helios LiDAR [RoboSense, Shenzhen, China] and SONY IMX264 cameras [Sony Corporation, Tokyo, Japan]) shows that the system runs at an average inference speed of 147 ms/frame (Figure 11).
However, there are still several research challenges to be resolved. This study mainly explores collaborative perception using LiDAR and camera sensors. Future research could integrate more vehicle sensors, like millimeter-wave radar, inertial measurement units (IMUs), and infrared cameras, to gather richer environmental data. This multimodal sensor fusion method may improve the accuracy and robustness of perception in various autonomous driving scenarios. In addition, our validation experiments were only conducted under optimal illumination conditions. Challenges such as rain-induced radar noise, low-light image degradation, and the impact of adverse weather on sensor performance have not been thoroughly studied. Future work should assess the algorithm’s resilience under different meteorological conditions by collecting weather-specific datasets and using domain adaptation techniques. Furthermore, future research will apply this framework to detect pedestrians, cyclists, and non-motorized vehicles, using the same fusion principles to broaden its applicability.

Author Contributions

Conceptualization, Z.W. and X.H.; methodology, Z.W.; software, Z.W.; validation, Z.H.; investigation, Z.H.; resources, Z.W. and Z.H.; data curation, Z.W. and Z.H.; writing—original draft preparation, Z.W.; writing—review and editing, Z.W.; visualization, Z.W.; supervision, Z.W. and X.H.; project administration, X.H.; funding acquisition, X.H. All authors have read and agreed to the published version of the manuscript.

Funding

This research received no external funding.

Data Availability Statement

The original contributions presented in this study are included in the article. Further inquiries can be directed to the first author.

Conflicts of Interest

Author Zhihao Hu was employed by the company Shanghai Yuetuo Electronic Technology Co., Ltd. The remaining authors declare that this research was conducted in the absence of any commercial or financial relationships that could be construed as a potential conflict of interest.

Abbreviations

BEVBird’s-eye view
ROIRegion of interest
mAPMean Average Precision
NDSnuScenes Detection Score
ReLURectified Linear Unit
SESqueeze-and-Excitation

References

  1. Shi, S.; Guo, C.; Jiang, L.; Wang, Z.; Shi, J.; Wang, X.; Li, H. Pv-rcnn: Point-voxel feature set abstraction for 3D object detection. In Proceedings of the IEEE/CVF Conference on Computer Vision and Pattern Recognition, Seattle, WA, USA, 13–19 June 2020; pp. 10529–10538. [Google Scholar]
  2. Liu, Z.; Tang, H.; Amini, A.; Yang, X.; Mao, H.; Rus, D.L.; Han, S. Bevfusion: Multi-task multi-sensor fusion with unified bird’s-eye view representation. In Proceedings of the 2023 IEEE International Conference on Robotics and Automation (ICRA), London, UK, 29 May–2 June 2023; pp. 2774–2781. [Google Scholar]
  3. Li, Y.; Yu, A.W.; Meng, T.; Caine, B.; Ngiam, J.; Peng, D.; Shen, J.; Lu, Y.; Zhou, D.; Le, Q.V. Deepfusion: Lidar-camera deep fusion for multi-modal 3D object detection. In Proceedings of the IEEE/CVF Conference on Computer Vision and Pattern Recognition, New Orleans, LA, USA, 18–24 June 2022; pp. 17182–17191. [Google Scholar]
  4. Xie, Y.; Xu, C.; Rakotosaona, M.-J.; Rim, P.; Tombari, F.; Keutzer, K.; Tomizuka, M.; Zhan, W. Sparsefusion: Fusing multi-modal sparse representations for multi-sensor 3D object detection. In Proceedings of the IEEE/CVF International Conference on Computer Vision, Paris, France, 1–6 October 2023; pp. 17591–17602. [Google Scholar]
  5. Vora, S.; Lang, A.H.; Helou, B.; Beijbom, O. Pointpainting: Sequential fusion for 3D object detection. In Proceedings of the IEEE/CVF Conference on Computer Vision and Pattern Recognition, Seattle, WA, USA, 13–19 June 2020; pp. 4604–4612. [Google Scholar]
  6. Sindagi, V.A.; Zhou, Y.; Tuzel, O. Mvx-net: Multimodal voxelnet for 3D object detection. In Proceedings of the 2019 International Conference on Robotics and Automation (ICRA), Montreal, QC, Canada, 20–24 May 2019; pp. 7276–7282. [Google Scholar]
  7. Wang, J.; Li, F.; An, Y.; Zhang, X.; Sun, H. Towards Robust LiDAR-Camera Fusion in BEV Space via Mutual Deformable Attention and Temporal Aggregation. IEEE Trans. Circuits Syst. Video Technol. 2024, 34, 5753–5764. [Google Scholar] [CrossRef]
  8. Liu, M.; Jia, Y.; Lyu, Y.; Dong, Q.; Yang, Y. BAFusion: Bidirectional Attention Fusion for 3D Object Detection Based on LiDAR and Camera. Sensors 2024, 24, 4718. [Google Scholar] [CrossRef]
  9. Huang, K.; Shi, B.; Li, X.; Li, X.; Huang, S.; Li, Y. Multi-modal sensor fusion for auto driving perception: A survey. arXiv 2022, arXiv:2202.02703. [Google Scholar]
  10. Pandey, G.; McBride, J.R.; Savarese, S.; Eustice, R.M. Automatic Extrinsic Calibration of Vision and Lidar by Maximizing Mutual Information. J. Field Robot. 2014, 32, 696–722. [Google Scholar] [CrossRef]
  11. Guan, T.; Wang, J.; Lan, S.; Chandra, R.; Wu, Z.; Davis, L.; Manocha, D. M3detr: Multi-representation, multi-scale, mutual-relation 3D object detection with transformers. In Proceedings of the IEEE/CVF Winter Conference on Applications of Computer Vision, Waikoloa, HI, USA, 3–8 January 2022; pp. 772–782. [Google Scholar]
  12. Chen, X.; Ma, H.; Wan, J.; Li, B.; Xia, T. Multi-view 3D object detection network for autonomous driving. In Proceedings of the IEEE Conference on Computer Vision and Pattern Recognition, Honolulu, HI, USA, 21–26 July 2017; pp. 1907–1915. [Google Scholar]
  13. Ku, J.; Mozifian, M.; Lee, J.; Harakeh, A.; Waslander, S.L. Joint 3D proposal generation and object detection from view aggregation. In Proceedings of the 2018 IEEE/RSJ International Conference on Intelligent Robots and Systems (IROS), Madrid, Spain, 1–5 October 2018; pp. 1–8. [Google Scholar]
  14. Shi, P.; Liu, Z.; Dong, X.; Yang, A. CL-fusionBEV: 3D object detection method with camera-LiDAR fusion in Bird’s Eye View. Complex Intell. Syst. 2024, 10, 7681–7696. [Google Scholar] [CrossRef]
  15. Jiang, H.; Wang, J.; Xiao, J.; Zhao, Y.; Chen, W.; Ren, Y.; Yu, H. MLF3D: Multi-Level Fusion for Multi-Modal 3D Object Detection. In Proceedings of the 2024 IEEE Intelligent Vehicles Symposium (IV), Jeju Island, Republic of Korea, 2–5 June 2024; pp. 1588–1593. [Google Scholar]
  16. Zhu, M.; Ma, C.; Ji, P.; Yang, X. Cross-modality 3D object detection. In Proceedings of the IEEE/CVF Winter Conference on Applications of Computer Vision, Waikoloa, HI, USA, 3–8 January 2021; pp. 3772–3781. [Google Scholar]
  17. Pang, S.; Morris, D.; Radha, H. CLOCs: Camera-LiDAR object candidates fusion for 3D object detection. In Proceedings of the 2020 IEEE/RSJ International Conference on Intelligent Robots and Systems (IROS), Las Vegas, NV, USA, 24 October 2020–24 January 2021; pp. 10386–10393. [Google Scholar]
  18. Yin, T.; Zhou, X.; Krahenbuhl, P. Center-based 3D object detection and tracking. In Proceedings of the IEEE/CVF Conference on Computer Vision and Pattern Recognition, Nashville, TN, USA, 20–25 June 2021; pp. 11784–11793. [Google Scholar]
  19. Bae, W.; Yoo, J.; Chul Ye, J. Beyond deep residual learning for image restoration: Persistent homology-guided manifold simplification. In Proceedings of the IEEE Conference on Computer Vision and Pattern Recognition Workshops, Honolulu, HI, USA, 21–26 July 2017; pp. 145–153. [Google Scholar]
  20. Qi, C.R.; Yi, L.; Su, H.; Guibas, L.J. Pointnet++: Deep hierarchical feature learning on point sets in a metric space. In Proceedings of the 31st Conference on Neural Information Processing Systems (NIPS 2017), Long Beach, CA, USA, 4–9 December 2017. [Google Scholar]
  21. Qi, C.R.; Su, H.; Mo, K.; Guibas, L.J. Pointnet: Deep learning on point sets for 3D classification and segmentation. In Proceedings of the IEEE Conference on Computer Vision and Pattern Recognition, Honolulu, HI, USA, 21–26 July 2017; pp. 652–660. [Google Scholar]
  22. Huang, T.; Liu, Z.; Chen, X.; Bai, X. Epnet: Enhancing point features with image semantics for 3D object detection. In Proceedings of the Computer Vision–ECCV 2020: 16th European Conference, Glasgow, UK, 23–28 August 2020; pp. 35–52. [Google Scholar]
  23. Liang, M.; Yang, B.; Chen, Y.; Hu, R.; Urtasun, R. Multi-task multi-sensor fusion for 3D object detection. In Proceedings of the IEEE/CVF Conference on Computer Vision and Pattern Recognition, Long Beach, CA, USA, 15–20 June 2019; pp. 7345–7353. [Google Scholar]
  24. Zhou, X.; Wang, D.; Krähenbühl, P. Objects as points. arXiv 2019, arXiv:1904.07850. [Google Scholar]
  25. Caesar, H.; Bankiti, V.; Lang, A.H.; Vora, S.; Liong, V.E.; Xu, Q.; Krishnan, A.; Pan, Y.; Baldan, G.; Beijbom, O. nuscenes: A multimodal dataset for autonomous driving. In Proceedings of the IEEE/CVF Conference on Computer Vision and Pattern Recognition, Seattle, WA, USA, 13–19 June 2020; pp. 11621–11631. [Google Scholar]
  26. Yoo, J.H.; Kim, Y.; Kim, J.; Choi, J.W. 3d-cvf: Generating joint camera and lidar features using cross-view spatial feature fusion for 3D object detection. In Proceedings of the Computer vision–ECCV 2020: 16th European Conference, Glasgow, UK, 23–28 August 2020; pp. 720–736. [Google Scholar]
  27. Lang, A.H.; Vora, S.; Caesar, H.; Zhou, L.; Yang, J.; Beijbom, O. Pointpillars: Fast encoders for object detection from point clouds. In Proceedings of the IEEE/CVF Conference on Computer Vision and Pattern Recognition, Long Beach, CA, USA, 15–20 June 2019; pp. 12697–12705. [Google Scholar]
  28. Ahmad, J.; Del Bue, A. mmfusion: Multimodal fusion for 3D objects detection. arXiv 2023, arXiv:2311.04058. [Google Scholar]
  29. Li, Z.; Yu, Z.; Wang, W.; Anandkumar, A.; Lu, T.; Alvarez, J.M. Fb-bev: Bev representation from forward-backward view transformations. In Proceedings of the IEEE/CVF International Conference on Computer Vision, Paris, France, 1–6 October 2023; pp. 6919–6928. [Google Scholar]
  30. Yang, C.; Chen, Y.; Tian, H.; Tao, C.; Zhu, X.; Zhang, Z.; Huang, G.; Li, H.; Qiao, Y.; Lu, L. Bevformer v2: Adapting modern image backbones to bird’s-eye-view recognition via perspective supervision. In Proceedings of the IEEE/CVF Conference on Computer Vision and Pattern Recognition, Vancouver, BC, Canada, 17–24 June 2023; pp. 17830–17839. [Google Scholar]
  31. Yu, Z.; Liu, Q.; Wang, W.; Zhang, L.; Zhao, X. PolarBEVDet: Exploring Polar Representation for Multi-View 3D Object Detection in Bird’s-Eye-View. arXiv 2024, arXiv:2408.16200. [Google Scholar]
Figure 1. Workflow diagram of the proposed object detection algorithm.
Wevj 16 00306 g001
Figure 2. Attention-based feature fusion for center point detection network.
Wevj 16 00306 g002
Figure 3. Multi-scale grouping schematic.
Wevj 16 00306 g003
Figure 4. Image feature map aggregation module.
Wevj 16 00306 g004
Figure 5. Feature fusion network based on an attention mechanism.
Wevj 16 00306 g005
Figure 6. nuScenes dataset data projection sample plot.
Wevj 16 00306 g006
Figure 7. Different feature fusion methods: (a) method A; (b) method B; (c) ours.
Wevj 16 00306 g007
Figure 8. Different feature fusion methods using the nuScenes validation set.
Wevj 16 00306 g008
Figure 9. nuScenes dataset detection visualizations. (a) Traffic scenes at intersections (b) Road driving scenarios (c) Car Park Scene.
Wevj 16 00306 g009
Figure 10. Results of object detection in experimental scenarios.
Wevj 16 00306 g010
Figure 11. Real-time comparative analysis of algorithm performance.
Wevj 16 00306 g011
Table 1. Multiple advanced 3D detection algorithms for performance comparison using the nuScenes dataset.
MethodModalityCar/%Truck/%Bus/%mAP/%NDS
PointPillars [27]LiDAR67.543.662.259.757.3
CenterPoint [18]LiDAR82.552.763.661.462.6
MV3D [12]LiDAR and Camera78.636.754.554.652.1
3D-CVF [26]LiDAR and Camera81.549.353.959.659.2
mmFUSION [28]LiDAR and Camera86.352.965.164.269.4
FB-BEV [29]Camera71.743.339.653.762.4
BEVFormerv2 [30]Camera74.848.443.055.663.4
PolarBEVDet [31]Camera73.945.237.855.863.5
OursLiDAR and Camera83.452.365.464.563.7
Disclaimer/Publisher’s Note: The statements, opinions and data contained in all publications are solely those of the individual author(s) and contributor(s) and not of MDPI and/or the editor(s). MDPI and/or the editor(s) disclaim responsibility for any injury to people or property resulting from any ideas, methods, instructions or products referred to in the content.

