Article

State of Health Estimation for Lithium-Ion Batteries Using Electrochemical Impedance Spectroscopy and a Multi-Scale Kernel Extreme Learning Machine

1
School of Electric Power Engineering, Nanjing Institute of Technology, Nanjing 211167, China
2
Faculty of Computer Science and Engineering, Xi’an University of Technology, Xi’an 710048, China
3
School of Information Engineering, Ordos Institute of Technology, Ordos 017000, China
4
School of Electrical and Automation Engineering, Nanjing Normal University, Nanjing 210023, China
*
Author to whom correspondence should be addressed.
World Electr. Veh. J. 2025, 16(4), 224; https://doi.org/10.3390/wevj16040224
Submission received: 24 February 2025 / Revised: 3 April 2025 / Accepted: 7 April 2025 / Published: 9 April 2025

Abstract

:
An accurate state of health (SOH) estimation for lithium-ion batteries (LIBs) is crucial for reliable operations and extending service life. While electrochemical impedance spectroscopy (EIS) effectively characterizes LIBs degradation patterns, the high dimensionality of EIS data poses challenges for an efficient analysis. This study proposes a novel method that combines EIS with an equivalent circuit model (ECM) and distribution of relaxation time (DRT) analysis to extract low-dimensional health features from high-dimensional EIS data. A multi-scale kernel extreme learning machine (MS-KELM), optimized by the Sparrow Search Algorithm (SSA), estimates battery SOH with an average mean absolute error (MAE) of 1.37% and a root mean square error (RMSE) of 1.76%. In addition, compared with support vector regression (SVR) and Gaussian process regression (GPR), the proposed method reduces computational time by factors of 4 to 30 and lowers memory usage by approximately 18%.

1. Introduction

The energy crisis and environmental degradation are essential challenges in the sustainable development of human society. Globally, governments have introduced policies to accelerate the replacement of fossil fuels and achieve a low-carbon energy structure. In the context of road transport, the electrification of vehicles can contribute to a significant reduction in global greenhouse gas emissions, estimated at 11.9% [1]. Consequently, electric vehicles (EVs) have undergone rapid development. Lithium-ion batteries (LIBs) are the primary power source for EVs because of their high energy density and power density, and long cycle life [2]. Accurate health estimation plays a crucial role in ensuring the efficient and safe operation of the battery systems. However, the battery degradation mechanism is complex and highly nonlinear under complex road conditions and disordered charging and discharging conditions. Therefore, estimating the battery state of health (SOH) for EVs is an urgent requirement at present.
EVs monitor the voltage and current status in real-time [3], evaluate the battery SOH and other state parameters through the battery management system (BMS), and later achieve the battery charging and discharging control. SOH estimation can be achieved through the features of voltage and current, including but not limited to internal resistance, incremental capacity analysis (ICA), and differential voltage analysis (DVA). Alejandro Gismero et al. [4] analyzed battery behavior under different current core temperature conditions and used Coulomb counting to estimate battery SOH. Tan et al. [5] performed a real-time SOH estimation using equivalent internal resistance (EIR), which is closely related to the degree of battery degradation, and the simplicity of this method makes its implementation for onboard applications easy. Guha and Patra [6] proposed a method for estimating the remaining useful life (RUL) of a battery in conjunction with a capacity degradation and internal resistance growth model, which provides a structured approach for monitoring battery SOH. Simolka et al. [7] used ICA and DVA to analyze capacity degradation, describe potential aging mechanisms, and estimate the remaining capacity of the battery based on the first peak of the IC curve, which requires only a short period of charging and discharging to achieve a remaining capacity estimation accuracy of ±50 mAh. The internal resistance measurements provide limited information about the inside reactions of the LIBs, capacity measurements cannot be easily measured while the battery is operated, and ICA/DVA is only applicable to LIBs under a low current rate [8].
In order to enhance the precision of a SOH estimation, the extraction and analysis of battery aging based on electrochemical impedance spectroscopy (EIS) have received extensive attention and have been researched in-depth by scholars [9]. EIS shows the evolution of each electrochemical process inside the battery through impedance at each frequency interval, such as the aging of the double-layer capacitance at the electrode/electrolyte interface, the charge transfer resistance of the solid electrolyte interface (SEI) membrane, and the aging mechanism of the ion diffusion process. EIS data have been shown to contain rich information about the internal mechanism of the LIBs [10,11]. Furthermore, EIS measurements have been demonstrated to be efficient [12,13], making it an essential tool for analyzing battery performance, condition detection, and fault diagnosis. However, there are two major difficulties in estimating the SOH of a battery by directly using EIS. First, the dimensionality of the impedance is high, and contains real and imaginary part information of the measured frequency point (Nf × (Nre + Nim)). Second, the correlation between impedance features and SOH in certain frequency intervals is not clear. In order to improve the efficiency of the SOH estimation, it is necessary to process the high-dimensional EIS data to refine the low-dimensional and highly correlated battery health features (HFs) as a way to optimize the operational performance of SOH estimation [14].
In an EIS-based SOH estimation, extracting EIS features is the key to improving the estimation accuracy. Existing HFs can be divided into two categories. The first one is the EIS raw data. Zhang et al. [15] demonstrated the value of EIS data in BMS by using the entire EIS data with Gaussian Process Regression (GPR) to achieve an accurate prediction of the remaining battery life, and in the Nyquist plot, the imaginary parts of the two frequency points, 17.80 Hz and 2.16 Hz, are positively and linearly correlated with the cycling period. Fu et al. [16] used a health feature extraction method similar to the frequency point idea in [15] to designate the real and imaginary parts of the three eigenfrequencies as HFs and combined them with the extreme learning machine with regularization mechanism to estimate the battery capacity, and the results showed that the estimated SOH can be obtained within 35 s, with an error of less than 2%. In [17], Loechte et al. [17] used raw data from impedance measurements to estimate the battery SOH utilizing a combination of Artificial Neural Networks (ANN) and Support Vector Regression (SVR) [18], with an error of 0.16% for ANN and 0.47% for SVR. Whilst employing EIS data characteristics directly is relatively straightforward, the mechanism representation and interpretability are not sufficient, along with poor accuracy and redundant computation.
The second one is extracting HFs by transforming the raw EIS data. Building a model is a common method to estimate battery SOH using EIS. According to different modeling methods and considerations, lithium-ion battery models can be divided into electrochemical models, empirical models and equivalent circuit models [19]. Methods based on electrochemical models are designed by analyzing the internal mechanisms and specific characteristics of the battery to characterize the battery aging process [20]. Therefore, the construction of electrochemical models requires complex partial differential equations, which is not suitable for practical applications [21]. Empirical models generally achieve real-time capacity estimation based on analyzing a large amount of experimental data [22]. The equivalent circuit model parameter identification is simple and has good real-time performance [23]. Therefore, it is often used to estimate SOH [24]. Yang et al. [25] used the equivalent circuit model (ECM) of the battery to estimate the battery SOH by extracting the ohmic resistance, polarization resistance, and polarization capacitance and combining it with least square support vector regression (LSSVR), the results showed that their estimation method has high accuracy with good robustness. Su et al. [26] proposed three new health indicators (HIs) related to the LIBs diffusion coefficient through low-frequency EIS and combined with GPR to achieve rapid capacity estimation of LIBs. Zhou et al. [10] used high- and mid-frequency range impedance spectrum data to extract battery HFs and combined them with GPR to achieve smooth and accurate battery health state estimation. In recent years, HFs from the distribution of relaxation times (DRT) have been used to estimate the SOH of batteries [27,28]. Wang et al. [29] extracted six-dimensional battery HFs from DRT curves by proposing a GPR method with automatic relevance determination (ARD) kernel to realize the battery SOH estimation. Zhu et al. [27] implemented the estimation of SOH based on DRT and the Minimum Redundancy Maximum Relevance (MRMR) algorithm. These demonstrated that an estimation derived from features according to the processed DRT curve not only significantly reduces the computation time but also has a higher precision compared to directly using the raw EIS data. HFs from EIS conversion are complex to obtain, yet provide in-depth information about the battery’s internal reactions. Currently, there is a lack of effective methods for extracting HFs from EIS, and the application of these methods remains challenging. Fully utilizing EIS data and balancing its interpretability with the high performance of estimation models is an ongoing issue.
In order to display the comparison of related research more intuitively, this article compares some documents in Table 1. Among them, references [15,16] directly use EIS data for estimation, ref. [26] extracts features from EIS data, and [25,29] extract health features from ECM and DRT, respectively, for SOH estimation.
For estimating the battery SOH, HFs are one of the key factors affecting the estimation efficiency and accuracy, the estimation model also plays a key role. Traditional models such as GPR and SVR face problems such as high consumption of computational resources, long training time, and complex hyper-parameter tuning, especially in scenarios with high real-time requirements such as EVs BMS. Therefore, this paper extracts and screens the physical model parameters and relaxation time features from EIS data, combining them with the multi-scale kernel extreme learning machine (MS-KELM) for SOH estimation. Unlike machine learning methods that require iterative training, kernel extreme learning machine (KELM) is a single hidden layer feedforward neural network based on the kernel approach, which makes KELM well suited for real-time applications where computational resources are limited or fast estimation is needed. As an efficient estimation model, KELM has been studied with remarkable achievements in many fields. Still, it has relatively few applications in the field of battery SOH, and the existing studies usually neglect its hyper-parameter tuning automation problem and are relatively scarce in the study of variants of extreme learning machines.
In summary, to better understand the aging mechanism of LIBs while taking into account the estimation accuracy and application efficiency, this paper first proposes a comprehensive feature extraction method that draws upon the EIS from ECM and DRT. Then, it proposes an MS-KELM model proposed by the sparrow search algorithm (SSA) for LIB SOH estimation. The main contributions are as follows:
(1)
To balance the interpretability of the aging mechanism and the performance of the estimated model during LIBs aging, this paper proposes HFs that fuse ECM with DRT characteristics, which also utilize the random forest (RF) for screening the effectiveness of the HFs.
(2)
The KELM is used as an estimation model with three radial basis function (RBF) kernel functions and two regularization parameters, which enable to capture of the complex nonlinear relationships of the HFs and battery SOH from multiple scales.
(3)
The SSA is used to optimize the parameters of the KELM model to automate the algorithm configuration. The algorithm automatically adjusts the parameters of the model, reducing human effort and avoiding expert experience.
This paper is organized as follows. Section 2 describes the extraction and evaluation methods of the HFs. Section 3 details the proposed multi-scale kernel extremum learning machine (SSA-MS-KELM) model. Section 4 validates the proposed method. Section 5 summarizes the paper.

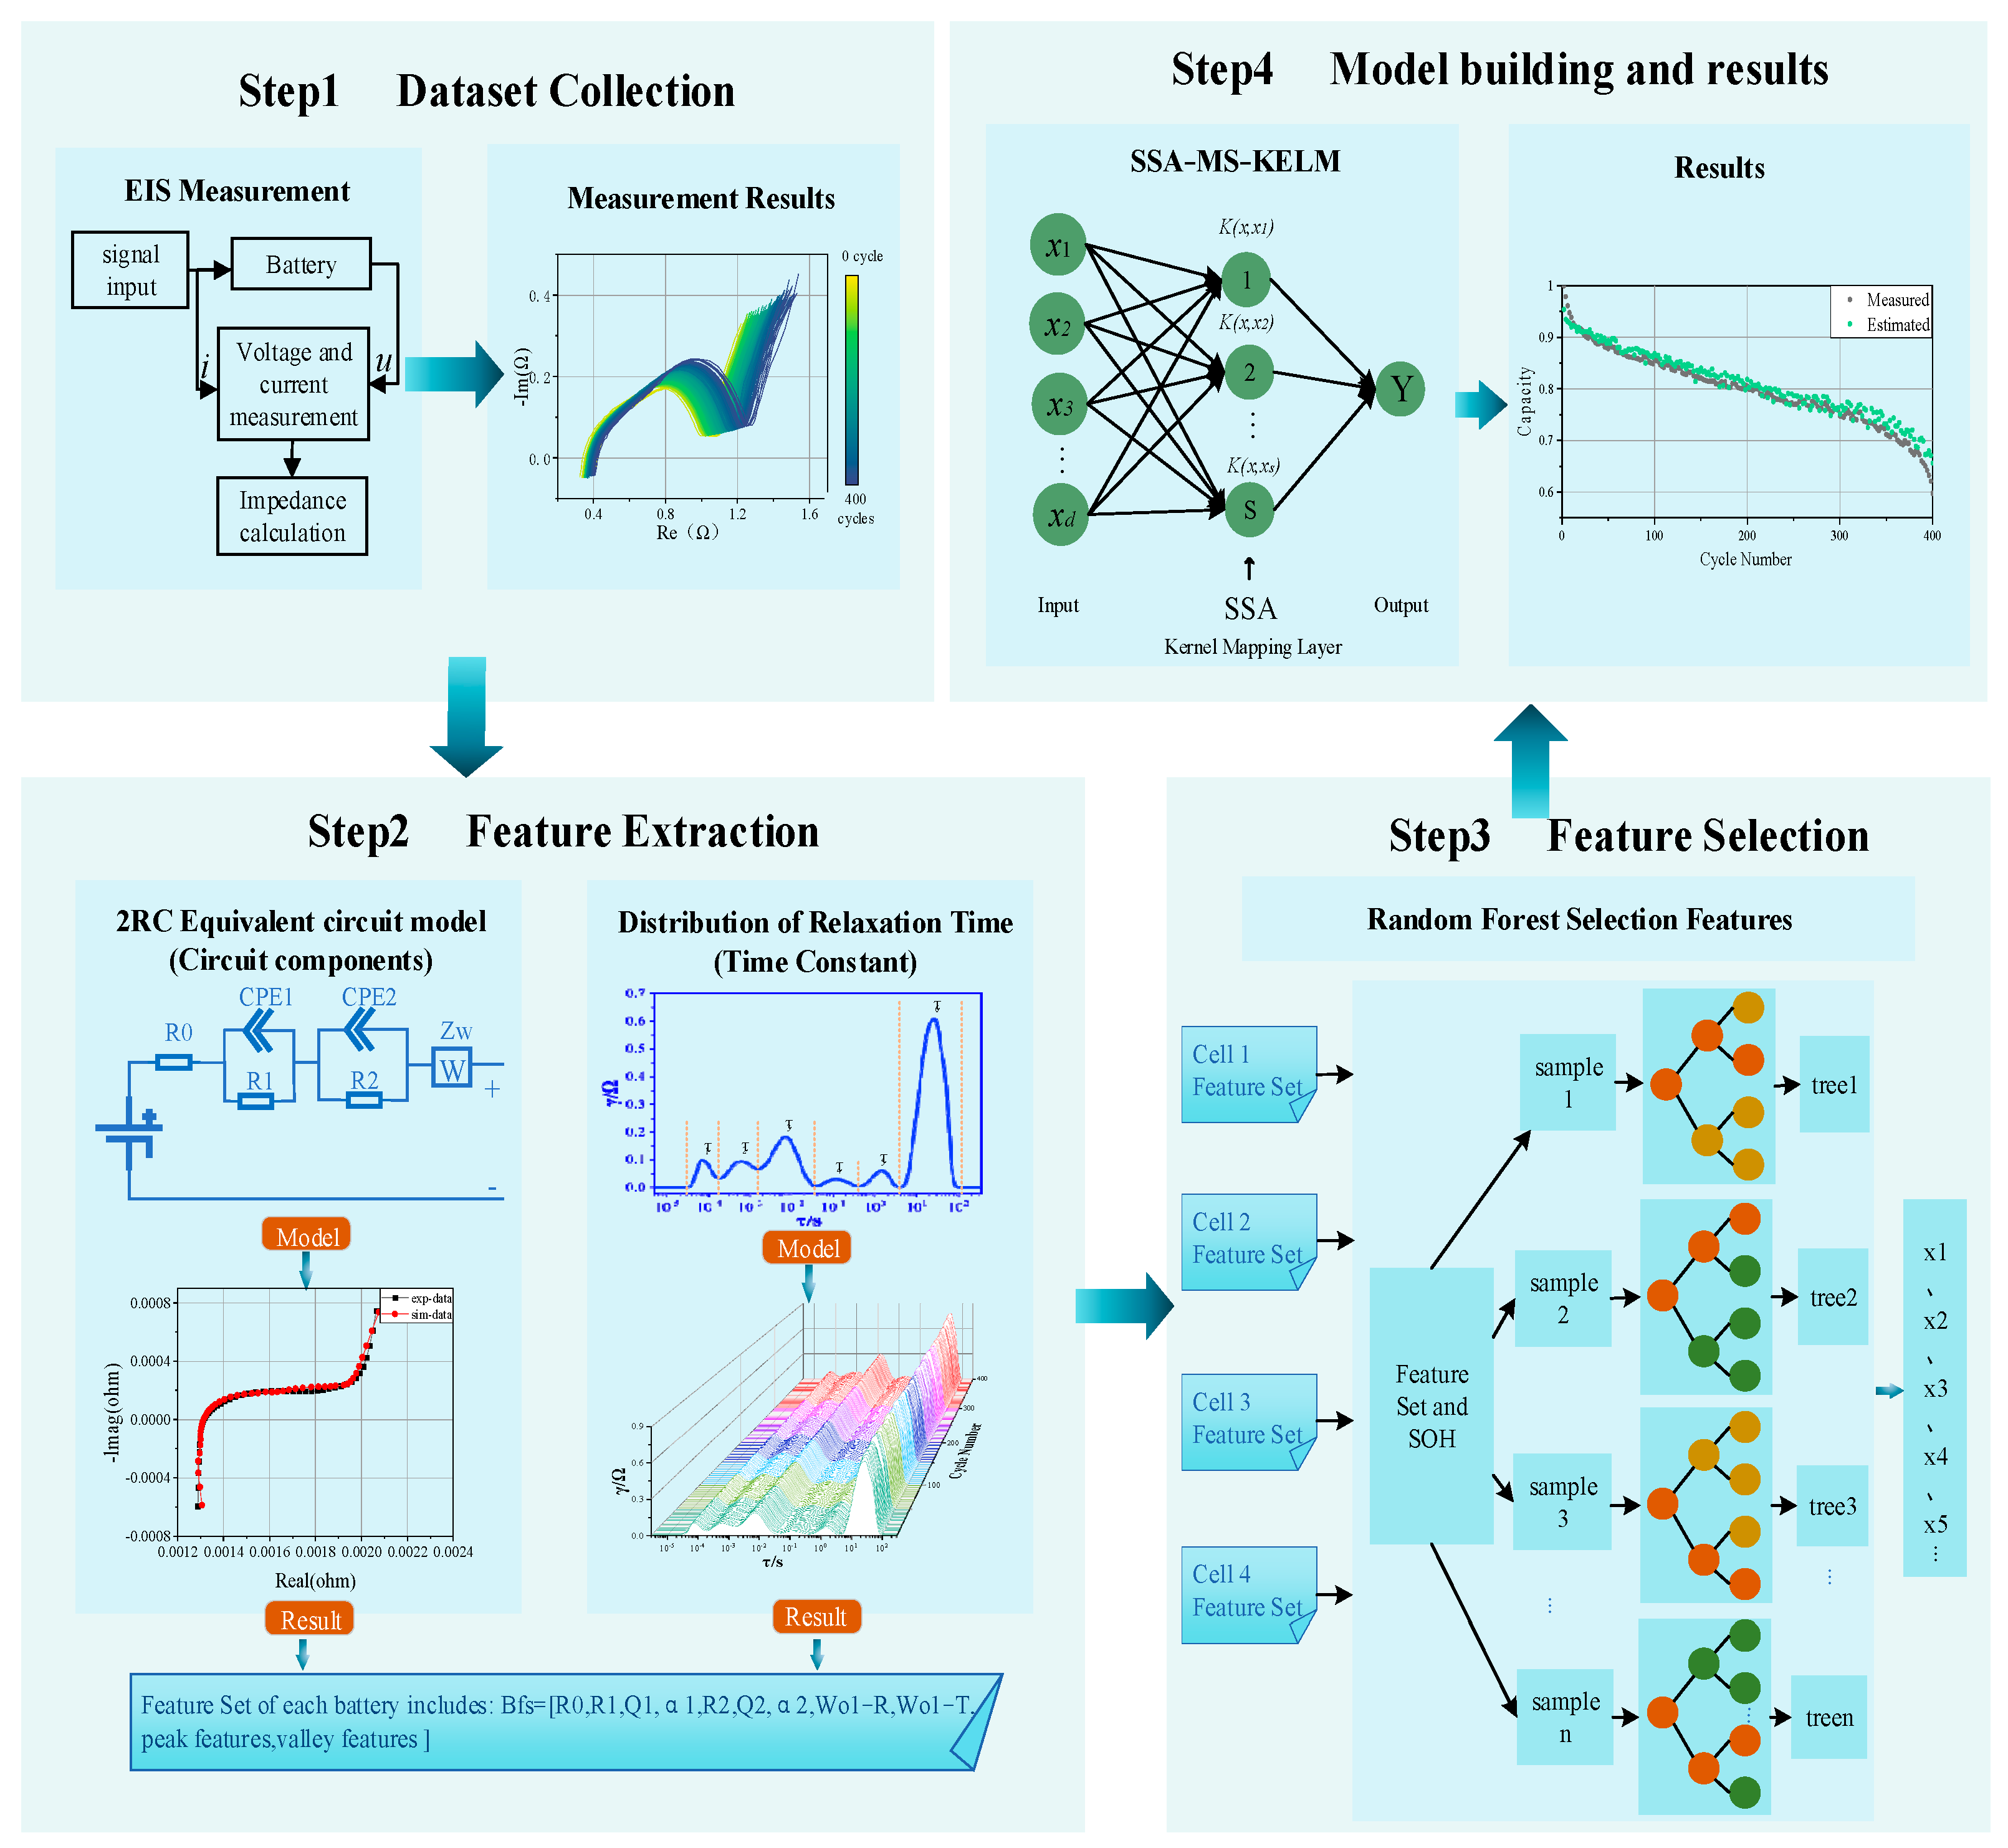
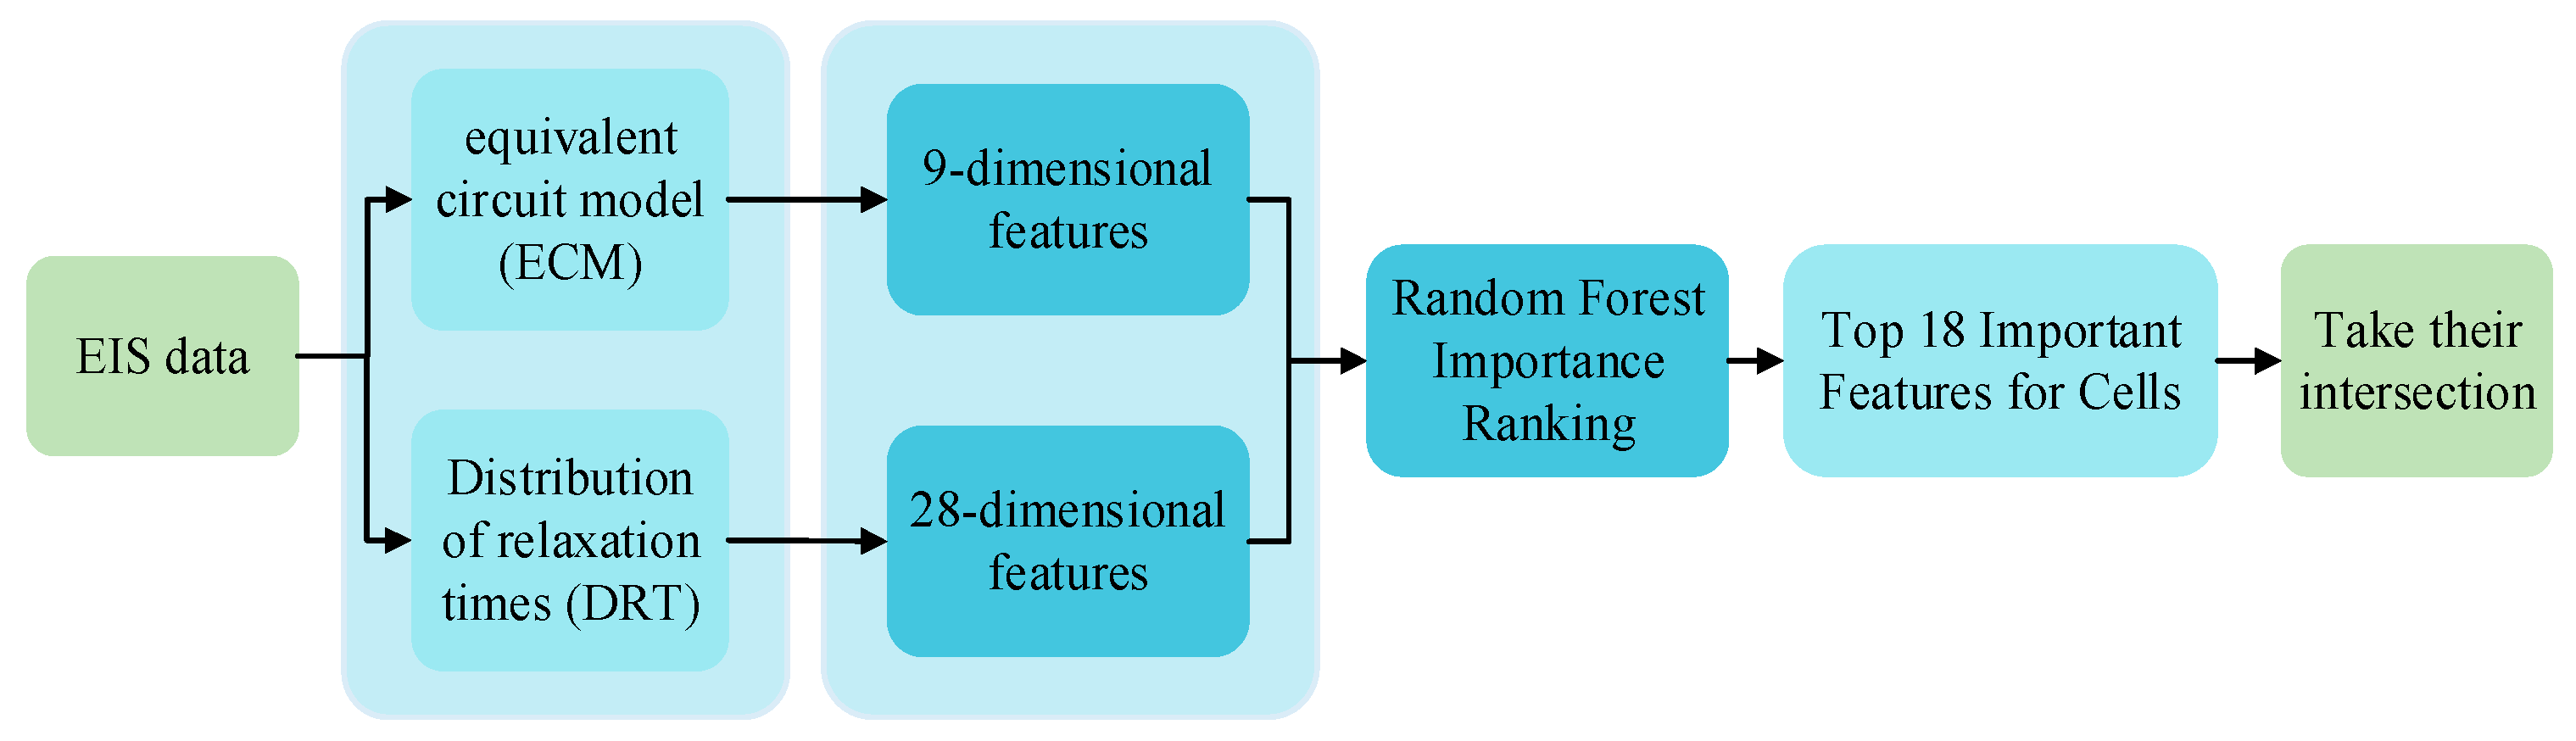
2. EIS-Based HFs Extraction

The research line of this paper is shown in Figure 1, which is grounded in EIS data for ECM feature and DRT curve feature extraction, followed by training and estimation using the SSA-MS-KELM optimized by the SSA.

2.1. HFs Extraction and Selection

ECM and DRT are the analysis methods for the EIS data analysis of LIBs, the purpose of which is to obtain HFs and analyze the internal degradation status of the LIBs. ECM fits the impedance of the battery and can obtain the trend of the component parameter changes in different aging statuses. Those components of the ECM can be used to analyze the kinetics linked to the battery aging. The DRT-based method extracts the distribution of time constants of the impedance spectrum, mapping the relationship between the peak and valley of the DRT curve and the polarization process in the battery electrochemical reaction. In this paper, ECM and DRT are two completely independent data processing methods. During the data preprocessing stage, the ECM converts the original EIS data into low-dimensional parameters by fitting the battery’s equivalent circuit model, whereas the DRT method extracts time domain information describing the electrochemical process by analyzing the time scales. Therefore, both the HFs from ECM and DRT are analyzed and a combined reconstruction approach is proposed to provide the input of the estimation model and improve the efficiency of the calculation at the same time.

2.1.1. ECM-Based HFs

ECM can characterize the internal dynamics of LIBs [30,31], using resistors, capacitors, and other circuit elements to simulate the dynamic characteristics of LIBs. The Nyquist plot of a typical LIB can be divided into three parts: the ultra-high frequency region, the medium-high frequency region, and the low-frequency region. Among them, electrolyte decomposition mainly affects the ultra-high frequency region, which is generally expressed with R0 in ECM, and its component parameter R0 can reflect the electrolyte decomposition and the battery’s internal resistance. The two semicircles in the middle and high frequencies are mainly for the degradation and growth of the SEI and the charge transfer reaction between the anode and the cathode, which are generally represented by two constant phase elements (CPE) in the ECM and the change in the CPE component parameters show the charge transfer and the change in the SEI. Structural decomposition and particle fracture mainly affect the low-frequency region. They are represented by Warburg resistance [9], and an increase in the Warburg resistance indicates the degradation and diffusion process of the battery’s internal structure. The battery SOH estimation is achieved by analyzing these component parameters.
ECM can increase the interpretation of EIS for better applications. By introducing the circuit model, we not only improve the interpretability of the feature but also reduce the complexity of the data-driven model.
When fitting the equivalent circuit, an equivalent circuit model is first selected to represent the internal behavior of the LIBs. The model parameters are then estimated by the nonlinear least squares method.
An ECM is constructed to obtain the battery aging evolution, and the components in the ECM change accordingly with the battery aging degree. Compared with directly using raw EIS, the ECM method uses a small number of parameters to store the main EIS features for internal state estimation, significantly reducing the computational complexity.

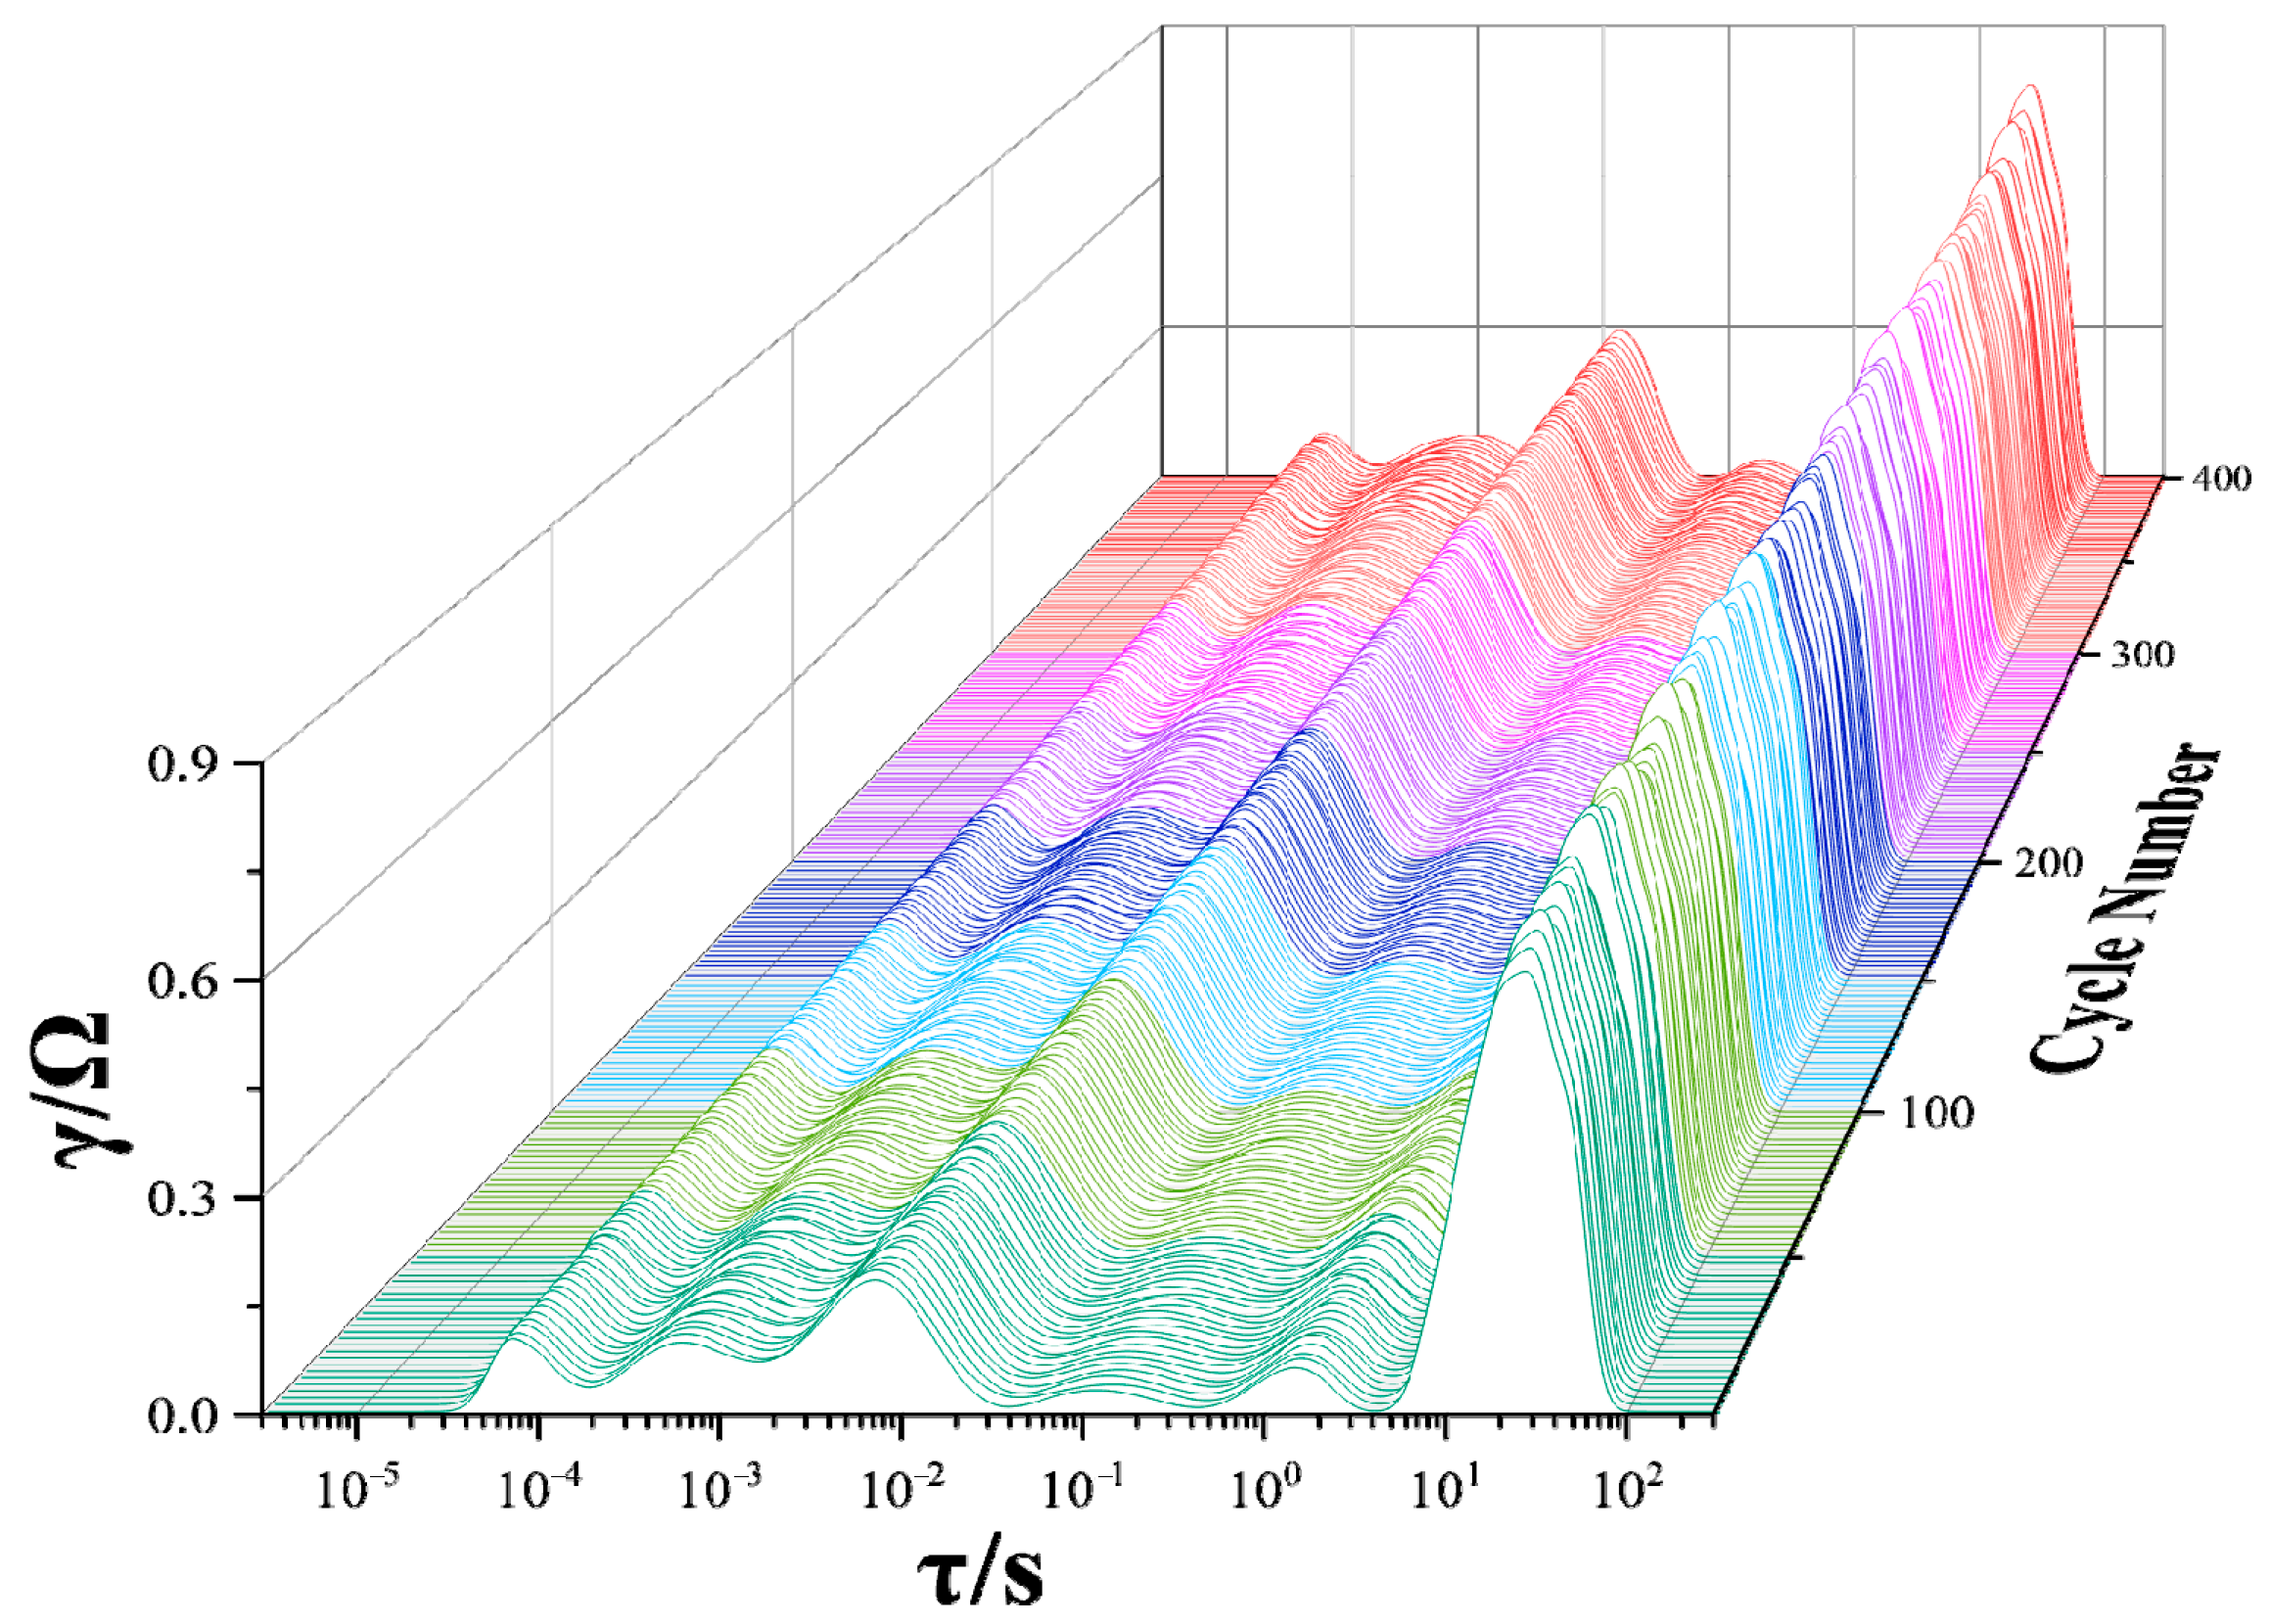
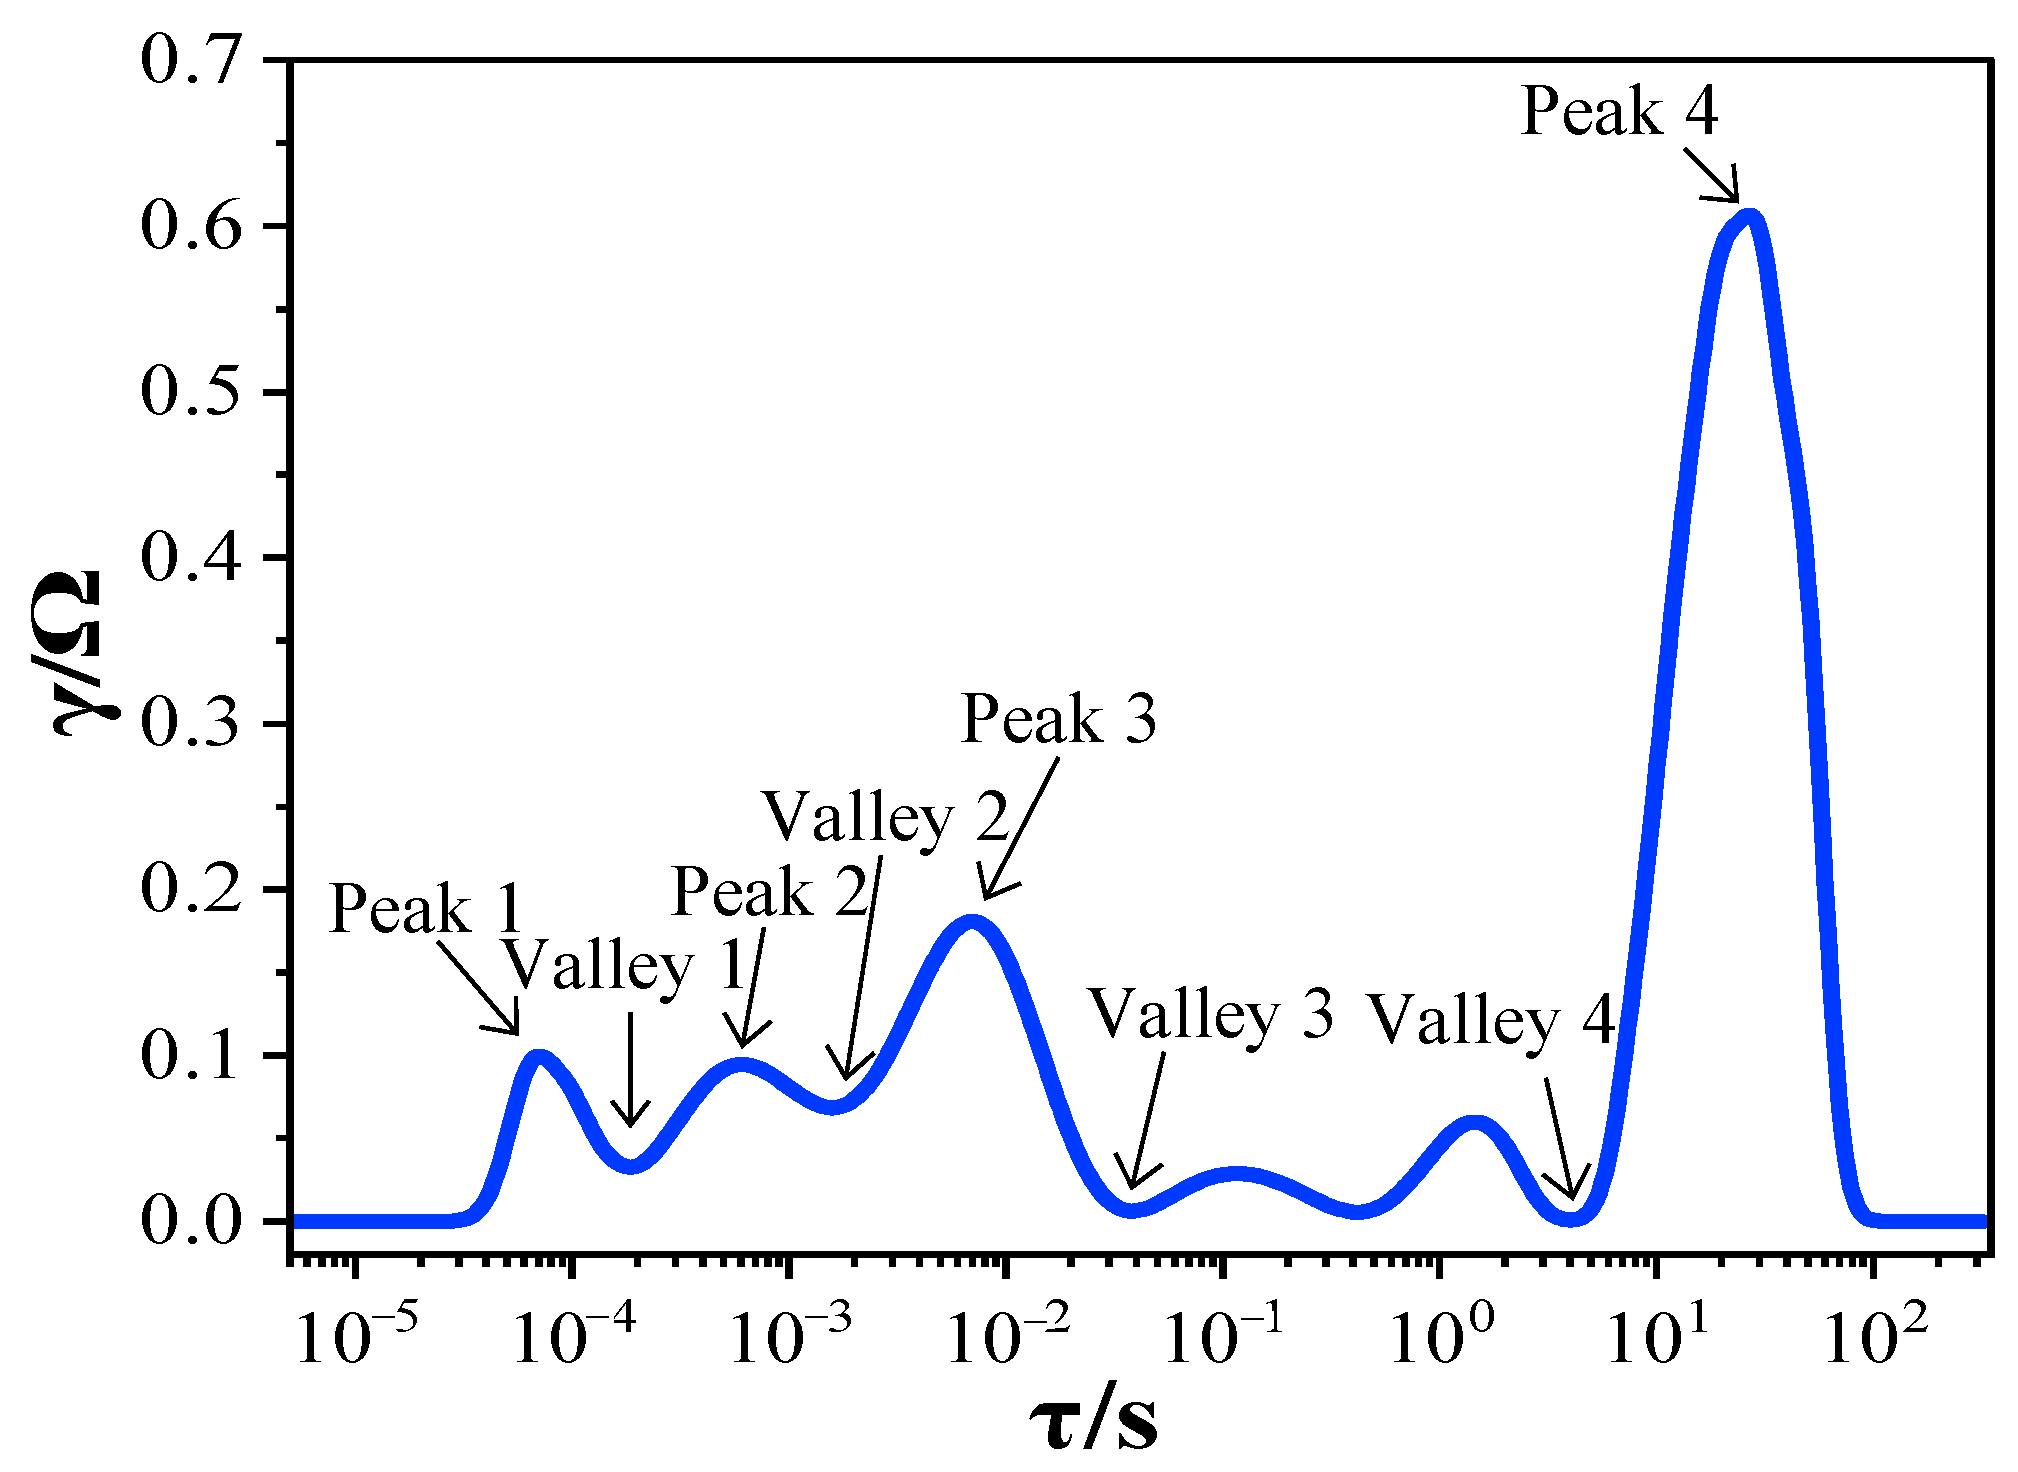
2.1.2. DRT-Based HFs

The DRT-based HFs extract the number of relaxation processes occurring in the LIBs from EIS, effectively separating the polarization processes and reacting to the electrochemical processes at different frequencies [32].
DRT focuses on the timescale analysis and is a valuable method for quantitatively studying kinetics inside battery systems. It complements traditional EIS by extending its capabilities. Typically, electrochemical systems are analyzed and represented in the frequency domain. The primary goal of DRT is to convert the timescale features derived from frequency-based EIS into the time domain [33].
DRT is calculated as follows,
Z D R T ( ω ) = j ω L + R 0 + Z p o l ( ω )     = j ω L + R 0 + 0 + γ ( τ ) 1 + j ω τ d τ
where L, R 0 , j, ω and τ are the inductance, ohmic resistance, complex unit, angular frequency, and characteristic time constant, respectively [29]. The main objective of DRT is to determine the time constant distribution of a typical EIS. The distribution function combined with EIS transforms the frequency domain into the time domain [34].
The significant advantage of the DRT method is that each peak of the DRT curve is proportional to the partial polarization resistance of a particular electrode reaction stage. The DRT curve is shown in Figure 2. The curve shown in Figure 2 is the DRT curve of a battery under different aging cycles. The battery samples in Figure 2 and Figure 3 are both Cell 3. Cell 3 is defined in Section 4.1. Its specific model and working conditions will be explained in Section 4.1. The physical processes and main reasons corresponding to each peak [28] are shown in Table 2.
The DRT in this paper is obtained by an open-source software DRTtools [35], the peak features and valley features extracted from the sample battery are shown in Figure 3. The DRT is realized by the calculation of the distribution function, which is an ill-posed problem. Tikhonov regularization (also known as ridge regression) is one of the most popular and effective solutions that are parameter dependent [36]. The DRTtools used in this paper is a regularization technique based on RBF discretization to estimate DRT [33]. The extracted features have 28 dimensions as shown in Table 3. Peak Height is defined as PH, Peak Position is defined as PP, Valley Height is defined as VH, Valley Position is defined as VP, Half Peak Area is defined as HPA, and Peak to Total Peak Ratio is defined as PPR, Valley to Total Valley Ratio is defined as VVR.

2.2. Feature Selection Using Random Forest

Due to the complexity of the battery aging mechanism, the correlation between HFs and SOH is not constant. Since there are cross-coupling factors among HFs, selecting a correlation HFs set is a critical task. In this section, the process of HFs selection is conducted, and the RF is utilized to identify the key HFs for the SOH estimation model. Compared to the Pearson and Spearman correlation coefficients, RF has the advantages in capturing complex interactions among features. Through the decision tree splitting mechanism, RF can automatically uncover intricate nonlinear relationships between features, revealing their combined effects. RF for feature selection can help to find complex feature couplings and evaluate their importance by combining multiple trees of different features.
In this paper, 9-dimensional features of ECM and 28-dimensional features of DRT are extracted in Section 2.1, and 37-dimensional features are extracted from four cells. The RF correlates the HFs extracted for each cell with SOH. 37-dimensional HFs of the importance ranking, considering the dimensions of the feature, the intersection of the HFs larger than the 18th importance rank for all the cells are selected as the input feature. Then, the final HFs, containing nine dimensions, are used for SOH estimation, where the entire selection process is shown in Figure 4. The selected nine-dimensional HFs are R0, Wo1-R, VVR 1, VH 2, HPA 2, PH 3, PP 3, VP 3, and HPA 3, and their trends are shown in Figure 5. As shown in Figure 5, except for VH 2, which shows a downward trend with the increase in cycle aging times, the other characteristics show an upward trend, especially R0, PH 3, PP 3, VP 3, and HPA 3. In contrast, Wo1-R is more susceptible to local changes, and factors during experimental testing can cause outliers.

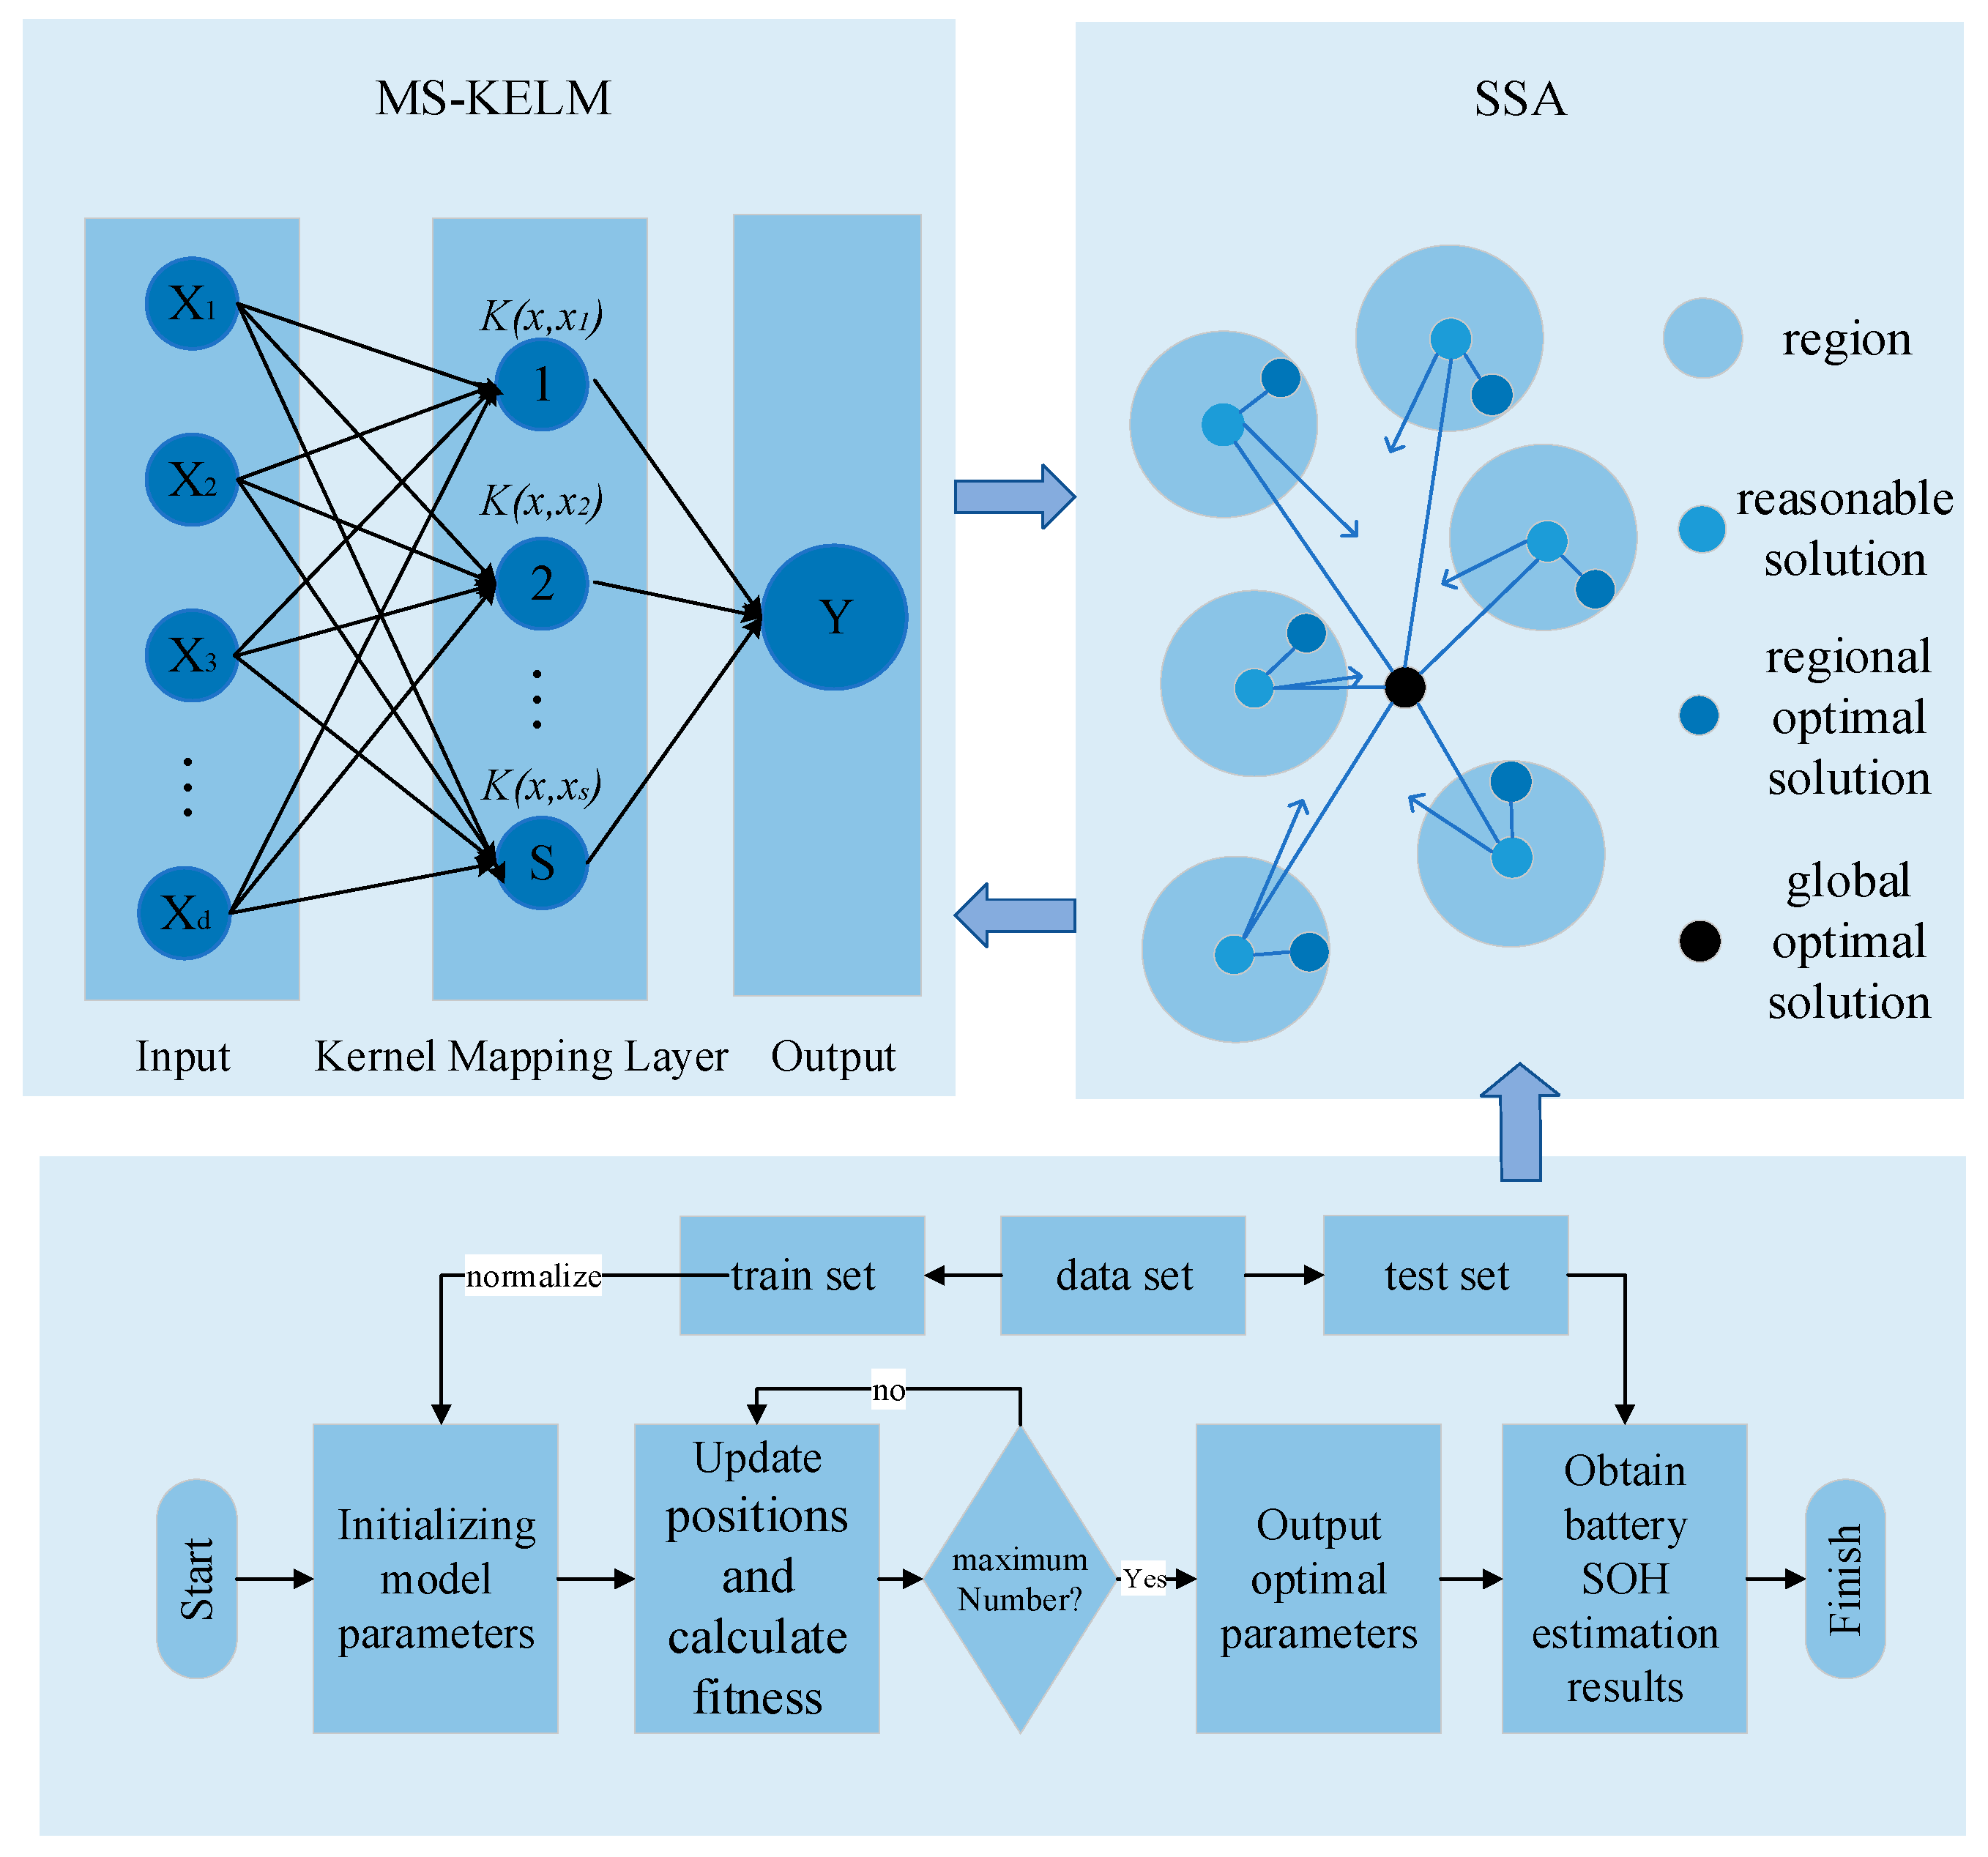
3. SOH Estimation with KELM

3.1. Extreme Learning Machine with Multi-Kernel Functions

For the battery SOH estimation, HFs obtained through EIS frequently contain substantial information and are usually characterized by nonlinearities. Traditional machine learning methods face the challenge of dealing with nonlinear relationships, especially when there is redundancy or complex coupling of HFs. ELM, as an efficient pre-feedback neural network [37], can be quickly trained, especially using the proposed HFs. However, to solve the complex nonlinear issue of the battery SOH, it is necessary to map the HFs to a high-dimensional feature space. Thus, this paper introduces the kernel function to KELM, where multiple RBF kernel functions are used to capture the features of the data at different scales. The performance of the battery SOH estimation can then be improved by introducing the multi-scale kernel functions [38].
The expression of the RBF kernel extreme learning machine is
Y = H β = H ( H + λ I ) 1 T
where λ is the regularization, I is the unit matrix, T is the target output matrix of the training dataset. H is the kernel matrix which is defined as
H i j = K ( x i , x j ) = exp ( γ   | |   x i x j   | | 2 )
where x i and x j are input data samples, and γ are the parameters to tune the kernel.
Then, a multi-scale kernel extreme learning machine with multiple RBF kernels can be expressed as
Y f i n a l = 1 N i = 1 N H m u l t i β i
β i = ( H m u l t i + λ i I ) 1 T
H m u l t i = i = 1 N ω i H i
where H m u l t i is the weights of the multiscale composite kernel matrix, β i is the weights that take into account the regularization parameters, and N is the number of the regularization parameters.
A multi-scale kernel extreme learning machine (MS-KELM) estimation model is formed by using three different RBF kernels. The model framework is delineated in Figure 6. The left side of Figure 6 shows the structure of the MS-KELM framework, which is divided into the input layer, kernel mapping layer, and output layer. The input layers X1, X2, X3, and Xd in Figure 6 represent the extracted and filtered model input features, namely R0, Wo1-R, VVR 1, VH 2, HPA 2, PH 3, PP 3, VP 3, and HPA 3. The right side shows the flowchart of the SSA optimization algorithm. The two regularization parameters are used to take the average of the training and testing results as the output of the estimation model, further improving the model’s accuracy and generalization ability.
The methodology consists of three key steps: feature normalization and dataset partitioning, SSA optimization of MS-KELM hyperparameters, and MS-KELM model training and prediction. Among them, feature normalization is to ensure stable model training. The SSA is to find the optimal parameters of the model. The use of SSA reduces the dependence on manual hyperparameter adjustment. The MS-KELM model builds three RBF kernel matrices and combines them using optimized weights, which enhances its ability to model complex battery degradation patterns and provides a flexible and powerful learning framework. The SSA-MS-KELM framework effectively balances model complexity and computational efficiency.

3.2. Parameter Optimization Using the Sparrow Search Algorithm

In the context of KELM, parameter optimization constitutes a pivotal step in enhancing the model’s accuracy and performance. The kernel width and regularization parameters have been shown to directly impact the model’s generalization. Consequently, the optimization of these parameters is imperative for enhancing the performance of the model. Using SSA to adjust the MS-KELM’s parameters can increase training efficiency and accuracy. The SSA chooses the RMSE as the cost function, and the adjusted parameters are three kernel parameters, two regularization parameters, and three kernel function weights in the MS-KELM model. The flowchart of the SSA-MS-KELM is shown in Figure 6.
SSA is an optimization algorithm that simulates the sparrow populations’ foraging and refeeding behaviors [39], featuring a good optimization search performance. In SSA, Step 1 involves creating the initialization solution. In Step 2, producers with higher health values are preferred over those producing dishes. Step 3 follows by updating the position of the entire population, with a few sparrows selected as scouts (explorers) to identify and issue warnings. Step 4 compares each individual’s current position with the last repeated position. Finally, Step 5 continues with Step 2 if the number of repetitions is less than the maximum [40].

4. Results and Discussion

4.1. Battery Dataset

The experimental dataset was obtained from the Cavendish Laboratory, University of Cambridge, UK. These experimental data are publicly available [15]. This dataset contains over 20,000 EIS spectra of commercial lithium-ion batteries covering different SOHs, SOCs and temperature conditions. To the best of our knowledge, this is a first-of-its-kind impedance dataset for battery aging, with EIS testing performed every two cycles. It contains 12 commercially available 45 mAh Eunicell LR2032 coin cells with LiCoO2/graphite chemistry. The capacity and EIS of the 12 cells are measured at 25 °C (25C01–25C08), 35 °C (35C01–35C02), and 45 °C (45C01–45C02). In this paper, we focus on the EIS at 25 °C and 100% SOC. The capacity and impedance of four cells, 25C01, 25C02, 25C05, and 25C06, are used for validation, which are named Cell 1, Cell 2, Cell 3, and Cell 4. The degradation mechanisms they experience during use are similar to those of EVs batteries, especially in terms of battery materials, discharge characteristics, and aging behavior. The degradation characteristics observed on coin cells are consistent with the main degradation paths of actual EVs during cyclic use. Although coin cells and EVs differ in scale and application, they share similarities in material properties and degradation mechanisms. Therefore, studying the EIS data of coin cells can provide an important reference and methodological basis for understanding and predicting the aging behavior of EVs. By studying the health state changes in them, we are able to verify the reliability of the proposed estimation method and provide effective data support for EVs battery health state monitoring. Their EIS curve changes are shown in Figure 7. Figure 7a–d show the EIS curve variations in Cell 1, Cell 2, Cell 3, and Cell 4 during the aging process.
Before the experiments, all cells underwent 30 cycles at room temperature of 25 °C. In the cycling experiment, each cycle consists of a 1 C rate (45 mA) CC-CV (constant current and constant voltage) charge to 4.2 V and a 2 C rate (90 mA) CC (constant current) discharge to 3 V.

4.2. Results

To quantify the estimation accuracy of the proposed model, we used the mean absolute error (MAE) in Equation (7), and the root mean square error (RMSE) as detailed in Equation (8) for evaluation.
M A E = 1 n i = 1 n |   y i y j   |
R M S E = 1 n i = 1 n ( y i y j ) 2
Figure 8 shows the results of the proposed method in cross-validation. As for the cross-validation test, one of the four LIBs is selected as the test dataset and the remaining three are the training dataset. In this way, the generalization of the proposed method can be verified. In this paper, three RBF kernels are employed to establish a multiscale hybrid RBF kernel. During the training process of our model, we perform a weighted composite of these three RBF kernels to form MS-KELM. The RBF kernel is a kernel function commonly used in machine learning, which is used to map data to high-dimensional space to solve linearly inseparable problems. Such a hybrid kernel can capture the multiscale characteristics of the HFs by adjusting multiple kernel parameters and using two regularization parameters. The cross-validation results show that the average MAE is 1.3668% and the average RMSE is 1.759% throughout the entire life cycle of the four cells, with the smallest MAE of 0.901% for Cell 2 and the largest MAE of 2.175% for Cell 4. The results show that the proposed method has good accuracy and generalization in cross-sample verification.

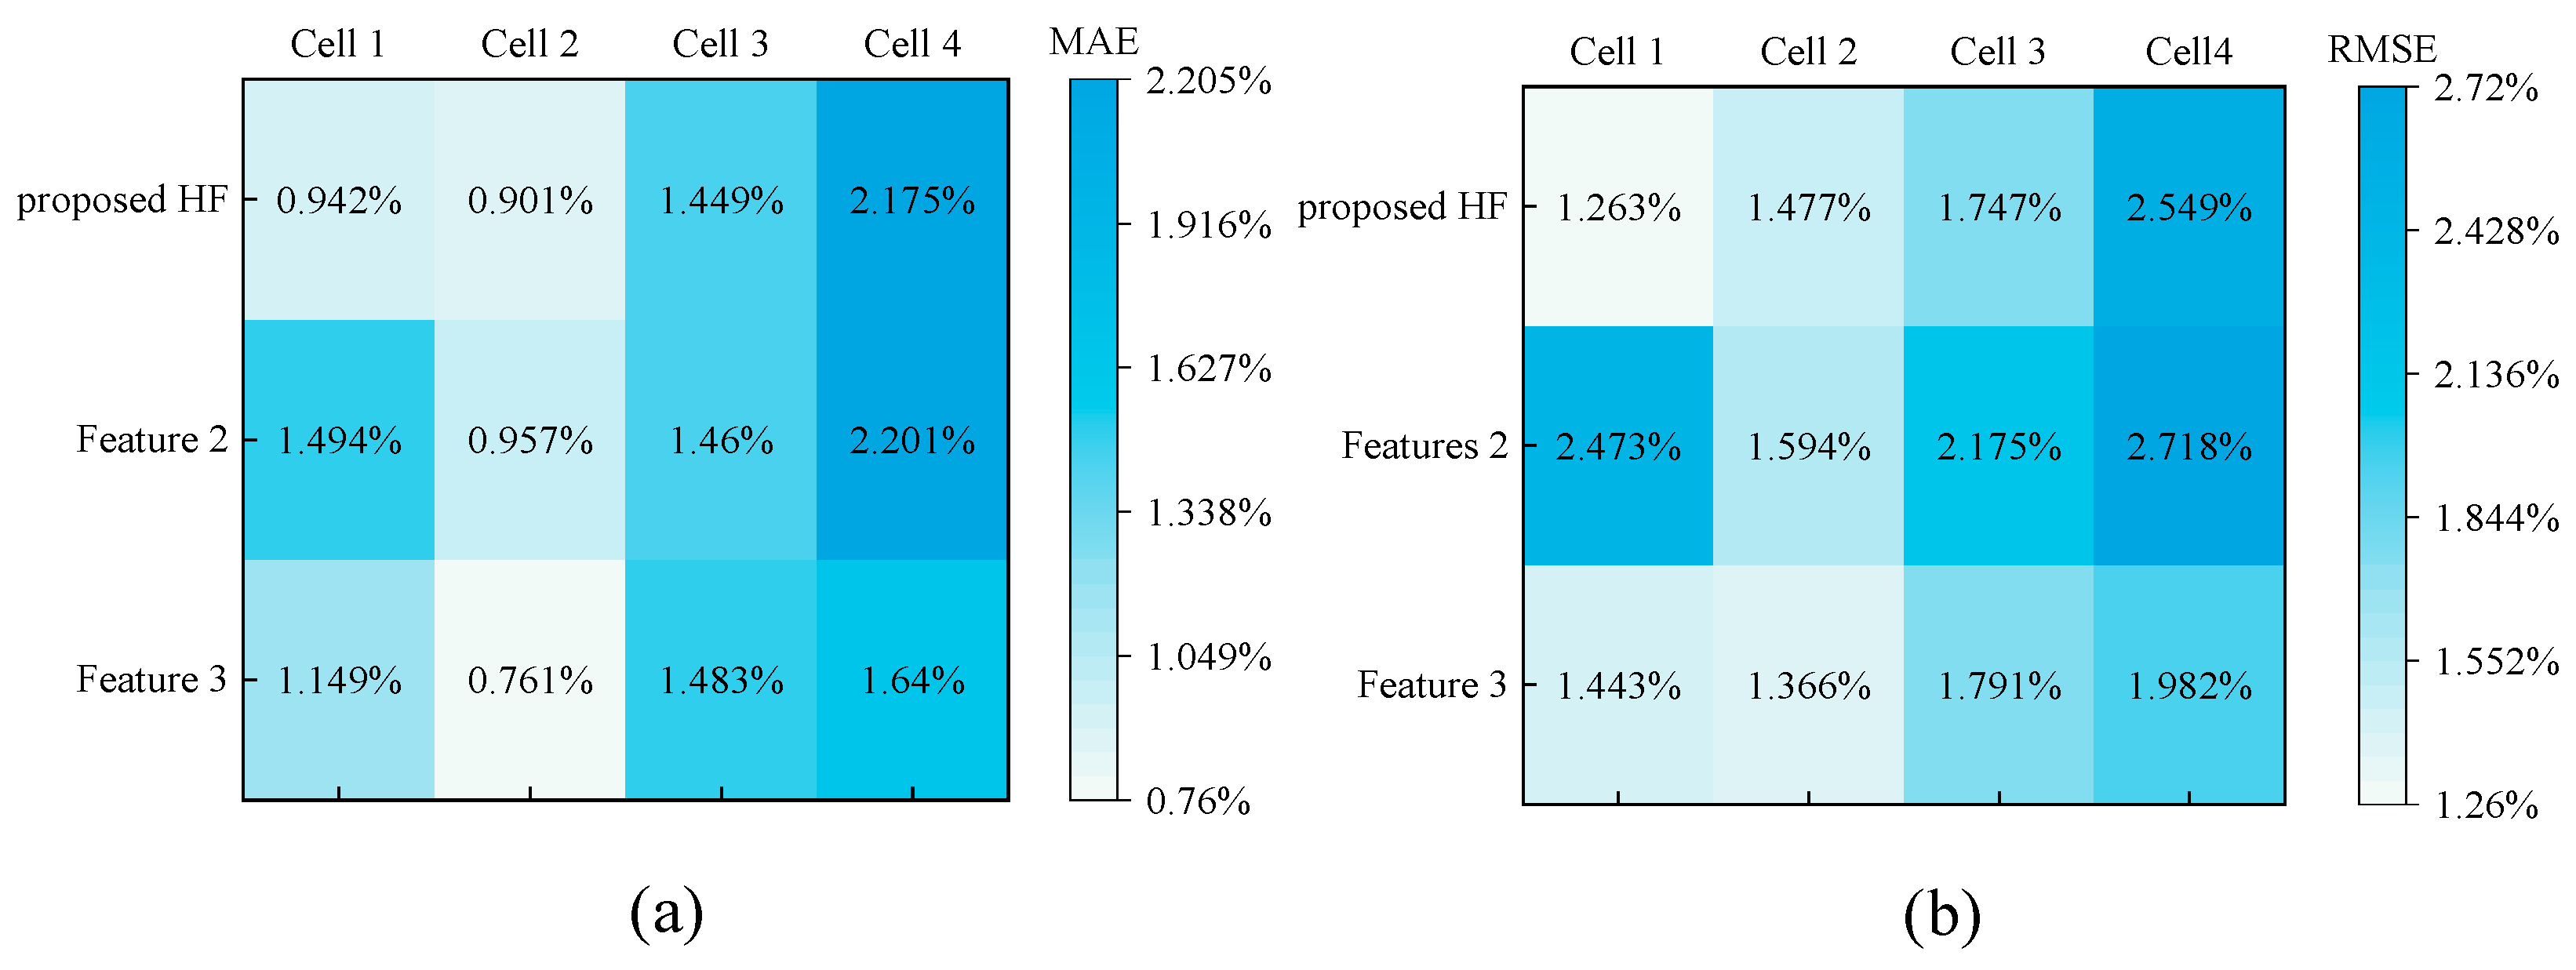
4.3. Comparison of Estimation Results for Different Input Features

4.3.1. Comparison for Different Input Features

Through a comprehensive feature extraction, this paper denotes the nine-dimensional HFs. For comparison, the HFs from ECM are defined as Feature 2, and the 28-dimensional HFs from DRT are named Feature 3. The proposed HF, Feature 2, and Feature 3 are selected as the input into the same SSA-MS-KELM model for SOH estimation, and the MAE and RMSE of the comparison results are shown in Figure 9.
The results show that the accuracy of the proposed HF is better than that of Feature 2. Only Cell 2 and Cell 4 using Feature 3 are better than the proposed HF. However, the 28-dimensional HFs of Feature 3 are more computationally intensive than the 9-dimensional HFs of the proposed HF. It is proved that the proposed feature extraction method integrating ECM and DRT is not only complementary in explaining the battery aging mechanism but also valuable in enhancing the model’s accuracy and stability. It is evident that the proposed HF achieves a superior balance between accuracy and efficiency which enables a higher prediction accuracy and a lower computational burden for models.

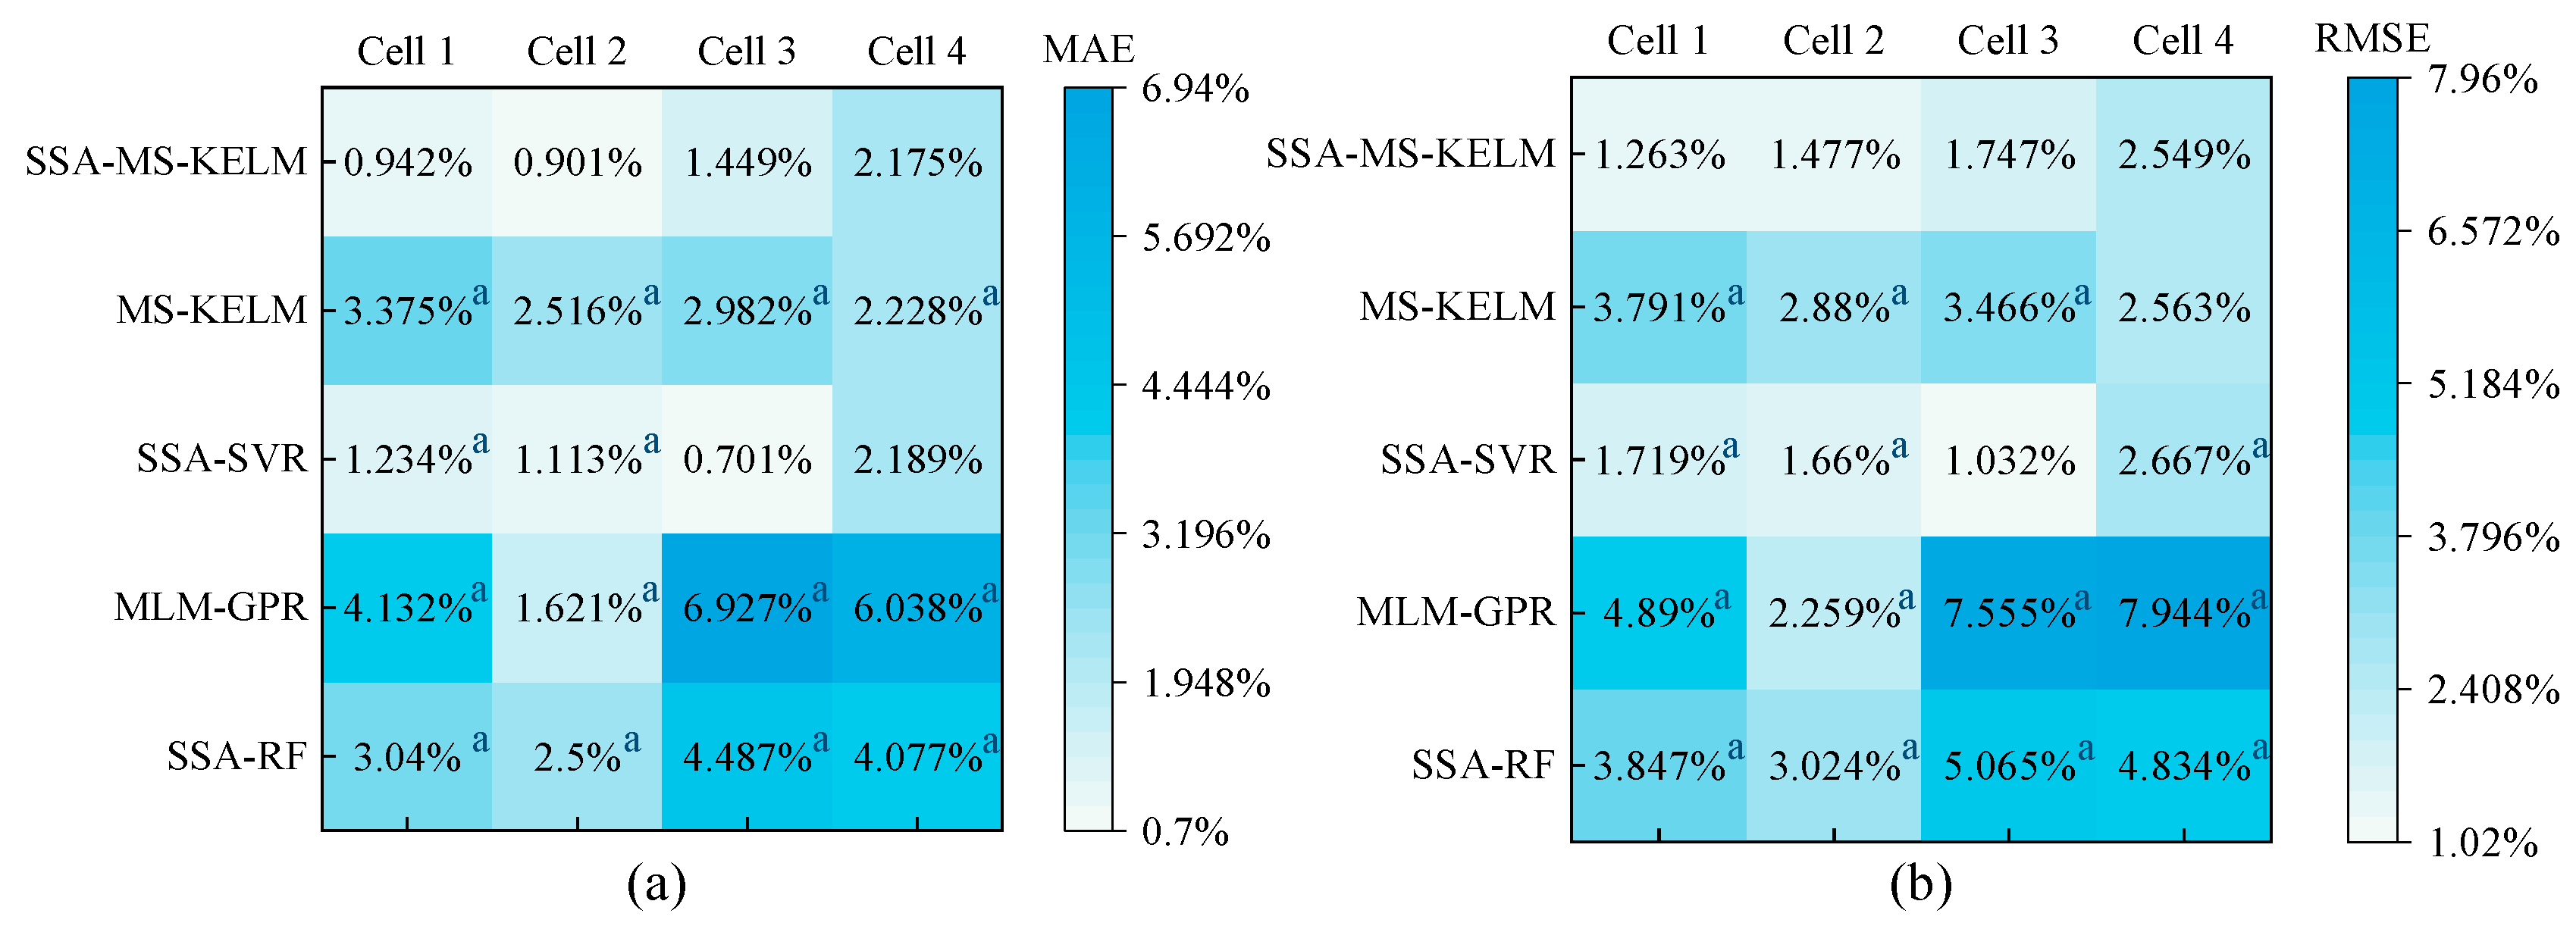
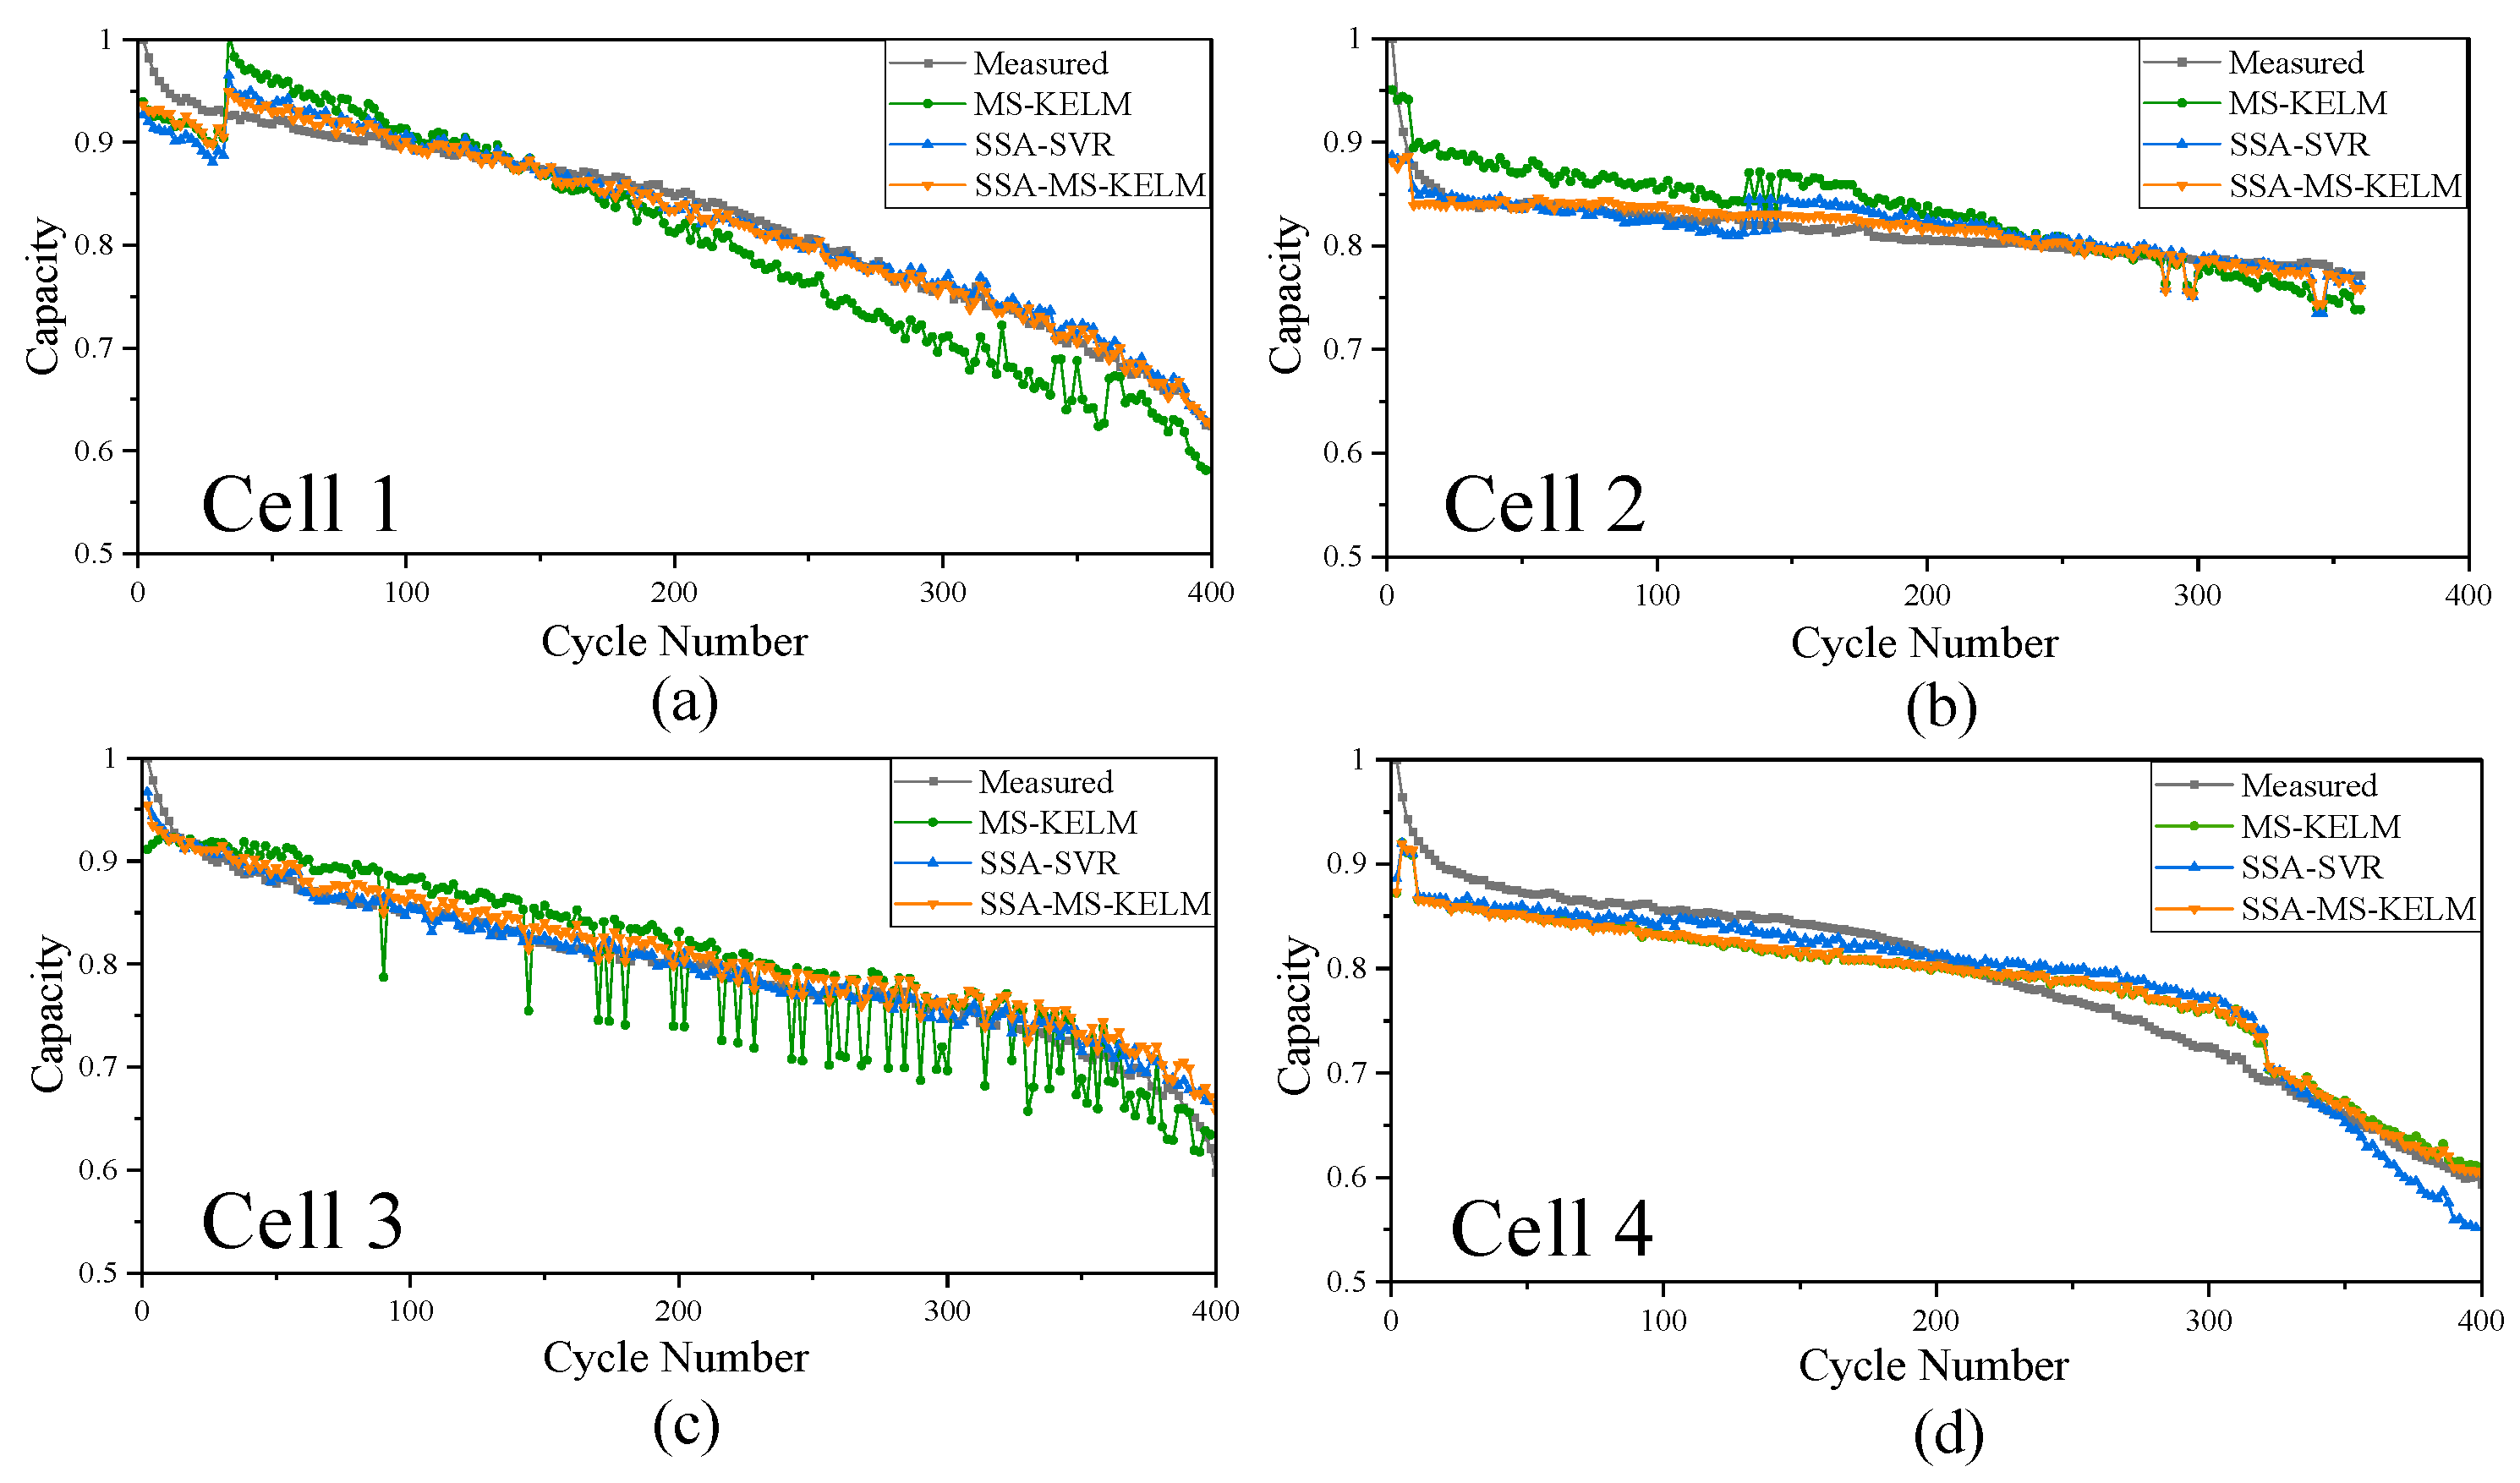
4.3.2. Comparison of Different Estimation Models

To verify the SSA-MS-KELM, Figure 10 summarizes the error metrics of five models using the same dataset, and using the Wilcoxon signed-rank test at a 5% significance level. While time series decomposition methods such as Seasonal and Trend decomposition using Loess (STL) can analyze periodic trends, battery SOH degradation follows complex electrochemical dynamics without clear seasonality, making STL less suitable for this task. As shown in Figure 10, superscript a: the proposed method significantly outperforms this approach. The proposed model is the multi-scale kernel extremum learning machine optimized by the sparrow search algorithm (SSA-MS-KELM). The remaining four models are the multi-scale kernel extremum learning machine with hyper-parameters optimization (MS-KELM), the support vector machine model optimized by the sparrow search algorithm (SSA-SVR), the Gaussian regression model optimized by the maximized marginal likelihood (MLM-GPR) and the random forest model optimized by the sparrow search algorithm (SSA-RF). The estimation results of each method are presented in Figure 11, and the estimation results of MLM-GPR and SSA-RF are not added due to their relatively poor accuracy.
In addition to accuracy, we additionally compared the training time, test time, and memory usage during training and memory usage during testing of MS-KELM, SVR, GPR and RF, all experiments under the same hard conditions. The average time-consuming and memory usage of different models in cross-validation are shown in Figure 12. As can be seen from Figure 12, although the training process of the proposed method requires certain computing resources, it still consumes less resources than the other models. In addition, this method can be trained offline, and does not require real-time calculations. For BMS online reasoning, MS-KELM only involves lightweight matrix operations and has faster response times. It can be seen that MS-KELM is significantly better than the other models in terms of time efficiency, as its training and testing time is only 1/4 to 1/30 of those of SVR and GPR. In terms of memory consumption, MS-KELM takes up about 18–19% less space than the comparative model.
All the methods in Figure 11 can achieve a good performance, yet the proposed method obtains the best accuracy. SSA-MS-KELM performs well on all the test conditions with the lowest MAE and RMSE. From the SSA-MS-KELM and MS-KELM, the SSA improves the estimation accuracy of the MS-KELM model. By optimizing the parameters, such as kernel width and regularization parameters, the impact of human intervention and experience dependence is mitigated. This enhancement not only improves the model’s capacity to capture intricate nonlinear relationships but also leads to a substantial improvement in the model’s ability to estimate SOH.
From a comparison of the five models, it can be seen that the SSA-MS-KELM model outperforms the other four models in all the cases except for SSA-SVR performing better than SSA-MS-KELM in Cell 3. The MAE and RMSE of the proposed method show significant advantages compared with the other models. The performance of Cell 3 in SSA-SVR can be possibly attributed to the SVR’s superiority in capturing the local nonlinear relationships. Compared with SSA-MS-KELM, SSA-SVR exhibits a substantial disadvantage regarding computational complexity. The training process of SVR necessitates the resolution of quadratic programming, and selecting its parameters is both sensitive and time-consuming. The computational complexity of SVR escalates sharply with the augmentation of sample size and the dimensionality of features, resulting in prolonged training time. When cross-validating on four battery samples, the MAE and RMSE fluctuations of SSA-SVR are 1.488% and 1.635%, which are larger than the 1.274% and 1.286% of SSA-MS-KELM. When the other three estimation models are cross-validated, the error fluctuations of their MAE and RMSE are 5.603%, 5.306%, 1.987%, and 1.228%, 5.685%, 2.041%, respectively. Looking at the error fluctuations of MAE and RMSE, the model proposed in this article can adapt to different data. The requirements show superior generalization ability and high accuracy on all three models.
The above results indicate that compared with other models, the proposed model’s stability and accuracy are more prominent when processing diverse data. Other models’ performance on specific datasets fluctuates widely, which may reflect their limitations in processing specific types of data features. Therefore, choosing an appropriate algorithm is crucial to ensure the accuracy and reliability of battery health estimates.

5. Conclusions

This paper proposes an HF extraction method for LIBs SOH estimation by integrating the ECM with DRT, which can achieve accurate SOH by optimizing the hyperparameters of the multiscale KELM with SSA. 9-dimensional ECM-based HFs and 28-dimensional DRT-based HFs are extracted from the 120-dimensional EIS curves of the LIBs and screened for the most critical HFs using the RF algorithm. By using the selected HFs and SSA based KELM, the estimation accuracy and the generalization ability of the battery SOH estimation are significantly improved.
Compared with individual ECM parameter features, the proposed method has a higher estimation accuracy. The proposed method also achieves a higher estimation efficiency compared with DRT-based HFs. In terms of estimation accuracy and generalization ability, the MAE and RMSE of SSA-MS-KELM for the SOH estimation of the four cells are 0.942%, 0.901%, 1.449%, 2.175% and 1.263%, 1.477%, 1.747%, 2.549%, respectively. Compared with other comparison methods, the proposed method has a lower MAE and RMSE and smaller error fluctuations, which prove the advantages of our method.
In addition, factors such as temperature, charging and discharging rates, aging conditions, and different states of charge (SOCs) can be further studied to develop an efficient and accurate EIS-based battery SOH estimation model for BMS. Furthermore, we will investigate the generalizability of the proposed method across different battery chemistries and pack configurations to enhance its adaptability to a wider range of applications.

Author Contributions

Conceptualization, J.P. and Y.G.; methodology, J.P. and Y.G.; software, J.P., Y.G. and L.C.; validation, C.S., L.C. and M.Z.; formal analysis, J.P., Y.G. and H.L.; investigation, L.C., M.Z. and H.L.; writing—original draft preparation, J.P. and Y.G.; writing—review and editing, J.P. and L.C. All authors have read and agreed to the published version of the manuscript.

Funding

This work is supported by the Natural Science Foundation of China under Grant 62372369.

Institutional Review Board Statement

Not applicable.

Informed Consent Statement

Not applicable.

Data Availability Statement

Data will be made available on request.

Conflicts of Interest

The authors declare no conflicts of interest.

Nomenclature

SOHState of health
LIBsLithium-ion batteries
EISElectrochemical impedance spectroscopy
ECMEquivalent circuit model
DRTDistribution of relaxation times
MS-KELMMulti-scale kernel extreme learning machine
SSASparrow Search Algorithm
MAEMean absolute error
RMSERoot mean square error
SVRSupport vector regression
GPRGaussian process regression
EVsElectric vehicles
BMSBattery management system
ICAIncremental capacity analysis
DVADifferential voltage analysis
EIREquivalent internal resistance
RULRemaining useful life
SEISolid electrolyte interface
HFsHealth features
ANNArtificial Neural Networks
LSSVRLeast square support vector regression
HIsHealth indicators
ARDAutomatic relevance determination
MRMRMinimum Redundancy Maximum Relevance
KELMKernel extreme learning machine
RFRandom forest
RBFRadial basis function
SSA-MS-KELMMulti-scale kernel extremum learning machine by the sparrow search algorithm
CPEConstant phase elements
PHPeak Height
PPPeak Position
VHValley Height
VPValley Position
HPAHalf Peak Area
PPRPeak to Total Peak Ratio
VVRValley to Total Valley Ratio
CCconstant current
CVconstant voltage
STLSeasonal and Trend decomposition using Loess
SSA-SVRsupport vector machine model optimized by the sparrow search algorithm
MLM-GPRGaussian regression model optimized by the maximized marginal likelihood
SSA-RFrandom forest model optimized by the sparrow search algorithm

References

  1. Ritchie, H.; Roser, M. Sector by Sector: Where Do Global Greenhouse Gas Emissions Come from? Our World in Data. 18 September 2020. Available online: https://ourworldindata.org/ghg-emissions-by-sector (accessed on 8 April 2025).
  2. Ding, Y.; Cano, Z.P.; Yu, A.; Lu, J.; Chen, Z. Automotive Li-Ion Batteries: Current Status and Future Perspectives. Electrochem. Energy Rev. 2019, 2, 1–28. [Google Scholar] [CrossRef]
  3. Peng, J.; Meng, J.; Chen, D.; Liu, H.; Hao, S.; Sui, X.; Du, X. A Review of Lithium-Ion Battery Capacity Estimation Methods for Onboard Battery Management Systems: Recent Progress and Perspectives. Batteries 2022, 8, 229. [Google Scholar] [CrossRef]
  4. Gismero, A.; Schaltz, E.; Stroe, D.-I. Recursive State of Charge and State of Health Estimation Method for Lithium-Ion Batteries Based on Coulomb Counting and Open Circuit Voltage. Energies 2020, 13, 1811. [Google Scholar] [CrossRef]
  5. Tan, X.; Tan, Y.; Zhan, D.; Yu, Z.; Fan, Y.; Qiu, J.; Li, J. Real-Time State-of-Health Estimation of Lithium-Ion Batteries Based on the Equivalent Internal Resistance. IEEE Access 2020, 8, 56811–56822. [Google Scholar] [CrossRef]
  6. Guha, A.; Patra, A. State of Health Estimation of Lithium-Ion Batteries Using Capacity Fade and Internal Resistance Growth Models. IEEE Trans. Transport. Electrific. 2018, 4, 135–146. [Google Scholar] [CrossRef]
  7. Simolka, M.; Heger, J.-F.; Traub, N.; Kaess, H.; Friedrich, K.A. Influence of Cycling Profile, Depth of Discharge and Temperature on Commercial LFP/C Cell Ageing: Cell Level Analysis with ICA, DVA and OCV Measurements. J. Electrochem. Soc. 2020, 167, 110502. [Google Scholar] [CrossRef]
  8. Nuroldayeva, G.; Serik, Y.; Adair, D.; Uzakbaiuly, B.; Bakenov, Z. State of Health Estimation Methods for Lithium-Ion Batteries. Int. J. Energy Res. 2023, 2023, 4297545. [Google Scholar] [CrossRef]
  9. Hu, W.; Peng, Y.; Wei, Y.; Yang, Y. Application of Electrochemical Impedance Spectroscopy to Degradation and Aging Research of Lithium-Ion Batteries. J. Phys. Chem. C 2023, 127, 4465–4495. [Google Scholar] [CrossRef]
  10. Zhou, Y.; Dong, G.; Tan, Q.; Han, X.; Chen, C.; Wei, J. State of Health Estimation for Lithium-Ion Batteries Using Geometric Impedance Spectrum Features and Recurrent Gaussian Process Regression. Energy 2023, 262, 125514. [Google Scholar] [CrossRef]
  11. Peng, J.; Meng, J.; Du, X.; Cai, L.; Stroe, D.-I. A Fast Impedance Measurement Method for Lithium-Ion Battery Using Power Spectrum Property. IEEE Trans. Ind. Informat. 2023, 19, 8253–8261. [Google Scholar] [CrossRef]
  12. Jiang, B.; Zhu, J.; Wang, X.; Wei, X.; Shang, W.; Dai, H. A Comparative Study of Different Features Extracted from Electrochemical Impedance Spectroscopy in State of Health Estimation for Lithium-Ion Batteries. Appl. Energy 2022, 322, 119502. [Google Scholar] [CrossRef]
  13. Meng, J.; Peng, J.; Cai, L.; Song, Z. Rapid Impedance Extraction for Lithium-Ion Battery by Integrating Power Spectrum and Frequency Property. IEEE Trans. Ind. Electron. 2024, 71, 7220–7229. [Google Scholar] [CrossRef]
  14. Kim, S.; Choi, Y.Y.; Choi, J.-I. Impedance-Based Capacity Estimation for Lithium-Ion Batteries Using Generative Adversarial Network. Appl. Energy 2022, 308, 118317. [Google Scholar] [CrossRef]
  15. Zhang, Y.; Tang, Q.; Zhang, Y.; Wang, J.; Stimming, U.; Lee, A.A. Identifying Degradation Patterns of Lithium Ion Batteries from Impedance Spectroscopy Using Machine Learning. Nat. Commun. 2020, 11, 1706. [Google Scholar] [CrossRef]
  16. Fu, Y.; Xu, J.; Shi, M.; Mei, X. A Fast Impedance Calculation-Based Battery State-of-Health Estimation Method. IEEE Trans. Ind. Electron. 2022, 69, 7019–7028. [Google Scholar] [CrossRef]
  17. Loechte, A.; Rojas Ruiz, I.; Gloesekoetter, P. Battery State Estimation with ANN and SVR Evaluating Electrochemical Impedance Spectra Generalizing DC Currents. Appl. Sci. 2022, 12, 274. [Google Scholar] [CrossRef]
  18. Cai, L.; Meng, J.; Stroe, D.-I.; Peng, J.; Luo, G.; Teodorescu, R. Multiobjective Optimization of Data-Driven Model for Lithium-Ion Battery SOH Estimation with Short-Term Feature. IEEE Trans. Power Electron. 2020, 35, 11855–11864. [Google Scholar] [CrossRef]
  19. Wang, L.; Xie, L.; Yang, Y.; Zhang, Y.; Wang, K.; Cheng, S. Distributed Online Voltage Control with Fast PV Power Fluctuations and Imperfect Communication. IEEE Trans. Smart Grid 2023, 14, 3681–3695. [Google Scholar] [CrossRef]
  20. Zhang, M.; Liu, Y.; Li, D.; Cui, X.; Wang, L.; Li, L.; Wang, K. Electrochemical Impedance Spectroscopy: A New Chapter in the Fast and Accurate Estimation of the State of Health for Lithium-Ion Batteries. Energies 2023, 16, 1599. [Google Scholar] [CrossRef]
  21. Cui, Z.; Wang, L.; Li, Q.; Wang, K. A Comprehensive Review on the State of Charge Estimation for Lithium-Ion Battery Based on Neural Network. Int. J. Energy Res. 2022, 46, 5423–5440. [Google Scholar] [CrossRef]
  22. Cui, Z.; Kang, L.; Li, L.; Wang, L.; Wang, K. A Combined State-of-Charge Estimation Method for Lithium-Ion Battery Using an Improved BGRU Network and UKF. Energy 2022, 259, 124933. [Google Scholar] [CrossRef]
  23. Wang, K.; Li, L.; Yin, H.; Zhang, T.; Wan, W. Thermal Modelling Analysis of Spiral Wound Supercapacitor under Constant-Current Cycling. PLoS ONE 2015, 10, e0138672. [Google Scholar] [CrossRef]
  24. Sun, X.; Zhang, Y.; Zhang, Y.; Wang, L.; Wang, K. Summary of Health-State Estimation of Lithium-Ion Batteries Based on Electrochemical Impedance Spectroscopy. Energies 2023, 16, 5682. [Google Scholar] [CrossRef]
  25. Yang, D.; Wang, Y.; Pan, R.; Chen, R.; Chen, Z. State-of-Health Estimation for the Lithium-Ion Battery Based on Support Vector Regression. Appl. Energy 2018, 227, 273–283. [Google Scholar] [CrossRef]
  26. Su, X.; Sun, B.; Wang, J.; Zhang, W.; Ma, S.; He, X.; Ruan, H. Fast Capacity Estimation for Lithium-Ion Battery Based on Online Identification of Low-Frequency Electrochemical Impedance Spectroscopy and Gaussian Process Regression. Appl. Energy 2022, 322, 119516. [Google Scholar] [CrossRef]
  27. Zhu, Y.; Jiang, B.; Zhu, J.; Wang, X.; Wang, R.; Wei, X.; Dai, H. Adaptive State of Health Estimation for Lithium-Ion Batteries Using Impedance-Based Timescale Information and Ensemble Learning. Energy 2023, 284, 129283. [Google Scholar] [CrossRef]
  28. Iurilli, P.; Brivio, C.; Wood, V. Detection of Lithium-Ion Cells’ Degradation through Deconvolution of Electrochemical Impedance Spectroscopy with Distribution of Relaxation Time. Energy Technol. 2022, 10, 2200547. [Google Scholar] [CrossRef]
  29. Wang, J.; Zhao, R.; Huang, Q.-A.; Wang, J.; Fu, Y.; Li, W.; Bai, Y.; Zhao, Y.; Li, X.; Zhang, J. High-Efficient Prediction of State of Health for Lithium-Ion Battery Based on AC Impedance Feature Tuned with Gaussian Process Regression. J. Power Sources 2023, 561, 232737. [Google Scholar] [CrossRef]
  30. Tröltzsch, U.; Kanoun, O.; Tränkler, H.-R. Characterizing Aging Effects of Lithium Ion Batteries by Impedance Spectroscopy. Electrochim. Acta 2006, 51, 1664–1672. [Google Scholar] [CrossRef]
  31. Peng, J.; Meng, J.; Wu, J.; Deng, Z.; Lin, M.; Mao, S.; Stroe, D.-I. A Comprehensive Overview and Comparison of Parameter Benchmark Methods for Lithium-Ion Battery Application. J. Energy Storage 2023, 71, 108197. [Google Scholar] [CrossRef]
  32. Nohl, M.; Raut, G.; Wolf, S.E.; Duyster, T.; Dittrich, L.; Vinke, I.C.; Eichel, R.-A.; Haart, L.G.J.D. Analysis of the DRT as Evaluation Tool for EIS Data Analysis. ECS Trans. 2021, 103, 1403. [Google Scholar] [CrossRef]
  33. Wang, J.; Huang, Q.; Li, W.; Wang, J.; Zhuang, Q.; Zhang, J. Fundamentals of Distribution of Relaxation Times for Electrochemical Impedance Spectroscopy. J. Electrochem. 2020, 26, 16. [Google Scholar] [CrossRef]
  34. Xia, J.; Wang, C.; Wang, X.; Bi, L.; Zhang, Y. A Perspective on DRT Applications for the Analysis of Solid Oxide Cell Electrodes. Electrochim. Acta 2020, 349, 136328. [Google Scholar] [CrossRef]
  35. Wan, T.H.; Saccoccio, M.; Chen, C.; Ciucci, F. Influence of the Discretization Methods on the Distribution of Relaxation Times Deconvolution: Implementing Radial Basis Functions with DRTtools. Electrochim. Acta 2015, 184, 483–499. [Google Scholar] [CrossRef]
  36. Lu, Y.; Zhao, C.-Z.; Huang, J.-Q.; Zhang, Q. The Timescale Identification Decoupling Complicated Kinetic Processes in Lithium Batteries. Joule 2022, 6, 1172–1198. [Google Scholar] [CrossRef]
  37. Chen, J.; Liu, Y.; Yong, J.; Yang, C.; Yan, L.; Zheng, Y. State of Health Estimation of Lithium-Ion Batteries Using Fusion Health Indicator by PSO-ELM Model. Batteries 2024, 10, 380. [Google Scholar] [CrossRef]
  38. Liu, X.; Wang, L.; Huang, G.-B.; Zhang, J.; Yin, J. Multiple Kernel Extreme Learning Machine. Neurocomputing 2015, 149, 253–264. [Google Scholar] [CrossRef]
  39. Xue, J.; Shen, B. A Novel Swarm Intelligence Optimization Approach: Sparrow Search Algorithm. Syst. Sci. Control Eng. 2020, 8, 22–34. [Google Scholar] [CrossRef]
  40. Gharehchopogh, F.S.; Namazi, M.; Ebrahimi, L.; Abdollahzadeh, B. Advances in Sparrow Search Algorithm: A Comprehensive Survey. Arch. Comput. Methods Eng. 2023, 30, 427–455. [Google Scholar] [CrossRef]
Figure 1. Technical routes for the SOH estimation in this work.
Wevj 16 00224 g001
Figure 2. The DRT curve from a battery sample (Cell 3, defined in Section 4.1, as an example).
Wevj 16 00224 g002
Figure 3. The peak and valley features extracted from DRT curve (Cell 3 as an example, Cell 3 defined in Section 4.1).
Wevj 16 00224 g003
Figure 4. HF selection process.
Wevj 16 00224 g004
Figure 5. HFs variation with battery aging (Cell 3 as an example, Cell 3 defined in Section 4.1).
Wevj 16 00224 g005
Figure 6. SSA-MS-KELM model.
Wevj 16 00224 g006
Figure 7. The EIS curves of Cell 1–4: (a) Cell 1, (b) Cell 2, (c) Cell 3, and (d) Cell 4.
Wevj 16 00224 g007
Figure 8. The cross-validation results for SOH estimation: (a) Cell 1, (b) Cell 2, (c) Cell 3, and (d) Cell 4.
Wevj 16 00224 g008
Figure 9. The MAE and RMSE of the proposed HF, Feature 2, and Feature 3: (a) MAE, and (b) RMSE.
Wevj 16 00224 g009
Figure 10. A comparison of the MAE and RMSE on different models: (a) MAE, and (b) RMSE.
Wevj 16 00224 g010
Figure 11. The SOH estimation results for the comparison models: (a) Cell 1, (b) Cell 2, (c) Cell 3, and (d) Cell 4.
Wevj 16 00224 g011
Figure 12. A comparison of the time and memory on different models: (a) train and test time in seconds, and (b) train and test memory usage in MB.
Wevj 16 00224 g012
Table 1. Comparison of related references.
ReferencesFeature SelectionModelAdvantageDisadvantage
[15]EIS dataGPREasy to obtain featuresIt may have limited feature interpretability and involve some redundant computations.
[16]ANN, SVREasy to applyIt may have limited feature interpretability.
[26]Six key health features from EIS dataGPRHigh accuracyIt may introduce relatively high complexity.
[25]Battery modeling identification parametersLSSVRInterpretable featuresThe method could be relatively resource-intensive.
[29]Six key health features from DRT curvesGPRRobustIt may face challenges in feature interpretability and computational complexity.
proposedNine key health features from ECM and DRTSSA-MS-KELMBalanced features, low complexity/
Table 2. DRT peaks’ attribution: physical processes and main reasons (take the number of peaks in Figure 2 as an example).
DRT Peaks
Peak 1Peak 2Peak 3Peak 4Peak 5Peak 6
Physical processElectric and magnetic effectsSEI Growth/decomposition; Li platingCathode charge transfer/CEICathode charge transferGraphite degradationDiffusion processes
Main reasonParticle–particle and particle–collector interactionsSEI layer of graphiteCathodeAnode charge transferKinetic slow down
Table 3. Characterization of relaxation time distribution parameters (abbreviations are defined in Section 2.1.2).
CategoryFeatures
Height of the four peaksPH 1PH 2PH 3PH 4
Location of the four peaksPP 1PP 2PP 3PP 4
Height of the four valleysVH 1VH 2VH 3VH 4
Location of the four valleysVP 1VP 2VP 3VP 4
Half-peak area of the four peaksHPA 1HPA 2HPA 3HPA 4
The ratio of four peak heights to the sum of peak heightsPPR 1PPR 2PPR 3PPR 4
The ratio of four valley heights to the sum of valley heightsVVR 1VVR 2VVR 3VVR 4
Disclaimer/Publisher’s Note: The statements, opinions and data contained in all publications are solely those of the individual author(s) and contributor(s) and not of MDPI and/or the editor(s). MDPI and/or the editor(s) disclaim responsibility for any injury to people or property resulting from any ideas, methods, instructions or products referred to in the content.

