Abstract
Traction motors in electric transport are most often synchronous permanent magnet motors (PMSMs). Induction motors (IMs) have large dimensions and stator current amplitudes under comparable loads. Traditional IM control methods do not solve these problems. Recent studies have shown that by changing the main magnetic flux in the IM in accordance with the load, these characteristics of the asynchronous electric drive can be significantly improved. Standard frequency converters do not allow for the implementation of these algorithms. But it makes sense to conduct a potential assessment of the capabilities of this algorithm to reduce the total stator currents of traction IMs. This article analyzes the results of real tests of a special vehicle for transporting rock inside mines, conducted several years ago at a mining equipment plant and in several mines in Russia. The prototype of the special transport vehicle has a load capacity of 15 tons, and its traction electric drive is based on four motor wheels with a total power of 100 kW and a frequency converter from the company “Vacon” (Vaasa, Finland). The tests were conducted at the plant’s testing ground and in real mine conditions. These tests allowed us to obtain information about the operation of the asynchronous electric drive under dynamically changing loads in a wide range, which is very difficult to obtain on laboratory benches or in industrial enterprise conditions. The experiments confirmed the efficiency of the optimization algorithm for asynchronous electric drives with frequency control. At the same time, the weight, size, and electrical parameters of the drive are as close as possible to those of direct current drives.
1. Introduction
Unlike most electric vehicles, special mining transport vehicles widely use a frequency-controlled traction electric drive based on an induction motor (IM). IMs are reliable and can operate in explosive environments without special sealed structures. Their prices are also significantly lower than PMSM prices.
However, IMs with standard control algorithms have several significantly worse indicators compared to PMSMs. First of all, these are weight and size characteristics and high stator currents. These disadvantages are not too significant for stationary industrial units, but for transport, they are decisive. Therefore, it is important to answer the following question: is it possible to improve these indicators by adjusting traditional IM control methods?
Traditional methods of AC motor analysis are based on Park equations, equivalent circuits, and vector diagrams. Therefore, they are used as the basis for “traditional” methods of controlling variable frequency drives (VFDs) [1,2,3,4] (Figure 1). These methods include a scalar, sensorless vector, vector with feedback [5,6,7,8,9], and “direct torque control”. All these algorithms limit the main magnetic flux in the IMs. In the control algorithm, the main magnetic flux is estimated by the ratio of the stator voltage amplitude to its frequency. At nominal parameters, a certain ratio is established in the IM between the active and reactive stator currents, close to the nominal values.
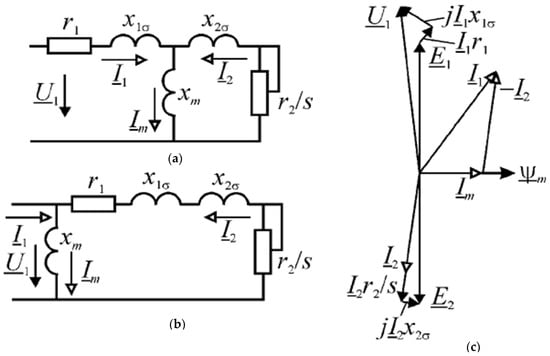
Figure 1.
T-shaped (a) and L-shaped (b) equivalent circuits of an induction motor and its vector diagram (c).
For electric drives of stationary units, it is important to limit the reactive component of the stator current, since excess reactive power affects power systems, but for autonomous electrical installations, it is more important to obtain the minimum possible amplitude of stator currents. Large current values lead to undesirable values of voltage drops in current-supplying cables or to a rapid discharge of power batteries or simply to current overloads and frequency converter shutdowns under heavy loads, which transport drives cannot avoid.
In the article in [10], an algorithm for minimizing the total stator current of an induction motor under load was proposed. The algorithm is based on a simplification of the equivalent circuit and the vector diagram of an induction motor. The exact T-shaped and more visual L-shaped equivalent circuits are shown in Figure 1a and Figure 1b, respectively. The diagrams show the stator current I1, rotor current I2, magnetization current Im, and stator voltage U1. Active resistances r1 and r2 take into account the active resistance of the stator and rotor circuits, respectively. Inductive resistances x1σ, x2σ, and xm take into account leakage inductances of the stator and rotor and the inductance of the magnetization circuit, respectively. The IM vector diagram is shown in Figure 1c.
2. Problem Statement
The magnetization circuits and the real circuits of the stator and rotor are separated in the L-shaped circuit. Considering that the drops in the active and inductive circuits of the motor are within 8–10% of the voltage on the stator, this separation does not introduce significant errors. In the proposed algorithm, the separation of the active and reactive circuits of the induction motor is “deeper”. The rotor inductance and the active resistance of the stator are neglected. Then, the L-shaped circuit becomes a circuit with parallel magnetization and rotor circuits (Figure 2a). This circuit is even more visual for assessing the active and reactive currents of the induction motor. The load determines the slip s and through it forms the active current I2 (or rotor current). The magnetization current Im (reactive current) is determined by the amplitude U and the frequency of the stator voltage f, and its value is almost independent of the load.
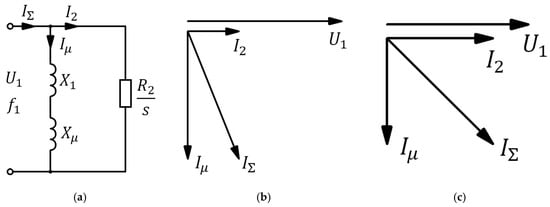
Figure 2.
Simplified equivalent circuit of IM (a) and vector diagrams of currents at idle (b) and load (c) modes.
The total stator current IΣ is the vector sum of the active I2 and reactive Iμ currents (Figure 2b).
The reactive current Iμ is proportional to the voltage amplitude and is determined by the equation
The active current I2 can be determined from the equivalent circuit through the slip s, obtained from the simplified Kloss formula
Hence, the slip s for the torque M is determined by the following equation
Since Mk is proportional to , then
Then, the active current of the induction motor or rotor current can be calculated as follows
That is, the amplitudes of the magnetization currents (reactive current) and the rotor current (active current) are opposite in relation to the amplitude of the stator voltage
The vector sum of these currents has a clearly defined minimum when they are equal (Figure 2c),
Voltage forms the minimum of the total current. Active and reactive currents have equal amplitudes:
All these calculations are proven in detail in [10] and have been repeatedly confirmed experimentally.
It is very problematic to determine the constant coefficients A and B in experiments with real electric drives. Therefore, it is advisable to develop a calculation method using experimental data (the values of the total stator currents I1Σ, with a voltage amplitude U11 and a frequency f1) in the idle mode, and at a specific load. At minimum load, the total stator current is close to the reactive current. And the active current is close to zero. That is,
In the load mode, the total stator current is I1Σ, the voltage is U12, and the frequency is f1. Assuming that the parameters of the equivalent circuit have not changed, we obtain the value of the reactive current:
The voltage on the stator that provides the minimum current for a given load will be determined as
The minimum total stator current at this load is determined by
Thus, if the stator current at no-load and the total current at a specific load are known (with known values of the stator voltage amplitude and its frequency), then it is possible to calculate the voltage amplitude at which the total current will be minimal for a given load and determine the value of this current.
According to the proposed method, it is possible to estimate the potential for reducing the total stator currents only by changing the main magnetic flux of the IM by changing the U/f-ratio.
When using the proposed control algorithm, it is necessary to operate with physical categories, namely active and reactive currents, in contrast to abstract projections of stator currents on the d and q axes [6,7,8,9].
3. Experiment Results
An electric vehicle for the mining industry is designed for transportation over short distances (up to 1000 m) of large masses of coal or other rock mined in underground mines. Most of such machines of well-known companies have similar designs. The power electric voltage is supplied to the vehicle via a three-phase cable. The weight of the loaded vehicle reaches 35 tons. The speed of movement varies from 1 to 9 km/h. The traction electric drive of the vehicle is four wheel motors with asynchronous squirrel-cage electric motors, with a total rated power of 100 kW, connected in parallel to a Vacon frequency converter with a power of 150 kW (the power is overestimated for work with overloads). The total rated current of the motors is 100 A, and the voltage supplied to the stators of the motors connected in parallel has a rated values frequency of 50 Hz and an amplitude of 660 V.
The vehicle is designed for movement in underground mines. According to its technical characteristics, the permissible unevenness of the route is ±5–7° from the horizontal direction, no more than 10% of the route length. However, real routes may have other parameters—longer slopes. Overloads of the traction drive by the developed torque are the main problems of vehicle movement. It is impossible to limit movement along underground routes. The load at maximum elevation angles reaches 200–250% of the nominal; this leads to overloads in stator currents and requires either a significant increase in the power (and cost) of the frequency converter or modernization of the control methods for asynchronous electric drives. These prospects for increasing the efficiency of the AM are of interest for all electric transport. The connection diagram is shown in Figure 3.
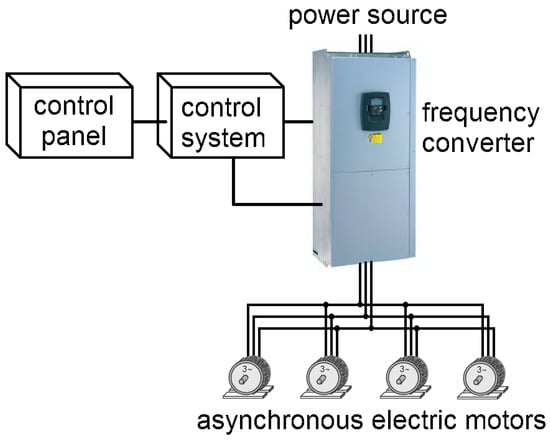
Figure 3.
Connection diagram of the traction electric drive of a special vehicle.
The Vacon frequency converter operates in the mode of maintaining the stator voltage frequency or the motor rotation speed. As follows from the signal diagrams recorded by the NC-drive program, both of these modes are variants of the “traditional” scalar control. In the speed maintenance mode, IR compensation of the stator voltage occurs, which is clearly observed by the monitor program. Compensation in this algorithm is not aimed at reducing the total stator current; it only compensates for the speed drop. To compensate for the speed drop under load, with an increase in the amplitude of the stator current, the amplitude and frequency of the stator voltage increase. The magnitude of stator currents, as a rule, is of little interest to industrial electric drives. Firstly, they are usually designed with a power reserve, and secondly, the dimensions of the motor and the frequency converter are not very important for stationary units. Only in transport are the weight and dimensions of the equipment very important, as well as possible overheating of the motor and the frequency converter. In industrial drives of stationary units, the load is almost always known and, as a rule, changes little. And for a vehicle, it is impossible to choose the “correct” route of movement in a mine without large climbs, and it is difficult to quickly select the required speed for a specific section of movement, avoiding significant surges in the stator current.
According to “traditional” algorithms, voltage correction due to the increase in the stator current does not exceed 10% of the nominal voltage. At the same time, the frequency also increases to maintain the main magnetic flux.
This is due to various reasons. This correction is positive feedback and can cause oscillation or instability in the engine counter-EMF circuit.
During the experiments with the vehicle, it was not possible to change this algorithm. Therefore, based on the results of the experiments, the action of the “traditional” correction mechanism was assessed, and the prospects for improving the drive correction mechanism for deep regulation of the main magnetic flux were estimated using a calculation method.
During the tests, the vehicle was driven at three fixed speeds along one track. The operating parameters of the traction electric drive were recorded using the NC drive program. This program made it possible to obtain accurate visual diagrams of changes in the amplitude values of the FC current (I), frequency, and stator voltage amplitude (U, f). The calculated torque diagrams allow for (T) a qualitative assessment of the accuracy of the active stator currents calculated using the proposed method (Figure 4, Figure 5, Figure 6 and Figure 7).
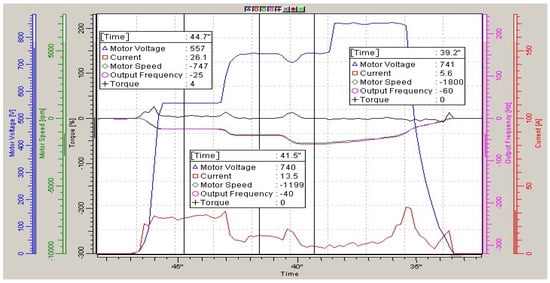
Figure 4.
Diagrams of vehicle movement on the factory proving ground.
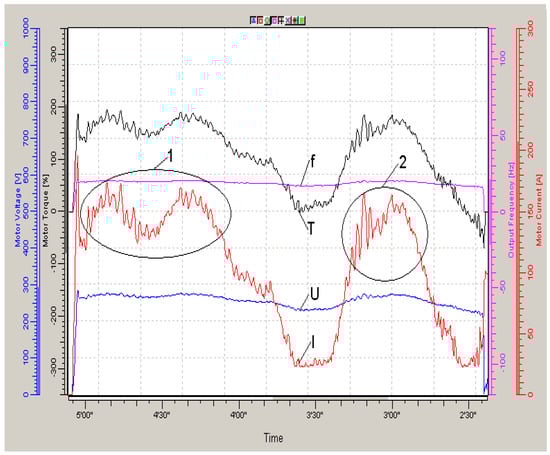
Figure 5.
Traction electric drive diagrams when driving on the 1st route at a speed of 3 km/h. I—current, f—stator voltage frequency, U—stator voltage amplitude, T—calculated torque, 1 and 2—parts of path with maximum load.
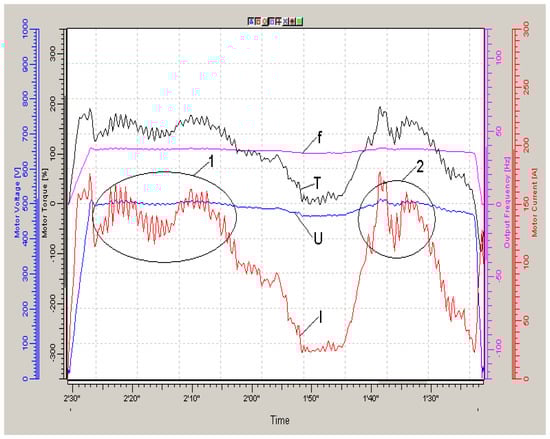
Figure 6.
Traction electric drive diagrams when driving on the 1st route at a speed of 6 km/h. I—current, f—stator voltage frequency, U—stator voltage amplitude, T—calculated torque, 1 and 2—parts of path with maximum load.
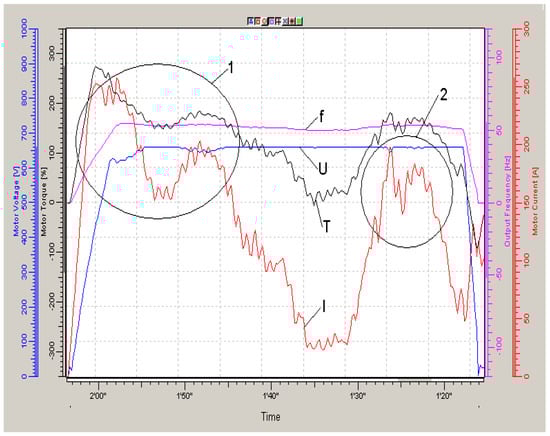
Figure 7.
Traction electric drive diagrams when driving on the 1st route at a speed of 9 km/h. I—current, f—stator voltage frequency, U—stator voltage amplitude, T—calculated torque, 1 and 2—parts of path with maximum load.
3.1. Experiment 1
Vehicle movement on the test track of the factory proving ground. There are no large slopes on this track, so there are no significant rapid changes in the currents and calculated moments.
In the section of movement from the 30th to the 43rd second, the calculated torque is close to zero; therefore, the total stator current is a reactive current, while the voltage amplitude on the stators of electric motors is 741 V and the frequency is 60 Hz; this current is 6 A (from 30 to 40 s).
With a voltage amplitude of 740 V and a frequency of 40 Hz, the current is 13 A (41–43 = seconds).
Under a load of 4% of the nominal torque (43–47 s) with an amplitude of 557 V and a frequency of 25 Hz, the total current was 26 A, and the reactive current calculated according to the methodology, according to the simplified equivalent circuit, was 18 A. The active current can be determined by the rules for adding mutually perpendicular vectors (Figure 2b,c); its value will be 20 A.
This is 20% of the nominal value of the currents. The torque calculated by the NC-drive program is 4%, which corresponds to the square of the current share (0.2 Iн)2 ≈ 0.04 Mн. That is, the experiment showed the sufficient accuracy of the calculations according to the proposed method. It is necessary to pay attention to the absence of the oscillation of the average values of the stator currents.
3.2. Experiment 2
For the experiments, a section of the route 160–170 m long was selected in a mine with a general slope “up” of 3–4 degrees with three rises with elevation angles of 10–12 degrees. The vehicle moved at three speeds: low (3 km/h), medium (6 km/h), and high (9 km/h).
For movement at low speed, a voltage of 240–290 V amplitude at a frequency of 16–17 Hz was generated in the frequency converter, supplied to four parallel-connected motors. The diagram of currents, voltage, and calculated torque of the drive in the NC-drive program is shown in Figure 5. Travel time on the highway is 2 min 30 s.
On sections with slopes of 10–12 degrees (“1” and “2”), the drive current varied within 130–160 A. The motors can withstand such a current for 20–30 s, and the frequency converter will remain operational (will not be switched off by overload protection), only if the rated current does not exceed 150 A for a long time. In this regard, the power of the frequency converter was selected to be significantly higher than the total power of four motor wheels, namely 150 kW. It should be noted that the vehicle must move along sections of the route with slopes slightly exceeding the permissible slopes according to the technical characteristics. It is not possible to change routes in mine conditions. As the current diagrams in Figure 6 show, the drive basically meets the requirements for vehicle movement. On overload sections, the voltage amplitude increases and, according to the vector diagrams shown in Figure 3, reduces the active and total current. Below are calculations of average values of active and total currents in overload sections. In the section with a minimum FC current (“3 min 20 s”), the calculated moment is zero; therefore, we consider this current to be reactive for the frequency and voltage of the FC at this time.
When driving along this route at an average speed, the FC voltage changed within 460–500 V at a frequency of 34–35 Hz. The diagrams are shown in Figure 6. Travel time on the highway is 1 min 10 s.
The averaged values of the current, voltage, and torque diagrams are close to the diagrams of movement at low speed. In overload areas, the frequency converter voltage is also adjusted.
When moving at high speed, the frequency converter voltage was 660 V at a frequency of 50 Hz. The diagrams of the traction electric drive operation are shown in Figure 7.
General Analysis of Tests
Characteristics of the route.
The route is about 150–160 m long with a general slope of 4–5 degrees with three elevations up to 10–12 degrees (0.2 radian). The weight of the vehicle (P) is 30 tons, and the rolling force is determined by the following formula:
F = P sin(0.2r) = 5–6 tons
Then, the “rolling” power will vary from 60 kW at low speed to 180 kW at high speed, or from 60% to 180% of the nominal value of the traction electric drive power.
The results of the experiments, the calculated data, and the forecast for the reduction in stator currents are given in Table 1, Table 2, Table 3 and Table 4. The experimental data are the average values of current and voltage on overloaded sections () of traffic and sections with minimal load (, ).

Table 1.
Experimental data.
Table 2.
Calculated data.
Table 3.
Stator currents without correction (forecast 1).
Table 4.
Minimum stator currents (forecast 2).
The calculated data are active () stator currents, calculated according to the equation given in this article (1, 2).
The predicted data are active , reactive and full currents of the drive while maintaining the stator voltage under load and minimum currents with “deep” regulation of the main magnetic flux according to the method proposed in the article.
3.3. Experiment 3
Experiments with the movement of the wagon in the mine were repeated several times. The results of these experiments were generally similar to those discussed above. Figure 8, Figure 9 and Figure 10 show diagrams of the movement of a wagon on a section of track about 200 m long with ascents and descents. The movement was carried out at low, medium, and maximum speeds. Diagrams 8–10 indicate approximately the same total currents of the traction motor stators in the first two diagrams (Figure 8 and Figure 9—moving at low and medium speed) and increasing total currents at the maximum speed (Figure 10) of movement in the lifting section (from 55 s to 1 min 10 s). In the period from 55 s to 1 min 10 s, the changes in current and voltage amplitude are out of phase, which also indicates a significant negative effect of the voltage drop in the cables on the operation of the drive. Reducing the total current of traction motors, which can be achieved by increasing the voltage amplitude at the stators of electric motors from 650 to 1000 V, will also lead to noticeable reductions in electrical power losses in power cables by 25–30 kW, as well as reducing the voltage drop in cables by 100–120 V and improving the controllability of the traction drive. Attention should be paid to the varying amplitude of stator current fluctuations related to the speed of movement and the rate of load change, which, as shown in the articles in [10,11], lead to a change in the linearized frequency characteristics of asynchronous electric motors [12,13,14].
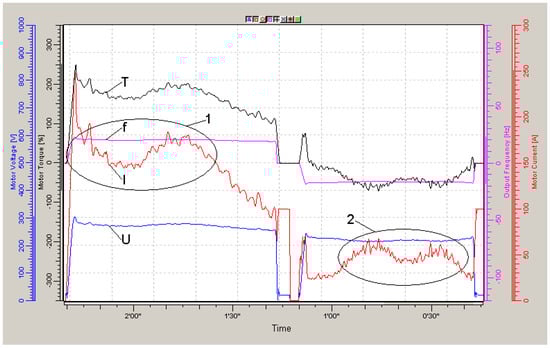
Figure 8.
Traction electric drive diagrams when driving on the 2nd route at a speed of 3 km/h. I—current, f—stator voltage frequency, U—stator voltage amplitude, T—calculated torque, 1 and 2—parts of path with maximum load.
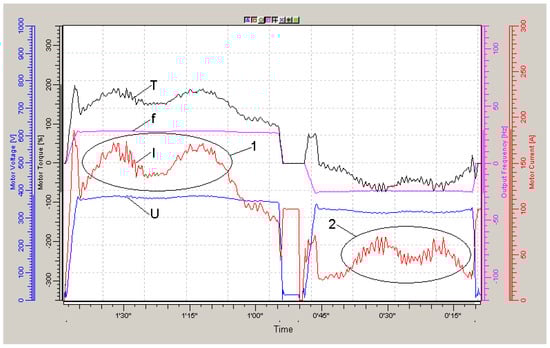
Figure 9.
Traction electric drive diagrams when driving on the 3rd route at a speed of 6 km/h. I—current, f—stator voltage frequency, U—stator voltage amplitude, T—calculated torque, 1 and 2—parts of path with maximum load.
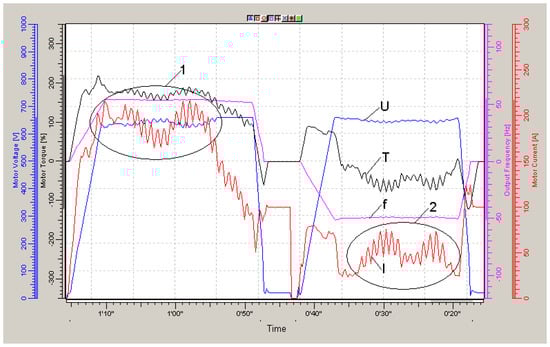
Figure 10.
Traction electric drive diagrams when driving on the 2nd route at a speed of 9 km/h. I—current, f—stator voltage frequency, U—stator voltage amplitude, T—calculated torque, 1 and 2—parts of path with maximum load.
4. Analysis of Experimental Data
The speeds of movement along the section of the route correspond to the specified values, despite significant slopes of the route. Average currents when moving along this section of the route at all speeds do not exceed the total nominal values of four traction asynchronous motors, namely 100 A. Average values are significantly less than the nominal current of the frequency converter (150 A).
On sections with a maximum slope at low and medium speeds, the drive currents are approximately the same and equal to 140–150 A.
Active currents of the electric drive calculated according to simplified equivalent circuits vary within 135–140 A; the active torque calculated in the NS drive program is 140%.
Stator voltage during overloads increases from 240 to 290 V for low and from 460 V to 500 V for medium speeds due to standard IR compensation. Without this correction, the currents would be 180 A. If the voltage amplitude was increased to 600 V at low speed and to 1000 V at medium speed, then, according to the proposed method, the currents would decrease to 85 A and 112 A at active currents of 60 and 85 A, respectively.
The maximum currents of the drive and the frequency converter at maximum climbs at maximum speed reach 180% of the nominal value of the frequency converter current. According to technical specifications, the frequency converter can operate at such currents for no more than 1 min before shutdown. Switching off the frequency converter creates an emergency mode for the vehicle. As follows from the diagrams, the overload time is 15–20 s, which is very close to critical. Therefore, for the reliable operation of the vehicle, it is necessary to reduce the load by 20–30%.
It follows from the diagrams (Figure 7) that in the sections of 1 min 50 s and 2 min, the amplitudes of the stator voltage decrease from 660 to 620 V, which contradicts the IR correction algorithm. It is obvious that in these cases, the voltage drop in the cables becomes too significant.
During movement at maximum speed, at a frequency of 50 Hz and an amplitude of 660 V of the frequency converter voltage, there are no reserves for increasing the voltage amplitude and, accordingly, the main magnetic flux in the traction motors. Due to a significant voltage drop in the power cable (220 V), the voltage at the frequency converter output decreases to 620 V and the current increases to 290 A.
Calculations according to the method proposed in this article show the following.
If in the current overload mode the frequency converter voltage supplied to the motor stators was increased to 1300 V, the reactive current would increase to 70 A, and the active current would decrease to 150 A. The total current would not exceed 180 A.
With a nominal current of the frequency converter of 150 A, the frequency converter will withstand an overload of up to 180 A, which means that the load capacity (up to 30 tons of cargo) of the vehicle will be ensured at maximum speed on a route with large climbs.
The effect of deep regulation of the main magnetic flux on the energy of the vehicle drive.
The total drive current would decrease from 290 A to 190 A, reducing direct losses from 80 kW to 40 kW. Taking into account the time of passing this section (30 s) and the approximate number of passes per day (100–200), this is 100–150 kW·h of electricity savings per day. The voltage drop in the cables will decrease from 250 to 150 V. This would solve the problems of drive control and reduce direct active losses of electricity.
It should be recognized that increasing the power voltage reserve by two or more times in transport is a very complex and expensive task. The proposed calculation of minimum currents is a demonstration of the potential that can be obtained by abandoning the use of standard control algorithms and standard parameters (we are talking about the main magnetic flux of motors).
As for optimizing the operation of the drive of the considered vehicle, there are significant opportunities.
At low speed, it is possible to reduce the stator currents to a minimum, at medium speed, reduce the currents by 30–40%, and at maximum speed with a full load, it is enough to reduce the stator voltage frequency to 40 Hz, reducing the speed to 8 km/h while maintaining the carrying capacity on a difficult route.
Regarding the oscillation of frequency converter currents, it is necessary to pay attention to the changing amplitude of the stator current oscillations associated with the speed of movement and the rate of change in the load, which, as shown in the articles in [14], lead to a change in the linearized frequency characteristics of asynchronous electric motors [10]. Despite the obvious nonlinearity of asynchronous electric drives, noted in a number of studies [15,16,17] and the dynamic change in the load of the traction drive of the vehicle when moving uphill and downhill, these problems do not seem to be decisive. The speeds of the vehicle (from 3 to 9 km/h) are not high, and the dynamic characteristics of the traction motors themselves (torque and rotation speed) have significantly faster changes. As for the oscillation of the mean square stator current, which is observed in almost all experiments, then, as noted earlier, its common cause is the dependence on the frequency of the stator voltage and the slip of the linearized frequency characteristics of the IM. It is not possible to establish a more accurate dependence for the drive in question in the experiments under consideration.
In addition, the inertia of the vehicle is very high, and the oscillation of the stator current does not affect the speed of the vehicle at all.
Changes in the amplitude of the voltage supplied to the stator of induction electric motors by 50–70% significantly reduce the total stator currents under high load and reduce losses in the drive. It is possible to implement such an increase in the main magnetic flux in the motor without violating the stability of the drive only by applying additional dynamic correction, described in detail in a number of works [11,12,13,14].
In this regard, this article does not provide an analysis of the parameters of stator current oscillations in various experiments, except for statements of their main characteristics (amplitude and frequency).
5. Discussion
The problem of reducing stator currents under load is the most important problem, specifically for electric transport.
High currents of electric motors lead to an increase in active losses in power cables. The vehicle is connected to a power voltage source (three phases, 660 V, 50 Hz) by a three-phase power cable; the resistance of each wire is from 1 to 5 ohms, depending on the cable length (from 200 to 500 m). At high stator currents, active losses in cables become significant and can reach 50 kW of power; in addition, the voltage drop in the cables (from 100 to 200 V) complicates the control of drives. Thus, reducing the total current of the stators of electric motors is an urgent problem for the vehicle drive and the mine power supply system.
It should be noted that with the planned transition to powering special equipment from power batteries in the near future, this problem will remain relevant, because large total drive currents will lead to a very rapid discharge of batteries and significantly complicate the entire technology of using vehicles. The same problem exists for electric vehicles. The conducted analysis of experimental data showed that an asynchronous traction drive with frequency regulation, in the frequency converter of which standard frequency control algorithms are implemented, does not use a significant resource for optimizing quasi-static modes. To reduce the total stator current by balancing the active and reactive currents, deep regulation of the stator voltage amplitude is necessary. In this case, changes in the amplitude are much “deeper” than with standard “IR compensation”, in which changes do not exceed 10–15% of the nominal value.
The effect of such a correction will be significant, namely a decrease in active power losses by 20–30 kW and a decrease in voltage drop in cables by 100–120 V. In addition, a decrease in the active current will indicate a decrease in slip in traction asynchronous electric drives under loads, i.e., the more accurate maintenance of the specified speed of the vehicle, i.e., the performance of direct tasks of the traction electric drive of the vehicle.
6. Conclusions
Active regulation of the main magnetic flux will make the IM equivalent to the PMSM in terms of overload capabilities and ensure minimum reactivity, thus also ensuring full power currents of traction electric drives. At the same time, the IM advantage in terms of price and reliability is preserved. Deep regulation of the main magnetic flux in traction motors is necessary for transport electric drives, as one of the most dynamic electric drives. Analysis of the experimental data obtained during the movement of a special vehicle for transporting rock under real mine conditions showed that deep regulation of the main magnetic flux in asynchronous traction electric motors of special vehicles experiencing significant load changes during movement will allow for a significant improvement in both the main characteristics of the drive (maintaining a given speed of movement) and the energy characteristics of the drive to be achieved. Such a correction can be successfully applied to other asynchronous electric drives with frequency control, providing the IM with competitive advantages over the PMSM.
Author Contributions
Conceptualization, V.K., A.A., and A.B.; methodology, V.K.; software, A.A.; formal analysis V.K.; investigation, V.K.; data curation, A.A.; writing—original draft preparation, V.K.; writing—review and editing, A.B.; visualization, A.A. All authors have read and agreed to the published version of the manuscript.
Funding
This research received no external funding.
Data Availability Statement
The original contributions presented in this study are included in the article. Further inquiries can be directed to the corresponding author.
Conflicts of Interest
The authors declare no conflicts of interest.
References
- Park, R.; Robertson, B. The reactances of synchronous machines. Trans. Am. Inst. Electr. Eng. 1928, 47, 514–535. [Google Scholar] [CrossRef]
- Noori, O.B.; Mustafa, M.O. Compressed Extended Kalman Filter for Sensorless Control of Asynchronous Motor. Int. J. Energy Convers. (IRECON) 2020, 8, 200. [Google Scholar] [CrossRef]
- Alekseev, V.V.; Emel’Yanov, A.P.; Kozyaruk, A.E. Analysis of the dynamic performance of a variable-frequency induction motor drive using various control structures and algorithms. Russ. Electr. Eng. 2016, 87, 181–188. [Google Scholar] [CrossRef]
- Oteafy, A.; Chiasson, J. A Study of the Lyapunov Stability of an Open-Loop Induction Machine. IEEE Trans. Control. Syst. Technol. 2010, 18, 1469–1476. [Google Scholar] [CrossRef]
- Vas, P. Vector Control of AC Machines; Oxford University Press: New York, NY, USA, 1990. [Google Scholar]
- Usoltsev, A.A. Vector Control of Asynchronous Motors; Tutorial—Spb.: ITMO, 2002; 120p. Available online: http://servomotors.ru/documentation/frequency_control_of_asynchronous_motors/chastupr.pdf (accessed on 15 December 2020).
- German-Galkin, S. An analytic and simulation study of a wound-rotor asynchronous machine at positive slides. Russ. Electr. Eng. 2015, 86, 418–424. [Google Scholar] [CrossRef]
- Itoh, J.-I.; Nomura, N.; Ohsawa, H. A comparison between V/f control and position-sensorless vector control for the permanent magnet synchronous motor. In Proceedings of the Power Conversion Conference-Osaka 2002 (Cat. No.02TH8579), Osaka, Japan, 2–5 April 2002; Volume 3. [Google Scholar]
- Mishchenko, V.A. The vector control method of electromechanical converters. Electr. Eng. 2004, 7, 47–51. [Google Scholar]
- Kodkin, V.L.; Grigoriev, M.A.; Kuznetsova, E.A.; Anikin, A.S.; Baldenkov, A.A.; Loginova, N.E. Engineering Methods for Calculating the Operating Modes of Asynchronous Electric Drives with a Weakened Main Magnetic Flux. Bull. South Ural. State Univ. Ser. Power Eng. 2024, 24, 43–45. [Google Scholar] [CrossRef]
- Kodkin, V.L.; Anikin, A.S. Experimental study of the VFD’s speed stabilization efficiency under torque disturbances. Int. J. Power Electron. Drive Syst. (IJPEDS) 2021, 12, 80–87. [Google Scholar] [CrossRef]
- Usoltsev, A.A. Determination of the parameters of the asynchronous motor model according to the reference data. News Univ. Instrum. Mak. 2008, 51, 35–41. [Google Scholar]
- Dessaint, L.-A.; Al-Haddad, K. Modelling and Simulation of Electric Machines, Converters and Systems. Math. Comput. Simul. 2003, 63, 135. [Google Scholar] [CrossRef]
- Zair, M.; Hazzab, A. MRAS Speed Sensorless Vector Control of Induction Motor Drives using Predictive Adaptation Mechanism. Int. J. Power Electron. Drive Syst. (IJPEDS) 2018, 9, 1523–1533. [Google Scholar] [CrossRef]
- Gangishetti, S.; Sandipamu, T. Different Control Schemes for Sensor Less Vector Control of Induction Motor. Int. J. Power Electron. Drive Syst. (IJPEDS) 2017, 8, 712–721. [Google Scholar] [CrossRef][Green Version]
- Doncker, R.D.; Pulle, D.W.J.; Veltman, A. Advanced Electrical Drives: Analysis, Modeling, Control; Springer: Berlin/Heidelberg, Germany, 2011. [Google Scholar]
- Ammar, A.; Ameid, T.; Azzoug, Y.; Kheldoun, A.; Metidji, B. Design of Speed Sensorless Control of Induction Motor Based on Dual-Nonlinear Control Technique. In Proceedings of the 2020 International Conference on Electrical Engineering (ICEE), Hong Kong, China, 21–23 October 2020; pp. 1–6. [Google Scholar]
Disclaimer/Publisher’s Note: The statements, opinions and data contained in all publications are solely those of the individual author(s) and contributor(s) and not of MDPI and/or the editor(s). MDPI and/or the editor(s) disclaim responsibility for any injury to people or property resulting from any ideas, methods, instructions or products referred to in the content. |
© 2025 by the authors. Published by MDPI on behalf of the World Electric Vehicle Association. Licensee MDPI, Basel, Switzerland. This article is an open access article distributed under the terms and conditions of the Creative Commons Attribution (CC BY) license (https://creativecommons.org/licenses/by/4.0/).