Abstract
Battery electric vehicles (BEVs) are one promising approach to mitigating local greenhouse gas emissions. However, they still lag behind conventional vehicles in terms of maximum driving range. Using the heating, ventilation, and air-conditioning (HVAC) system reduces the maximum driving range of the vehicle even further since the energy for the HVAC system must come from the battery. This work investigates the impact of (1) an air–air heat exchanger and (2) an improved thermal insulation of a truck cabin on the heating performance of the HVAC system. Additionally, the required fresh-air volume flow rate to keep the CO2 level within the truck cabin below the critical value of 1000 ppm is factored in. The results show that the two simple measures proposed could increase the energy efficiency of the truck’s HVAC system by 22%. When two persons are present in the truck cabin, a fresh-air volume flow of around 100 m3/h is required to keep the CO2 concentration around 1000 ppm. These results prove that, even with simple measures, the energy efficiency of vehicles’ subsystems can be increased. In the future, more research will be necessary to further improve the energy efficiency of other vehicular subsystems.
1. Introduction
Due to the ongoing climate change, societal awareness of mitigating air and noise pollution as well as greenhouse gas emissions is currently very high. Battery electric vehicles (BEVs) represent one of the main drivers in the transportation sector that will help to reach the greenhouse gas reduction targets set by the European Union in the Green Deal [1]. In recent years, the scientific interest in the electrification of vehicles has been moving from passenger vehicles towards also including heavy-duty vehicles such as trucks and buses [2,3,4,5,6,7]. Ref. [2] provides an overview of the existing battery-electric trucks including their battery capacity and maximum driving range. Furthermore, this contribution provides a systematic review of key studies in the field of battery-electric trucks, addressing the following areas: (1) the technical, stakeholder, and customer perspectives on charging solutions, offering a detailed analysis of their technological benefits and drawbacks; (2) a comparison of the total cost of ownership (TCO) between battery-electric trucks and diesel trucks; and (3) a CO2 life cycle assessment of different technologies. In their study, the authors of [3] examine whether using battery-electric heavy-duty trucks for 24 h delivery is economical for logistics service providers. They use data from a German logistics service provider and develop a system dynamics model. They also integrate a total cost of ownership calculation with logistics service providers and retail store discrete choice models. Their findings show that 24 h delivery using battery-electric heavy-duty trucks is immediately profitable. This is due to the nearly 50% increase in daily trip potential compared to diesel heavy-duty trucks, which reduces the required fleet size.
However, as the thermal energy for conditioning the cabin in any BEV must be taken from the battery, the maximum driving range decreases at low or high ambient temperatures [7,8,9,10,11]. Hence, energy efficiency of the heating, ventilation, and air-conditioning (HVAC) system is still one of the main research foci in this field. Ref. [12] offers a comprehensive summary of the key technologies behind distributed thermal management systems, focusing on the specific heating and cooling needs of each subsystem. It also compares the strengths and limitations of different thermal management approaches. Furthermore, this review explores advancements in integrated thermal management systems for BEVs. It examines configuration integration, classified into airflow, indirect secondary-loop, and direct refrigerant-side integration, and information integration, particularly in the context of connected and automated vehicles. Ref. [7] analyzes the main factors influencing the maximum driving range of BEVs. They conclude that fast driving speed and low ambient temperatures, which in turn demand high heating power from the HVAC system, contribute most significantly to a reduced maximum driving range. Therefore, they propose to also incorporate heating at low ambient conditions to the testing scenarios when certifying the maximum driving range of BEVs.
1.1. Previous Research in the Field
In order to increase the maximum driving range of BEVs, ref. [13] suggests leveraging the thermal mass of the traction battery to store thermal energy while the vehicle is connected to the grid. This stored energy can later be used during driving to improve the heating efficiency of the passenger cabin. When paired with an HVAC system operating in heat pump mode, this method can significantly boost the vehicle’s range in cold weather conditions. Ref. [4] investigates the impact of infrared heating panels to improve the system efficiency of an HVAC system for an electric truck. With their approach, they determine an energy saving potential of approximately 30% compared to a conventional purely convective heating system. Ref. [14] analyzes the performance of an electric vehicle thermal management system including a thermal energy storage and waste heat recovery. They propose to use a heat pump system to capture thermal energy arising from losses in the battery and in power electronics. The thermal storage, which uses phase change materials, is used to buffer thermal energy when it is available but not yet needed. With the proposed system, they could achieve a maximum reduction in energy consumption of the HVAC system of 65.9% in summer and 26.2% in winter. Ref. [10] introduces advancements beyond the current state of the art regarding passenger comfort. The focus is on a methodology that reduces the computational costs of intensive CFD simulations and time-consuming experimental investigations. It also allows for the simultaneous evaluation of vehicle cabin thermal comfort and energy flows. Finally, they apply their methodology to derive a correlation between passenger thermal comfort and energy consumption of the HVAC system. In their study, the authors of [5] present a vehicle-integrated thermal management system that, thanks to a secondary coolant loop and an intelligent valve system, ensures energy optimization. Specifically, the secondary coolant loop thermally connects all the vehicle’s devices, enabling the cabin to be heated by recovering the thermal energy released by the power electronics and the electric motor. They compare two different secondary-loop layouts regarding the total amount of energy that can be captured during driving cycles at different ambient temperatures. They conclude that the maximum recovered waste heat is strongly dependent on ambient conditions.
Ref. [15] examines the energy consumption across various standardized driving cycles. Their findings show an average reduction of driving range by 33% due to HVAC operation across all the driving cycles considered. In contrast, the authors of [16] investigate the impact of HVAC use on the driving range of BEVs at different ambient temperatures. They find that, for ambient temperatures below 10 °C, electric energy consumption increases by 2.4 kWh/100 km for every 5 °C drop in temperature. Similarly, for temperatures above 28 °C, energy consumption rises by 2.3 kWh/100 km for each 5 °C increase in temperature. Also, ref. [11] presents an approach for predicting BEV energy consumption based on environmental conditions, where a 3D heat transfer model of the vehicle and its occupants is combined with a thermal–electrical model of the battery pack and a 0D BEV energy consumption model. In their simulations, they found that the thermal management of the cabin, motor, and battery contributed 7%, 38%, and 49% of the total energy consumption in warm, hot, and cold environments, respectively. Ref. [17] also uses a simulation approach. This paper introduces a control-oriented thermal model for managing the thermal conditions of battery-electric vehicles. This model incorporates an HVAC system along with a heat pump. A cool-down scenario is examined for both the battery and the cabin under high ambient temperatures, potentially exceeding 45 °C. The validation results against a high-fidelity model reveal a root mean square error of 0.75% for the cabin air temperature and 0.71% for the battery temperature at steady state, which means that the model can be finally applied to determine the energy consumption of the thermal management system. In their paper, the authors of [6] address the HVAC system in an electric city bus by analyzing the trade-off between energy consumption and the thermal comfort of the passengers. They achieve this by developing a dynamic thermal model for the bus, which they simplify by assuming steady-state conditions. They introduce a method capable of quickly optimizing the steady-state HVAC system inputs for a large number of samples representing year-round operation. Ref. [18] introduce a physics-based, modular full-vehicle model that encompasses an electrified drivetrain, passenger cabin, and thermal management system. A reversible heat pump and several control units are employed to manage the specific thermal needs, creating complex interconnections and cross-couplings. They assess the performance of a heavy-duty truck on typical long-distance routes, including stops, while considering legal regulations for fast and overnight charging. Assuming 8 h of cabin heating over night at an ambient temperature of −5 °C, 11.1 kWh of energy can be saved using the proposed air–air heat pump instead of an electric heater.
The authors of [19] focus on the question of how seat heating can reduce the overall cabin temperature while maintaining the same subjective comfort level. They summarize that approximately 80% of participants still found the thermal comfort acceptable when the cabin air temperature was reduced by about 9 °C with the use of seat heating. Similarly, the same percentage of participants rated the thermal comfort as acceptable when the cabin air temperature was increased by about 6 °C. This suggests that the temperature range for thermal comfort can be significantly expanded by incorporating seat heating. The study in [20] takes this further. In addition to seat heating, the authors also incorporate foot heating and assess thermal passenger comfort. While the results are similar to those of [19], the actual values are slightly lower. The authors of [20] conclude that, with both seat and foot heating, the cabin temperature can be reduced by up to 6 °C while still maintaining the same level of thermal comfort. Indeed, reducing the cabin temperature also reduces the required power to heat up the cabin. The study in [21] uses infrared heating panels instead of seat or foot heating to achieve a similar effect to the previous two studies. The authors analyze thermal comfort by combining conventional HVAC with radiant heating, achieving a reduction in HVAC system energy consumption by up to 50%.
The authors of [22] follow a different approach. They investigate the development and comparison of strategies for controlling the vehicle’s heating system. Rule-based, fuzzy logic, and optimization-based approaches are designed and implemented within a validated BMW i3 simulation model. The results demonstrate that fuzzy logic yields the most significant improvements in range and battery lifespan. When compared to the standard strategy, the range can be increased by 14% at −10 °C and by 6.5% at 0 °C.
In [23], the authors compare a hysteresis-based air quality control with a model-based one. The implemented algorithm continuously switches between different ratios of fresh air and recirculated air. However, using a high share of recirculated air decreases the air quality, especially in terms of CO2 concentration. This CO2-related problem is also analyzed in [23]. The authors investigate a possible air quality control for which they find 1200 ppm as maximum value for the permissible CO2 concentration. The authors of [24] study the amount of CO2 that accumulates in vehicles when operating the HVAC system in recirculation mode. They set the CO2 limit for a vehicle with two passengers to 1200 ppm. Refs. [25,26] both develop equations in their papers to calculate the rise in CO2 level in vehicle cabins dependent on the number of passengers, cabin volume, and vehicle body leakage. They conclude that the equations can be incorporated into an HVAC control system to determine the required share between recirculation mode and fresh air mode. Ref. [25] sets the maximum allowed CO2 level to 700 ppm above the ambient CO2 level, while ref. [26] sets this value to maximum 1000 ppm.
The American Society of Heating, Refrigerating and Air-Conditioning Engineers (ASHRAE) also uses 1000 ppm as a long-term limit, above which health and cognitive effects may start to occur [27]. These results are in line with those of the previous studies. This supports the necessity to blow in a certain amount of fresh air into the vehicle cabin. On the other hand, when fresh air is blown into the cabin, warm air from the cabin will be blown out at the same rate. Hence, the thermal energy that was used to heat up the air that enters the cabin will be lost.
1.2. Current Study Novelty and Focus
Previous research was focused on improved efficiency of vehicular HVAC systems. This highlights the great importance of this issue in the automotive sector. However, none of these contributions present a similar approach like the one presented in this work.
This paper proposes two simple, but at the same time effective, measures to increase the energy efficiency of a heating system for a truck cabin:
- An air–air heat exchanger reuses the thermal energy from the conditioned air that leaves the cabin to pre-heat the fresh air that will be blown into the cabin. This approach makes it possible to use sufficient fresh air to keep the CO2 concentration within the cabin at a feasible level while at the same time keeping energy consumption low. As the system was designed as add-on solution, it could be easily transferred to other vehicles as well.
- In addition, to also mitigate the thermal losses through the walls, a thermal insulation is applied to the cabin walls. This measure additionally enhances the thermal performance of the truck cabin, and hence it further reduces the energy consumption of the HVAC system.
The impact of the proposed measures on the heating performance of the truck cabin are provided by means of measurement data for heating mode using a climatic chamber to provide an ambient temperature of −7 °C. The structure of this contribution is visualized in Figure 1. More details about the separate parts will be provided in the following Section 2.
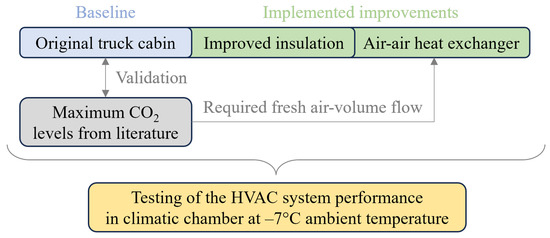
Figure 1.
Schematic overview of the structure of this contribution.
2. Materials and Methods
Most of the heat from the cabin’s interior is lost to the ambient air by escaping through gaps and by conduction through the walls. The thermal conductivity can be decreased by placing insulation material on the inside faces of the cabin. For the experiments, 25 mm thick Armaflex ACE insulation mats were applied to the sides, bottom, and top of the interior, and outside the vehicle on the front as well. The implementation is shown in Figure 2 and Figure 3, respectively.
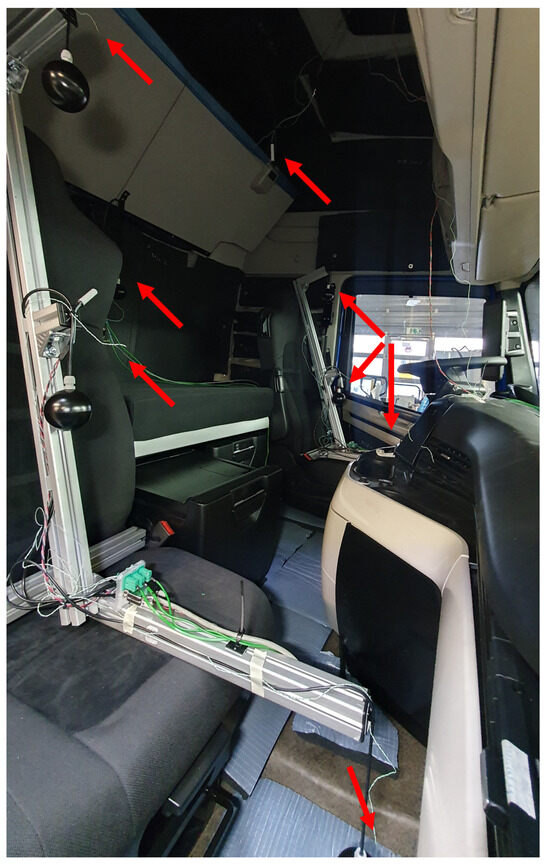
Figure 2.
Placement of air temperature sensors (red arrows) and additional insulation inside the cabin.
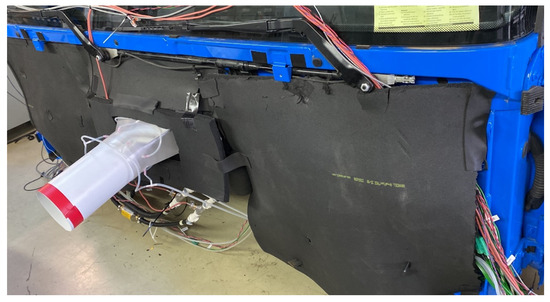
Figure 3.
Inlet air volume flow measurement, additional insulation on the front of the cabin, and coolant temperature and flow sensors visible on the bottom.
When the HVAC system operates in fresh air mode, the cabin´s air is pushed out through the openings while fresh air, which needs to be conditioned, enters the cabin. With increased fresh air intake, the amount of already conditioned air leaving is increased as well. Using recirculation mode mitigates the necessity of conditioning fresh air, hence it reduces the overall energy consumption of the HVAC system. Nevertheless, using only recirculation mode for longer periods of time is not possible as CO2 levels will then rise above critical levels.
The literature presented above in the introduction section promotes a maximum CO2 concentration in vehicle cabins varying between 1000 ppm and 1200 ppm. Therefore, this contribution sets the maximum permissible CO2 concentration at 1000 ppm. This will ensure that, even with slight fluctuations in CO2 concentration, the actual value still remains in a reasonable range.
The authors of [28] derive an equation to calculate the required fresh air flow rate (VFlowFreshAir) in [m3/h], dependent on the number of persons present (nPersons), the CO2 generation rate per person (GCO2) in [m3/h], the maximum allowed CO2 concentration of the indoor space in steady state (CSteadyState) in [ppm], and the outdoor CO2 concentration (CFreshAir) of the fresh air in [ppm]:
where as is a conversion factor because the CO2 concentration in Equation (1) is given in [ppm].
Based on [28], the CO2 generation rate of one male occupant between 21 and 30 years, with activity levels similar to office work, is 0.0064 L/s, which is 0.02304 m3/h. Using Equation (1) and assuming two persons in the cabin and a slightly elevated ambient CO2 level of 550 ppm, the necessary fresh air intake volume flow to keep the CO2 concentration of the cabin around 1000 ppm is approximately 100 m3/h:
To verify these numbers from Equation (2), an experiment was performed to investigate the CO2 concentration that accumulates in a truck cabin with two persons inside, and with controlled inlet fresh air volume flow rate of 100 m3/h. The results of this investigation will be further discussed in Section 3.1.
A schematic representation of the implemented air–air heat exchanger and the improved insulation is provided in Figure 4. Insulation material was attached to all possible interior surfaces of the truck cabin, i.e., at the ceiling, the rear wall, the floor, and also the side doors. The cabin in this case was in recirculation mode, with no fresh air supplied from the conventional HVAC system, and the cabin temperature, controlled by a proportional–integral–derivative (PID) controller, was set to 23 °C. The heater core was connected to a process thermostat, providing a constant flow of water/glycol coolant at 80 °C and 8 L/min.
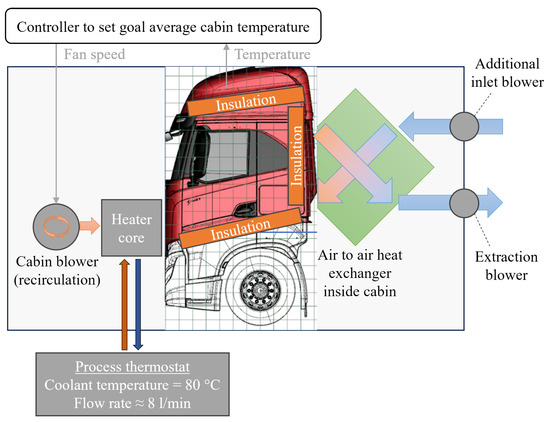
Figure 4.
Schematics of the implemented air–air heat exchanger and the improved thermal cabin insulation.
Two openings were cut out of the compartment’s door, one for fresh air intake and the other one for the air leaving the cabin, as seen in Figure 5. Each of these new openings was equipped with an additional blower, respectively, i.e., an inlet blower and an extraction blower. These blowers enable control of the volume flow of fresh air entering and the volume flow leaving the cabin through the air–air heat exchanger. Additionally, they allow for setting the pressure level within the cabin. If the cabin pressure is lower than the ambient pressure, then outside air will be sucked through leaks in the chassis into the cabin. This drastically increases the thermal losses and, hence, decreases the efficiency of the HVAC system. In contrast, if the pressure within the cabin is higher than the ambient pressure, already conditioned air will leave the cabin through leaks in the chassis. This also results in a less efficient performance of the HVAC system, even if this is not as significant as in the first case. To conclude, the best HVAC system efficiency will be achieved when the cabin pressure is equal to the ambient pressure as this will reduce the thermal losses through leakages.
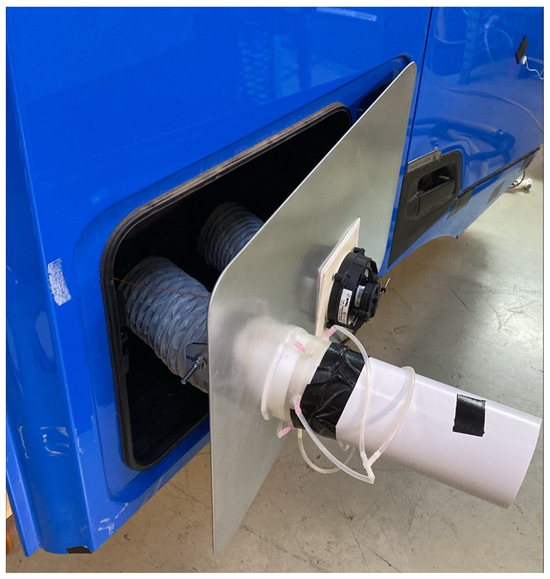
Figure 5.
Air–air heat exchanger inlet (left) and outlet (right) openings on the compartment door.
Equation (2) shows that the required volume flow of fresh air needs to be set to 100 m3/h if two persons are present in the vehicle. The air volume flow at the additional inlet was measured, and the blower settings were recorded for further control adjustments and for evaluation purposes.
To investigate the impact of the proposed measures, the thermal performance of the truck cabin was tested in a climatic chamber at an ambient temperature of −7 °C. The cabin target temperature was set to 23 °C and the PID controller, shown in Figure 4, controlled the cabin blower with the mean cabin temperature as feedback. The mean cabin temperature was calculated based on eight temperature sensors, which were installed in the cabin at the following locations: driver’s head, -chest, and -feet, passenger’s head, -chest, and -feet, cabin center, and bottom center. Then, the performance of the original cabin was compared to the improved cabin in five different test cases, which are provided in Table 1, where Case1 is the baseline truck cabin as a reference, and Case5 is the improved cabin including all proposed measures.

Table 1.
Description of the test cases.
In these five test cases, the total power consumption PTotal of the HVAC system is compared:
with PHeating as the required heating power to heat up the coolant to the target temperature of 80 °C, PMainBlower as the measured power consumption of the main blower, and PHXBlowers as the sum of the measured power consumption of the additional inlet and extraction blowers.
As a process thermostat is used to heat up the coolant to the desired temperature, the required heating power PHeating in [W] can be calculated from Equation (4) by measuring the coolant temperature before the heater core (TCoolantIn) in [°C], the coolant temperature after the heater core (TCoolantOut) in [°C], and the coolant volume flow rate (VFlowCoolant) in [m3/s]. Solving Equation (4) further needs the fluid properties of a water–glycol 1:1 mixture, compare also [29], which are the density (Coolant = 1042 kg/m3) and the specific heat capacity of the coolant (cpCoolant = 3657 J/kg K).
The power consumption and the measured temperatures presented in Section 3 do not include the transient heat-up phase of the truck cabin. To enable a fair evaluation, these values are average values that have been recorded once the cabin temperature has reached steady state. Then, an average value was calculated for each of the quantities over a measurement time of at least 1500 s in steady state.
The main equipment in the measurement setup was an IMC Cronos data acquisition system. The evaluation of sensor signals, the PID control of fans, and the automation of the experiments were all running on the IMC Cronos system. The analog sensor signals were measured with 10 Hz frequency. The values were averaged over 1 s intervals and exported.
The air temperature was measured using Type-K thermocouples with class 1 tolerance. As a consequence, there is a chance of ±1.5 °C total error (see also [30]), which was mitigated by using several thermocouples and averaging their values. The location of the thermocouples within the cabin was marked with red arrows in Figure 2.
The coolant’s temperature was measured by 4-wire PT100 resistance temperature detectors before and after the heater core in the cabin. The coolant flowrate was measured using an IFM SM6000 magnetic-inductive flow meter with an accuracy of ±0.8% of the measured value. To approximate the inlet air volume flow, an adapter with a circular cross-section was 3D-printed and attached to the main cabin inlet, and an orifice plate with 20% diameter reduction was fitted inside, as seen in Figure 6. The pressure difference (p1− p2) on the two sides of the plate was measured with a Sensirion SDP816-500Pa analog differential pressure sensor. The pressure drop’s magnitude correlates to the air velocity, and the device was calibrated with a hot-wire anemometer.
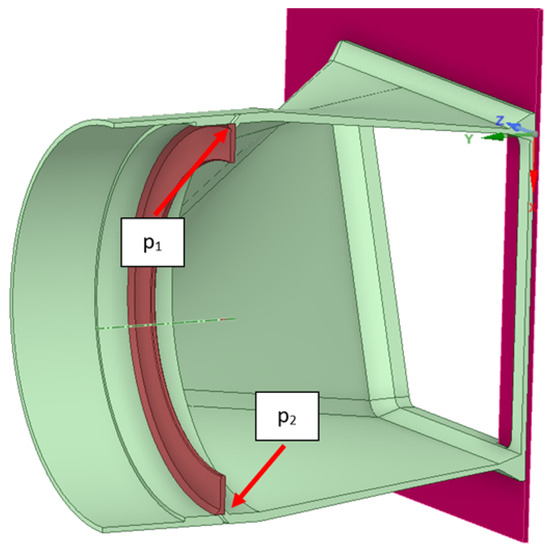
Figure 6.
3D model of inlet and orifice plate.
The experimental setup used a Recair RS160 air–air heat exchanger [31], which was placed in a compartment behind the passenger seat. The implementation of the heat exchanger in the vehicle cabin can be seen in Figure 7. On the ambient side, fresh air was taken in through one side of the heat exchanger, using the fan visible at the bottom of the figure. The extraction fan was attached to the opening on the right. This removed air from the area around the driver’s seat, which then flowed through the other side of the heat exchanger.
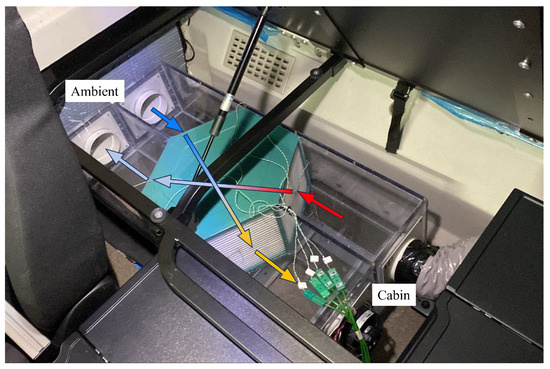
Figure 7.
Heat exchanger behind the passenger seat, with the inlet fan visible at the bottom of the picture.
The real implementation of the air–inlet adapter at the front of the vehicle can be seen in Figure 3. This adapter with an included orifice plate was used to measure the air mass flow entering the cabin through the front heat exchanger. A third pressure sensor observed the cabin pressure relative to the ambient environment. Three PID controllers were implemented in the data acquisition system. One was responsible for setting optimal main blower rotational speed to keep the cabin air temperature constantly at 23 °C based on the average temperature of the eight temperature sensors (see Figure 2). The other two PID control loops were responsible for governing air quantities flowing through the heat exchanger. On the inlet side, the control logic set the heat exchanger´s inlet fan speed to achieve 100 m3/h inlet air volume flow. The exhaust fan was controlled to keep the pressure difference between ambient and cabin at 0 Pa.
3. Results
The measurement results are provided in this section. Section 3.1 presents the measurement results regarding the CO2 concentration, while Section 3.2 presents the results of the measured power consumption of the HVAC system in the five test cases.
3.1. CO2 Concentration
First, applying Equation (2) for two persons in the truck cabin showed that it requires approximately 100 m3/h of fresh air to keep the CO2 concentration around 1000 ppm. Following the suggestions of [23,24,25,26], 1000–1200 ppm is a feasible long-term value that will not affect the passengers negatively. In order to also allow for some fluctuations without exceeding 1200 ppm, the target value for this contribution is set to 1000 ppm. In the next step, to prove this result, an experiment was performed with two persons in the cabin and an incoming volume flow rate of fresh air of 100 m3/h while the trend of the CO2 concentration was measured between the two passengers approximately 30 cm above their heads. The results are provided in Figure 8. They prove that, with a volume flow of 100 m3/h of fresh air, the CO2 concentration within the truck cabin remains around the targeted value of 1000 ppm when two persons are present. In the steady-state phase, after 400 s, the measured CO2 levels fluctuate by up to ± 80 ppm around the mean value of 1004 ppm. The steady-state interval that was used to calculate the mean value of the CO2 concentration within the cabin is marked with the gray-dotted box (“Mean interval”) in Figure 8. These results prove that the proposed system fulfills the requirements in terms of CO2 concentration as the mean value is around the targeted 1000 ppm, and the maximum value does not exceed 1200 ppm, even with fluctuations around the mean value.
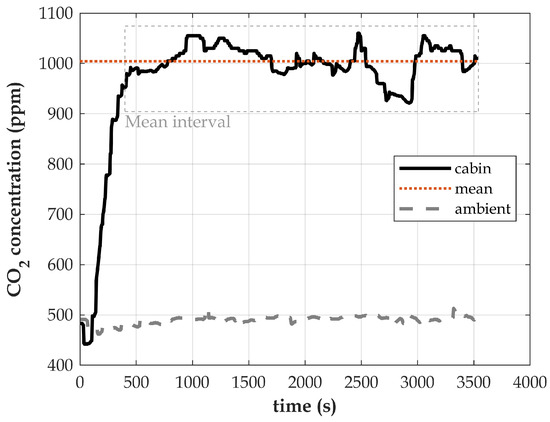
Figure 8.
CO2 concentration with two occupants at 100 m3/h fresh air volume flow rate.
3.2. Power Demand for Heating
The power demand of the HVAC system for heating the cabin at −7 °C ambient temperature was evaluated in steady-state conditions. Figure 9 depicts an example of the measured transient cabin temperature. The experiment started when the cabin temperature reached −7 °C. The cabin target temperature was set to 23 °C and the duration of the experiments was selected long enough to allow the system including all components to stabilize at steady state after the heat-up. At the beginning, the cabin temperature started to rise and, with a slight overshoot of 2.5 °C, the HVAC system kept the cabin temperature at the target value of 23 °C. Overshooting the target temperature after heat-up is typical for such systems, because of the high thermal inertia of vehicle cabins. Additionally, the controller was set to heat up the cabin fast in order to reach thermal passenger comfort as soon as possible. If the controller was set to prevent overshooting, the heat-up phase would be much longer and, hence, this would negatively affect the passenger comfort. The relevant interval that was used for evaluating the power consumption is marked with the gray-dotted box. This interval was also used to determine the mean value of the temperature in steady state, which corresponds to the setpoint of 23 °C. These results prove that the HVAC system is able to control the cabin air temperature accurately to the target value.
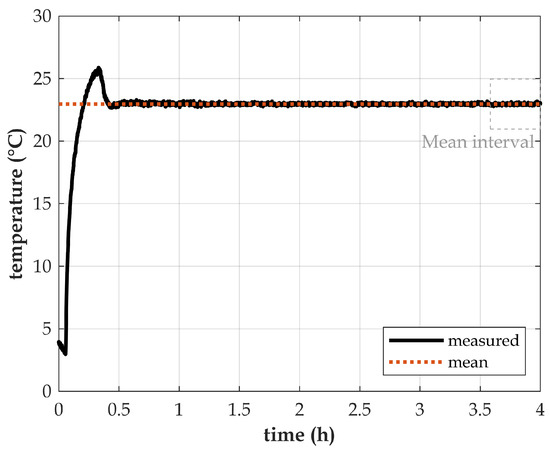
Figure 9.
Example of measured mean cabin temperature during heat-up phase until steady state.
Figure 10 provides the transient power consumption of the HVAC system corresponding to the temperature trend described above. The peak, visible at the beginning of the measurement data, is the start-up of the HVAC components. In this short phase, the components draw the highest power from the battery until the system is in operation. The start-up is followed by an increased power consumption of up to 10 kW during the heat-up phase of the cabin, and finally the power consumption settles slowly at around 2900 W as the cabin temperature reaches a steady state. Then, the system has reached an equilibrium between the heating power of the HVAC system and the thermal losses while keeping the cabin temperature at the target value of 23 °C. The interval that was used for calculating the mean value for evaluating the power consumption of the HVAC system has again been marked with the gray box.
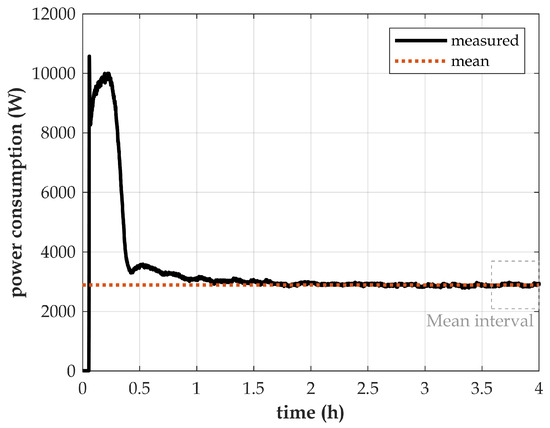
Figure 10.
Example of measured power consumption during heat-up phase until steady state.
Figure 11 shows the measurement results with regard to the total power consumption of the HVAC system at steady state of the cabin temperature for the five different test cases from Table 1. Case1 is the baseline measurement in fresh air mode. This scenario, with 3311 W power consumption, serves as a reference for analyzing the impact of the measures from the other cases on the total power consumption of the HVAC system. Case2 shows the impact of recirculation mode. Here, the total power consumption is 2470 W. When comparing this value to the results of Case1, this means a reduced power consumption of 25%. Case3 features an insulated truck cabin in fresh air mode. Here, a power consumption of 2886 W was measured, which means an improved efficiency of 13% compared to Case1. The least power consumption could be achieved by the insulated truck cabin that is operated in pure recirculation mode, i.e., Case4. In this scenario, the results show a power consumption of only 2263 W, which is 32% lower than the one measured in Case1. The total power consumption of the HVAC system when applying both proposed measures, i.e., the improved thermal insulation and the air–air heat exchanger, is represented by Case5. With a power consumption of 2571 W, which means a reduction in the power consumption by 22% compared to Case1, this scenario achieved the best efficiency of all realistic cases, considering also a specific amount of fresh air to keep the CO2 level inside the truck cabin at a feasible level. Further discussion of the measurement results is provided in Section 4.
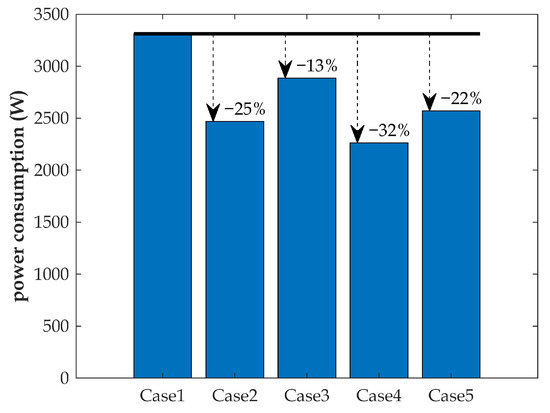
Figure 11.
Total power consumption of the HVAC system for the different cases.
4. Discussion
The proposed concept with the air–air heat exchanger and the controlled volume flow rate of fresh air of 100 m3/h, calculated by Equation (2), was successfully verified with the presented measurement data from Figure 8. The mean value of the measured CO2 levels was 1004 ppm. However, the CO2 sensor for measuring the presented CO2 concentration in the truck cabin was placed between the driver and the passenger, approximately 30 cm above their heads. Therefore, dependent on the alignment of the passengers’ heads, the measured CO2 levels fluctuate by up to ±80 ppm around the mean value. Even with fluctuations, the maximum CO2 concentration remains below 1200 ppm. This means that the proposed concept is feasible also for long-term operation as the observed CO2 concentration will not affect the passengers negatively.
Regarding the power consumption of the different scenarios, provided in Figure 11, Case1 is the worst case. As this is the power consumption of the original vehicle, the presented value serves as a baseline to quantify the efficiency gains of the other scenarios. Case2 shows the impact of only recirculation mode. Comparing the measured power consumption to the one from Case1, a reduced power consumption of 25% could be achieved. However, this is not a realistic scenario since, as stated above, operating the HVAC system in pure recirculation mode will result in issues regarding the maximum permissible CO2 concentration in the truck cabin. Comparing Case3 with the baseline Case1 shows the impact of an improved insulation. By itself, this simple measure could reduce the power consumption of the HVAC system by 13%. Case4 is the best scenario, although it is not realistic because pure recirculation mode is used again. However, this scenario represents the maximum achievable efficiency, thus helping to quantify how good the air–air heat exchanger and the improved insulation performance is in terms of the globally achievable efficiency. The measures of Case4 achieved a reduction in the energy consumption of 32%, compared to the baseline Case1. Case5 is the best case of the realistic scenarios. Here, sufficient fresh air is used to keep the CO2 level at a feasible level. When comparing the results to Case1, the power consumption could be reduced by 22%. The proposed measures have achieved an improved energy efficiency of the HVAC system and are easy to implement for original equipment manufacturers (OEMs). Hence, they can contribute to making electric vehicles more attractive to users.
In summary, these results prove that the proposed measures effectively reduce the energy consumption of the HVAC system. Due to the use of recirculation mode for the original HVAC system, the heater core, shown in Figure 4, needs to heat up the air only during the heat-up phase. Once the cabin temperature has settled at the target value, the heater core only has to compensate the thermal losses of the cabin to keep the temperature at the targeted 23 °C. In contrast, in fresh-air mode, the heater core has to heat up the air constantly from the ambient temperature of −7 °C to 23 °C, even if the cabin temperature already settled at the target value. This explains why the measured energy consumption of the HVAC system is lower when using recirculation mode, which can be seen when comparing the Case2, Case4, and Case5 to the baseline Case1. Additionally, the thermal insulation of the vehicle cabin helped to reduce the thermal losses of the vehicle cabin to the ambient. The attached insulation material reduces thermal conductivity of the surfaces where it was installed. Consequently, this measure further reduces the thermal energy that is required to reach the target cabin air temperature of 23 °C, which can be reproduced when comparing Case3, Case4, and Case5 with the baseline Case1. When analyzing the power consumption of Case4 and Case5, it is evident that using the proposed air–air heat exchanger in Case5 yields an increased power consumption compared to Case4. The reason why the power consumption of Case5 is higher is that fresh air is blown into the cabin in order to keep the CO2 concentration around the target value of 1000 ppm, as explained earlier. Even though the air is pre-conditioned by the air–air heat exchanger, it enters the cabin at a lower temperature than it would when using pure recirculation mode, like in Case4. Indeed, when the air temperature is lower, the heater core needs to transfer more thermal energy to the air to provide a cabin temperature of 23 °C. This explains why the power consumption in Case5 is higher than in Case4.
The validity of the provided results from this study is limited to truck cabins. For vehicles with different cabin size or shape, e.g., passenger cars, the tendency of the results might be comparable, although the effects and the specific gains in efficiency might vary. Also, the influence of the number of passengers within the vehicle cabin might impact the performance of the HVAC system, but this was out of the scope for this study. Therefore, it could be the focus of a future study.
Another aspect which was not part of the experiment is the additional insulation of windows, where—based on thermal images—a significant amount of heat is lost. Figure 12 shows thermal images of the truck cabin at an ambient temperature of −7 °C and 23 °C cabin temperature. The left image shows the cabin door and the right image shows the windshield from the outside. The yellow color indicates high surface temperatures, which in turn means that a significant amount of thermal energy is lost via the windows. However, in order to reduce these losses, a suitable window film needs to be found, which on the one hand does not cause reflection to the outside, or interfere with the visibility for occupants, and on the other hand improves the thermal performance of the windows.
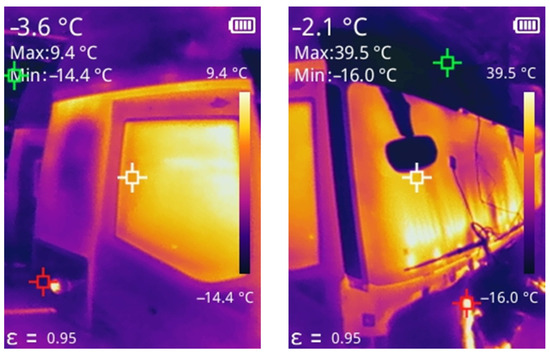
Figure 12.
Thermal images of the truck cabin at low ambient temperatures.
5. Conclusions and Outlook
This paper presents experimental results investigating the impact of an air–air heat exchanger and an improved insulation on the performance of an HVAC system for a truck cabin. The proposed measures also take into account the CO2 levels that arise in vehicle cabins when they are operated in recirculation mode. The power consumption of the HVAC system in heating mode was measured for different vehicle setups. Measurement data were provided, which prove that the proposed concept does not exceed critical CO2 levels. The proposed measures are easy to implement for OEMs and, as a bundle of measures, they can reduce the power consumption of the HVAC system by 22% compared to the original vehicle setup. Consequently, this means that they can help to increase the maximum driving range of BEVs, because the HVAC system drains less energy from the battery while keeping the same comfort level for the passengers.
To further reduce the power consumption of the HVAC system, the cabin’s air tightness could already be improved during the design phase or in the manufacturing process. This would further decrease thermal losses, and hence lead to a higher efficiency of the HVAC system.
The results show that even simple measures can significantly increase the system efficiency of HVAC systems. This is especially relevant for BEVs, as the energy for the HVAC system must be taken from the battery, which, in turn, reduces the maximum driving range of the vehicle. In the future, further research needs to be conducted to improve the efficiency of vehicular subsystems, such as the HVAC system, to make BEVs more attractive to users step by step.
Author Contributions
Conceptualization, D.D. and M.K.; methodology, D.D. and M.K.; validation, D.D., M.K. and I.G.; formal analysis, M.K. and I.G.; investigation, D.D., M.K. and I.G.; writing—original draft preparation, D.D. and M.K.; writing—review and editing, I.G.; visualization, D.D., M.K. and I.G.; supervision, D.Š.; project administration, D.Š.; funding acquisition, D.Š. All authors have read and agreed to the published version of the manuscript.
Funding
This research was funded by European Union’s Horizon research and innovation program under grant number 101096028, and project name “EMPOWER”. The content of this publication is the sole responsibility of the consortium partners listed herein and does not necessarily represent the view of the European Commission or its services. 
Data Availability Statement
The data presented in this study are available upon request from the corresponding author due to legal reasons.
Acknowledgments
We would like to acknowledge the close collaboration and support from IVECO, who supplied us with the truck cabin that was used in this study as a demonstrator. Without their support, the presented investigation from this manuscript would not have been possible. Also, we want to express our sincere thanks to Jacqueline Winter for her detailed review, and hence improvement, of this manuscript.
Conflicts of Interest
Dominik Dvorak, Milan Kardos, Imre Gellai and Dragan Šimić are employees of AIT Austrian Institute of Technology GmbH. The authors declare that the research was conducted in the absence of any commercial or financial relationships that could be construed as a potential conflict of interest.
Abbreviations
The following abbreviations are used in this manuscript:
| ASHRAE | American society of heating, refrigerating and air-conditioning engineers |
| BEV | Battery-electric vehicle |
| CO2 | Carbon dioxide |
| HVAC | Heating, ventilation, and air-conditioning |
| OEM | Original equipment manufacturer |
| PID | Proportional–integral–derivative controller |
References
- European Union. The European Green Deal. Available online: https://commission.europa.eu/strategy-and-policy/priorities-2019-2024/european-green-deal_en (accessed on 5 November 2024).
- Bhardwaj, S.; Mostofi, H. Technical and Business Aspects of Battery Electric Trucks—A Systematic Review. Future Transp. 2022, 2, 382–401. [Google Scholar] [CrossRef]
- Moll, C.; Plötz, P.; Hadwich, K.; Wietschel, M. Are battery-electric trucks for 24-hour delivery the future of city logistics?—A german case study. World Electr. Veh. J. 2020, 11, 16. [Google Scholar] [CrossRef]
- Gellai, I.; Popovac, M.; Kardos, M.; Simic, D. Numerical analysis of the energy efficiency measures for improving the truck cabin thermal performance. Eng. Model. Anal. Simul. 2024, 2, 1–8. [Google Scholar] [CrossRef]
- Muratori, L.; Peretto, L.; Pulvirenti, B.; Sante, R.D.; Bottiglieri, G.; Coiro, F. A vehicle integrated thermal management system for electric busses. In Proceedings of the 2022 IEEE International Workshop on Metrology for Automotive, MetroAutomotive 2022—Proceedings, Modena, Italy, 4–6 July 2022; pp. 139–144. [Google Scholar] [CrossRef]
- Widmer, F.; van Dooren, S.; Onder, C.H. Optimization of the energy-comfort trade-off of HVAC systems in electric city buses based on a steady-state model. Control Eng. Pract. 2025, 154, 106158. [Google Scholar] [CrossRef]
- Haiyan, Z.; Dawei, C.; Yu, L. Research on Key Influencing Factors of Endurance Mileage of Battery Electric Vehicle. In Proceedings of the Proceedings—2022 7th Asia Conference on Power and Electrical Engineering, ACPEE 2022, Virtual, 16–17 April 2022; pp. 235–239. [Google Scholar] [CrossRef]
- Dvorak, D.; Basciotti, D.; Gellai, I. Demand-based control design for efficient heat pump operation of electric vehicles. Energies 2020, 13, 5440. [Google Scholar] [CrossRef]
- Lajunen, A.; Yang, Y.; Emadi, A. Review of Cabin Thermal Management for Electrified Passenger Vehicles. IEEE Trans. Veh. Technol. 2020, 69, 6025–6040. [Google Scholar] [CrossRef]
- Basciotti, D.; Dvorak, D.; Gellai, I. A Novel Methodology for Evaluating the Impact of Energy Efficiency Measures on the Cabin Thermal Comfort of Electric Vehicles. Energies 2020, 13, 3872. [Google Scholar] [CrossRef]
- Golubev, T.; Canull, L.; Edel, Z. Modeling the Impact of Thermal Management on Electric Vehicle Energy Consumption and Driving Range. In Proceedings of the 2024 40th Semiconductor Thermal Measurement, Modeling and Management Symposium (SEMI-THERM), San Jose, CA, USA, 25–28 March 2024; pp. 1–7. [Google Scholar]
- Li, X.; Wang, R. Towards integrated thermal management systems in battery electric vehicles: A review. eTransportation 2025, 24, 100396. [Google Scholar] [CrossRef]
- De Nunzio, G.; Sciarretta, A.; Steiner, A.; Mladek, A. Thermal management optimization of a heat-pump-based HVAC system for cabin conditioning in electric vehicles. In Proceedings of the 2018 Thirteenth International Conference on Ecological Vehicles and Renewable Energies (EVER), Monte Carlo, Monaco, 10–12 April 2018; IEEE: Piscataway, NJ, USA, 2018; pp. 1–7. [Google Scholar] [CrossRef]
- Hong, J.; Song, J.; Han, U.; Kim, H.; Choi, H.; Lee, H. Performance investigation of electric vehicle thermal management system with thermal energy storage and waste heat recovery systems. eTransportation 2024, 20, 100317. [Google Scholar] [CrossRef]
- Lee, J.T.; Kwon, S.; Lim, Y.; Chon, M.S.; Kim, D. Effect of air-conditioning on driving range of electric vehicle for various driving modes. In Proceedings of the Asia Pacific Automotive Engineering Conference, Bangkok, Thailand, 1–3 April 2013; SAE Technical Papers. Volume 1. [Google Scholar] [CrossRef]
- Hao, X.; Wang, H.; Lin, Z.; Ouyang, M. Seasonal effects on electric vehicle energy consumption and driving range: A case study on personal, taxi, and ridesharing vehicles. J. Clean. Prod. 2020, 249, 119403. [Google Scholar] [CrossRef]
- Lokur, P.; Nicklasson, K.; Verde, L.; Larsson, M.; Murgovski, N. Modeling of the Thermal Energy Management System for Battery Electric Vehicles. In Proceedings of the 2022 IEEE Vehicle Power and Propulsion Conference, VPPC 2022—Proceedings, Merced, CA, USA, 1–4 November 2022; pp. 1–7. [Google Scholar] [CrossRef]
- Hellmuth, J.F.; Steeb, M.; Pollak, M.; Jäger, F.; Tegethoff, W.; Köhler, J. Innovative thermal management operating strategies for battery-electric heavy-duty trucks. In Proceedings of the 36th International Conference on Efficiency, Cost, Optimization, Simulation and Environmental Impact of Energy Systems, ECOS 2023, Canary Islands, Spain, 25–30 June 2023; pp. 2581–2592. [Google Scholar] [CrossRef]
- Zhang, Y.F.; Wyon, D.P.; Fang, L.; Melikov, A.K. The influence of heated or cooled seats on the acceptable ambient temperature range. Ergonomics 2007, 50, 586–600. [Google Scholar] [CrossRef] [PubMed]
- Oi, H.; Yanagi, K.; Tabat, K.; Tochihar, Y. Effects of heated seat and foot heater on thermal comfort and heater energy consumption in vehicle. Ergonomics 2011, 54, 690–699. [Google Scholar] [CrossRef]
- Frohner, A.; Dvorak, D.; Bäuml, T.; Simic, D. Novel heating concept for full electric vehicles. E I Elektrotechn. Inf. 2015, 132, 168–171. [Google Scholar] [CrossRef]
- Steinstraeter, M.; Buberger, J.; Minnerup, K.; Trifonov, D.; Horner, P.; Weiss, B.; Lienkamp, M. Controlling cabin heating to improve range and battery lifetime of electric vehicles. eTransportation 2022, 13, 100181. [Google Scholar] [CrossRef]
- Schutzeich, P.; Pischinger, S.; Hemkemeyer, D.; Franke, K.; Hamelbeck, P. A Predictive Cabin Conditioning Strategy for Battery Electric Vehicles. World Electr. Veh. J. 2024, 15, 224. [Google Scholar] [CrossRef]
- Goh, C.C.; Kamarudin, L.M.; Shukri, S.; Abdullah, N.S.; Zakaria, A. Monitoring of carbon dioxide (CO2) accumulation in vehicle cabin. In Proceedings of the 2016 3rd International Conference on Electronic Design, ICED 2016, Phuket, Thailand, 11–12 August 2016; pp. 427–432. [Google Scholar] [CrossRef]
- Jung, H. Modeling CO2 concentrations in vehicle cabin. In Proceedings of the SAE 2013 World Congress & Exhibition, Detroit, MI, USA, 16–18 April 2013; SAE Technical Paper. Volume 2, pp. 1–6. [Google Scholar] [CrossRef]
- Wei, D.; Nielsen, F.; Karlsson, H.; Ekberg, L.; Dalenbäck, J.O. Vehicle cabin air quality: Influence of air recirculation on energy use, particles, and CO2. Environ. Sci. Pollut. Res. 2023, 30, 43387–43402. [Google Scholar] [CrossRef]
- Persily, A.; Bahnfleth, W.P.; Kipen, H.; Lau, J.; Mandin, C.; Sekhar, C.; Wargocki, P.; Weekes, L.C.N. ASHRAE Position Document on Indoor Carbon Dioxide; ASHRAE: Atlanta, GA, USA, 2022. [Google Scholar]
- Persily, A.; de Jonge, L. Carbon dioxide generation rates for building occupants. Indoor Air 2017, 27, 868–879. [Google Scholar] [CrossRef] [PubMed]
- The Engineering ToolBox. Ethylene Glycol Heat-Transfer Fluid Properties. Available online: https://www.engineeringtoolbox.com/ethylene-glycol-d_146.html (accessed on 20 November 2024).
- TC Ltd. Thermocouple Tolerances. Available online: https://www.tc.co.uk/thermocouple-information/thermocouple-tolerances.html (accessed on 9 January 2025).
- Recair. Recair Introduces Tomorrow’s Heat Exchangers Today Recair Sets the bar Higher Again. Available online: https://www.recair.com/upload/fck/file/BROSensitiveRS160EN.pdf (accessed on 13 January 2025).
Disclaimer/Publisher’s Note: The statements, opinions and data contained in all publications are solely those of the individual author(s) and contributor(s) and not of MDPI and/or the editor(s). MDPI and/or the editor(s) disclaim responsibility for any injury to people or property resulting from any ideas, methods, instructions or products referred to in the content. |
© 2025 by the authors. Published by MDPI on behalf of the World Electric Vehicle Association. Licensee MDPI, Basel, Switzerland. This article is an open access article distributed under the terms and conditions of the Creative Commons Attribution (CC BY) license (https://creativecommons.org/licenses/by/4.0/).