


Multi Objective Optimization of Electric Vehicle Charging Strategy Considering User Selectivity

Abstract
1. Introduction
2. Mathematical Model for EV Charging
2.1. Modeling of CL for EVs
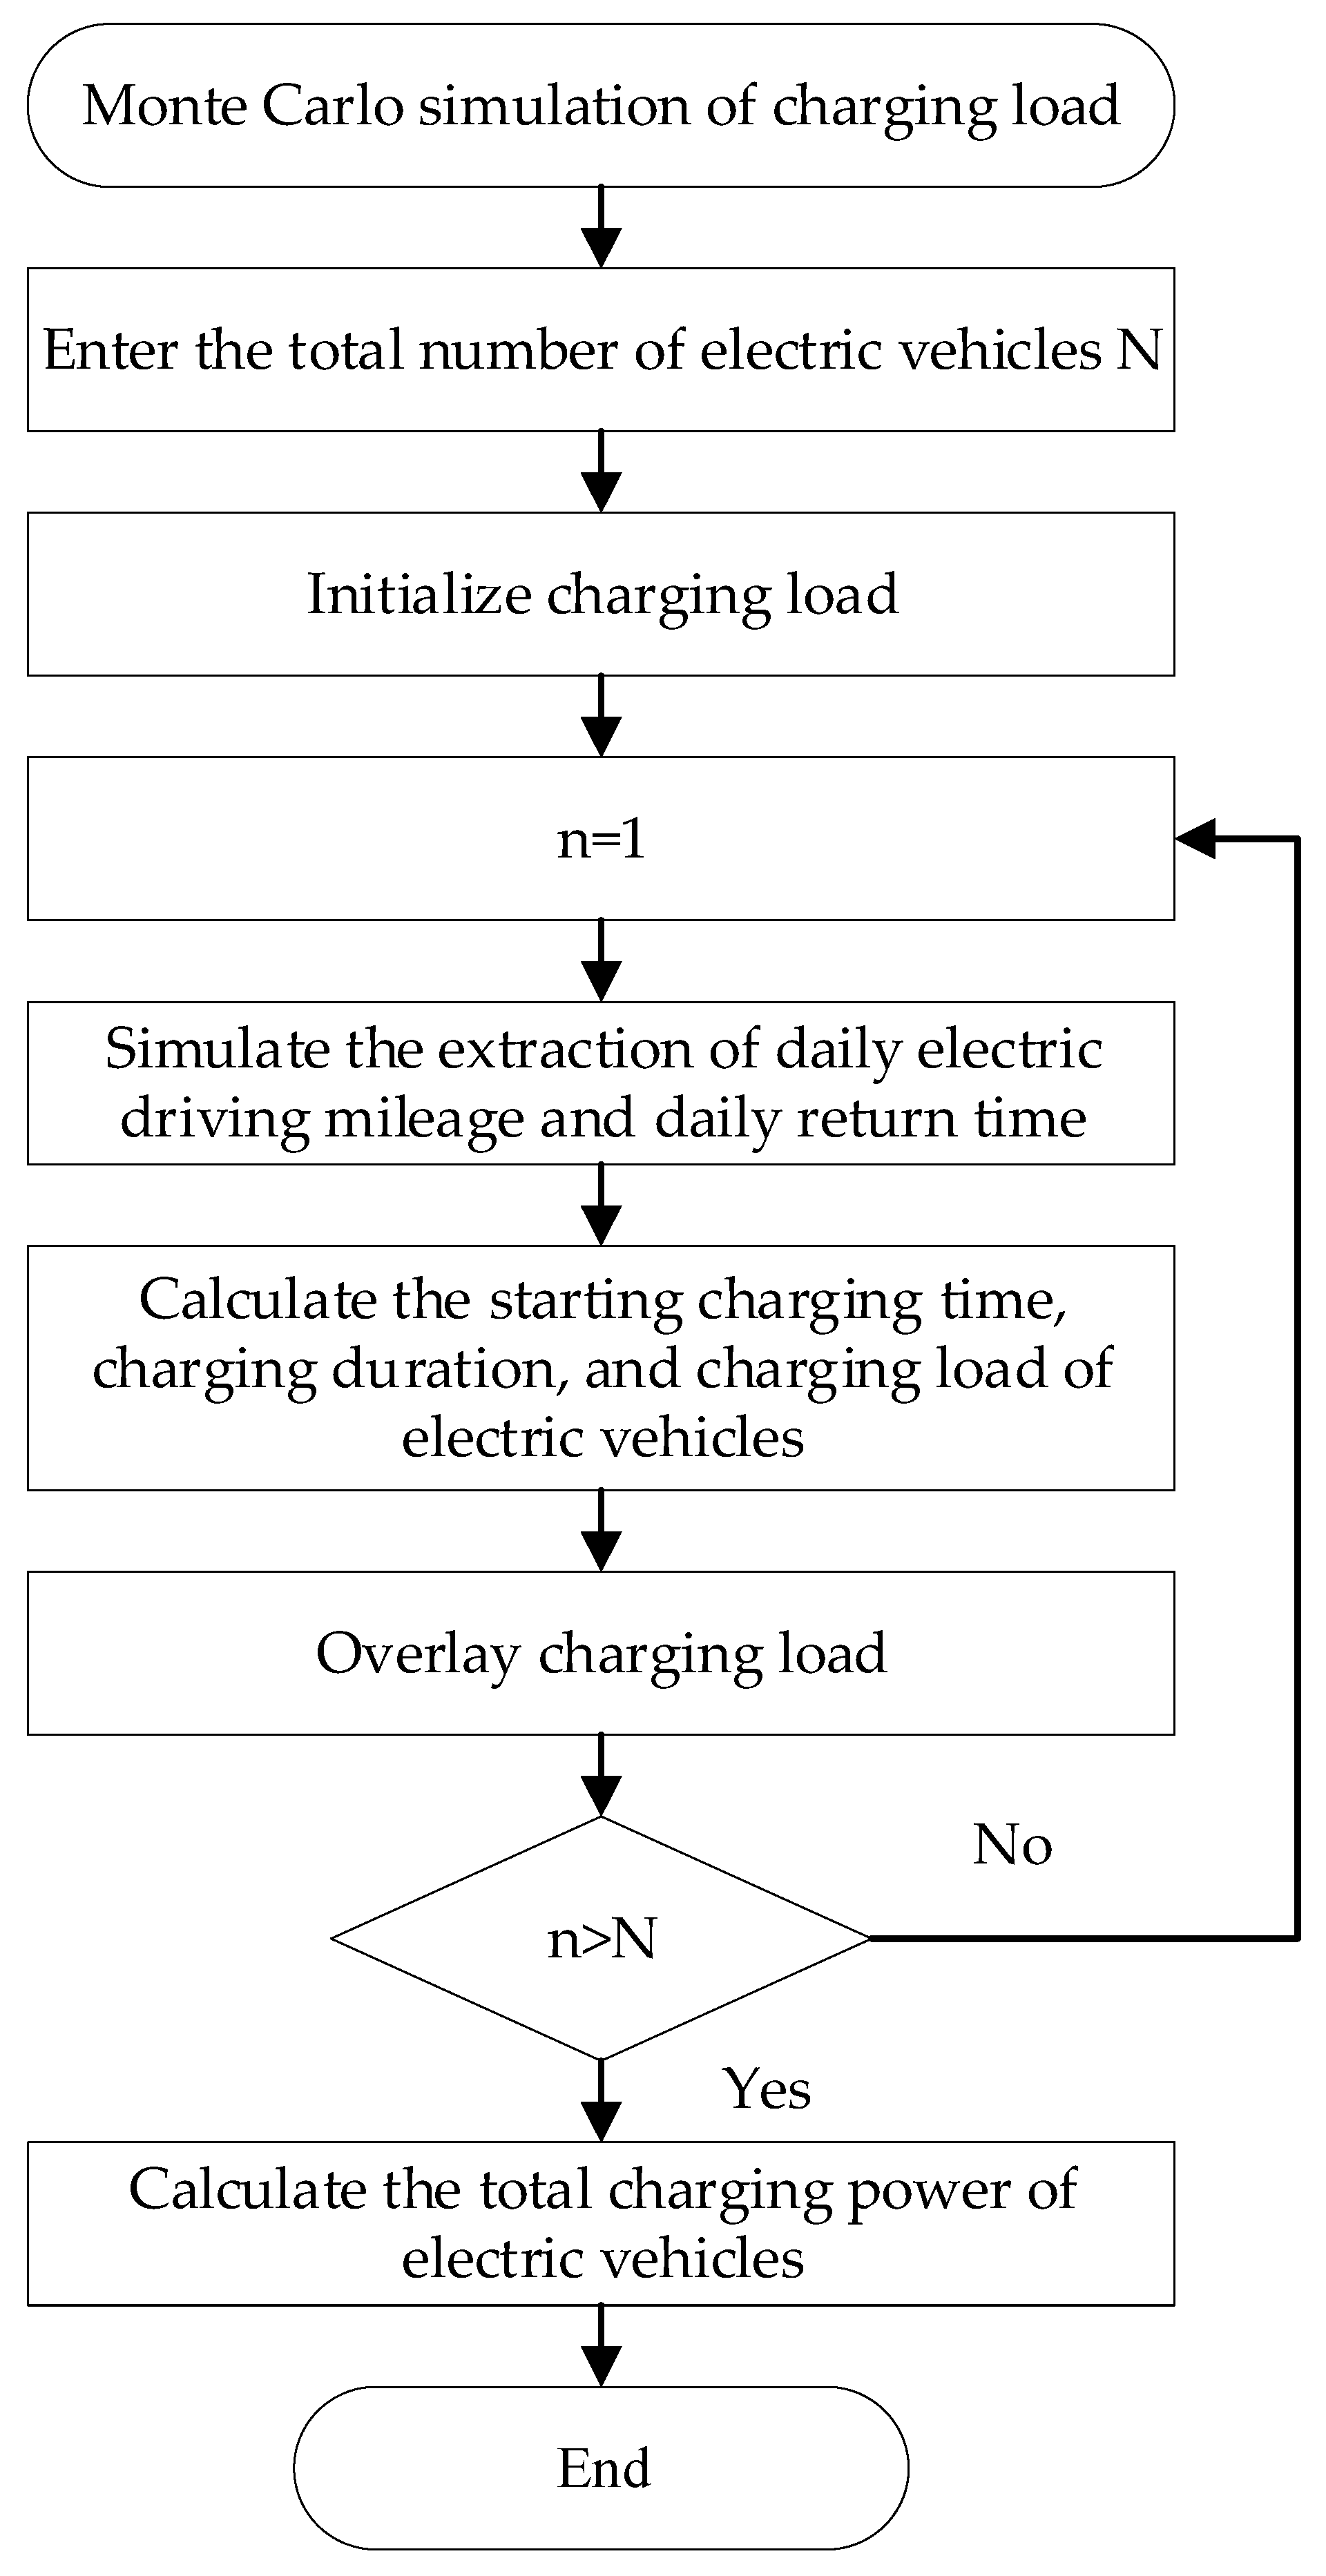
2.2. EV Load Sampling Based on Monte Carlo Algorithm
3. Multi Objective Optimization Model and Solving Algorithm for EV Charging
3.1. Selective Strategy for EV Users
3.2. Objective Function
3.2.1. The Minimum PVLD Rate of the PG
3.2.2. The Minimum CC for Users
3.3. Constraints
3.4. Improving Non-Dominated Sorting Whale Optimization Algorithm
3.4.1. Multi Objective Whale Optimization Algorithm (WOA)
3.4.2. Improvement Methods
- (1)
- Logistic chaotic mapping (LCM)
- (2)
- Nonlinear convergence factor
- (3)
- Adaptive inertia weight
3.5. The INSWOA Process
4. Simulation Examples and Result Analysis
5. Discussion
6. Conclusions
Author Contributions
Funding
Data Availability Statement
Conflicts of Interest
References
- Ma, K.; Hu, X.; Yang, J.; Yue, Z.; Yang, B.; Liu, Z. Electric taxi charging strategy based on stackelberg game considering hotspot information. IEEE Trans. Veh. Technol. 2022, 71, 2427–2436. [Google Scholar] [CrossRef]
- Yu, D.; Yang, C.; Jiang, L.; Li, T.; Yan, G.; Gao, F. Review on safety protection of electric vehicle charging. Chin. J. Electr. Eng. 2022, 42, 2145–2164. [Google Scholar]
- Huang, X.; Liu, Y.; Shen, F.; Gao, S.; Gu, Y.; Yang, Z. Vehicle to grid: Review and prospect. Power Syst. Autom. 2024, 48, 3–23. [Google Scholar]
- Pei, Z.; Wang, X.; Kang, L. Review on control strategies for electric vehicles participating in ancillary services of power grid. Power Syst. Autom. 2023, 47, 17–32. [Google Scholar]
- Zhang, S.; James, J.; Yu, Q. Online joint ride-sharing and dynamic vehicle-to-grid coordination for connected electric vehicle system. IEEE Trans. Transp. Electrif. 2024, 10, 1194–1206. [Google Scholar] [CrossRef]
- Zhang, Y.; You, P.; Cai, L. Optimal charging scheduling by pricing for EV charging station with dual charging modes. IEEE Trans. Intell. Transp. Syst. 2019, 20, 3386–3396. [Google Scholar] [CrossRef]
- Wang, J.; Huang, K.; Xu, X.; Wu, L.; Jiang, W. Ordered charging of electric vehicles based on ladder-type carbon price and adaptive time-of-use electricity price. Electr. Power Autom. Equip. 2024, 44, 64–71. [Google Scholar]
- Zhang, L.; Sun, C.; Cai, G.; Huang, N.; Lyu, L. Two-stage optimization strategy for coordinated charging and discharging of EVs based on PSO algorithm. Chin. J. Electr. Eng. 2022, 42, 1837–1852. [Google Scholar]
- Mirheli, A.; Hajibabai, L. Hierarchical optimization of charging infrastructure design and facility utilization. IEEE Trans. Intell. Transp. Syst. 2022, 23, 15574–15587. [Google Scholar] [CrossRef]
- Wang, H.; Chen, S.; Li, M.; Zhu, C.; Wang, Z. Demand-Driven charging strategy-based distributed routing optimization under traffic restrictions in internet of electric vehicles. IEEE Internet Things J. 2024, 11, 35917–35927. [Google Scholar] [CrossRef]
- Dong, H.; Yun, Y.; Wang, N.; Ma, M.; Chen, Z. Two-Stage dispatch optimization strategy for charging and discharging. J. Sol. Energy 2021, 42, 115–124. [Google Scholar]
- Zhang, G.; Chen, C.; Zheng, T. Application of Improved Whale Optimization Algorithm in Ordered Charging of Electric Vehicle. Comput. Eng. Appl. 2021, 57, 272–278. [Google Scholar]
- Gu, Y.; Liu, M. Fair and Privacy-Aware EV Discharging Strategy Using Decentralized Whale Optimization Algorithm for Minimizing Cost of EVs and the EV Aggregator. IEEE Syst. J. 2021, 15, 5571–5582. [Google Scholar] [CrossRef]
- Khan, B.; Singh, P. Selecting a Meta-Heuristic Technique for Smart Micro-Grid Optimization Problem: A Comprehensive Analysis. IEEE Access 2017, 5, 13951–13977. [Google Scholar] [CrossRef]
- Feng, S.; Liu, T.; Pan, S.; Chen, Z.; Wang, Q. Coordinated charging strategy for electric vehicles based on hierarchical optimization. J. Electr. Eng. 2021, 16, 137–144. [Google Scholar]
- Cheng, S.; Chen, Z.; Xu, K.; Kang, Z.; Wei, S. An orderly charging and discharging method for electric vehicles based on a cooperative game and dynamic time-of-use price. Power Syst. Prot. Control 2020, 48, 15–21. [Google Scholar]
- Li, H.; Chen, F.; Xu, T.; Cheng, S.; Mao, Y. Optimization of pure electric vehicle regenerative braking fuzzy control strategy using improved whale algorithm. Mod. Manuf. Eng. 2024, 11, 96–102+130. [Google Scholar]
- Ge, X.; Yang, Y.; Wang, B.; Jiang, X. Electric vehicle charging guidance and coordinated compensation strategy considering vehicle urgency. Electr. Power Autom. Equip. 2024, 44, 81–88+97. [Google Scholar]
- Mao, J.; Liu, R.; Wu, A.; Wu, S.; He, J. An Improved Whale Optimization Algorithm Based PIDF–(1+PI) Cascade Automatic Generation Control for Multi-Area Multi-Source Power System With Capacitive Energy Storage. IEEE Access 2023, 11, 72418–72435. [Google Scholar] [CrossRef]
- Boonraksa, T.; Boonraksa, P.; Pinthurat, W.; Marungsri, B. Optimal Battery Charging Schedule for a Battery Swapping Station of an Electric Bus With a PV Integration Considering Energy Costs and Peak-to-Average Ratio. IEEE Access 2024, 12, 36280–36295. [Google Scholar] [CrossRef]
- Zhang, L.; Yan, Z.; Feng, D.; Xu, S.; Li, N.; Jing, L. Two-stage optimization model based coordinated charging for EV charging station. Power Syst. Technol. 2014, 38, 967–973. [Google Scholar]
- Ma, M.; Ren, Z.; Liu, L.; Liu, X. Optimization of Multi-element Peak Regulation Auxiliary Service Supported by Electric Vehicle Virtual Energy Storage. Acta Energiae Solaris Sin. 2024, 45, 94–103. [Google Scholar]
- Chaudhari, K.; Kandasamy, N.K.; Krishnan, A.; Krishnan, A.; Ukil, A. Agent-Based aggregated behavior modeling for electric vehicle charging load. IEEE Trans. Ind. Inform. 2019, 15, 856–868. [Google Scholar] [CrossRef]
- Shen, J.; Wang, L.; Zhang, J. Integrated scheduling strategy for private electric vehicles and electric taxis. IEEE Trans. Ind. Inform. 2021, 17, 1637–1647. [Google Scholar] [CrossRef]
- Sangswang, A.; Konghirun, M. Optimal strategies in home energy management system integrating solar power, energy storage, and vehicle-to-grid for grid support and energy efficiency. IEEE Trans. Ind. Appl. 2020, 56, 5716–5728. [Google Scholar] [CrossRef]
- Luo, W.; Chang, X.; Fu, R.; Nie, X. Charging-discharging scheduling strategy for electric vehicles considering supply and demand. J. Power Syst. Autom. 2022, 34, 106–112. [Google Scholar]
- Ma, J.; Huo, M.; Zhao, M.; Du, F.; Jing, F.; Feng, Y. Energy Consumption Prediction Method for Electric Vehicles by Integrating Charging Behavior with Data-driven Method. J. Electr. Eng. 2024, 19, 97–105. [Google Scholar]
- Wang, S.; Xiang, Y.; Wang, Y. Electric vehicle distribution path planning method considering temporary parking charging and discharging management. Electr. Power Autom. Equip. 2023, 43, 94–101. [Google Scholar]
- Li, X.; Zhan, Z.; Li, F.; Zhang, L. Bidding strategy for battery swapping station participating in electricity energy and frequency regulation market considering demand response of battery swapping. Power Syst. Autom. 2024, 48, 207–215. [Google Scholar]
- Liu, D.; Zhang, X.; Qian, Y. Evolutionary game coordination strategy of electric vehicle cluster charging and discharging. Power Syst. Prot. Control 2023, 51, 84–93. [Google Scholar]
- Qiu, S.; Liu, L.; Du, X.; Lyu, Y.; Wang, J. Weapon target allocation based on multi-objective whale optimization algorithm. Comput. Appl. Softw. 2023, 40, 248–254+276. [Google Scholar]
- Sun, Q.; Yu, Y.; Wang, Y.; Gao, H. Comprehensive optimization of distribution network using improved whale optimization algorithm. J. Power Syst. Autom. 2021, 33, 22–29. [Google Scholar]
- Ma, R.; Zou, S.; Cao, Y.; Zhang, X.; Liu, Z. Sensitivity analysis-based classification and identification method of a synchronous condenser and its excitation system parameter. Power Syst. Prot. Control 2024, 52, 26–37. [Google Scholar]
- Han, S.; Jiang, X.; Luo, Y.; Jiao, Q.; Tan, J. Photovoltaic MPPT adaptive particle swarm optimization optimization under shading conditions. J. Sol. Energy 2022, 43, 99. [Google Scholar]
- Zhou, C.; Sheng, G.; Li, S. Multi-objective optimal dispatching of microgrid considering electric vehicle integration. J. Electr. Eng. 2023, 8, 211–218. [Google Scholar]
- Wang, H.; Gao, R. Optimal Planning of AC and DC Charging Stations for Electric Vehicles Based on Improved MOPSO Algorithm. Syst. Eng. 2023, 41, 95–103. [Google Scholar]
- Jin, Z.; Hu, Y.; Li, G.; Yue, S. Charging guiding strategy for electric vehicles oriented to a valet charging service. Power Syst. Prot. Control 2022, 50, 76–84. [Google Scholar]


| Time Division | Time-Based Electricity Pricing (CNY/kWh) |
|---|---|
| Peak time 8:00–11:00, 17:00–22:00 | 1.1526 |
| Flat time 11:00–17:00, 22:00–24:00 | 0.6703 |
| Valley time 0:00–8:00 | 0.2805 |
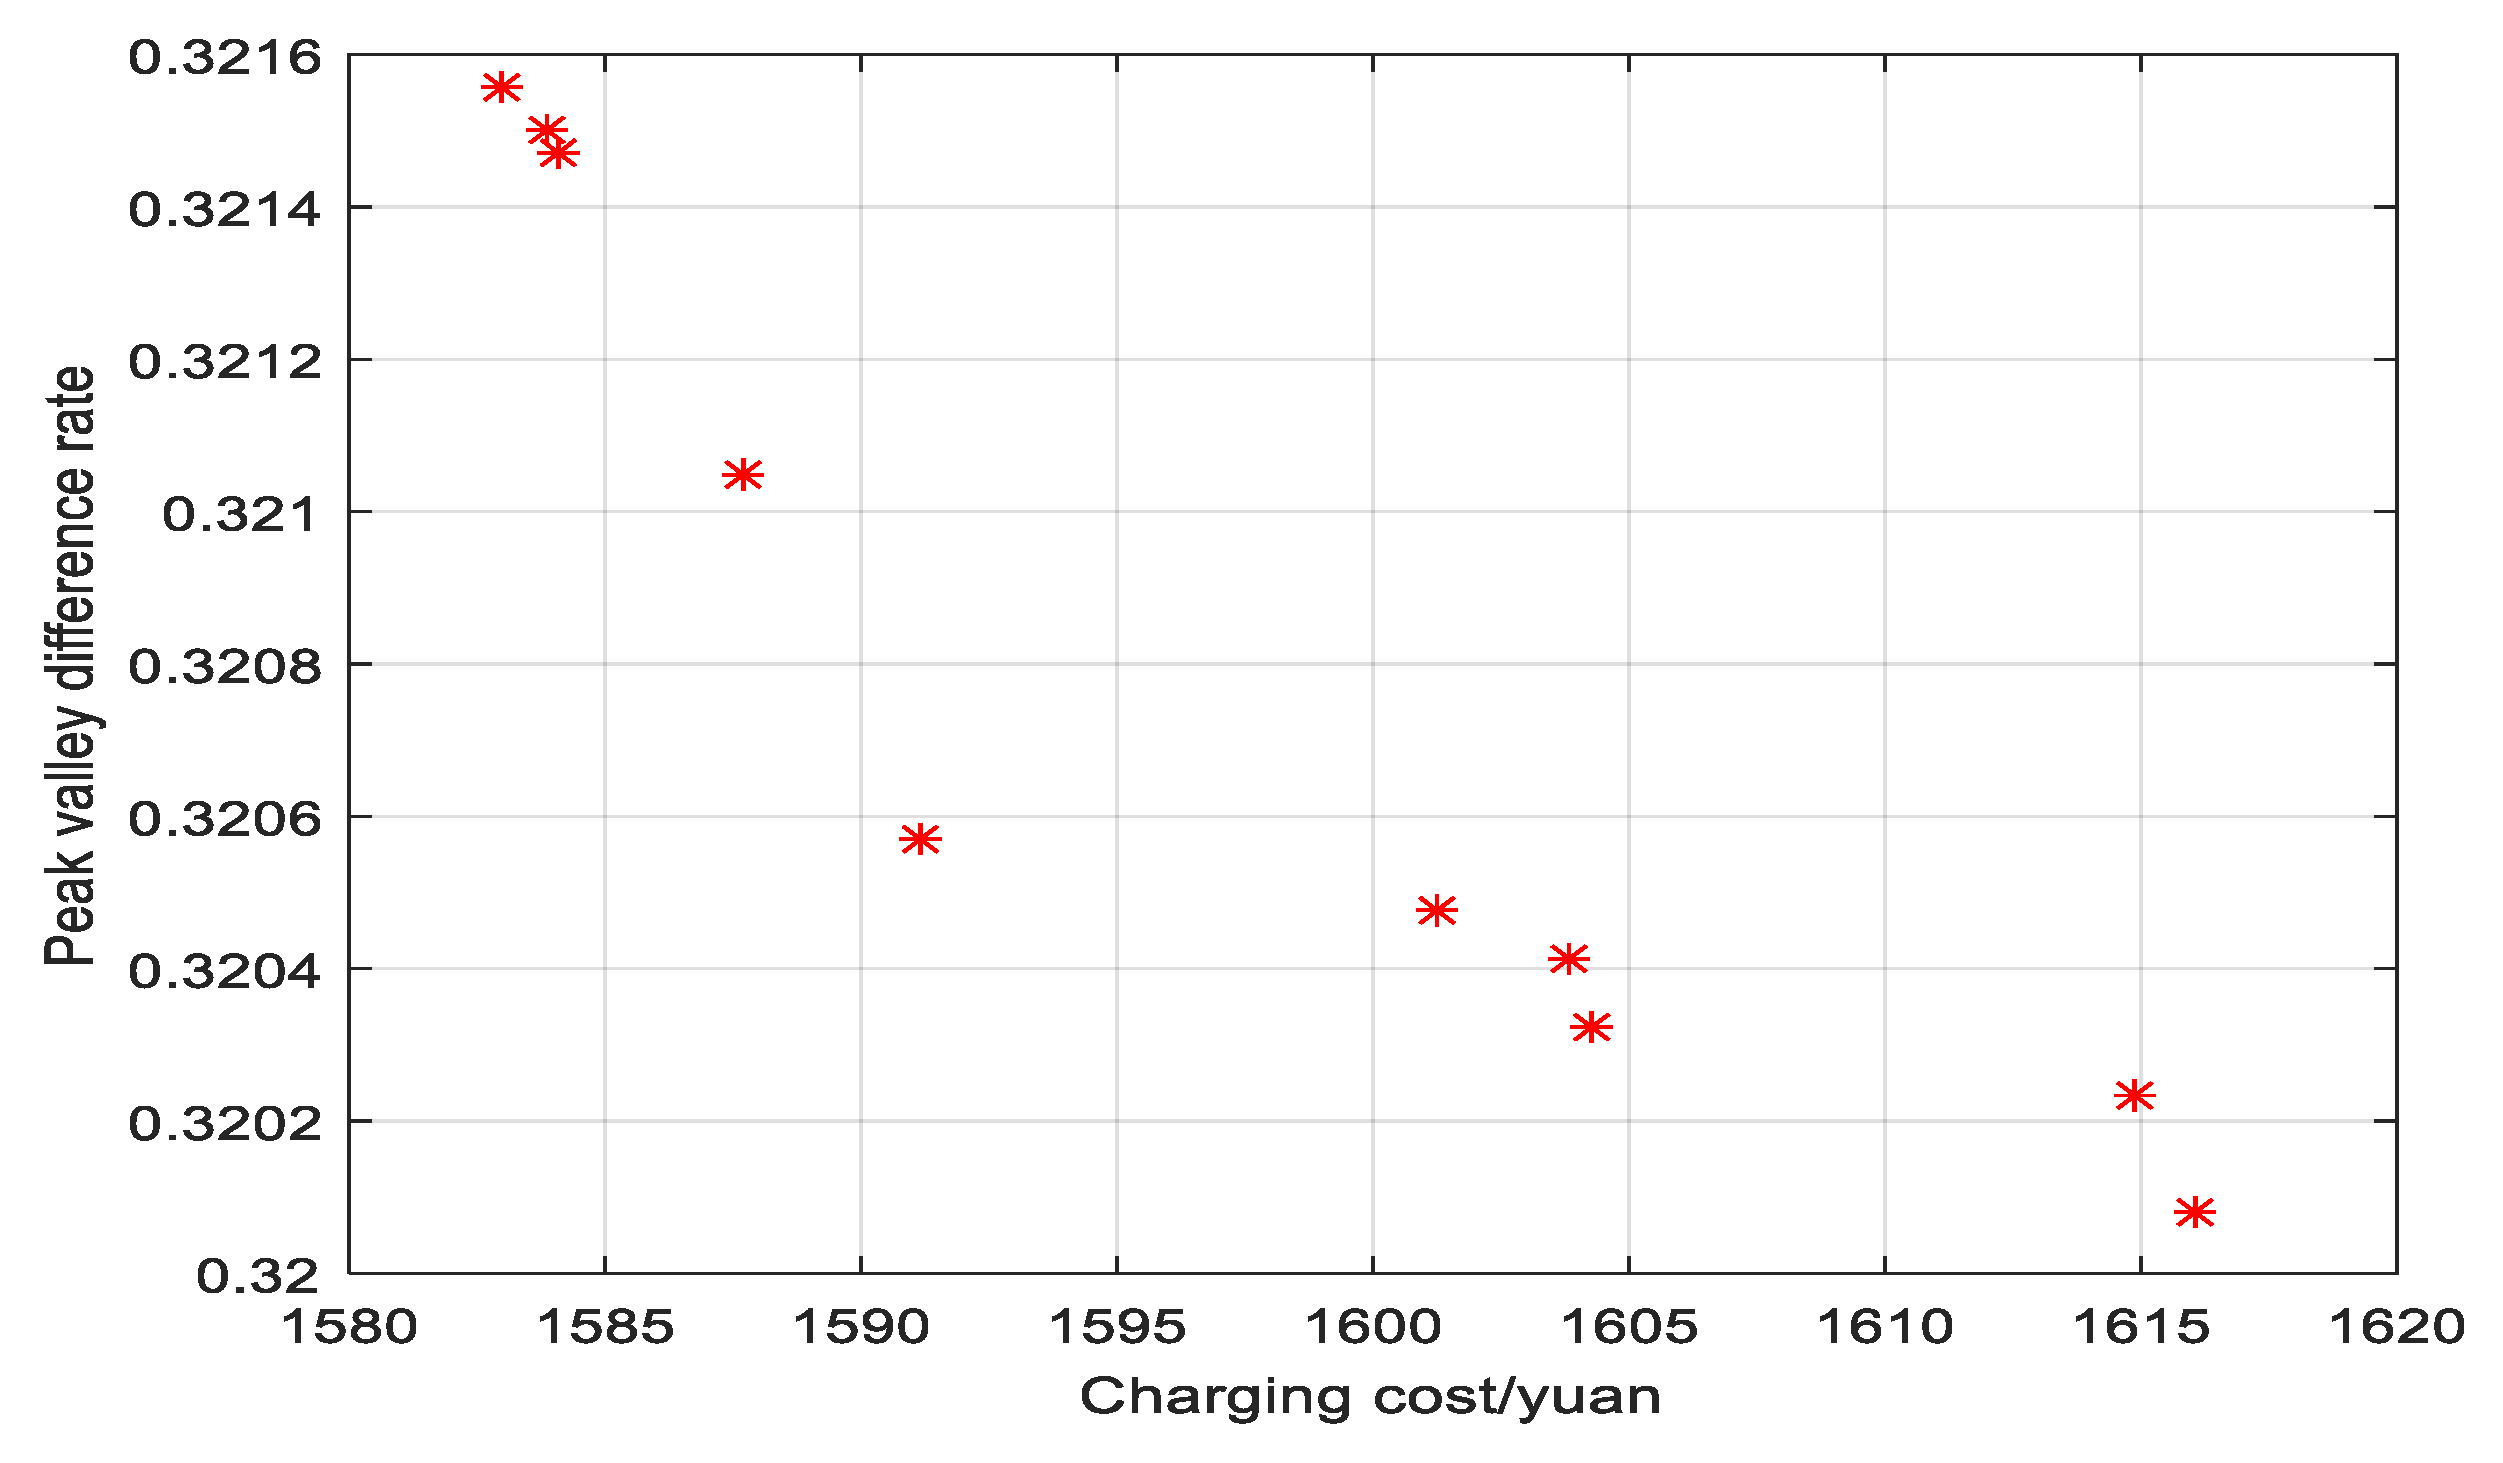
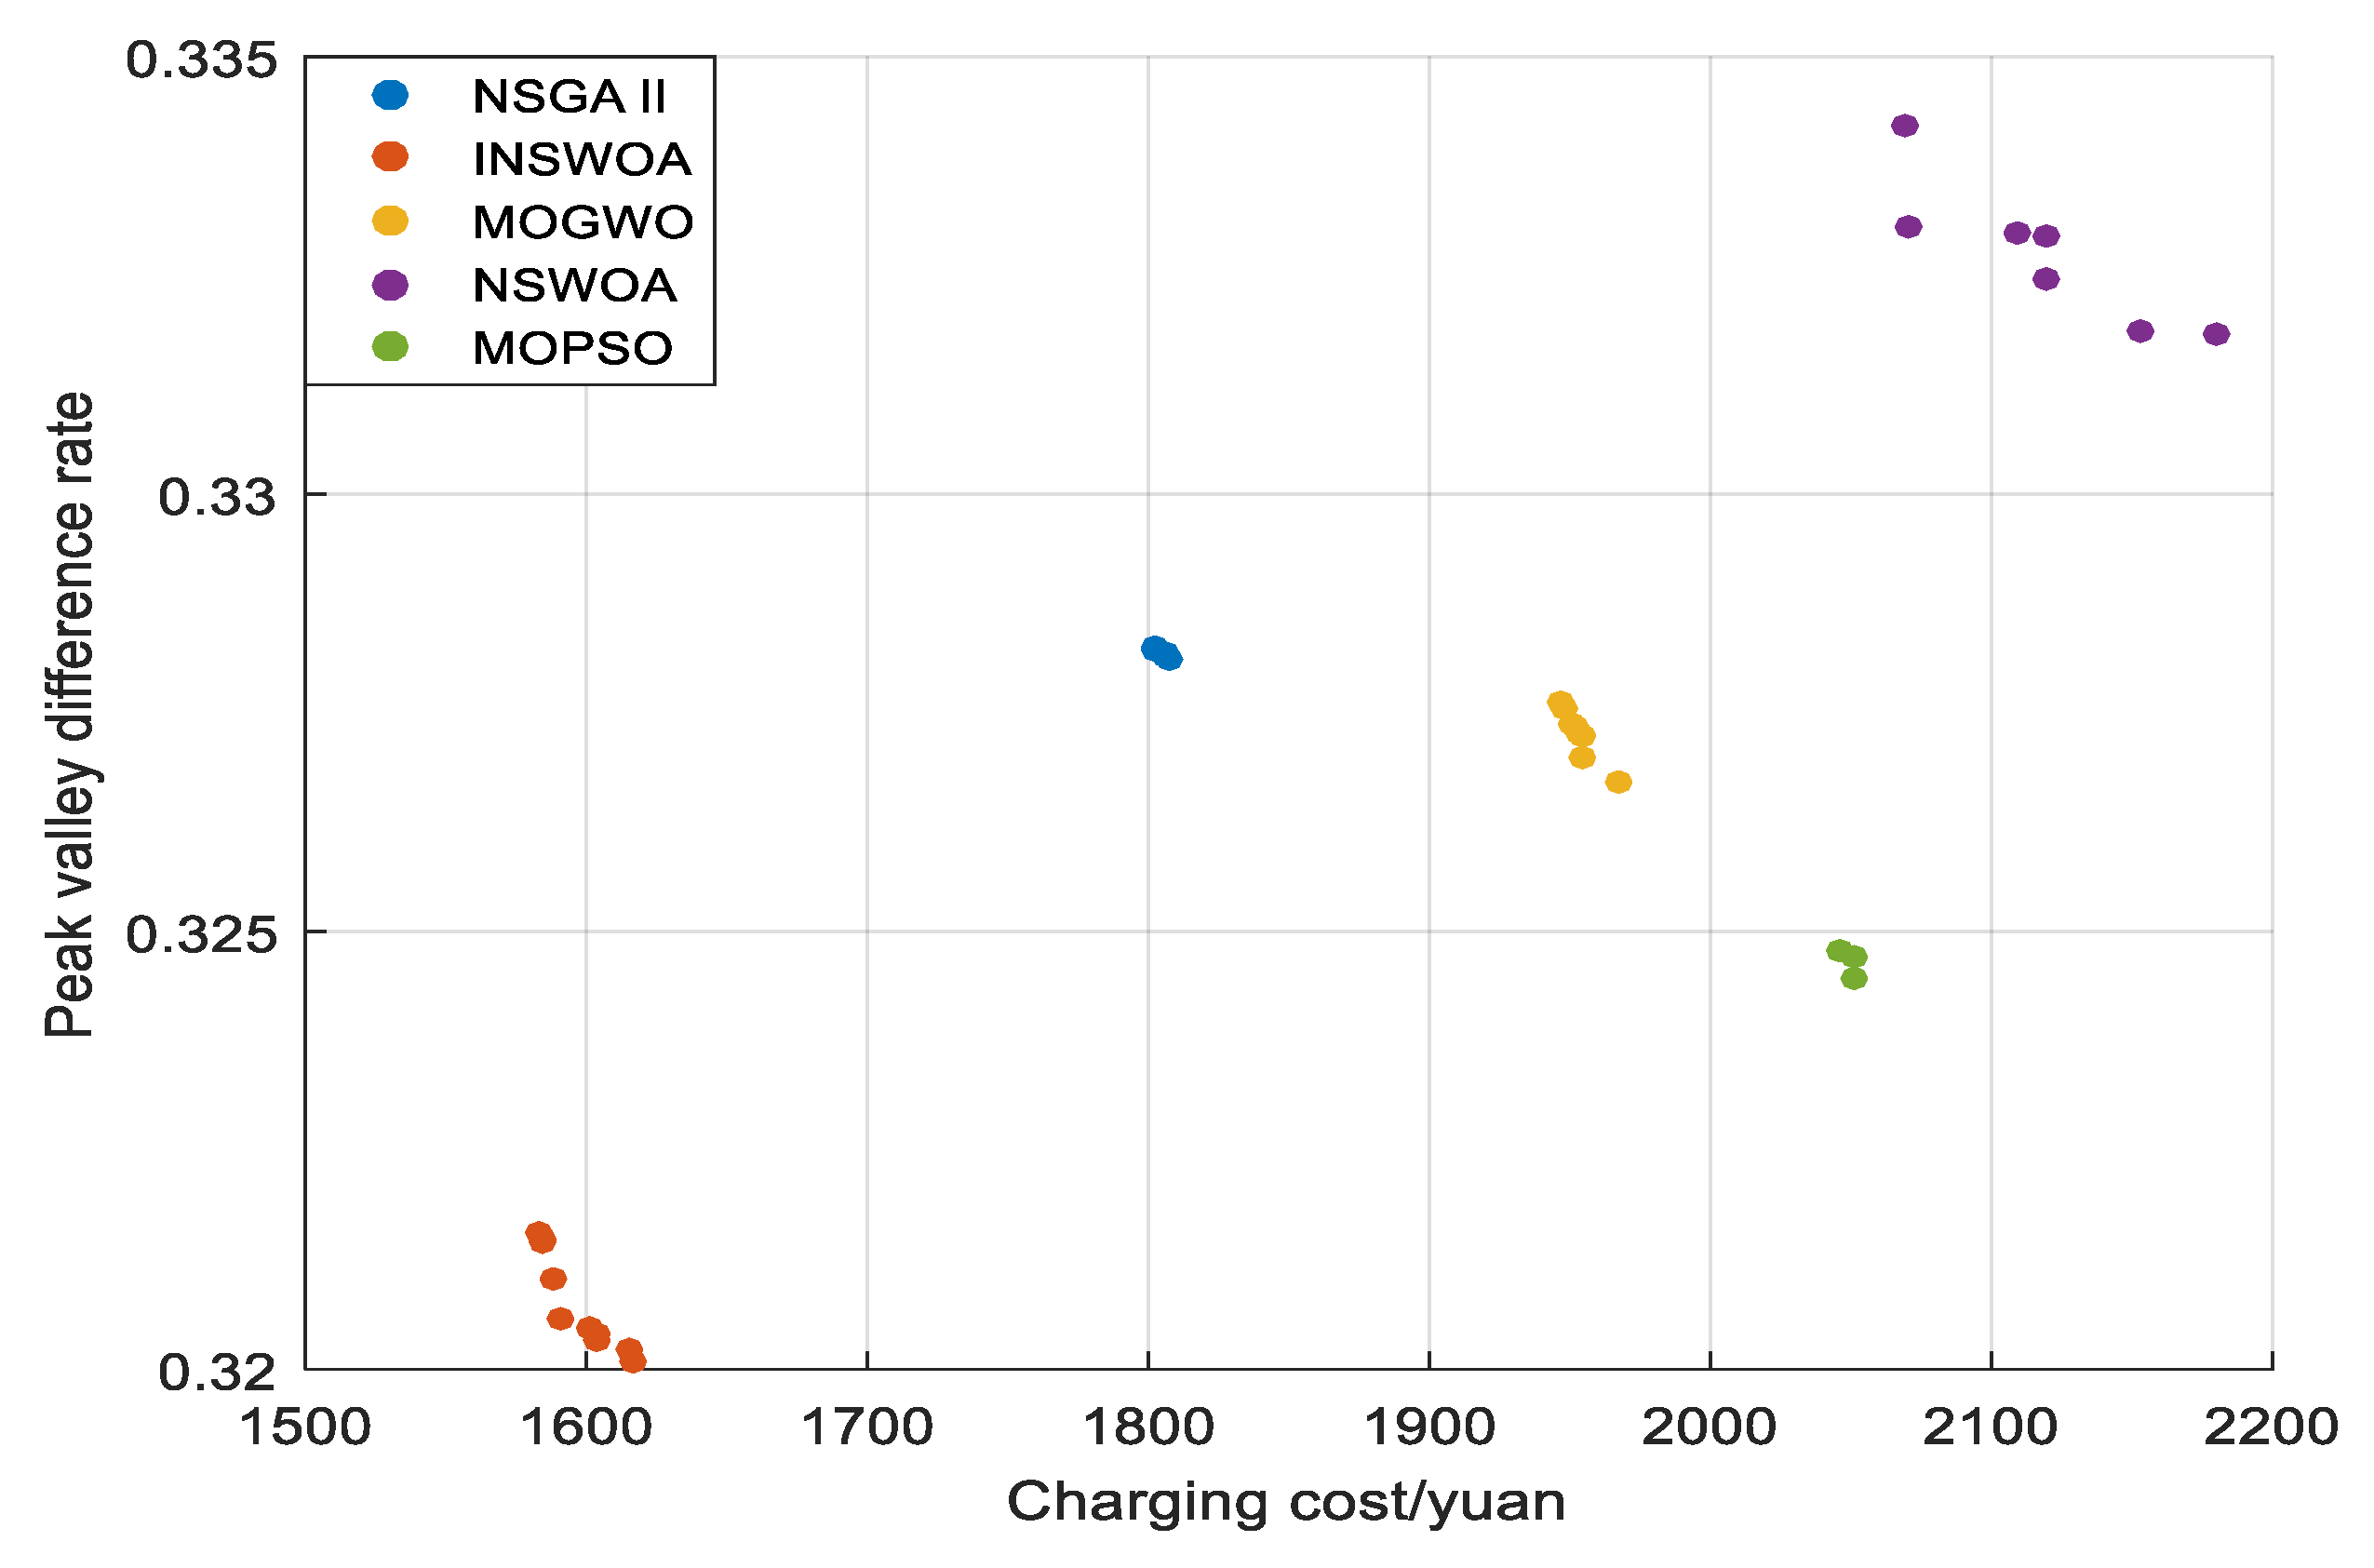
| PVLD | CC |
|---|---|
| 0.3216 | 1582.952 |
| 0.3201 | 1616.057 |
| 0.3204 | 1603.865 |
| 0.3215 | 1584.116 |
| 0.3206 | 1591.188 |
| 0.3210 | 1587.734 |
| 0.3215 | 1583.843 |
| 0.3205 | 1601.284 |
| 0.3203 | 1604.304 |
| 0.3202 | 1614.886 |
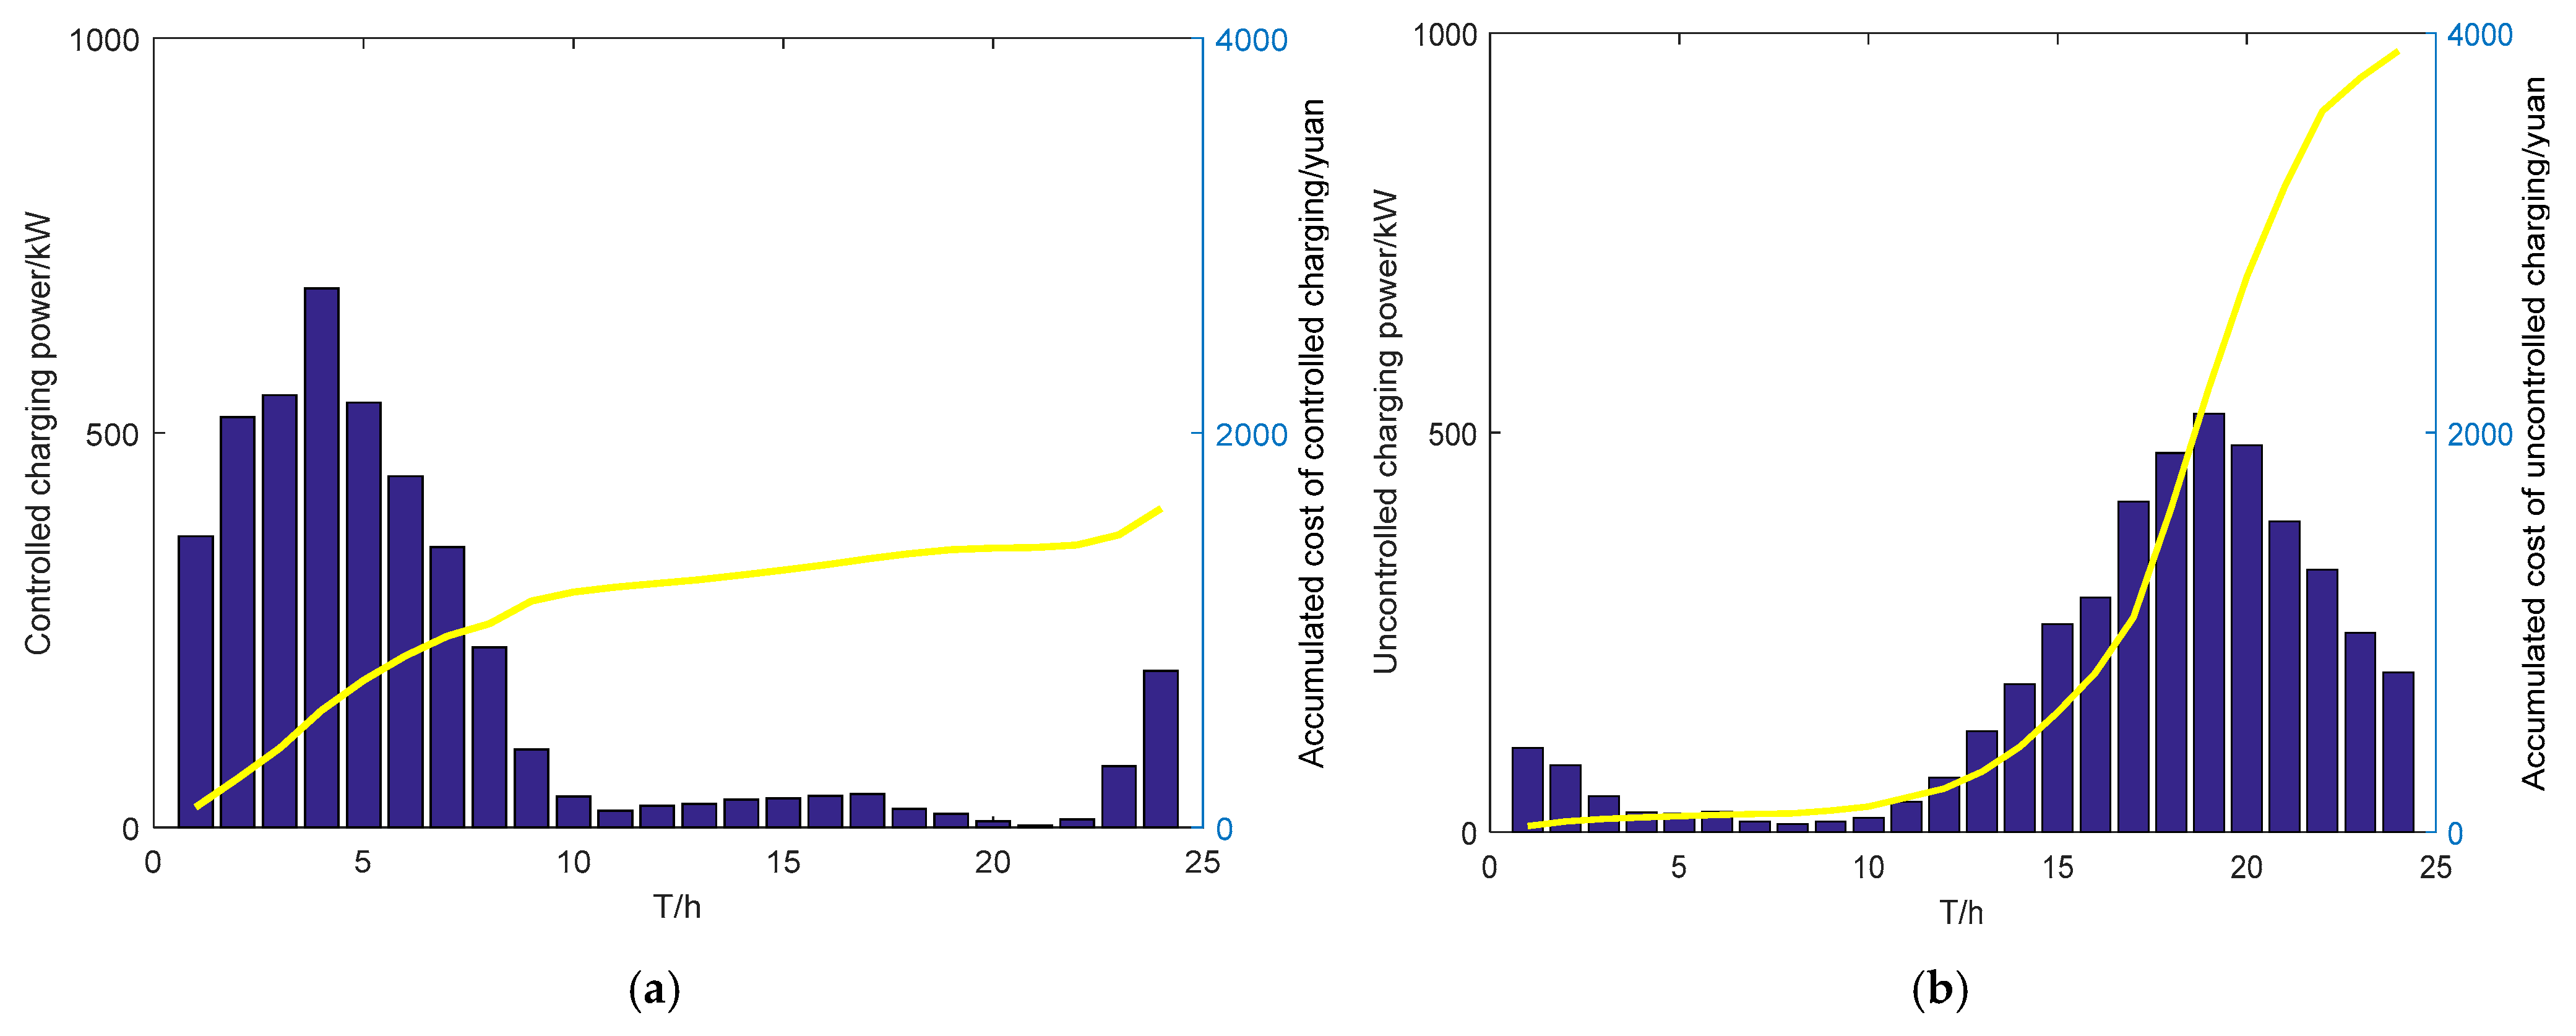
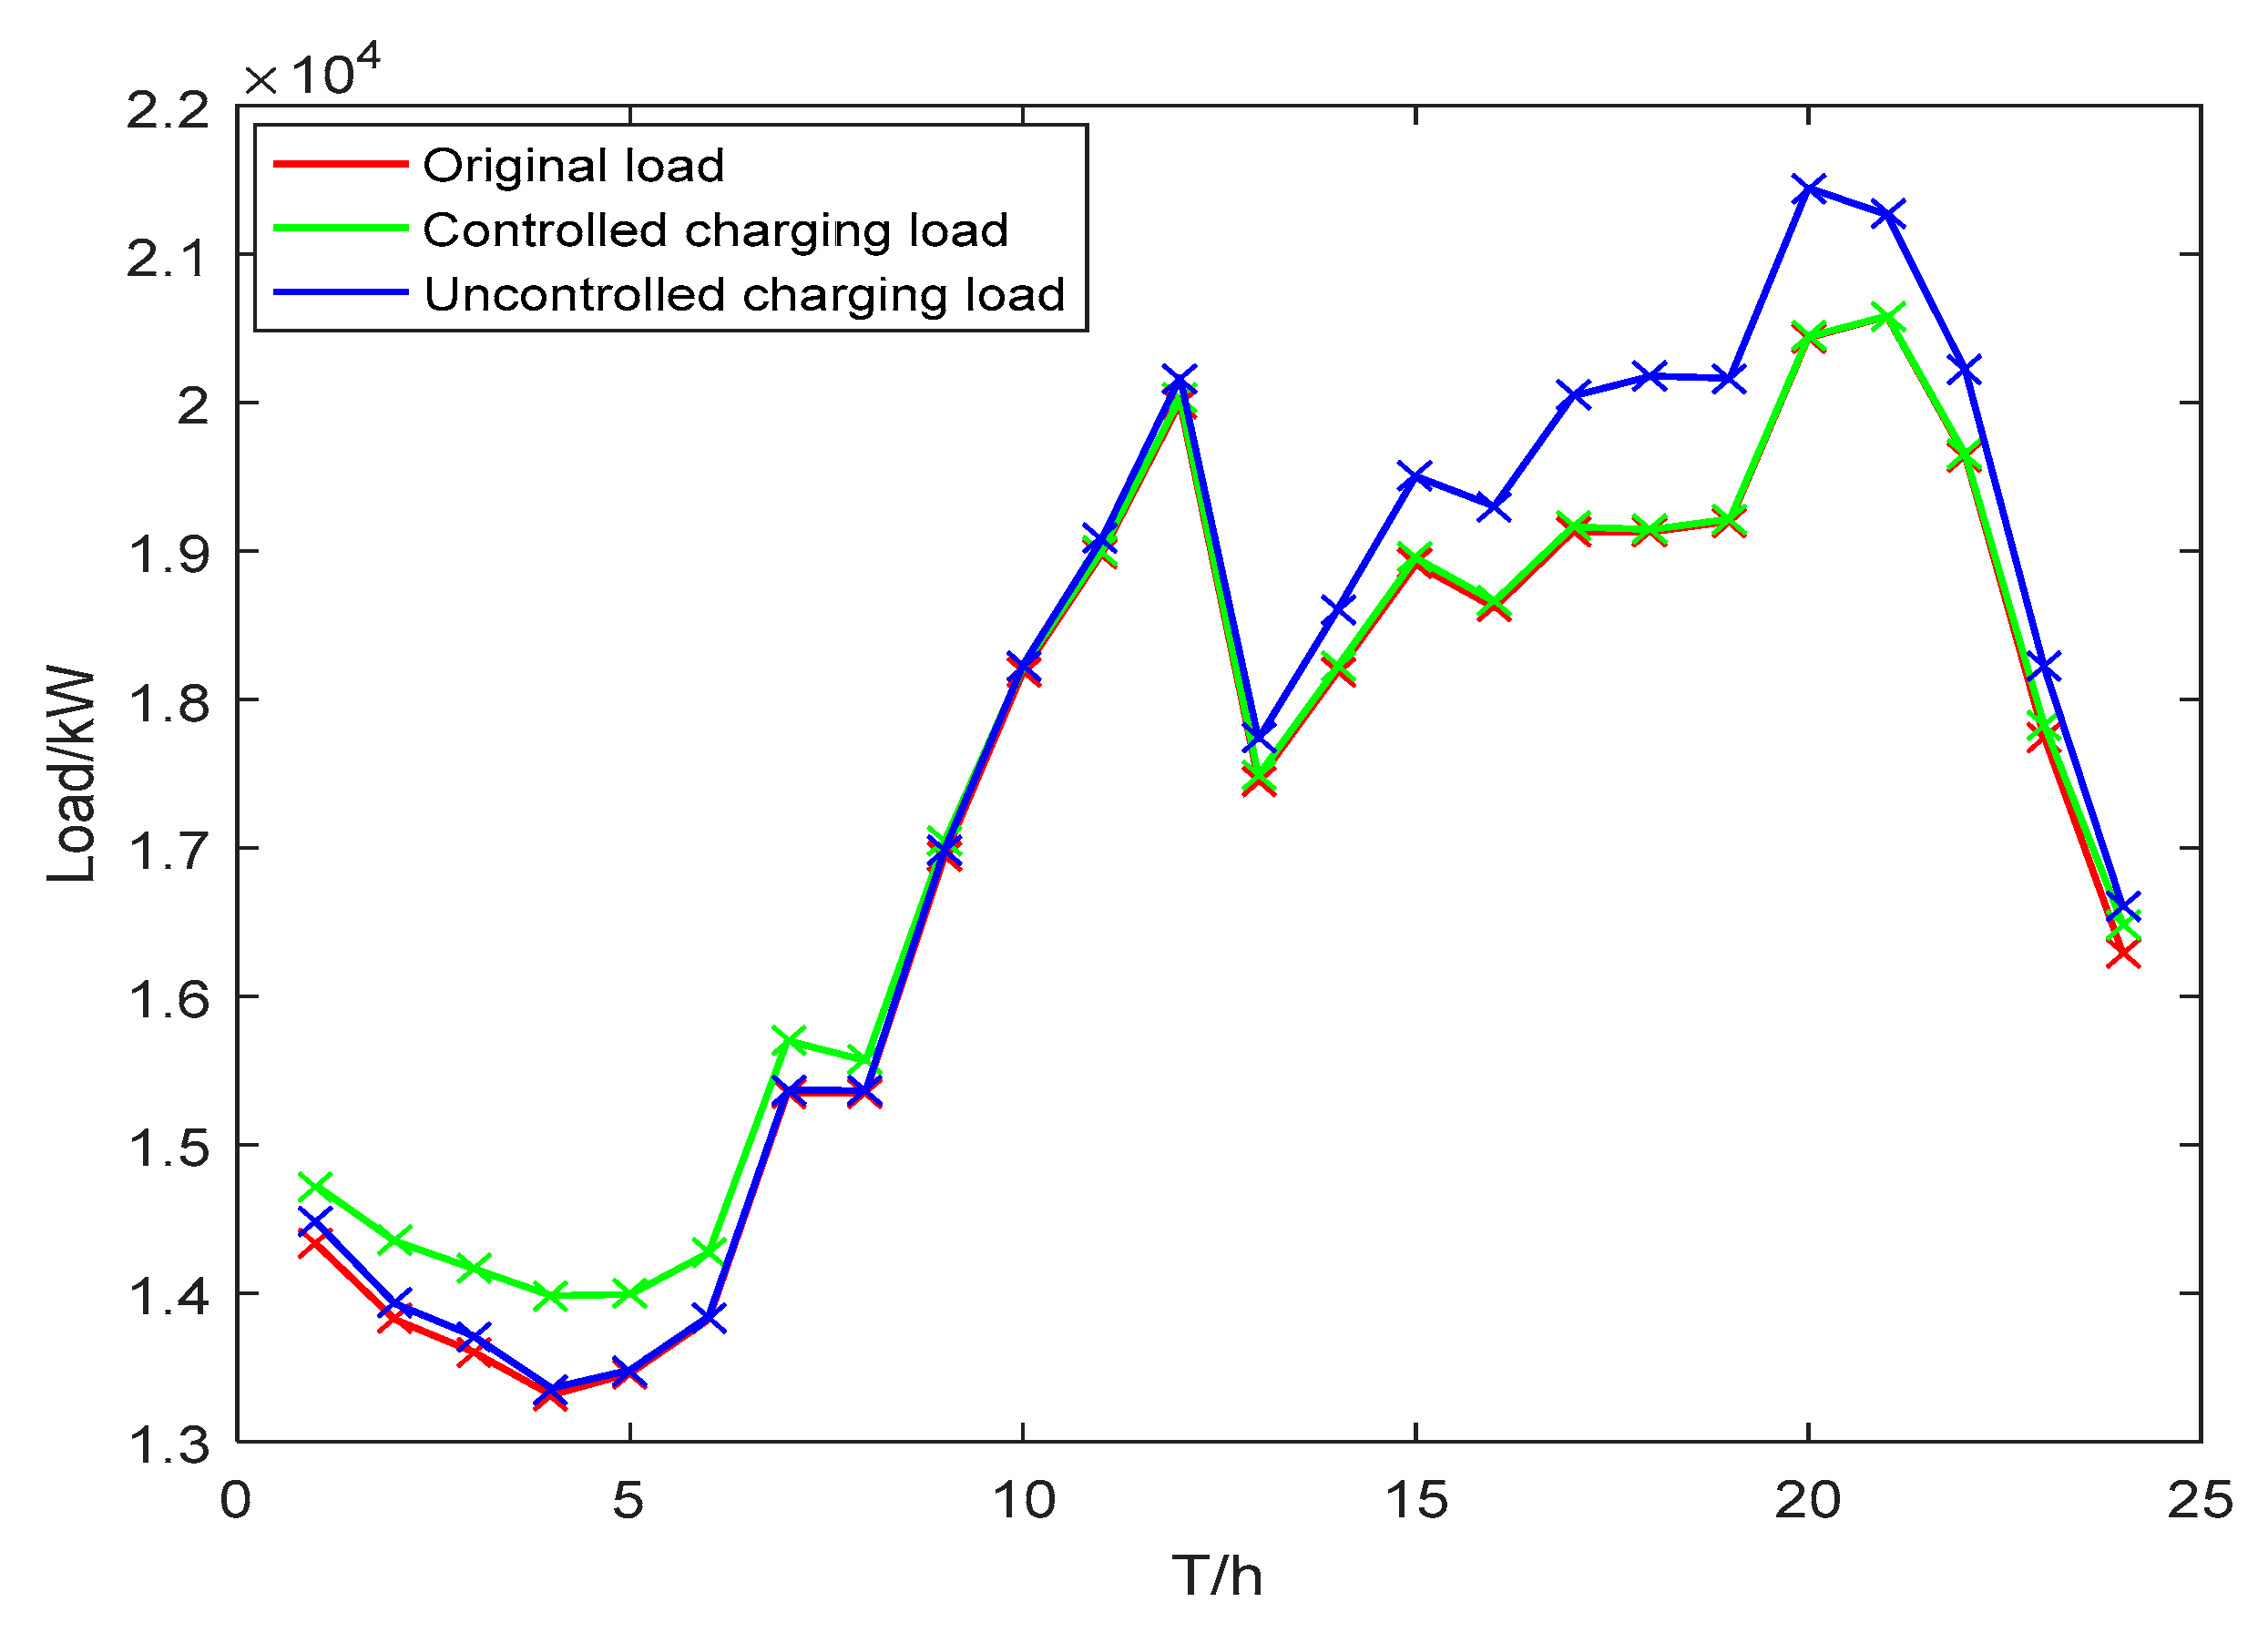
| Charge Mode | Peak Load/kW | Valley Load/kW | PVLD Rate |
|---|---|---|---|
| Original load | 20,583.000 | 13,314.000 | 35.32% |
| uncontrolled charging | 21,449.036 | 13,357.356 | 37.73% |
| controlled charging | 20,585.268 | 13,995.924 | 32.01% |
Disclaimer/Publisher’s Note: The statements, opinions and data contained in all publications are solely those of the individual author(s) and contributor(s) and not of MDPI and/or the editor(s). MDPI and/or the editor(s) disclaim responsibility for any injury to people or property resulting from any ideas, methods, instructions or products referred to in the content. |
© 2025 by the authors. Published by MDPI on behalf of the World Electric Vehicle Association. Licensee MDPI, Basel, Switzerland. This article is an open access article distributed under the terms and conditions of the Creative Commons Attribution (CC BY) license (https://creativecommons.org/licenses/by/4.0/).
Share and Cite
Li, S.; Yan, X.; Wang, G. Multi Objective Optimization of Electric Vehicle Charging Strategy Considering User Selectivity. World Electr. Veh. J. 2025, 16, 95. https://doi.org/10.3390/wevj16020095
Li S, Yan X, Wang G. Multi Objective Optimization of Electric Vehicle Charging Strategy Considering User Selectivity. World Electric Vehicle Journal. 2025; 16(2):95. https://doi.org/10.3390/wevj16020095
Chicago/Turabian StyleLi, Sheng, Xiangyu Yan, and Guanhua Wang. 2025. "Multi Objective Optimization of Electric Vehicle Charging Strategy Considering User Selectivity" World Electric Vehicle Journal 16, no. 2: 95. https://doi.org/10.3390/wevj16020095
APA StyleLi, S., Yan, X., & Wang, G. (2025). Multi Objective Optimization of Electric Vehicle Charging Strategy Considering User Selectivity. World Electric Vehicle Journal, 16(2), 95. https://doi.org/10.3390/wevj16020095