1. Introduction
The rapid growth in vehicular traffic is placing unprecedented strain on global transportation networks, leading to escalating concerns over road safety, traffic congestion, and environmental impact [
1,
2]. In response to these pressing issues, Intelligent Transportation Systems (ITS) have emerged as a transformative paradigm, promising to revolutionize road service and operational efficiency [
3]. By integrating cutting-edge technologies such as the Internet of Things (IoT), big data, and Artificial Intelligence (AI), ITS aims to create a new generation of smart, resilient, and sustainable civil infrastructure. A primary objective of this vision is to proactively enhance road safety, moving from reactive incident response to predictive risk mitigation.
However, the realization of a fully functional ITS is fraught with challenges, particularly in managing the high complexity of real-world traffic environments. Highway–rail Grade Crossings (HRGCs) represent a quintessential example of such a complex transportation scenario. Such crossings are those locations where a roadway intersects one or more railroad tracks, primarily involving conventional trains rather than high-speed rail systems. According to data from the Federal Railroad Administration (FRA, 2025) [
4], over 2000 collisions occur annually at highway–rail grade crossings in the United States, resulting in more than 200 fatalities and 700 injuries each year. Thus, the HRGCs are always considered as high-risk zones, making them a significant global safety concern affecting regions such as the United States and the European Union. As critical junctures where road and rail traffic intersect, HRGCs are characterized by a unique confluence of high-speed trains, variable road user behaviors, and dynamic environmental conditions, making them persistent hotspots for severe accidents. Effectively modeling and mitigating risks at HRGCs is therefore not just a niche safety problem but a litmus test for the analytical power and practical applicability of advanced ITS methodologies. Understanding the intricate, often nonlinear, factors that contribute to crash severity in these environments is fundamental to developing effective smart management and control strategies.
Previous research has significantly contributed to understanding crash severity at HRGCs, employing various statistical and machine learning models [
5,
6,
7,
8,
9,
10,
11,
12,
13]. Traditional statistical methods, such as multinomial logit models, have been instrumental in identifying key risk factors but often struggle to capture the complex, nonlinear relationships and interaction effects inherent in crash data [
5,
6,
7,
8,
9]. While more advanced machine learning models, like neural networks, offer superior predictive accuracy, their “black-box” nature often hinders practical application. The lack of transparency makes it difficult for traffic engineers and policymakers to understand why a certain risk level is predicted, thereby limiting the ability to formulate precise, evidence-based safety interventions [
10,
11,
12,
13]. This gap highlights a critical need within ITS for analytical tools that are not only powerful but also inherently interpretable.
To bridge the identified research gaps, this paper proposes and validates a novel explainable AI (XAI) framework for advanced safety analysis in complex transportation systems, using highway–rail grade crossings (HRGCs) as a case study. Traditional statistical and machine learning models have achieved high predictive performance but often lack interpretability, making it difficult to uncover the mechanisms underlying crash severity. In contrast, explainable methods can disentangle these complex, nonlinear relationships by quantifying and visualizing how each variable—and their interactions—affect model outcomes.
Our proposed framework integrates the predictive capability of the Extreme Gradient Boosting (XGBoost) algorithm with the interpretive strength of Shapley Additive Explanations (SHAP). This synergy not only enables accurate prediction of injury severity but also opens the “black box,” revealing how environmental, operational, and human factors jointly contribute to crash outcomes.
Unlike previous studies that applied XGBoost–SHAP primarily for feature ranking or general crash prediction, this research advances their use to quantitatively interpret interaction effects in the safety-critical context of HRGCs—a domain that has received limited attention in explainable AI research. The XAI framework provides a systematic means to uncover how combinations of conditions amplify or mitigate crash severity, thus extending the analytical capability beyond single-variable interpretation. In doing so, this study contributes a new, transparent approach for transforming predictive modeling into interpretable, actionable insights that can inform the design and management of safer intelligent transportation systems (ITS).
The remainder of this paper is organized as follows.
Section 2 gives the literature review.
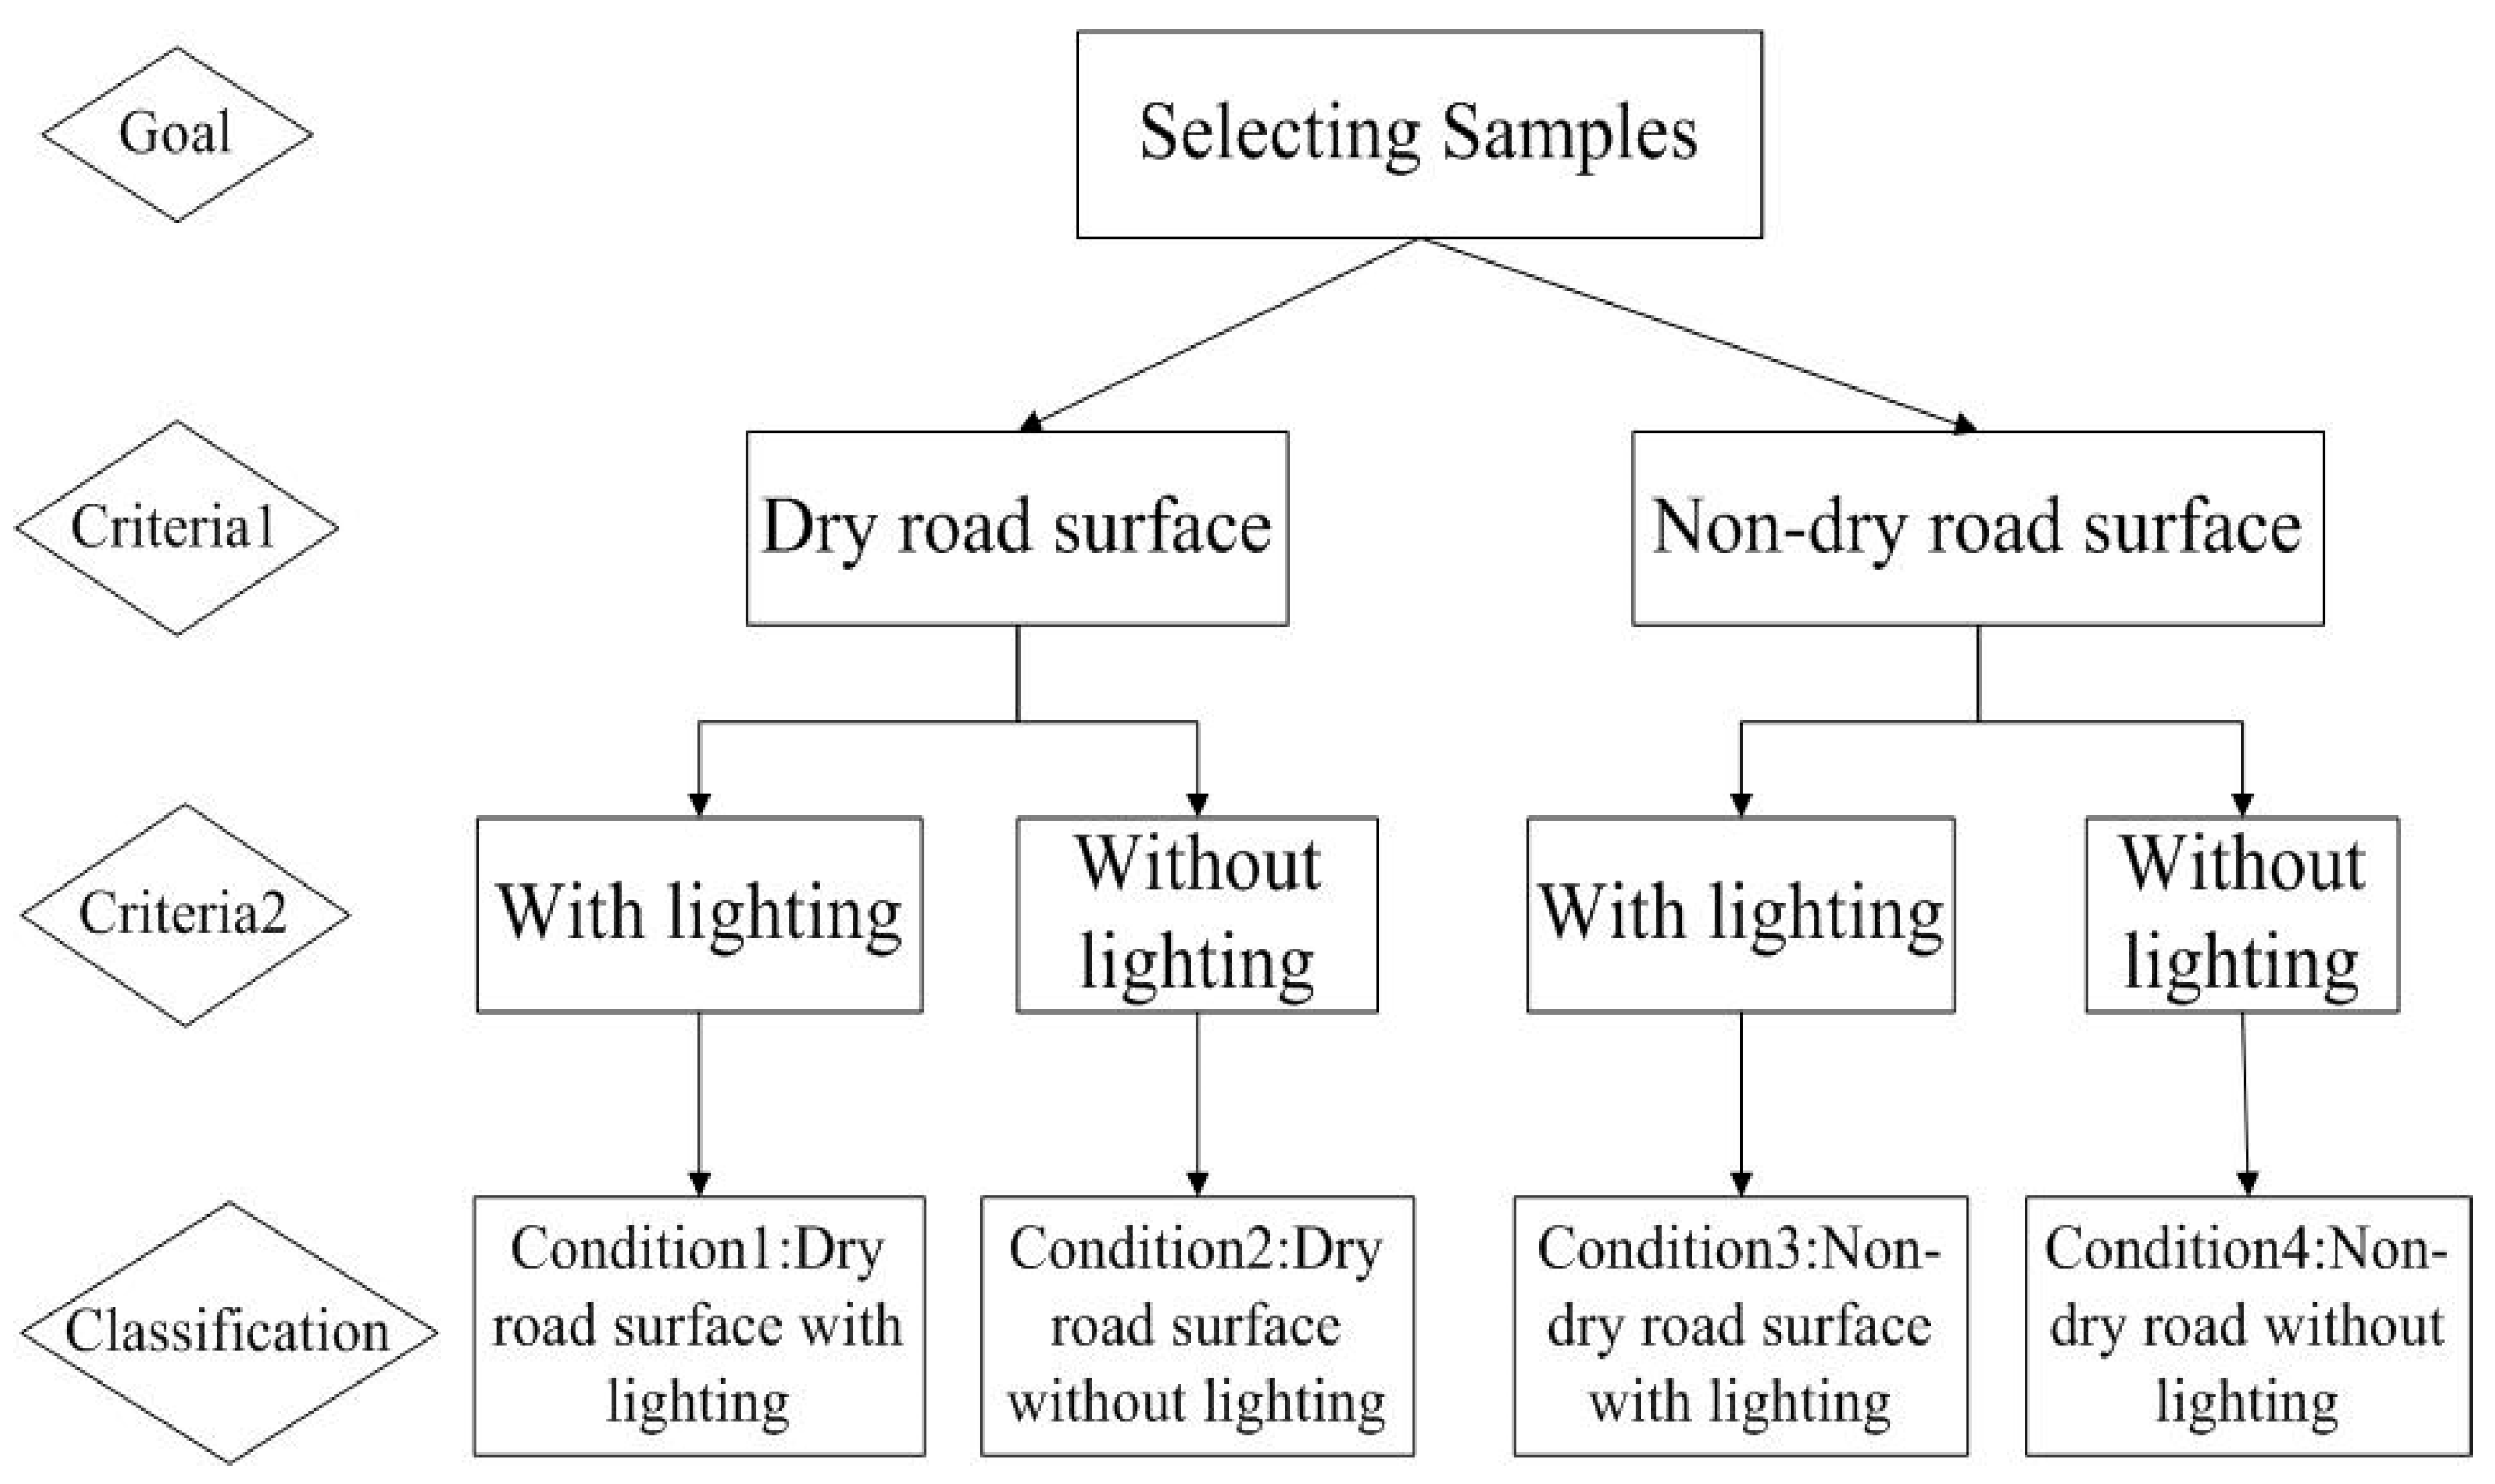
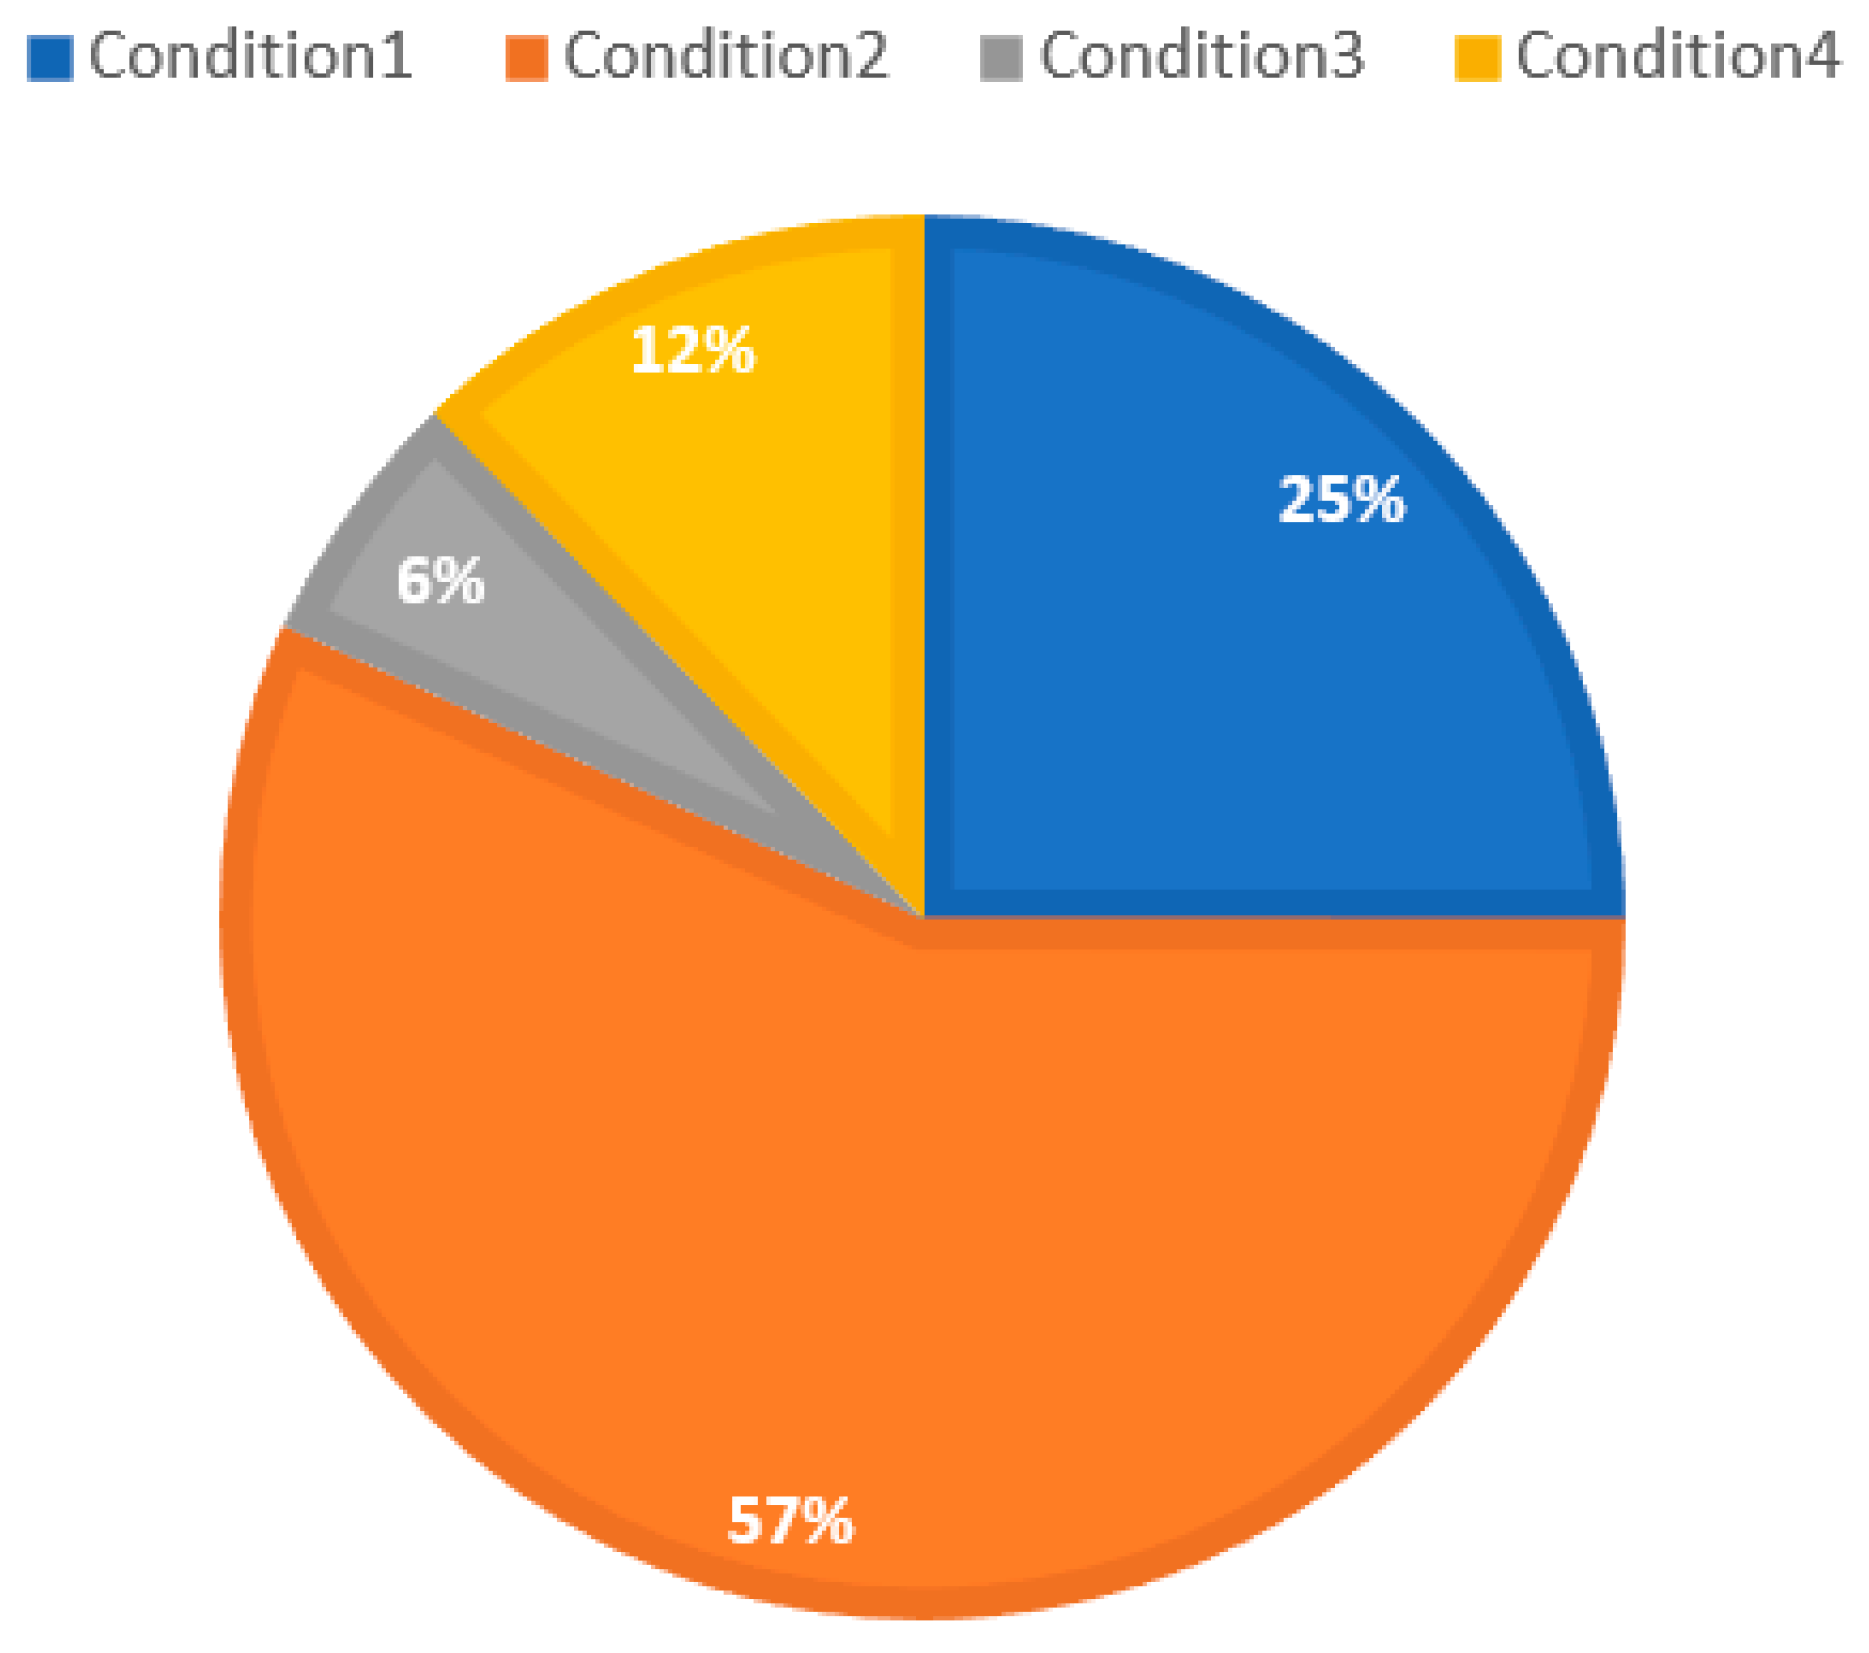
Section 3 introduces the data sources, variable reclassification methods, and the categorization of road surface and lighting conditions.
Section 4 presents the XGBoost-SHAP analytical framework, detailing model construction and evaluation metrics.
Section 5 reports the model results, analyzing feature importance and comparing key influencing factors under different conditions.
Section 6 discusses the mechanisms of accident severity based on model findings and proposes targeted policy implications such as speed management and lighting improvements. Finally,
Section 7 summarizes the research outcomes, highlights the limitations in data and methodology, and outlines directions for future work.
2. Literature Review
Due to the severity of accidents at highway–rail grade crossings, an increasing number of studies in recent years have focused on identifying and extracting the key factors associated with such accidents. Previous studies based on accident data analysis have identified key influencing factors such as vehicle type, train/vehicle speed, roadway conditions and geometric features, lighting conditions, weather conditions, as well as driver age and gender [
5,
6]. Wei Hao et al. [
7] applied an ordered probit model using FRA crash data (2002–2011) to investigate the influence of time of day on driver injury severity at HRGCs. They found that crashes occurring during early morning, a.m. peak, and p.m. peak periods were associated with significantly higher injury severity compared to other times. Vehicle speeds and train speeds exceeding 50 mph significantly increased the probability of severe injuries. Wei Hao and Camille Kamga [
8] examined the effects of lighting on driver injury severity at highway–rail grade crossings (HRGCs) in the United States using a mixed logit model. The study found that the fatality rate at unlit crossings was significantly higher than at lit crossings. Factors such as high-speed driving (vehicle or train speeds exceeding 50 mph), adverse weather conditions (such as rain, snow and fog), open space areas, and unpaved road surfaces were shown to significantly increase injury severity, with these effects being more pronounced under unlit conditions.
Yang et al. [
9] employed a LightGBM–SHAP framework using FRA crash data (2012–2021) to identify the importance of road surface conditions in accident severity at HRGCs. They found that wet, icy, and gravel surfaces significantly exacerbated injury severity compared with dry conditions. Wei Hao and Camille Kamga [
10] used an ordered probit model to analyze driver injury severity at highway–rail grade crossings, focusing on rural and urban differences. They found that vehicle speed, train speed, lighting conditions, and road surface significantly affect injury severity, with rural areas showing higher severity levels. Their study highlights the need to consider environmental factors and area type in accident severity analysis. Hao and Daniel [
11] investigated driver injury severity at highway–rail grade crossings under different weather conditions using mixed logit models. The results revealed that inclement weather (rain, snow, fog) significantly exacerbates crash severity, particularly when combined with factors like high train/vehicle speeds (increasing fatality risk by 65–132%), unpaved roads, and poor lighting. Older drivers (65+) were found to be 16–51% more likely to suffer fatal injuries compared to younger drivers. The study also identified open areas and low-traffic crossings as high-risk environments.
Zhao and Khattak [
12] applied a random parameters binary logit model using Nebraska crash data (2002–2013) to examine the role of driver inattention in injury severity at HRGCs. They identified inattentive driving as a critical factor, finding it significantly increased the probability of severe driver injuries, comparable to DUI and aggressive driving. Gabree et al. [
13] based on field video observations identified the importance of dynamic envelope pavement markings and signage. They found that these countermeasures significantly reduced the proportion of vehicles stopping on tracks and increased safe stopping behind stop lines, indicating improved driver safety behavior. Wei Hao et al. [
14] utilized an ordered probit model to explore how driver age and gender influence injury severity at highway–rail grade crossings (HRGCs) in the United States. Based on 25,945 accident records from 2002 to 2011, they found significant variations across different age and gender groups. Older drivers were more prone to severe or fatal injuries due to slower reaction times and physical limitations, while younger male drivers were more likely to sustain serious injuries during rush hours when driving at high speeds.
The above description addresses the influence of single factors on crashes; however, in many cases, crashes may result from the combined effects of multiple factors [
15]. Given the complexity of traffic accidents, potential interactions among different influencing factors should be considered [
16]. Morgan and Mannering [
17] employed a mixed logit model using Indiana single-vehicle crash data (2007–2008) to examine the interactive effects of road-surface conditions, driver age, and gender. They found that wet and snow/ice surfaces significantly increased severe injury risks for females and older males, whereas younger males showed reduced severity under the same conditions. Khales et al. [
18] employed mixed logit models to analyze the joint effects of visibility and warning devices on driver injury severity at HRGCs. They found that poor visibility combined with passive warnings substantially increased fatality risk, underscoring the compounded hazards of adverse conditions and inadequate control measures. Hu and Lin [
19] analyzed the interaction effects of three advanced devices—obstacle detector, LED train approaching indicator, and law enforcement camera—on HRGC safety. They found that combined deployment significantly enhanced crash and gate-breaking reduction, with the indicator–camera pairing and all three devices together producing the strongest synergistic safety benefits. Zhao and Khattak [
20] employed factor analysis and structural equation modeling to investigate inattentive driving at HRGCs. They identified gender, age, income, driving frequency, residence years, and safety information exposure as significant determinants, and revealed interactions between these factors and drivers’ patience and safety attitudes, showing that females, younger, and high-income drivers with lower patience and weaker safety attitudes were more prone to inattentive driving. The above several studies indicate that significant interactions exist among different influencing factors; however, current research remains insufficient. In particular, the interaction between road surface conditions and lighting has not been examined. Previous studies have shown that both factors exert significant effects individually, yet under interaction their mechanisms may change substantially, which could affect policy implementation.
Common methods used in the study of investigating the influencing factors and severity of highway–rail grade crossing accidents can be broadly divided into two categories: parametric models and machine learning methods [
21,
22]. Previous HRGC safety studies have primarily focused on analyzing crash severity, typically employing parametric models. Fan et al. [
23] applied a multinomial logit model to examine the injury severity of 7414 vehicle–rail crashes at U.S. highway–rail grade crossings. Their results indicated that higher train and vehicle speeds, pickup trucks, and older or male drivers increased crash severity, while higher traffic volumes and developed-area crossings were associated with reduced severity. Kang and Khattak [
24] employed a variational Bayesian latent class clustering approach combined with ordered logit models to analyze HRGC crash injury severity, and found that the cluster-based method better captured unobserved heterogeneity and identified severity factors specific to certain crash subgroups. Kutela et al. [
25] applied a mixed multinomial logit model with a Bayesian approach to 20 years of FRA crash data to investigate pre-crash driver behaviors at highway–rail grade crossings. Their results indicated that demographic, vehicle, environmental, and crossing factors significantly influenced risky behaviors, with strong regional heterogeneity requiring random effects. Ren and Xu [
26] employed a random parameters logit model with heterogeneity in means to investigate factors influencing injury severity in HRGC crashes under non-divided two-way traffic conditions. Their analysis revealed that risky driving behaviors, higher vehicle and train speeds, and vulnerable road users such as older, female, and motorcyclist drivers significantly increased the likelihood of severe outcomes. Wu et al. [
15] adopted a random parameters logit model with heterogeneity in means and variances to identify the significant factors contributing to the crash injury severity involving truck and automobile drivers, finding that this model better captured unobserved heterogeneity and revealed significant differences in the factors influencing injury severity between automobile and truck crashes. Parametric models have the advantages of simple formulations and clear interpretability; however, they are limited in identifying variable interactions, requiring extensive trial and error, and the interactions ultimately discovered may be highly constrained by the data.
Recent years, machine learning methods have increasingly attracted the attention of researchers. Keramati et al. [
27] used data from North Dakota (1990–2018) to analyze HRGC crash severity with a Random Survival Forest (RSF) model. The study identified train speed, traffic volume, control type, and roadway classification as key factors. Compared with traditional statistical models, RSF captured nonlinear relationships and interactions more effectively, offering higher predictive accuracy. Rana et al. [
28] employed ensemble machine learning models, including Random Forest (RF), AdaBoost, and XGBoost, to analyze Canadian highway–rail grade crossing (HRGC) crashes. Using the ExtraTrees classifier for feature selection, they identified key predictors and applied SMOTE to balance imbalanced datasets. The models were evaluated through cross-validation with metrics such as precision, recall, and F1-score, showing that XGBoost achieved the highest accuracy. Additionally, ArcGIS hotspot analysis was used to detect spatial clusters of HRGC crashes.
Lu et al. [
29] employed a Gradient Boosting (GB) model with a functional gradient descent algorithm to predict crashes at highway–rail grade crossings. They conducted a comprehensive evaluation using six prediction metrics, compared the GB model with a decision tree benchmark, and demonstrated its superior accuracy. In addition to generating variable importance rankings, they applied partial dependence plots to interpret nonlinear interactions, offering clearer insights into how key factors influence crash likelihood. Zheng et al. [
21] applied a neural network (NN) model to predict crash risk at highway–rail grade crossings using 19 years of historical data. They developed variable importance rankings based on connection weights and mean-square error, and conducted marginal effect analysis to interpret nonlinear relationships between contributory factors and crash likelihood. Compared with decision tree models, the NN approach achieved higher predictive accuracy and provided deeper insights into the dynamic, nonlinear interactions among explanatory variables. Keramati et al. [
27] developed a hybrid Analytic Hierarchy Process–Hazard Index (AHP-HI) model to evaluate crash severity at highway–rail grade crossings. The method integrates a Competing Risk Model (CRM) to estimate cumulative probabilities of fatal, injury, and property-damage-only crashes, which are then synthesized using AHP to generate a comprehensive hazard index. This approach enables a more refined ranking of crossings based on severity likelihood, offering decision-makers a data-driven tool for prioritizing high-risk locations. Machine learning methods possesses strong feature extraction capabilities, demonstrates robust generalization, and is well-suited for handling high-dimensional data. However, it remains relatively opaque as a “black box” [
30], and especially the interactions between variables are not easy to express.
In summary, despite these advances, the interaction between road surface and lighting conditions at HRGCs remains unexplored and warrants further investigation. Moreover, there is a lack of research leveraging interpretable models to differentiate risk factors under varying environmental scenarios. This gap is particularly relevant given that adverse surface conditions and poor illumination often coincide, creating compounded safety risks that require tailored countermeasures. Therefore, this study proposes the use of the XGBoost-SHAP framework to analyze the severity of collision injuries at HRGCs, with a particular focus on four combined scenarios and on examining the interaction between road surface and lighting conditions.
4. Methodology
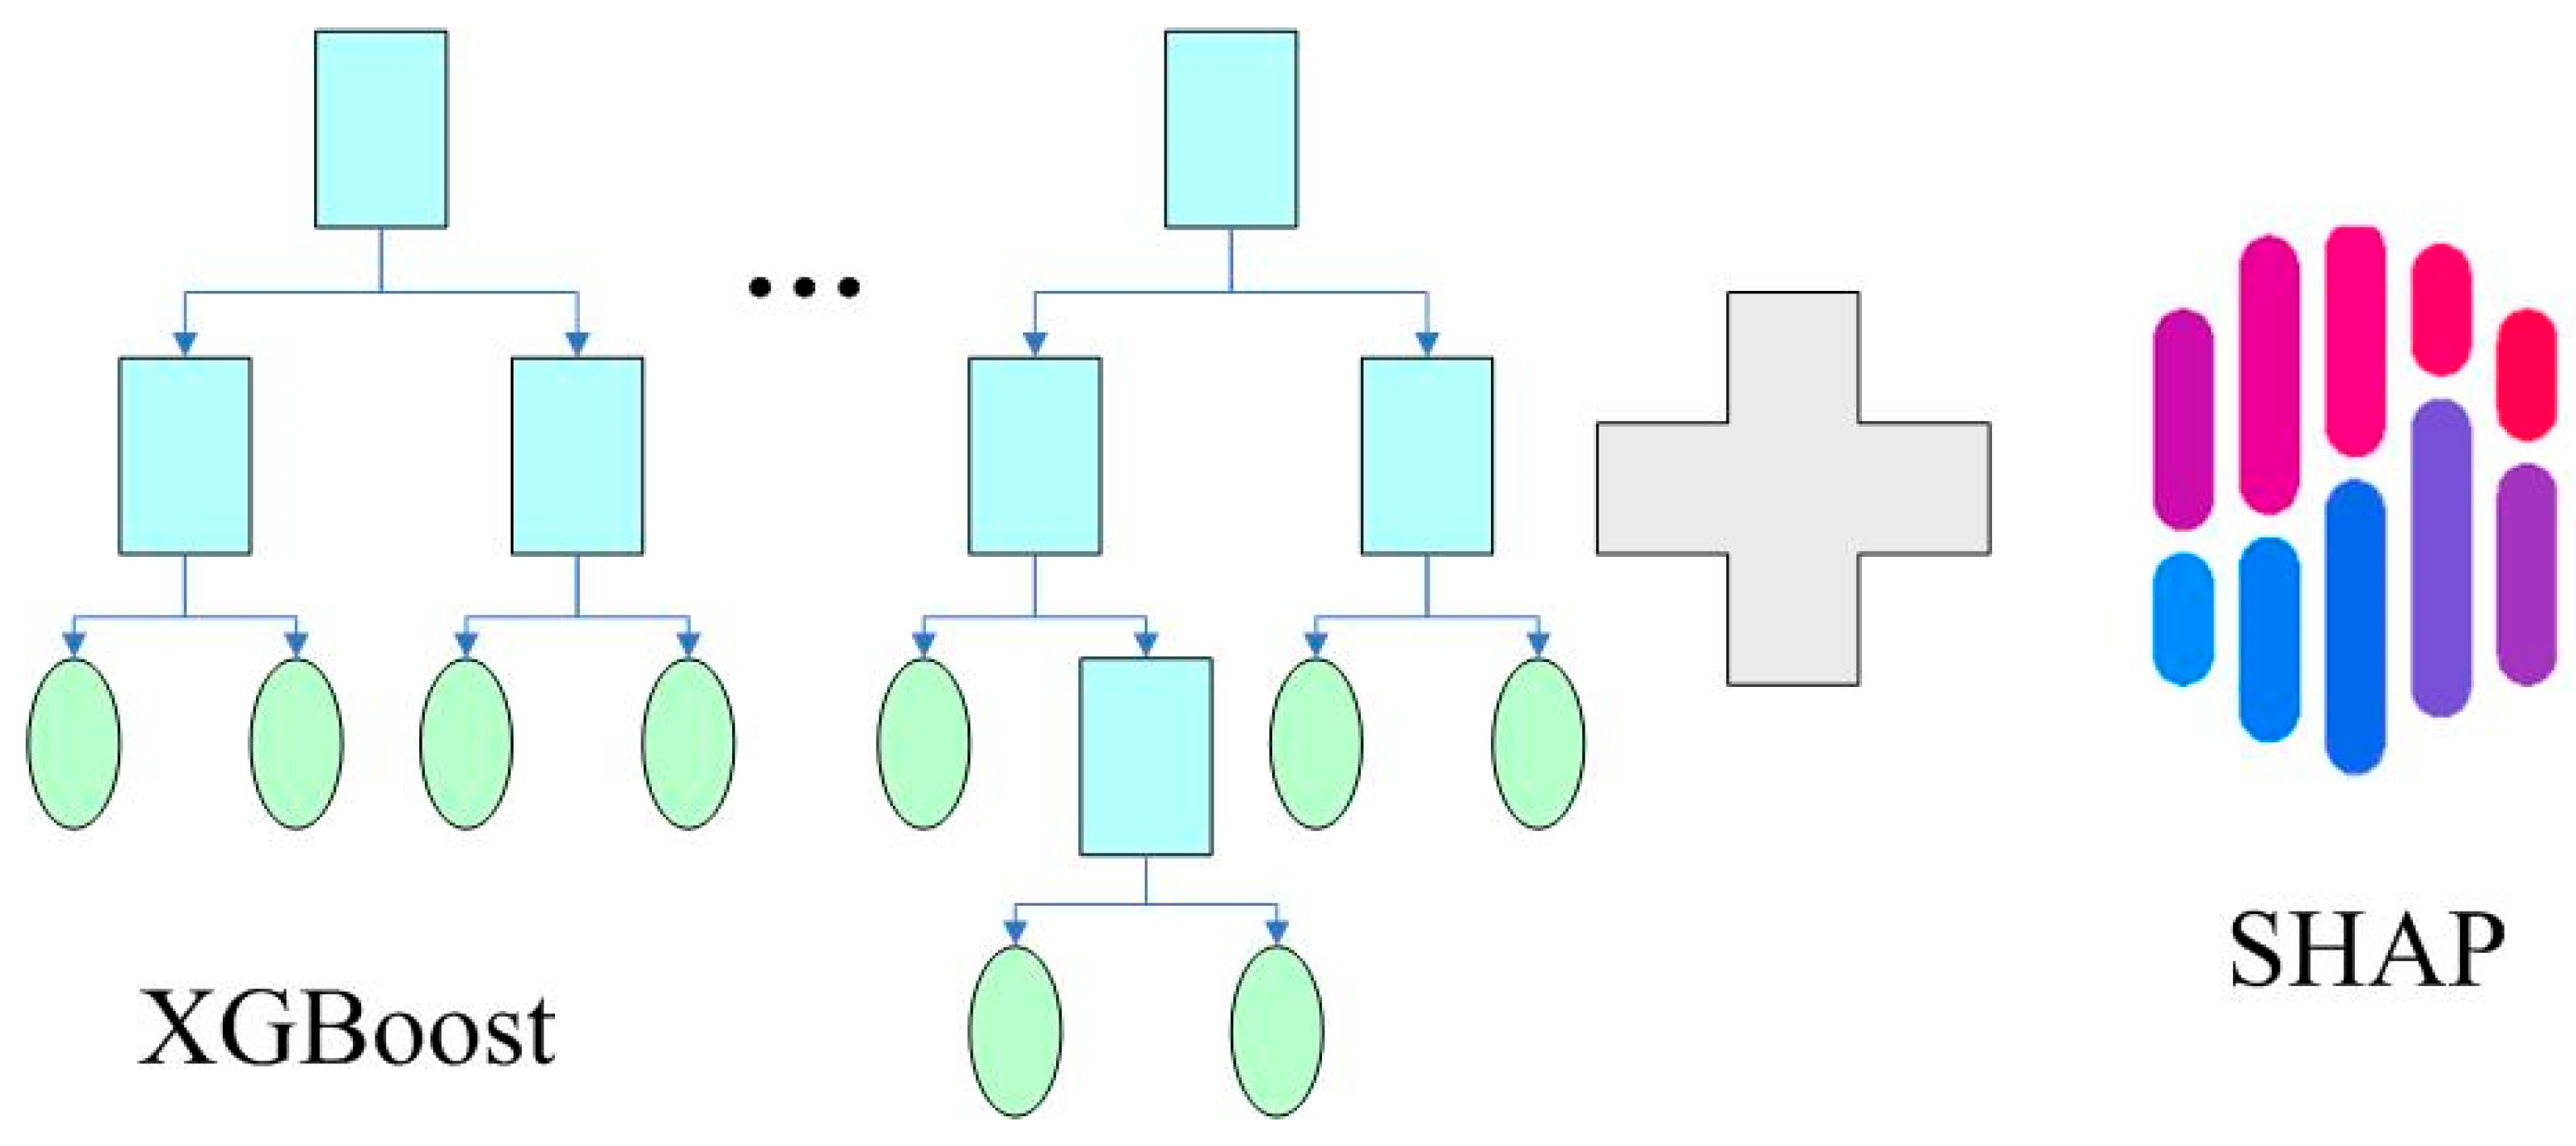
To improve the accuracy of interpreting and analyzing the interactions among influencing factors, this study selected four machine learning models for analysis: Random Forest (RF), Gradient Boosting Decision Tree (GBDT), XGBoost, and LightGBM. All four models share comparable ensemble-learning architectures: XGBoost, LightGBM, and GBDT are based on gradient boosting mechanisms, whereas Random Forest represents a bagging-based approach. This structural alignment allows for a balanced comparison across different ensemble paradigms. Furthermore, these ensemble learning models are highly effective in handling high-dimensional data, capturing nonlinear relationships, and modeling complex interactions among variables. The study integrates the XGBoost algorithm with SHAP (Shapley Additive Explanations) principles to interpret and analyze influential factors in the model, and the framework diagram is shown in
Figure 4.
Although the combination of XGBoost and SHAP has been widely applied in safety analysis, most existing studies have focused primarily on global feature ranking or marginal effect visualization. In contrast, this study does not rely on a single global model but instead partitions the dataset into four combined road-surface–lighting scenarios, allowing for context-specific mechanism analysis. This approach enables the model to capture environmental heterogeneity that conventional global frameworks tend to overlook.
Moreover, rather than limiting the analysis to global feature importance, this study employs SHAP interaction values to quantitatively reveal how pairs of variables jointly influence crash severity. This approach uncovers synergistic and interaction effects that have not been identified in previous XGBoost–SHAP studies.
Overall, the proposed framework is specifically tailored to the safety-critical context of highway–rail grade crossings (HRGCs), where environmental, operational, and human factors interact in complex nonlinear ways. By integrating SHAP-based interpretations with established transportation safety principles, the study extends prior XGBoost–SHAP applications and develops a context-sensitive, interaction-aware interpretability framework for complex transportation systems.
4.1. XGBoost
The XGBoost algorithm incorporates regularization terms into its objective function to smooth the learned weights and prevent overfitting, while employing second-order Taylor expansion of the loss function to enhance predictive accuracy. The formula of predicted value is as follows [
31]:
where
is the predicted value for sample
i after the
t-th iteration in the XGBoost algorithm,
is the predicted output from the (
t − 1)-th tree,
is the model prediction from the
t-th tree.
The model’s objective function consists of a loss function and a regularization term.
where
denotes the model’s objective function;
represents a loss function that measures the discrepancy between predicted values
and target values
;
is the regularization term, also known as the penalty function.
The dataset was randomly divided into a training set (80%) and a testing set (20%), stratified by crash severity to maintain the original class proportions. To enhance the stability of the estimates, a parameter grid was established for hyperparameter tuning, and a five-fold cross-validation scheme was employed to evaluate model performance and select the optimal parameter combination.
This study optimized several key hyperparameters of the XGBoost model to maximize its performance. The resulting hyperparameters are summarized in
Table 1. Each tree was trained using 70% of the samples and 70% of the features, effectively reducing overfitting while maintaining high predictive performance and improving generalization capability. The learning rate was set to 0.1, ensuring a stable and efficient convergence process. The maximum tree depth was set to 4, allowing the model to capture complex feature interactions without excessive complexity. A total of 100 trees were used, which, in combination with the relatively low learning rate, provided an accurate and stable fit to the data.
4.2. Shapley Additive exPlanations
SHAP (Shapley Additive exPlanations) is a game-theory-based approach for interpreting machine learning model predictions, proposed by Lundberg et al. [
32]. It quantifies feature contributions to model outputs by assigning each feature its marginal impact, thereby enhancing model interpretability. The SHAP value calculates the average marginal contribution of each feature
i to the model’s prediction, as expressed by [
32]:
where
denotes the SHAP value (contribution) of the
i-th feature;
N represents the complete feature set;
S indicates a feature subset (excluding feature
i);
is the model’s predicted output using feature subset
S;
quantifies the marginal contribution of feature
i.
The SHAP (SHapley Additive exPlanations) model reformulates the interpretability problem as an additive feature attribution task, establishing a linear combination-based explanatory framework. Its core principle decomposes complex predictions into the sum of individual feature contributions, enabling users to quantify each feature’s impact. The formulation is as follows:
where
is the model’s predicted value for input sample
x;
M is the number of features;
is the mean prediction across all samples;
is the SHAP value for feature
i, also known as the contribution value of feature
i to the model’s prediction.
4.3. Evaluation Indicators of the Model
In XGBoost, a confusion matrix is a tool used to evaluate the performance of a classification model. It is a two-dimensional matrix that compares the model’s predicted results with the actual class labels. The confusion matrix is particularly useful for understanding the model’s performance across different classes.
The confusion matrix consists of four primary components:
- (1)
True Positives (TP): The quantity of samples correctly predicted as positive by the model, where actually positive instances are accurately classified as positive.
- (2)
True Negatives (TN): The number of samples correctly predicted as negative by the model, where truly negative instances are accurately classified as negative.
- (3)
False Positives (FP): The number of samples incorrectly predicted as positive by the model, where truly negative instances are misclassified as positive.
- (4)
False Negatives (FN): The number of samples incorrectly predicted as negative by the model, where truly positive instances are misclassified as negative.
The confusion matrix enables the computation of various performance metrics (such as accuracy, precision, recall, and F1-score), thereby facilitating a comprehensive evaluation of XGBoost’s classification performance.
Accuracy measures the ratio of correct predictions (both true positives and true negatives) to the total number of samples evaluated, with higher values denoting superior classification performance. The formulation is as follows:
Recall: The proportion of actual positive samples that are correctly predicted as positive. Higher recall indicates better performance. The formulation is as follows:
Precision (also known as positive predictive value) measures the model’s ability to avoid false positives, calculated as the ratio of true positives to the sum of true positives and false positives. Maximizing precision is essential when the cost of misclassifying negative instances is high. The formulation is as follows:
The F1-score, as the harmonic mean of precision and recall, provides a single metric to evaluate classifier performance when class distribution is imbalanced. Unlike the arithmetic mean, it penalizes extreme disparities between precision and recall, making it particularly valuable in scenarios where both false positives and false negatives carry significant costs. The formulation is as follows:
5. Results
5.1. Model Comparison
The study evaluates the fitting performance of the constructed XGBoost model by introducing LightGBM, Random Forest, and GBDT as comparative models. The performance of different machine learning models is comprehensively compared using metrics such as Accuracy, Precision, Recall, and F1-Score, with the results presented in
Table 2.
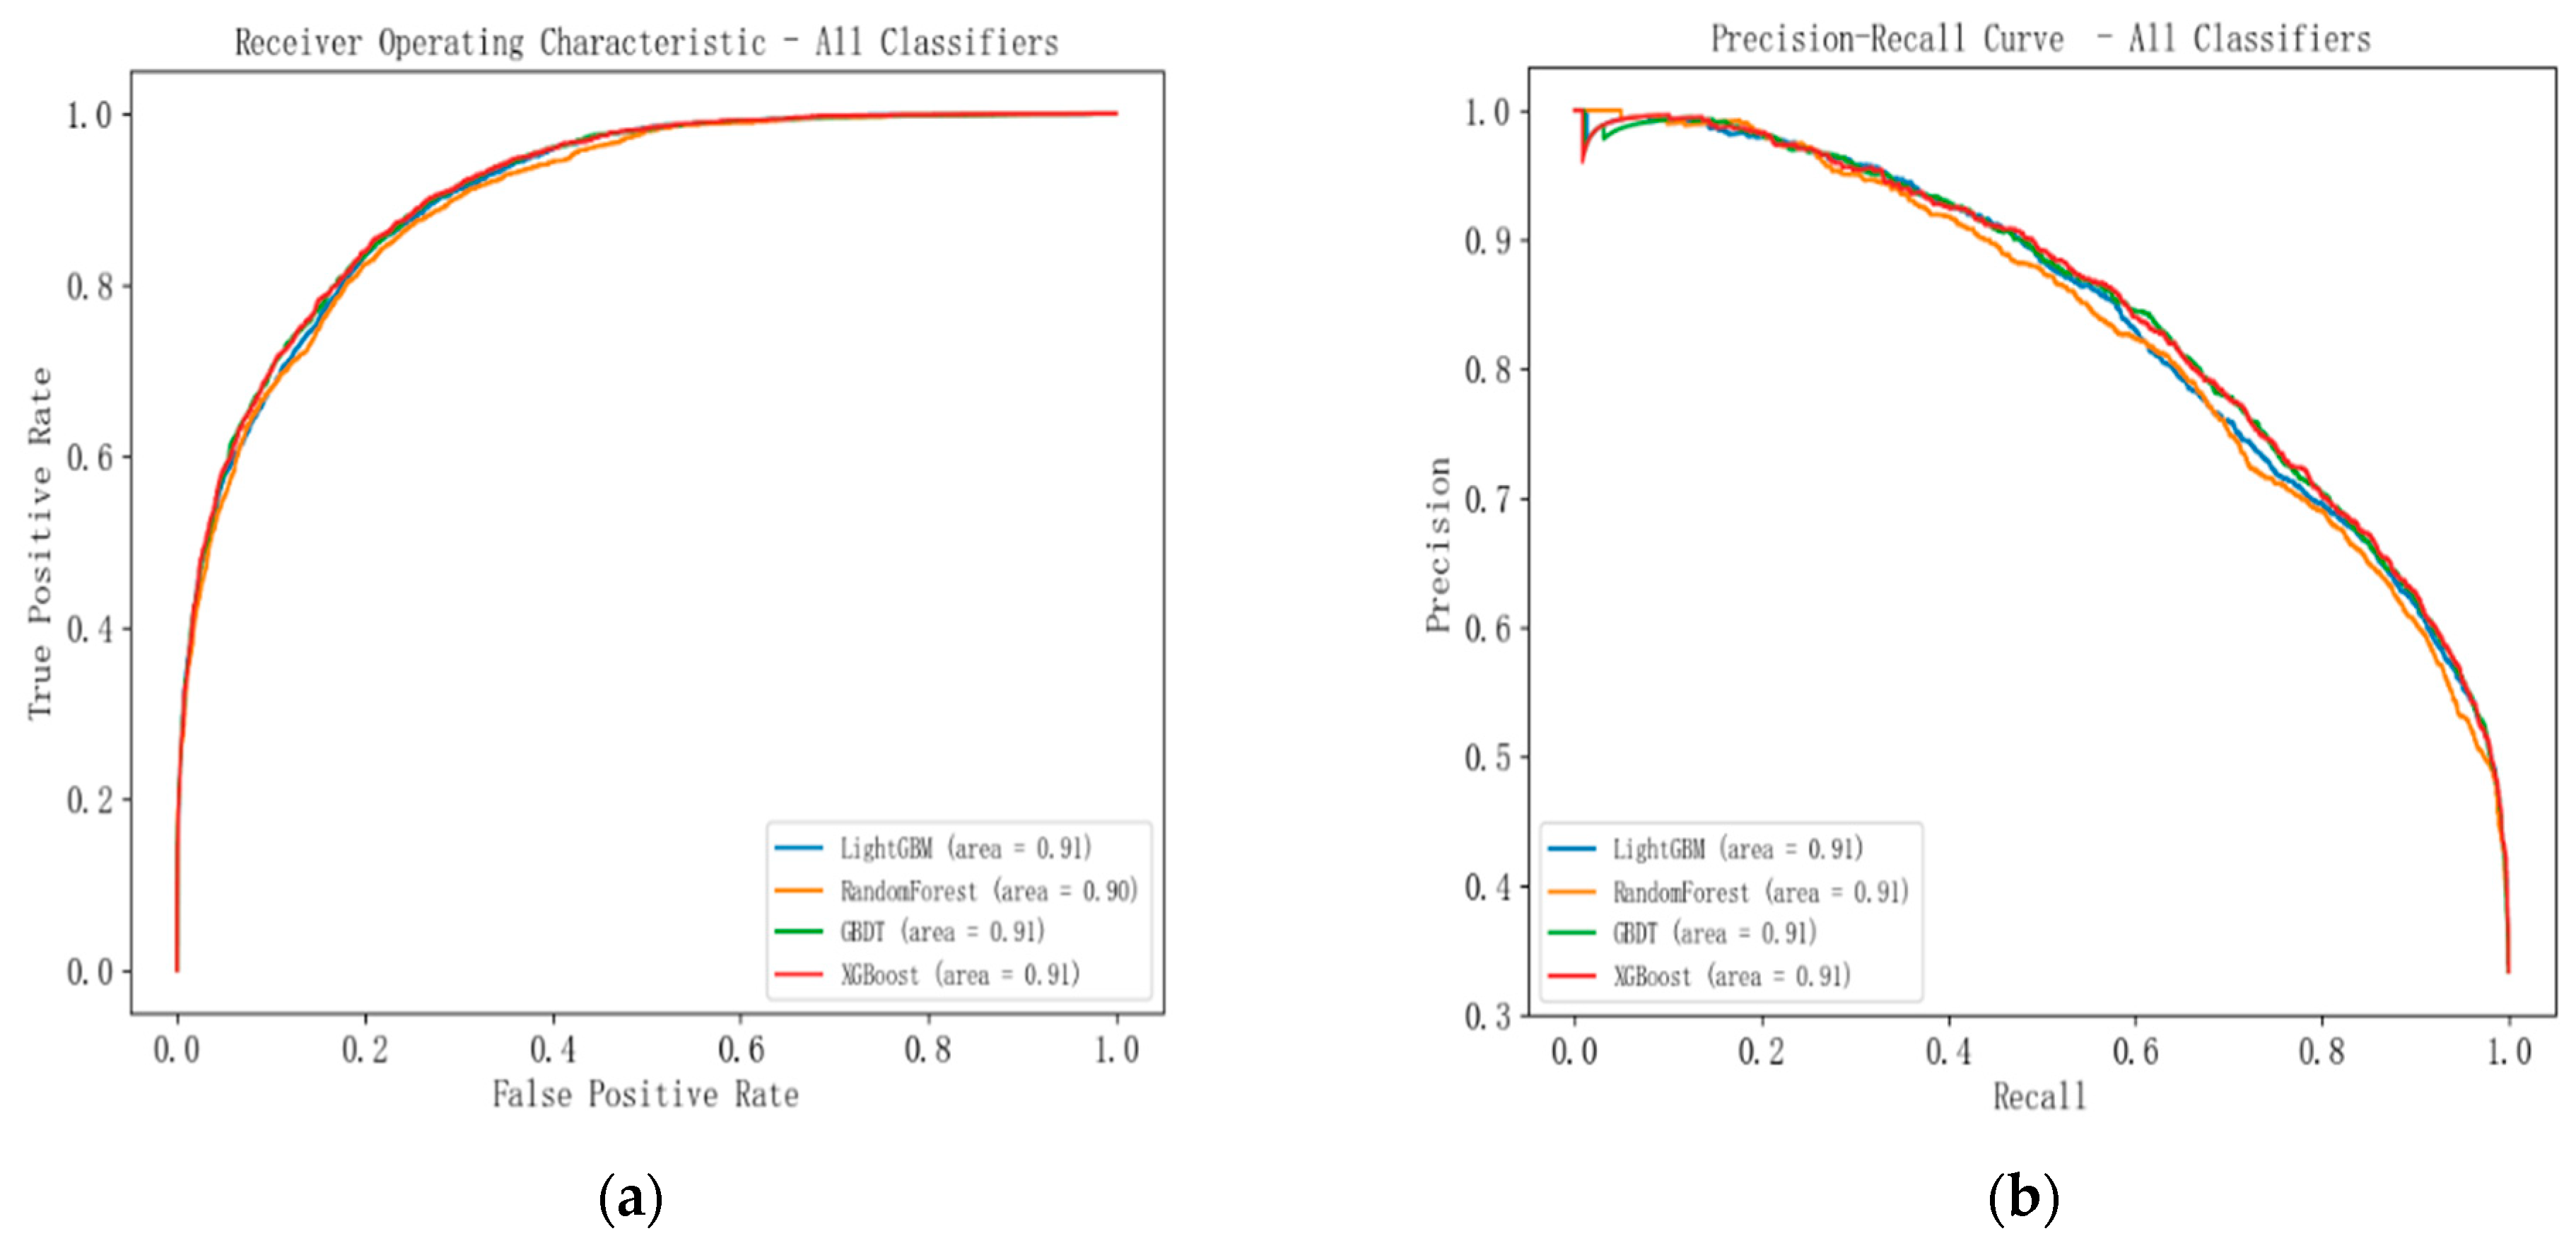
In the complete dataset, the XGBoost model achieved an accuracy (training) of 76.9%, accuracy (test) of 74.1%, recall of 74.1%, precision of 69.9%, F1-score of 70.5%, and AUC of 0.812. XGBoost exhibits exceptional generalization capability, as manifested by consistent performance across both training and testing datasets (Δaccuracy = 2.8%) without evidence of overfitting. The model achieves the highest ROC AUC score (0.91) among comparative methods, demonstrating superior class separability. With an F1-score of 0.705, marginally exceeding GBDT (0.704), XGBoost maintains the most favorable precision-recall balance, indicative of optimal model stability for real-world deployment.
Figure 5 presents the ROC (a) and PR (b) curves of all classifiers. All four models exhibited high and comparable predictive performance, with AUC and PR-AUC values around 0.90–0.91. Among them, XGBoost and LightGBM slightly outperformed the others, showing smoother and more stable curves across different thresholds, while Random Forest achieved marginally lower scores (AUC = 0.90). These results demonstrate that XGBoost provides superior stability and generalization compared with traditional ensemble methods.
Among the evaluated machine learning models, XGBoost demonstrated superior overall performance. Therefore, the study selects the XGBoost algorithm for analyzing determinant factors influencing accident severity at highway–rail grade crossings.
5.2. Importance of Risk Factors
This study employs the SHAP method to conduct global and local interpretability analysis of the XGBoost model, investigating the influence of different feature inputs on the model’s prediction outcomes.
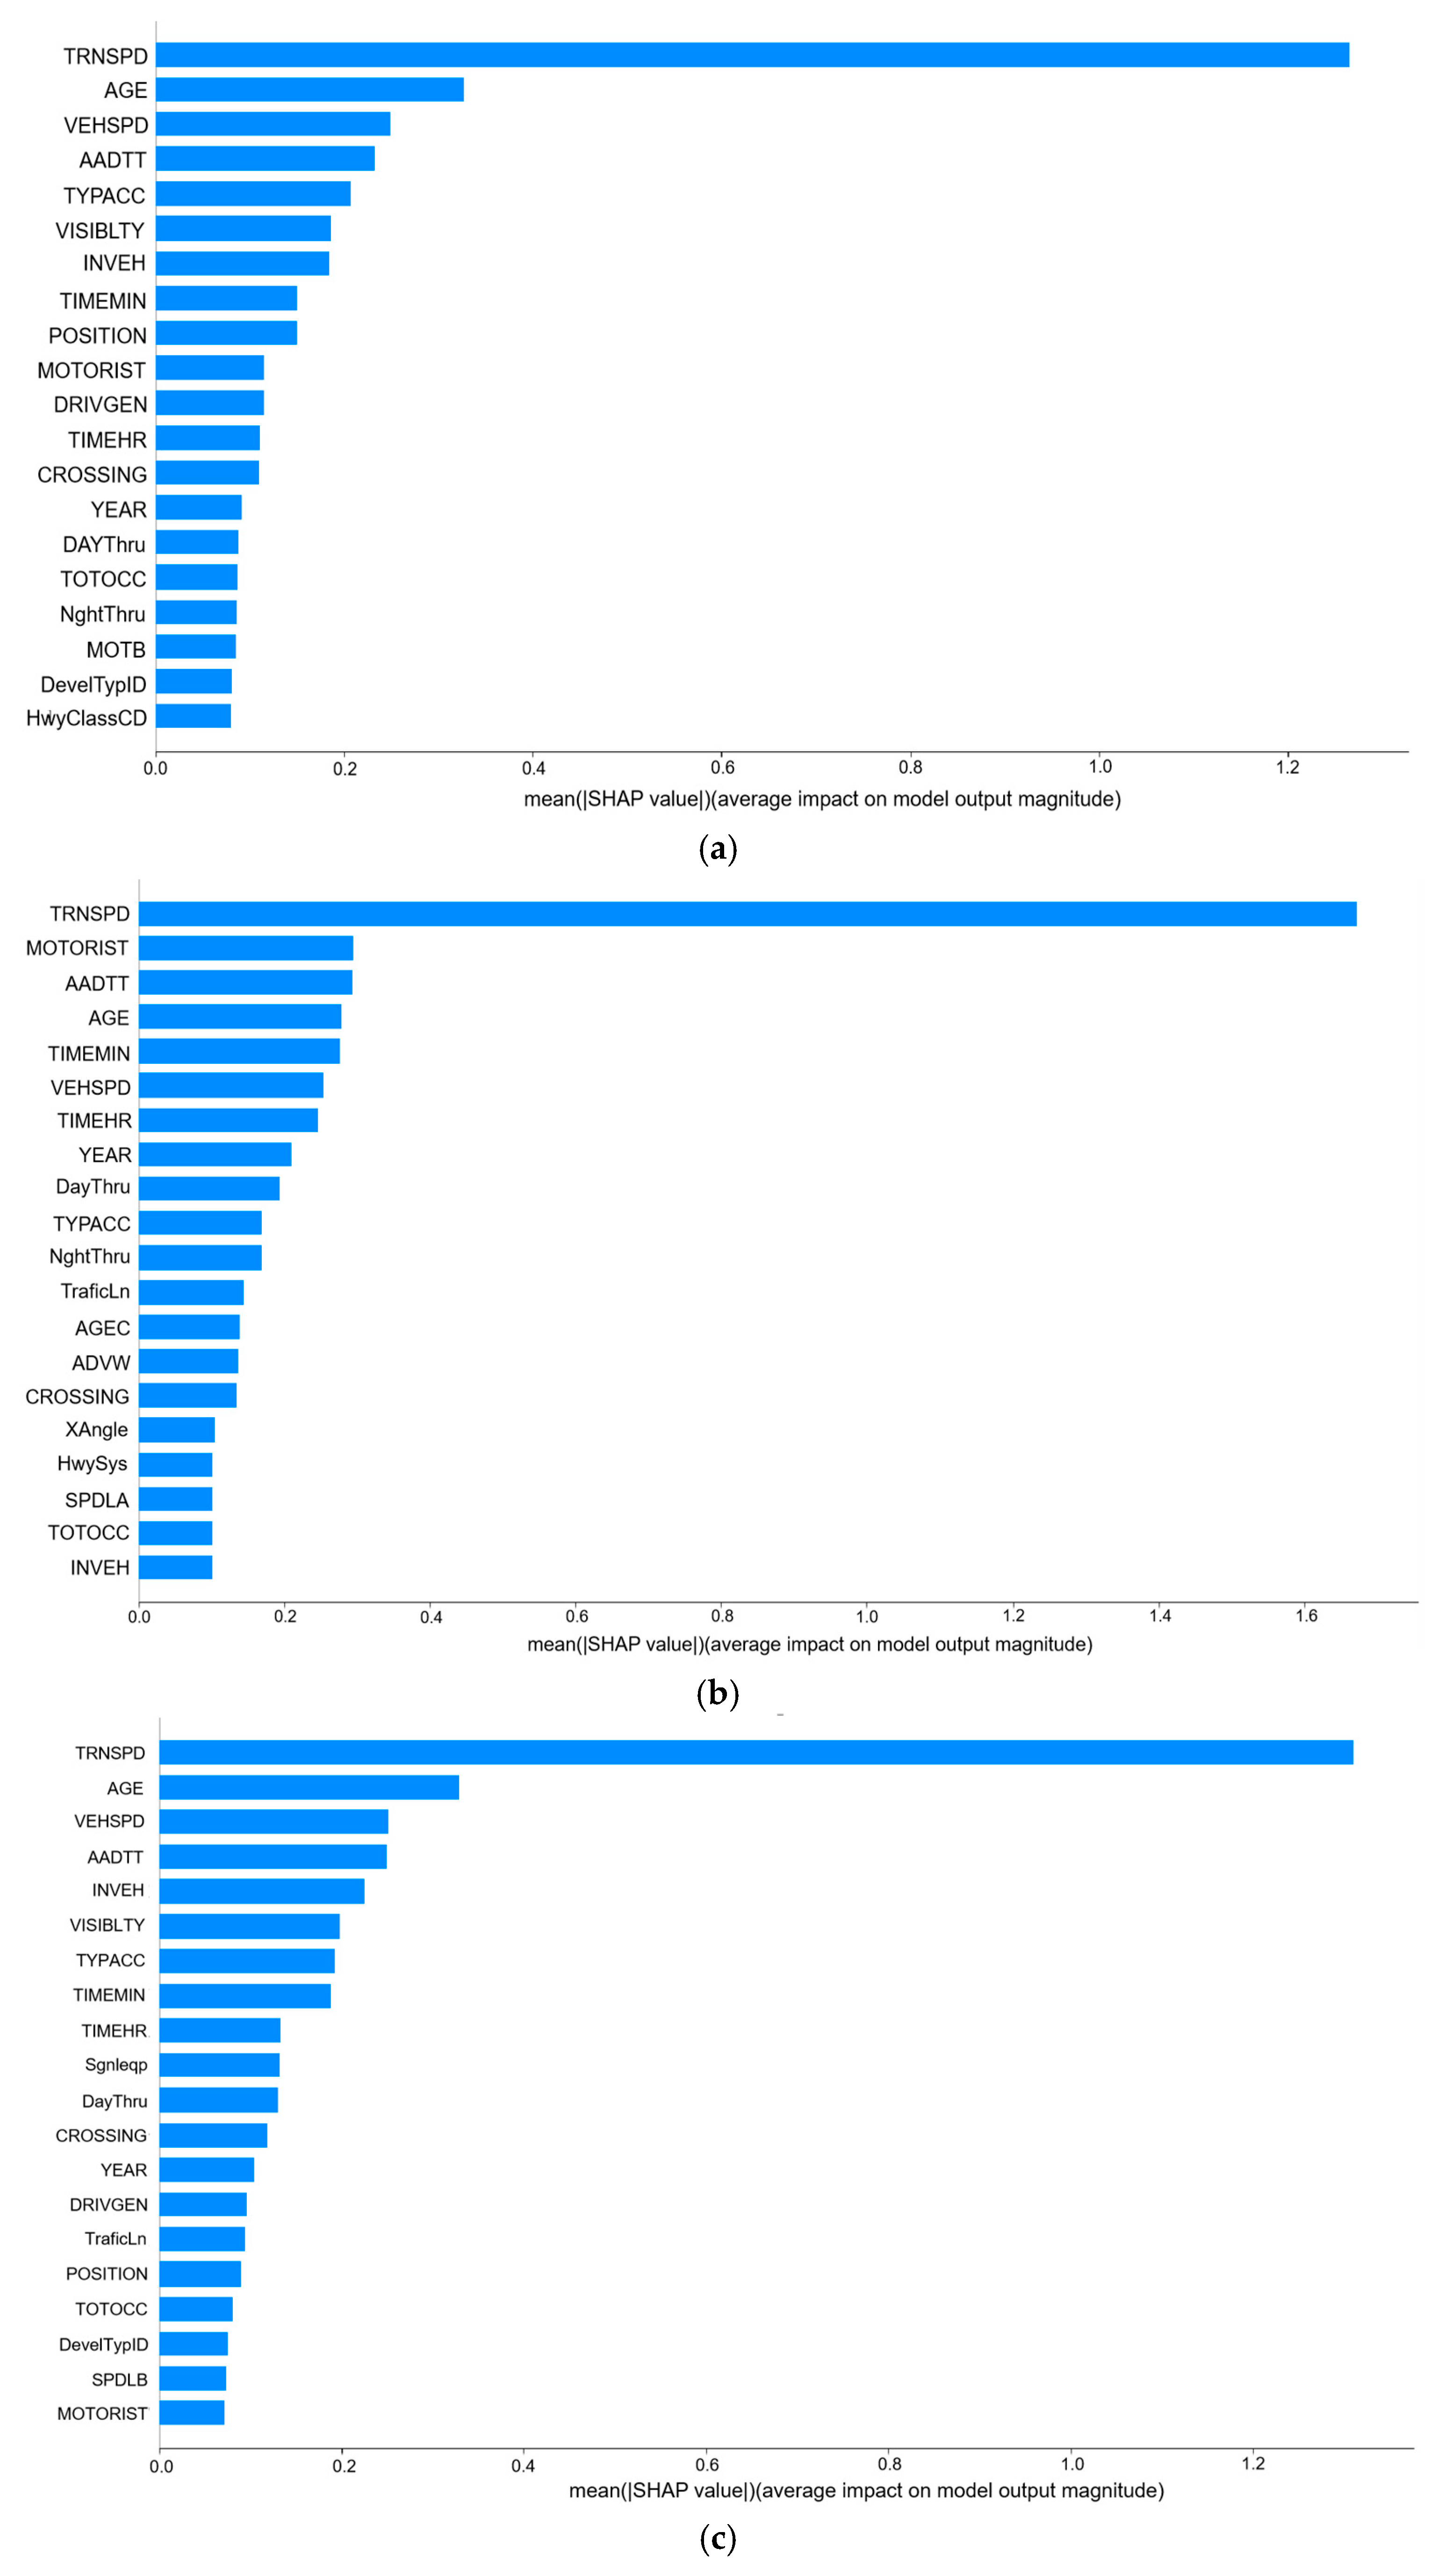
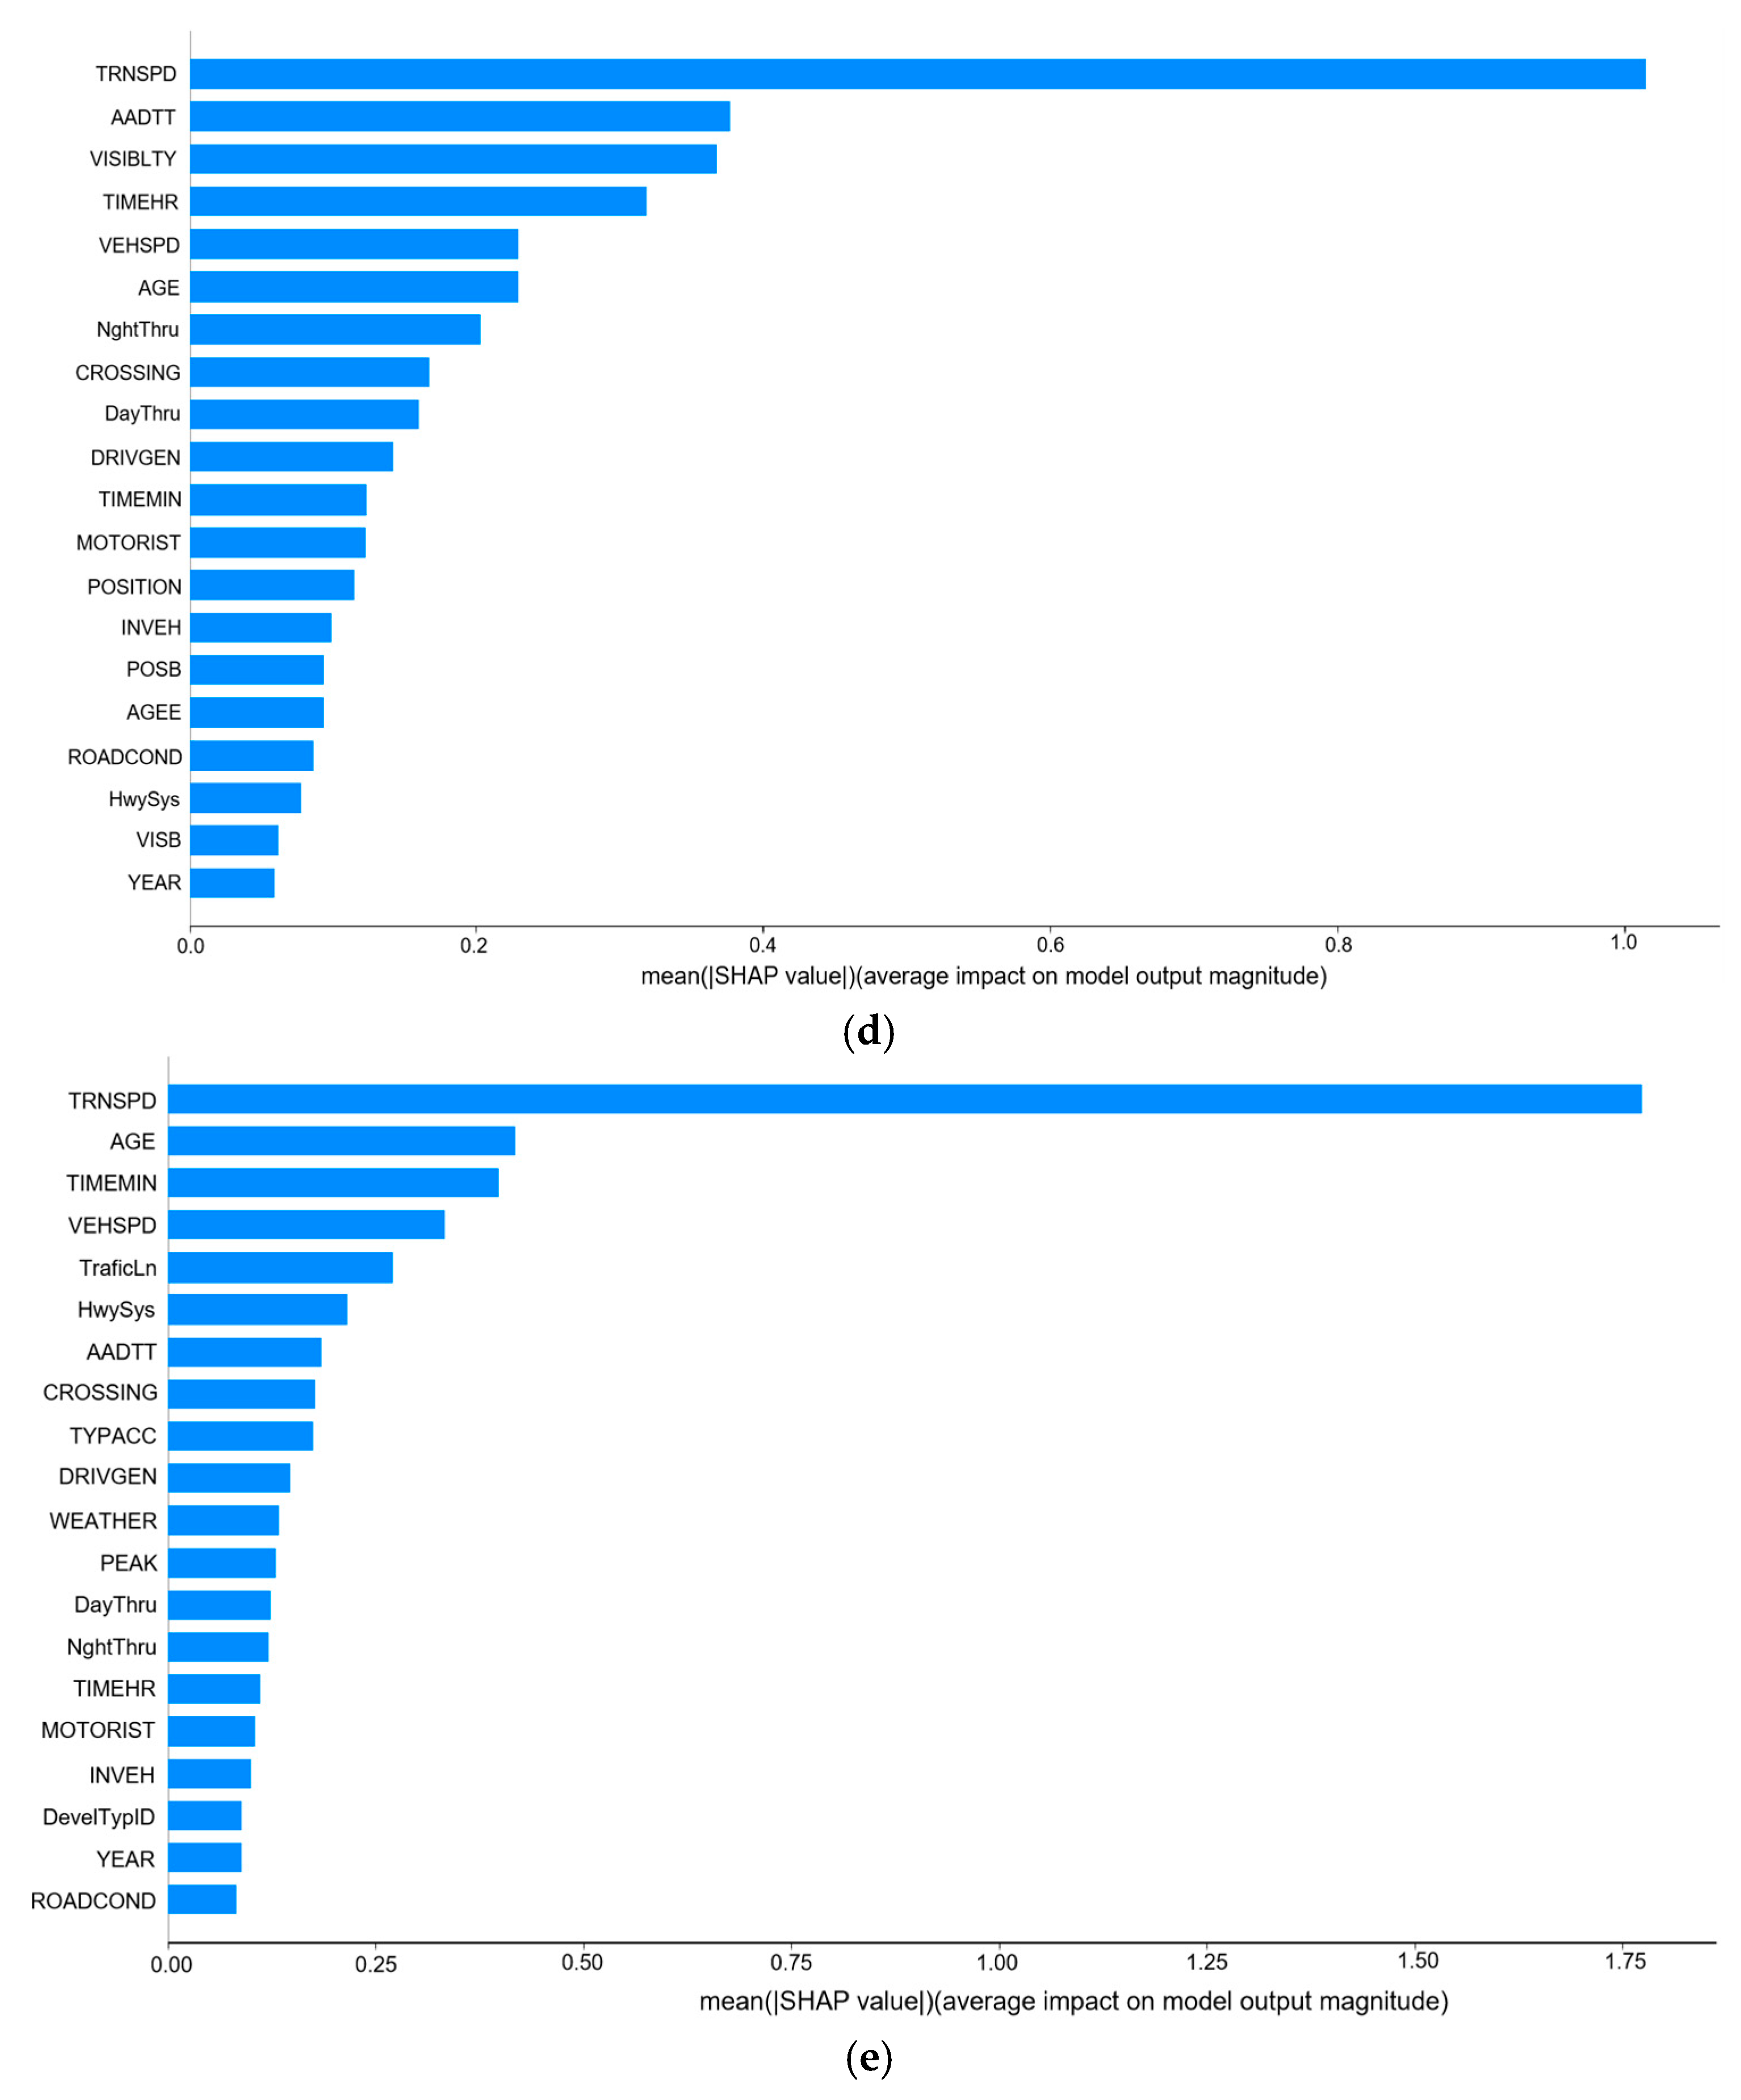
The relative importance of various features affecting accident severity at highway–rail grade crossings was quantitatively assessed through SHAP (SHapley Additive exPlanations) attribution analysis, as illustrated in
Figure 6. The abscissa denotes the mean absolute SHAP values, representing the magnitude of feature contributions, while the ordinate displays the predictive factors ranked in descending order based on their relative importance to the model’s interpretability. The analysis of risk factors revealed several critical variables that consistently influence accident severity across all conditions.
Figure 6 illustrates the global feature importance derived from the XGBoost model. The results demonstrate that the five most influential features are: “TRNSPD”(train speed), ”AGE” (driver age), “VEHSPD” (vehicle speed), “AADTT”(average annual daily traffic), and “TYPACC” (type of accident).
TRNSPD (Train Speed)
The “train speed” variable represents the operational speed reported at the moment of collision, typically ranging from 10 to 50 mph. The crashes analyzed in this study involve conventional trains operating at speeds below 80 mph, rather than high-speed rail systems. In the ungrouped analysis (
Figure 6a), train speed was identified as the single most influential factor determining accident severity. Its SHAP values consistently showed strong positive contributions, reflecting the exponential increase in collision force and the limited reaction time at higher velocities. When conditions were disaggregated, train speed remained the top determinant across all four pavement–lighting combinations, but its relative importance varied. Under dry-lit conditions (
Figure 6b), its influence was high yet somewhat moderated by visibility and advanced safety infrastructure. In dry-unlit and non-dry-lit settings, the contribution of train speed intensified, while in the non-dry-unlit scenario, it reached its maximum, clearly indicating a compounding effect of poor visibility and reduced friction. This pattern highlights that while train speed is globally dominant, its risks are disproportionately magnified in adverse environmental contexts.
VEHSPD (Vehicle Speed)
Globally, vehicle speed ranked within the top five variables in
Figure 6, showing a strong positive association with severe outcomes. When analyzed across conditions, vehicle speed displayed clear context dependence. On dry-unlit pavements, vehicle speed ranked among the top three predictors, reflecting how the absence of lighting makes high vehicular velocity especially hazardous. In contrast, under dry-lit conditions, its importance was lower, as visibility partially mitigated risks. In non-dry-unlit scenarios, vehicle speed again became one of the top contributors, reinforcing the interaction effect whereby slippery surfaces and poor visibility exacerbate the dangers of excessive speed. This pattern confirms that vehicular speed is not uniformly risky but is strongly modulated by pavement and lighting conditions.
AGE (Driver Age)
Driver age demonstrated a consistent effect across all scenarios, with older drivers (65+) more prone to severe outcomes. This effect reflects age-related declines in visual acuity, cognitive processing, and motor response. Notably, age gained greater importance in unlit conditions, where diminished visibility compounded the limitations of older drivers, further delaying hazard recognition and reaction. In non-dry and unlit environments, age effects interacted with speed-related factors, producing a marked escalation of severity risk. These findings underscore the need for targeted interventions for elderly drivers, particularly under poor lighting and adverse surface conditions.
MOTORIST (Motorist Behavior)
Although not among the top five variables in the ungrouped analysis (
Figure 6a), motorist behavior emerged as a critical factor when disaggregated by condition. Under dry-lit pavements, it ranked second, demonstrating that risky behaviors such as gate violations or failure to stop contribute substantially to severity even when environmental conditions are favorable. However, under dry-unlit conditions, its relative influence declined, as speed and age factors became more dominant. This shift implies that in poor lighting, the direct risks of environmental and physiological constraints overshadow risky behaviors, though violations remain critical. Thus, motorist behavior is particularly important in contexts where drivers perceive visibility as sufficient, and violations become the decisive human factor in accident outcomes.
AADTT (Average Annual Daily Traffic)
AADTT (average annual daily traffic) played a substantial role in shaping severity outcomes but with notable variation across conditions. On dry-lit and non-dry-lit pavements, AADTT ranked among the top three variables, suggesting that crossings with higher traffic volumes face elevated risks due to queuing and congestion. However, in non-dry-unlit conditions, its importance declined, as environmental and infrastructural factors became more decisive. This finding reflects a context-dependent effect: while traffic exposure can increase risks under favorable conditions, its influence is partly overshadowed when environmental hazards dominate.
Taken together,
Table 3 highlights that while speed-related factors (train and vehicle velocity) remain dominant under all conditions, their contributions are disproportionately magnified under non-dry and unlit scenarios. Driver age and motorist behavior exhibit context-specific importance, with age effects amplified in unlit environments and risky driving behavior most critical under adequate lighting. Traffic exposure also shows conditional influence, further illustrating that the interaction between road surface and lighting plays a central role in shaping the relative importance of risk factors.
5.3. SHAP Analysis
The SHAP analysis is conducted to interpret the marginal contributions of each variable to crash severity predictions.
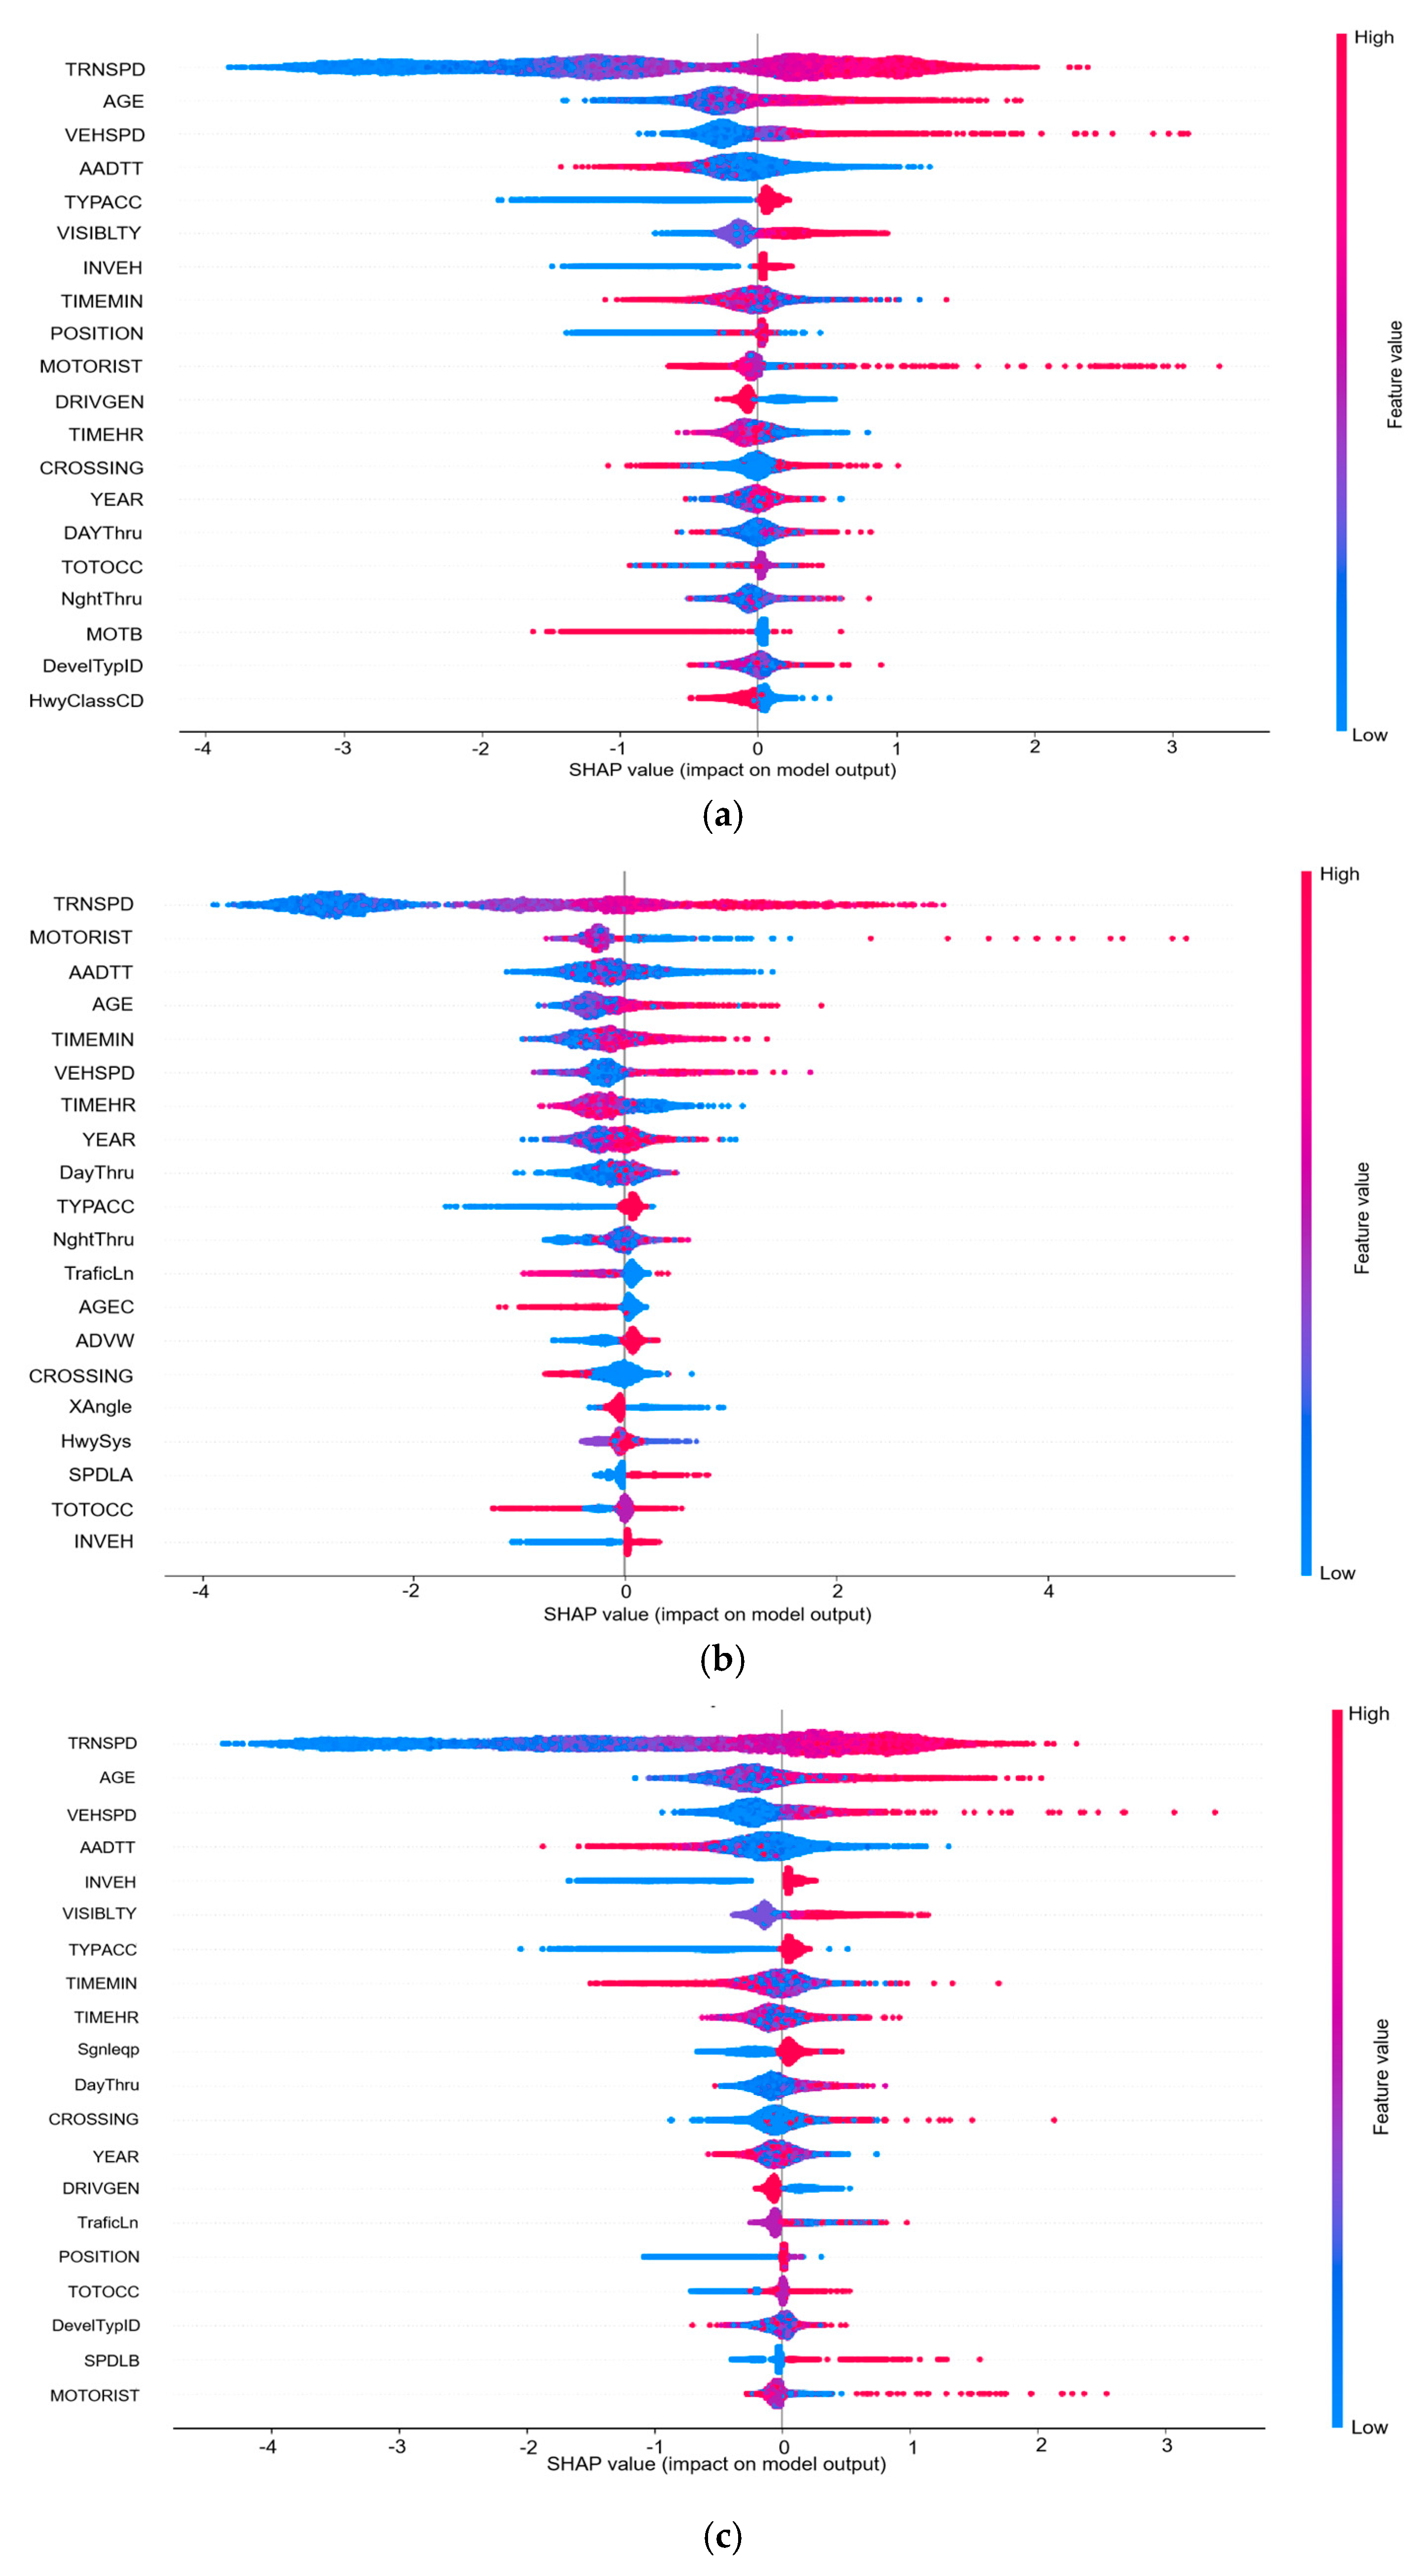
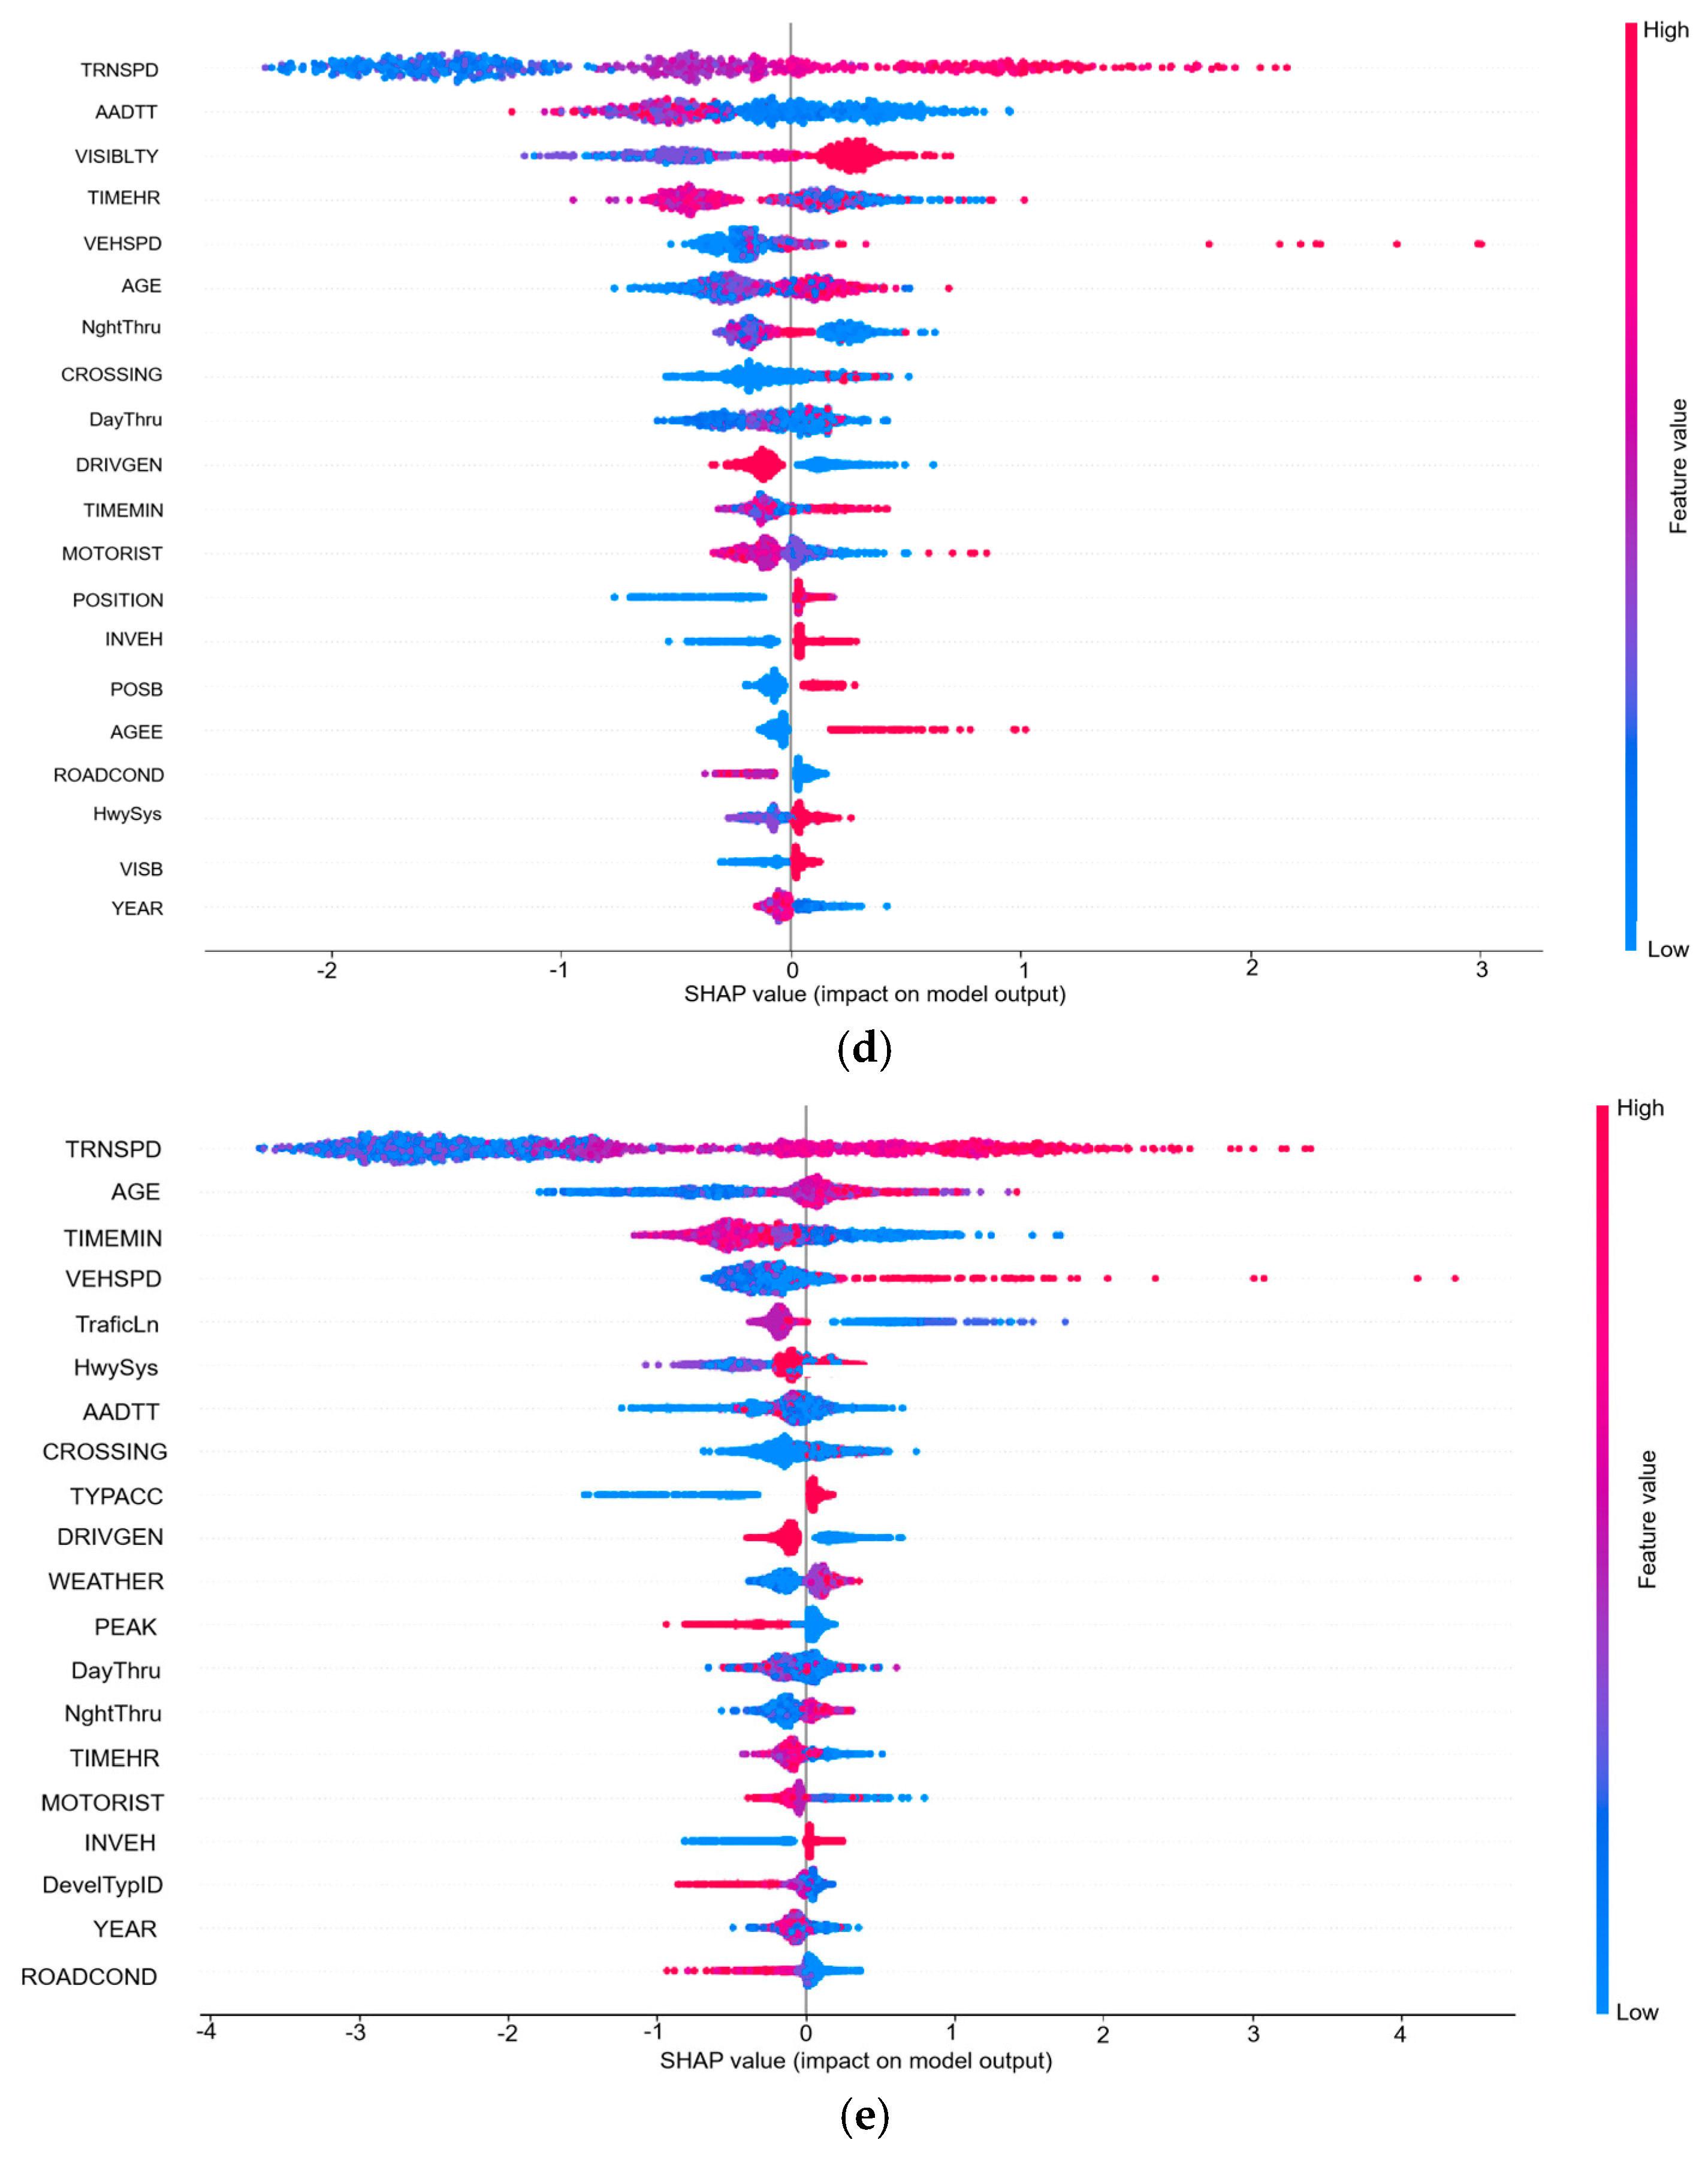
Figure 7 presents the SHAP summary plot for different conditions, illustrating the mechanistic influences of various features on accident severity at highway–rail grade crossings. Each data point in the plot represents an individual sample observation. The x-axis displays SHAP values, calculated as the mean absolute contribution across all samples, which quantifies each feature’s relative impact on model predictions. Higher absolute SHAP values indicate greater influence on the predictive outcome, where positive values denote risk-increasing effects and negative values represent protective effects. The study concentrates on analyzing the top five features influencing accident severity:
Train speed has a strong positive influence on accident severity, meaning that as train speed increases, the probability of severe or fatal outcomes rises. This is because higher speed not only shortens the available reaction time but also increases collision energy exponentially. Under non-dry and unlit conditions, this positive effect is even stronger, as wet or icy surfaces reduce braking efficiency and the absence of lighting further limits visibility, together amplifying the hazard.
Vehicle speed also shows a consistent positive effect. Faster vehicle movement increases the likelihood of severe crashes, primarily by reducing stopping distance and elevating impact force. On dry and well-lit roads, this effect is less pronounced because visibility and traction allow drivers to compensate. However, in unlit or non-dry conditions, the positive contribution of vehicle speed becomes more evident, reflecting how slippery surfaces and poor lighting combine with high velocity to raise risk.
Driver age demonstrates a positive relationship with severity, particularly for older drivers. Higher age is linked to greater crash severity due to slower reactions and reduced hazard perception. In lit conditions, the positive effect of age is weaker, as better visibility partly offsets age-related disadvantages. Yet in unlit and non-dry scenarios, the positive effect grows stronger, showing that poor visibility magnifies the vulnerabilities of elderly drivers.
Motorist behavior has a positive effect when violations occur, such as driving around gates or failing to stop. Under dry and lit conditions, this variable contributes strongly, as reckless actions become the dominant trigger of severity even when the environment is favorable. In unlit conditions, however, its relative contribution is reduced, as the effects of speed and age overshadow behavior. Nevertheless, when combined with high speeds, unsafe driving actions still significantly push outcomes toward more severe levels.
AADTT exerts a mixed influence. At low-traffic crossings, its SHAP values are more positive, indicating greater severity, likely because drivers underestimate train arrival frequency and are more prone to risky maneuvers. At high-traffic crossings, SHAP values tend to be negative, suggesting that congestion and slower approach speeds lower the risk of severe outcomes. In adverse scenarios, such as non-dry and unlit conditions, the influence of AADTT weakens, as environmental hazards dominate.
Weather and visibility also show distinct effects in grouped analyses. Poor visibility and adverse weather conditions have positive contributions, meaning they increase the likelihood of severe accidents, especially when paired with high speed. In contrast, clear weather and good visibility produce negative contributions, serving as protective factors. The most critical condition is the combination of non-dry surfaces and absent lighting, where positive contributions from speed, age, and environmental factors converge, producing the highest severity.
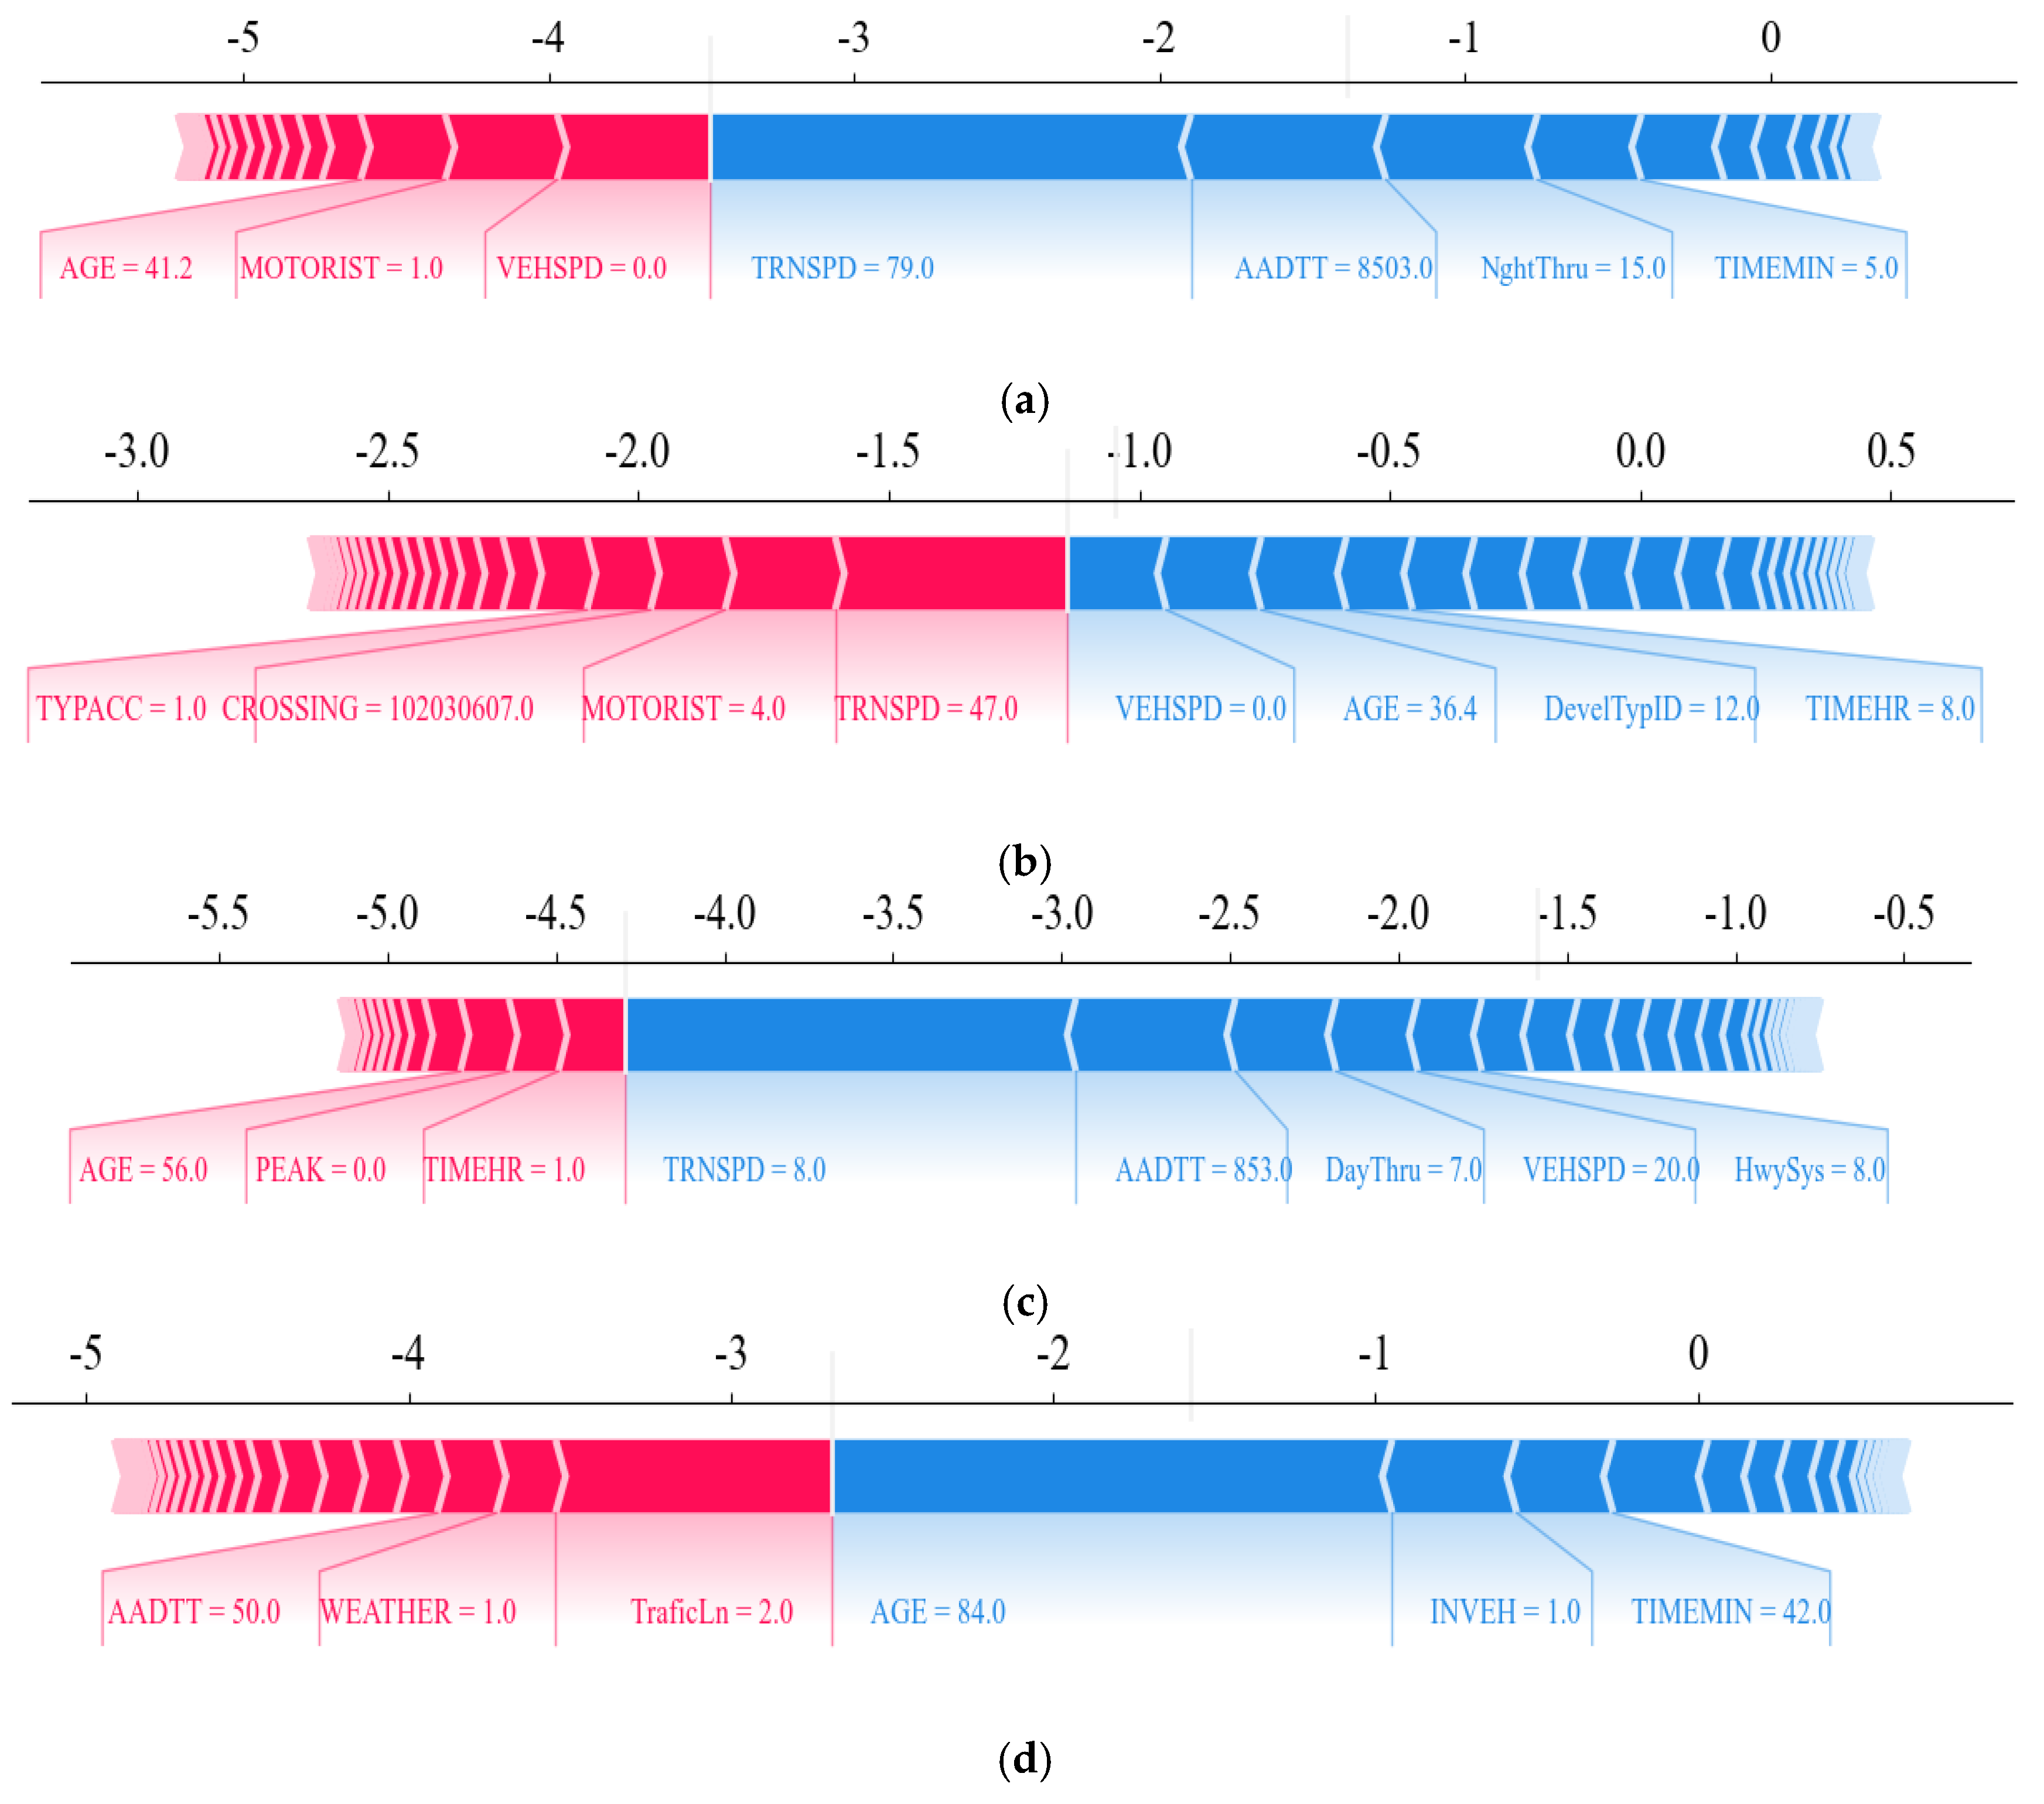
To study the contribution of various factors to the severity of driver injuries in accidents at highway–railroad grade crossings, SHAP force plots were generated for the accident dataset in each scenario, as shown in
Figure 8. The following is a detailed analysis:
Condition 1: AGE = 41 (driver age) and MOTORIST = 1 (Motor vehicle driver’s action at highway–rail grade crossing) increase the severity of driver injuries. In contrast, TRNSPD = 79 (train speed), AADTT = 8503 (average annual daily traffic) and NightThru = 15 (Number of through trains passing the grade crossing at night) reduce the predicted severity. A potential explanation is that elevated train speeds are predominantly observed at crossings with advanced safety infrastructure, optimal visibility conditions, and substantial traffic flow. These factors may synergistically mitigate collision severity.
Condition 2: Factors such as TYPACC = 1 (train colliding with a motor vehicle), MOTORIST= 4 (Motor vehicle driver’s action at highway–rail grade crossing) and TRNSPD = 47 (train speed) elevate severity. Conversely, VEHSPD = 0 (vehicle speed) and AGE = 36.4 (driver age) reduce the severity of injuries. This suggests that on unlit dry road surfaces, accident severity is predominantly determined by collision direction, driving behavior, and train speed, while lower vehicle speeds and younger drivers are associated with reduced risk.
Condition 3: Under this condition, AGE = 56 (driver age) increases the severity of driver injuries. However, TRNSPD = 8 (train speed) and VEHSPD = 20 (vehicle speed) show a protective effect against severe collisions.
Condition 4: Factors such as AADTT = 50 (average annual daily traffic) and WEATHER = 1 (adverse weather conditions) are significantly associated with increased injury severity. On the contrary, factors such as INVEH = 1 (driver inside the vehicle), AGE = 56 (driver age), and TIMEMIN = 42 (time in minutes) attenuate the severity of injuries. This suggests that non-dry pavement without lights represents the most hazardous condition, where environmental factors and road infrastructure predominantly determine injury severity levels.
In summary, SHAP analysis indicates that speed-related factors, driver age, and risky behaviors all have strong positive effects on crash severity, but their marginal influence is shaped by pavement and lighting conditions. Non-dry and unlit scenarios create a compounding effect in which environmental hazards and human vulnerabilities interact, leading to the greatest escalation of crash risk. The findings demonstrate that absent illumination consistently amplifies the adverse effects of speed and driving behaviors, while non-dry pavement conditions shift criticality to environmental and infrastructural variables. Additionally, The SHAP force plots reveal significant local interaction effects, facilitating the development of context-specific safety strategies.
6. Discussion and Policy Implication
This study advances the understanding of crash severity at highway–rail grade crossings by demonstrating that pavement condition and lighting do not simply exert additive influences but interact in ways that fundamentally reshape severity outcomes. Prior research has consistently identified the independent effects of lighting [
8] and road-surface conditions [
9] on injury severity, yet these factors have been modeled separately and often treated as parallel contributors. The present findings provide the first empirical evidence, using SHAP interaction analysis, that the joint effect of non-dry surfaces and absent illumination produces a super-additive risk pattern—a mechanism that earlier studies largely implied but never quantified.
Compared with Hao and Kamga’s work [
8], which attributed higher severity levels at unlit crossings to reduced visibility, our results show that this effect is substantially intensified when darkness co-occurs with wet, icy, or contaminated surfaces. Similarly, Yang et al. [
9] highlighted the role of surface slipperiness but did not examine how its influence changes under different illumination conditions. The present analysis shows that under poor lighting, the marginal contribution of non-dry pavement nearly doubles, indicating that illumination is not merely a background factor but a condition that alters the operational meaning of surface friction. This aligns with Morgan and Mannering’s broader observation [
17] that environmental factors interact with demographic characteristics but goes further by quantifying the structural form of these interactions.
According to the model results, accident severity at highway–rail grade crossings arises from the intertwined effects of environmental conditions, operational characteristics, and driver behavior. Rather than acting independently, these elements interact in ways that reshape the risks associated with each factor. The most striking finding is the amplified influence of train and vehicle speeds under non-dry and unlit conditions, revealing that the combination of reduced surface friction and poor visibility produces a level of danger that exceeds the simple sum of their individual effects. This super-additive pattern reflects the underlying physical dynamics of crash development: moisture or debris on the pavement lengthens braking distance, while darkness delays hazard recognition. When these two conditions occur together, the remaining reaction window becomes sharply compressed, and even small increases in speed can lead to disproportionately severe outcomes. The interaction uncovered by the SHAP analysis makes clear that environmental factors cannot be treated as isolated contributors but instead form a coupled system that significantly alters the consequences of driver and train actions.
The behavior of older drivers further illustrates how human limitations interact with adverse environmental conditions. Age-related declines in visual processing and reaction time do not simply add to the challenges created by poor lighting; the two constraints reinforce each other. In low-light settings, drivers already struggle to detect the presence or speed of an approaching train, and this perceptual gap is widened when visibility is further reduced by rain, snow, or road contamination. As a result, older drivers face a compounded disadvantage: they recognize hazards later and have less effective braking capacity available once they do. The model’s output captures this combined effect, with driver age contributing more strongly to severe outcomes in the scenarios where illumination and surface conditions are jointly unfavorable.
The influence of risky driver actions also varies with environmental context, providing insight into how behavior adapts or fails to adapt to changing conditions. In well-lit and dry situations, violations such as driving around gates or failing to stop play a decisive role in determining severity. Under such conditions, drivers may perceive the crossing environment as predictable and manageable, leading them to engage more confidently in unsafe actions. However, once visibility deteriorates or the pavement becomes slippery, the relative impact of these behaviors shifts. The environment itself becomes a dominant source of danger, but when violations still occur under these conditions, their consequences escalate sharply. The model captures this shift by showing that the marginal contribution of driver behavior to severity varies across the four scenarios, reinforcing the need to interpret behavioral data within its environmental context rather than in isolation.
As a result, based on the identified high-risk factors, the following targeted improvement measures are proposed. Firstly, speed management measures for both trains and vehicles should be implemented. Under conditions of poor lighting and adverse weather, dynamic speed limits should be applied, with real-time adjustments based on weather, visibility, and traffic conditions to reduce the likelihood of accidents. Secondly, authorities should strengthen driver safety education and enforcement. For high-risk behaviors such as illegal crossing or driving around barriers, enhanced video surveillance and automated enforcement should be adopted, along with targeted safety training for elderly drivers. Additionally, low-traffic but high-risk crossings should be prioritized for intelligent warning systems and stricter safety management measures [
33]. Last but not least, high-intensity LED lighting and anti-skid facilities should be installed at high-risk crossings to improve visibility and road safety. Under wet or slippery road conditions, additional lighting can be activated, while under dry conditions, lighting can be reduced. This adaptive lighting strategy not only ensures adequate visibility to enhance traffic safety but also contributes to energy conservation and reduced carbon emissions, aligning with both safety and sustainability objectives.
7. Conclusions and Future Works
This study systematically investigates the key determinants of accident severity at highway–rail grade crossings (HRGCs) using an integrated XGBoost–SHAP framework, with a particular focus on the interaction effects of road surface and lighting conditions. By analyzing a decade of FRA accident records, the results demonstrated that speed-related factors (train and vehicle velocities), AGE, MOTORIST, and AADTT consistently emerged as the most influential determinants of crash outcomes. SHAP analysis further revealed that these factors exert context-dependent contributions, with their marginal effects substantially altered by pavement and illumination conditions.
A key finding is the critical role of interaction effects. Although train speed remains globally the dominant predictor, its positive contribution to crash severity was disproportionately magnified under non-dry and unlit scenarios. Vehicle speed and driver age exhibited similar amplification, with older drivers facing particularly high risks when visibility was poor. Motorist violations, while always hazardous, were most decisive under dry and lit environments where human error becomes the primary trigger. Traffic exposure showed a nonlinear influence: low-volume crossings paradoxically displayed higher severity risks, particularly when adverse environmental conditions were present. Together, these findings highlight a “super-additive effect” in which non-dry pavement and absent illumination jointly elevate severity beyond the sum of their independent risks.
The methodological contribution of this research lies in combining XGBoost with SHAP interpretability. The XGBoost model outperformed traditional ensemble approaches, offering superior predictive accuracy and stability, while SHAP analysis enabled clear attribution of risk contributions and uncovered the mechanisms underlying variable interactions. This dual approach not only enhanced predictive capacity but also provided interpretable evidence for policy and engineering interventions.
There are some limitations to this study. The dataset used in this study lacks quantitative information on driver behavioral states (such as distraction and psychological stress), which may limit the comprehensiveness of interpreting human factors in accident severity. Future research could incorporate real-time environmental data to enhance predictive accuracy and explore the interactions between driver behavioral characteristics and environmental variables. Additionally, although lighting conditions partially capture visibility effects, the dataset does not explicitly include the “time of day” variable. This may limit the differentiation between natural daylight and artificial illumination. Future work could incorporate a temporal visibility index or categorize crashes by time segments (e.g., dawn, day, dusk, night) to better distinguish between natural and artificial lighting effects. Moreover, given the temporal effects of accident data, conducting temporal stability analyses would provide deeper insights and strengthen the robustness of the findings.

