Article

Manufacturability-Constrained Multi-Objective Optimization of an EV Battery Pack Enclosure for Side-Pole Impact

1
College of Automobile and Traffic Engineering, Heilongjiang Institute of Technology, Harbin 150050, China
2
College of Mechanical and Electronic Engineering, East University of Heilongjiang, Harbin 150066, China
*
Author to whom correspondence should be addressed.
World Electr. Veh. J. 2025, 16(11), 632; https://doi.org/10.3390/wevj16110632
Submission received: 22 September 2025 / Revised: 14 November 2025 / Accepted: 17 November 2025 / Published: 19 November 2025
(This article belongs to the Section Storage Systems)

Abstract

This work minimizes battery pack enclosure mass (kg) and peak deformation (mm) under a side-pole impact condition and validates the results by finite-element reruns complemented by coupon-level material tests. A 64-run optimal Latin hypercube dataset trained ARD Matérn-5/2 Gaussian-process surrogates, and NSGA-II performed a multi-objective search on a manufacturability grid ( Δ t = 0.5 mm). Decision-making processes used knee-region filtering and TOPSIS in the normalized objective space with robustness checks (uncertainty inflation, weight perturbation, and cross-kernel audit). The representative optimum reduced mass from 149.40 kg to 115.20 kg (−22.89%) while keeping peak deformation essentially unchanged (66.17 → 66.25 mm) in independent reruns. To examine material dependence, an orthotropic CFRP cross-check was performed by substituting the upper cover and side walls: the iso-thickness mapping yields 90.40 kg with 68.67 mm (+3.65% vs. aluminum x ), whereas a constrained iso-mass setting ( H 1 = 7.0 mm, H 2 = 7.0 mm) gives 111.70 kg with 80.85 mm (+22.04%). The observed trends are consistent with the laminate’s lower transverse-shear moduli and shear-sensitive load paths; damage evolution and lay-up optimization are outside the present scope. The workflow provides a reproducible route to balance lightweighting and deformation control for battery pack enclosures.

Graphical Abstract

1. Introduction

Since the onset of the Industrial Revolution, fossil fuels have underpinned global energy systems, enabling industrial growth and economic expansion. The International Energy Agency (IEA) estimates that oil and natural gas operations account for about 15% of energy-related emissions—roughly 5.1 billion tons of greenhouse gases each year [1]. Conventional internal combustion vehicles, reliant on petroleum fuels, remain a major source of urban air pollutants and a significant driver of climate change [2]. In response, battery-powered new energy vehicles have emerged as a practical route to lower energy use and environmental burdens while advancing sustainable mobility [3]. As Hu et al. documented, technology trajectories in China’s NEV sector have moved rapidly toward integrated pack architectures and higher levels of functional integration, reshaping constraints at the enclosure level.
Battery pack enclosures are the primary protective structures for traction batteries and are central to the mechanical safety and reliable integration of cells and modules [4]. Their design directly affects crashworthiness, while mass reduction is indispensable for energy efficiency. Accordingly, high-strength steels, aluminum alloys, and carbon-fiber composites are commonly considered for their strength-to-weight advantages [5,6]. A commonly reported relationship is that a 10% decrease in vehicle mass yields about a 5.5% reduction in energy consumption and a comparable improvement in range [7]. Effective enclosure design therefore calls for coordinated choices of materials, geometry, and manufacturing processes to balance structural safety against weight.
Each material system carries distinct trade-offs. Carbon-fiber composites provide high specific stiffness, but anisotropy complicates load paths, necessitates advanced lay-ups, and increases fabrication cost by roughly 40–60% versus aluminum alloys; its low transverse thermal conductivity can magnify temperature gradients, and its graphite-based spreaders may compromise in-plane strength [8,9]. Impact behavior is another concern: Zhou et al. showed with woven-CFRP hat-sections that dynamic bending and axial crushing tend to activate brittle failure modes, limiting the composite’s plastic energy absorption [10]. Aluminum alloys—particularly AA6061 and AA7075—offer a different balance: specific strengths on the order of 100–150 kN·m/kg, crash performance with energy absorption ≥ 150 kJ/m3, and thermal conductivity around 120–220 W/m·K, which aids in heat dissipation during fast charging [11,12,13,14,15]. Property datasets for 7000-series alloys (e.g., hardness–strength relationships and fatigue characteristics) are well characterized, which facilitates model calibration for simulation-driven design. On the manufacturing side, extrusion and casting enable integral stiffeners and weldable flanges, and joining options such as FSW, SPR, and structural adhesives are compatible with high-volume production; recyclability is favorable, with recovery rates often exceeding 95% [16,17].
Two material families dominate enclosure research—aluminum alloys and fiber-metal laminates (FMLs) or all-composite designs. FMLs such as CARALL and GLARE combine the plastic energy absorption of metals with the specific stiffness of composites and can deliver strong fatigue and impact performance; their response, however, is highly sensitive to the metal–composite interface quality and lay-up, and CFRP laminates exhibit strongly anisotropic thermal conductivity with low through-thickness values, which complicates pack-level heat spreading and fire-exposure margins. By contrast, AA6061/AA7075 aluminum remains prevalent in production enclosures owing to its mature extrusion/casting routes and joining options (e.g., friction-stir welding and self-piercing riveting), well-tabulated property datasets for FE calibration, comparatively high thermal conductivity (~130–170 W·m−1·K−1) that aids heat dissipation, and established end-of-life recycling pathways (automotive “grave-to-gate” recycling ≈ 91% in the United States). Recent engineering and LCA studies likewise indicate that, while composite/FML enclosures continue to advance, aluminum often remains the primary choice when manufacturability, cost, and recyclability dominate the design trade space [18].
Beyond material choice, enclosure engineering is shaped by packaging architecture (module-based, CTP/CTC) and a set of cross-domain requirements that must be met simultaneously: crashworthiness under lateral/oblique and side-pole impacts, global and local stiffness, first-model resonance isolation, thermal-runaway mitigation, sealing and maintainability, as well as cost and recyclability [16,19]. To protect cells and busbars, the structure must transfer loads from side members and pole-type impacts without triggering brittle fracture or localized buckling, while keeping deformation within allowable limits [20,21]. This has motivated cellular and sandwich concepts. Chen et al. designed space-efficient multi-cell protection for cylindrical cells and clarified load-transfer and failure mechanisms in thin-walled layouts, achieving higher specific energy absorption per packaging volume [4]. Li et al. proposed bio-inspired honeycomb patterns that delay localization and enhance energy absorption with modest mass penalties at pack scale [5]. For hybrid systems, Wang et al. co-optimized metal–composite enclosures and showed that judicious placement of composite skins and metallic substructures improves crash response without undue weight growth [7], while Severson et al. outlined a CFRP-skin/aluminum-honeycomb methodology that emphasizes joint design and core selection for stiffness-to-mass gains in demanding applications [17]. Complementarily, Kulkarni et al. used FEA to map laminate orientation and lay-up effects in CFRP enclosures, highlighting the stiffness–energy-absorption trade-off that must be navigated under impact [8].
Thermal safety introduces further coupling. Lv et al. experimentally demonstrated that LDPE-enhanced phase-change materials with low fins reduce peak temperature and improve uniformity relative to baseline convective schemes [15]. Post-event analyses by Sterling et al. documented stiffness loss and progressive damage in composite structures exposed to battery fires, underscoring the need to fold thermal scenarios into structural margins rather than addressing thermal management in isolation [22]. From a production standpoint, reviews by Graf and Das synthesize alloy families, forming/joining options, and recycling pathways for automotive lightweighting, reinforcing that aluminum systems align well with enclosure targets spanning mass, cost, and end-of-life recovery [16].
Against this backdrop, high-fidelity finite-element analysis (FEA) is indispensable when mechanical loading, thermal management, and impact response interact. Validation studies suggest that modern models typically track experiments within about 5% [20]. Several lines of work illustrate feasible routes. Pan et al. pursued lightweight enclosure design using advanced high-strength steels and size optimization, reporting ~10% mass reduction while maintaining structural integrity [6]. Szabo et al. applied topographical optimization to a battery module case, tuning bead patterns and local stiffeners to raise stiffness with restrained mass increase [23]. For vehicle-scale packs, Gilaki et al. proposed a model-based design framework that reduces computational effort through hierarchical modeling while preserving essential response fidelity [24]. In cellular architectures, Dhoke and Dalavi optimized a honeycomb enclosure and achieved a 33.16% mass reduction together with a 40.57% drop in maximum deformation under a 220 kg gravitational load, demonstrating the effectiveness of geometry-driven absorption [25]. Collectively, these studies point to two practical imperatives: (i) geometry/material co-design is central to enclosure performance; and (ii) tractable computation is necessary as the design space expands to thickness maps, beads, ribs, and joints.
To manage competing objectives under realistic constraints, multi-objective optimization has become standard practice. Deb et al.’s NSGA-II provides a fast, elitist, non-dominated sorting scheme with crowding-distance preservation and remains widely used for enclosure problems [26]. Alongside Pareto-ranking approaches, decomposition-based methods such as MOEA/D partition the problem into scalar subproblems via weight vectors and exploit neighborhood cooperation; this often yields good spread on the front and offers a convenient handle for constraint treatment in engineering designs with many continuous variables. In parallel, swarm-based algorithms—in particular multi-objective PSO (MOPSO)—are attractive for surrogate-assisted outer loops because of their simple operators and competitive convergence on continuous thickness/geometry spaces; for battery-pack applications, Lin et al. demonstrated that metamodel-driven PSO search can reduce computational cost while keeping stresses within limits and improving modal performance [27]. Building on the GA family, Naresh et al. integrated FE analysis with global multi-objective optimization for aluminum enclosures and reported 49.41% lower deformation, 35.79% lower stress, and a 19.92% increase in resonant frequency—simultaneous gains across safety and NVH-related metrics [19]. From the topology side, Huang et al.’s floating-projection topology optimization (FPTO) delivered 15–20% improvements in thermo-mechanical objectives relative to SIMP in multi-objective settings [28]. For thickness mapping and decision selection, Wang et al. combined an improved NSGA-II, contribution analysis, and TOPSIS to attain 4.31% mass reduction with 5.97% less crash-induced deformation and to provide a clear route from the Pareto set to a single representative design [21]. Taken together, these results support an integrated workflow in which FE-based responses, decomposition- or swarm-based searching, Pareto ranking, and decision methods are used in concert for battery pack enclosure design [19,21,26,27,28].
Objectives and contributions: Focusing on a production-representative enclosure, this study prioritizes side-pole-impact deformation as the primary safety metric with mass reduction as a co-objective. The goals are to (1) minimize mass and side-pole-impact deformation under stress and first-model constraints, (2) construct FE-based response surfaces to enable an efficient multi-objective search, and (3) validate manufacturable thickness configurations through FE verification. The contributions are threefold: (i) a constraint-aware workflow that couples RSM with NSGA-II for thickness mapping under side-pole impact; (ii) an engineering-oriented design space that reflects packaging, joining, and thermal considerations; and (iii) FE-verified Pareto solutions that balance lightweighting with deformation control, offering a template for deployable enclosure design.
In summary, despite clear progress in materials and optimization strategies, many studies still lack parameterized models and implementable workflows tailored to production-oriented battery pack enclosures. To address this gap, we develop a methodology that integrates response-surface modeling (RSM), NSGA-II-based multi-objective optimization, and FE simulation for performance validation. Using a representative enclosure from a pure electric vehicle as the case study, the approach seeks a practical balance between mass and crash performance, demonstrating methodological reliability and engineering applicability.

2. Materials and Methods

2.1. Materials

Two material systems were used: an aluminum alloy sheet and a carbon-fiber-reinforced polymer (CFRP) laminate. Their geometry and material placement are described in Section 3.
Aluminum alloy sheet. A rolled 7075-T651 sheet was used.
CFRP laminate. A carbon-fiber/epoxy laminate was used. Its elastic properties were identified from coupon tests at 0°, 45°, and 90° and were used for an in-plane orthotropic shell representation in verification runs.

2.2. Mechanical Characterization

Standards and setup. Aluminum coupons followed GB/T 228.1-2021 tension testing of metallic materials [29]. CFRP coupons followed ASTM D3039 for in-plane tensile properties [30]. Aluminum tests were carried out on an electronic universal testing machine (LD26.105, Guangdong Kiatest Equipment Co., Ltd., Guangzhou, China). CFRP tests used a universal testing machine (Instron 5982, Instron, Norwood, MA, USA). Tests were run on displacement control at the crosshead speeds specified in the respective standards. Axial strain was measured using an extensometer (or DIC) over a gauge length L0.
Specimens. Table 1 summarizes specimen types and replicates. Aluminum coupons were machined from a 7075-T651 sheet of thickness t A l per GB/T 228.1-2021 geometry. CFRP coupons were cut with loading directions at 0°, 90°, and ±45° relative to the laminate reference axes per ASTM D3039; edges were polished to avoid premature failure. Representative aluminum and CFRP coupon specimens are shown in Figure 1.
Grip and preparation. Coupon edges were polished. To mitigate grip slip, only the ends were treated with a thin paste-type fixture compound (≈15,000 mPa·s) before clamping; this aided in gripping only and was not part of the structural concept. The experimental setup for the coupon tensile tests, including the LD26.105 and Instron 5982 systems, is shown in Figure 2.
Reporting. Table 2 reports elastic moduli and Poisson’s ratios as mean ± SD (n = 5) for each configuration. The CFRP in-plane shear modulus G x y was estimated per Section 2.3 when required.
Each configuration used n = 5 specimens. During testing the aluminum layer was placed on top and the CFRP layer below.
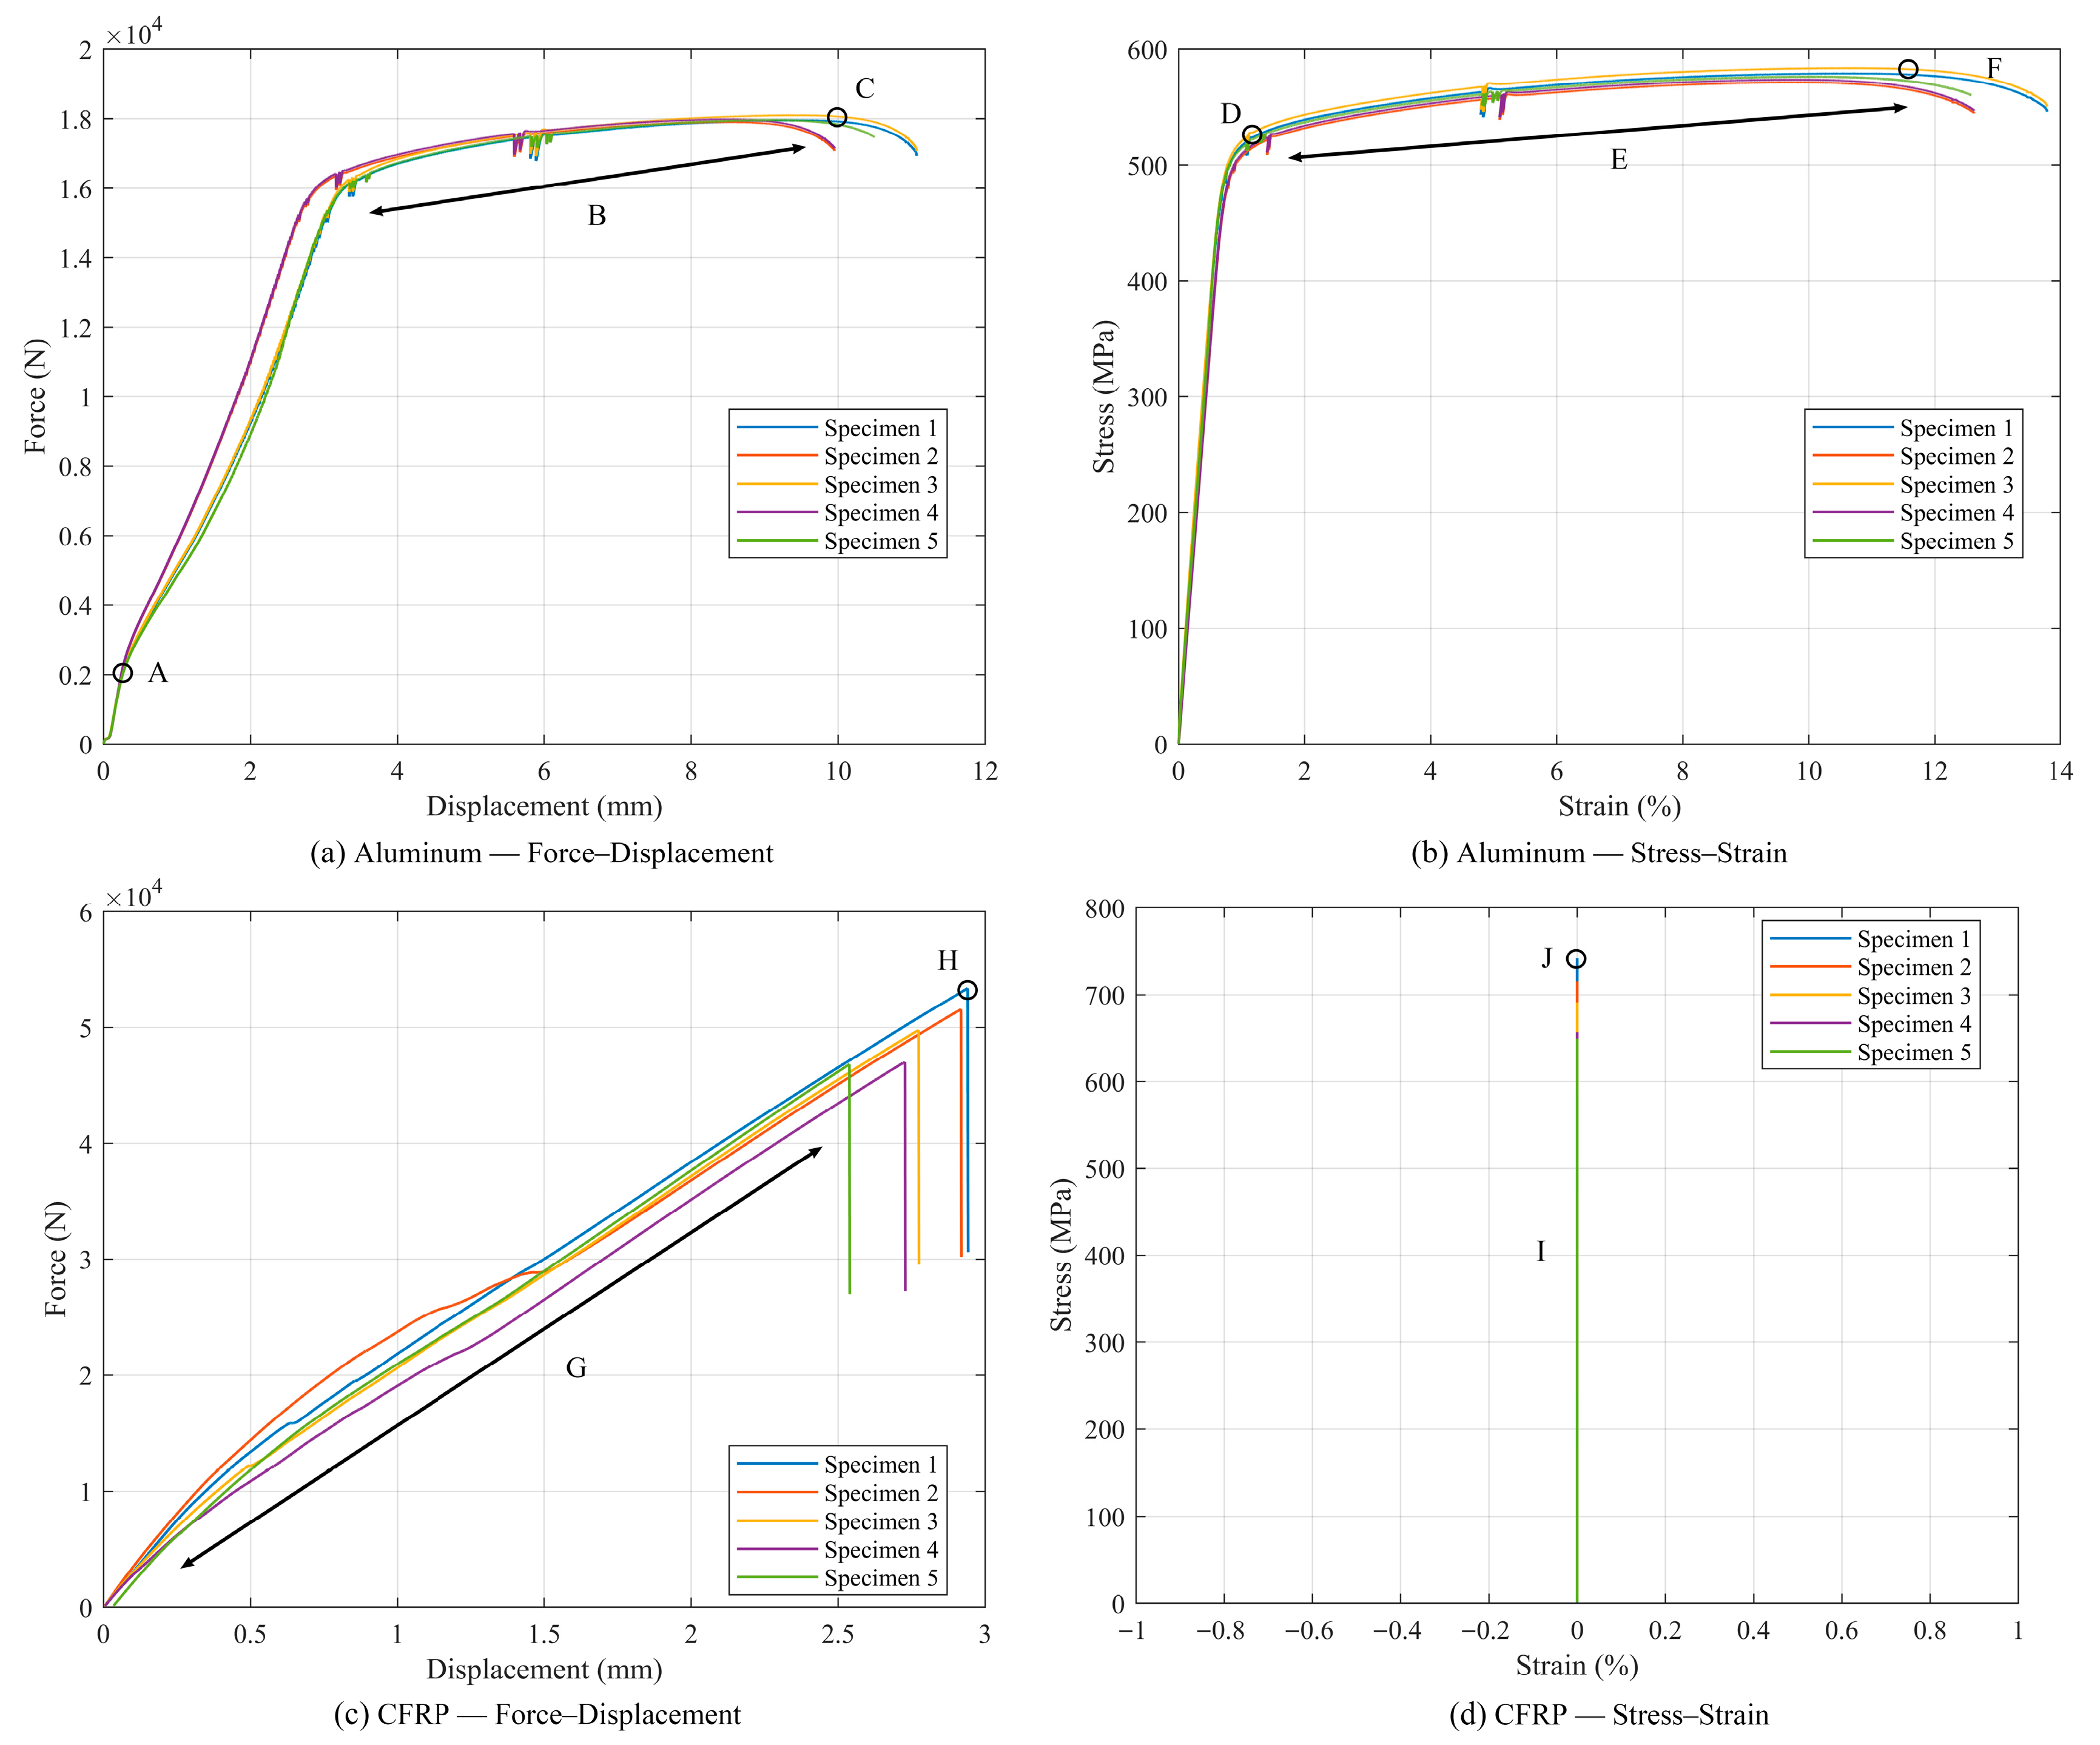
Figure 3 shows the main differences between the aluminum and CFRP coupon responses that are relevant for enclosure design. For 7075-T651, the force–displacement and stress–strain curves exhibit a long plastic range with several small load drops and a large failure strain (labels A–F), typical of a ductile, energy-absorbing material. The CFRP laminate, by contrast, responds almost linearly up to its tensile strength and then fails with an abrupt load drop at a low displacement and strain (labels G–J), indicating brittle behavior with little plastic reserve. Aluminum is therefore treated as the baseline material in the following sections, and CFRP is introduced only for cross-material verification.

2.3. Property Identification and Homogenization

Scope and coordinates.
Engineering constants were identified from the coupon tests in Section 2.2 and used to build shell stiffness for finite-element models. The in-plane material axes for CFRP were defined as x = 0° (warp/fiber direction) and y = 90° (weft/transverse); the ±45° coupons were used for in-plane shear characterization. The local shell 1-axis was aligned with the x-axis.

2.3.1. Aluminum (Isotropic)

The mechanical properties of the aluminum components were obtained from the tensile coupon tests described in Section 2.2. The tests followed GB/T 228.1-2021 [29]. The resulting engineering stress–strain curves for 7075 aluminum were used to determine the elastic modulus, Poisson’s ratio, the 0.2% proof stress, and the ultimate tensile strength, which were then assigned to the isotropic material model in the finite-element analysis.

2.3.2. CFRP (Orthotropic, 0°/90°/±45°)

The mechanical properties of the CFRP laminate were determined from tensile tests conducted in accordance with ASTM D3039 Standard Test Method for Tensile Properties of Polymer Matrix Composite Materials at room temperature. Specimens were cut in three orientations (0°, 90°, ±45°); five specimens were tested for each orientation, and the mean values are given in Table 2. The ±45° data were reduced following the same D3039 procedure to obtain the in-plane shear parameter.
With the material axes defined as 1 = 0° (fiber/warp) and 2 = 90° (transverse/weft), the adopted constants are as follows:
ρ C F R P = 1550   kg / cm 3 ,   E 1 = 82.7   GPa ,   E 2 = 75.0   GPa ,   ν 12 = 0.30 ,   G 12 = 5.0   Gpa .
The minor Poisson’s ratio follows
ν 21 = ν 12 E 2 E 1 = 0.30 × 75.0 82.7 0.272 ,
and
Δ = 1 ν 12 ν 21 0.918 .
Under plane stress, the reduced stiffnesses in the material system are
Q 11 = E 1 Δ 90.0   GPa ,   Q 22 = E 2 Δ 81.7   GPa ,
Q 12 = υ 12 E 2 Δ 24.5   GPa ,   Q 66 = G 12 = 5.0   GPa .
For a CFRP shell layer of thickness h CFRP ,
A i j = Q i j h CFRP ,     D i j = Q i j h CFRP 3 12 ,
and for the symmetric/single-layer representation used in the global model, the coupling matrix is zero ( B = 0 ). The shell 1-axis in the finite-element model is aligned with the 0° test direction.
Poisson’s ratio measured on the 0° coupon (transverse strain in y over axial strain in x, within the elastic range). The reciprocal Poisson’s ratio follows orthotropic reciprocity,
ν y x = ν x y E y E x
G x y : in-plane shear modulus from the ±45° tension method per ASTM D3518.
ρ C F R P : measured density of the laminate.
Define Δ o r t h o = 1 ν x y ν y x .
Membrane stiffness (A) and bending stiffness (D).Under plane stress, the reduced stiffness components in the material axes are
Q 11 = E x Δ o r t h o , Q 22 = E y Δ o r t h o , Q 12 = ν x y E y Δ o r t h o , Q 66 = G x y
For a shell layer of thickness h ,
A 11 = Q 11 h , A 22 = Q 22 h , A 12 = Q 12 h , A 66 = Q 66 h
D 11 = Q 11 h 3 12 , D 22 = Q 22 h 3 12 , D 12 = Q 12 h 3 12 , D 66 = Q 66 h 3 12
For symmetric lay-ups or single-ply equivalent shells used at the global model level, B = 0 . The local shell 1-axis is aligned with the 0° coupon direction used to identify E x .

2.3.3. Use in Finite-Element Models and Optimization

In the baseline finite-element model of the battery pack enclosure, all shell components used the aluminum alloy defined in Section 2.3.1. The response-surface construction and the subsequent multi-objective optimization were likewise performed with this aluminum material so that the obtained thickness variables represented an all-aluminum enclosure. The CFRP parameters in Section 2.3.2 were introduced only in later verification and comparative simulations (see Section 3) to assess the weight-reduction potential of substituting selected panels with a CFRP laminate.

2.4. Finite-Element Modeling of Side-Pole Impact

Objective: To predict the lateral deformation of the battery pack enclosure under a side-pole impact and to provide a consistent FE model for the optimization in Section 4.

2.4.1. Material Variants

Two FE material representations were used. The aluminum model assigned the isotropic 7075-T651 identified in Section 2.3.1 to all shell parts; this model was used for all baseline simulations, response-surface construction, and multi-objective optimization. The CFRP model assigned the orthotropic laminate from Section 2.3.2 to selected panels and was used only in a limited number of verification and comparative simulations (see Section 3). No aluminum–CFRP bonded sections were considered.

2.4.2. Geometry and Discretization

The enclosure geometry and part partition followed Section 3. All components were modeled with shell elements. A graded mesh was adopted: about 8 mm on the main enclosure panels, about 6 mm on internal members, and about 4 mm on the ribs and local reinforcements, with an aspect ratio ≤ 3 and warpage ≤ 10°. A mesh-convergence check showed that the difference in peak lateral deformation between the medium and refined meshes remained within 3–5%; the medium mesh was therefore used for optimization.

2.4.3. Loading, Boundary Conditions, and Contact

The lower cover was constrained along three perimeter edges to represent attachment to the vehicle structure; the remaining edge faced the rigid pole. The pole impacted laterally at the prescribed speed (see Section 3) with a small initial stand-off to avoid initial penetration. Contact between the rigid pole and the enclosure was modeled as surface-to-surface with penalty enforcement; shell thickness offset was activated; and a Coulomb friction coefficient of 0.2 was used. Simulations were run with explicit time integration; mass scaling was not applied in production runs.

2.4.4. Output and Data Reduction

The primary response quantity was the maximum lateral deformation L m a x at the impact location. Peak contact force F m a x , support reactions, and the histories of internal, kinetic, and contact-work energies were recorded to check solution quality and to compare the aluminum and CFRP cases.

2.5. Software and Hardware Environment

Geometry modeling and meshing were carried out in SolidWorks 2023 and Altair HyperMesh 2021. Crash simulations used LS-DYNA R11.0 (SMP, single precision), and results were post-processed in Altair HyperView 2021. Response-surface fitting and metaheuristic optimizers—custom implementations of NSGA-II—were implemented in MATLAB R2024a. All computations were performed on a Windows 11 laptop (HP Omen 10, HP Inc., Palo Alto, CA, USA) equipped with an Intel Core i9-14900HX CPU, 32 GB RAM, and an NVIDIA GeForce RTX 4060 GPU with 8 GB VRAM (NVIDIA Corporation, Santa Clara, CA, USA). A consistent unit system (mm–ms–kg) was used. Randomness and reproducibility were handled as follows: each optimization call executed R independent runs; per-run seeds were drawn once via randi(1e9,1,R) to form a seed list and applied with rng(s_r) to all stochastic operators. Within a given call, results were exactly reproducible using the recorded seeds (results/run_seed_*.mat); independent calls could use different seeds unless a user-specified seedList was provided. Bootstrap confidence intervals were computed post hoc with a fixed seed (2025) and did not affect the optimization outcomes. Algorithmic hyperparameters were kept constant across methods. The anonymized LS-DYNA keyword deck, DOE table, RSM scripts, and optimization codes are available from the corresponding author upon reasonable request (see Data and Code Availability).

2.6. Optimization Methodology

Battery enclosure structural optimization balances lightweight characteristics and crashworthiness, representing a typical multi-objective optimization problem. Multi-objective optimization simultaneously addresses two or more conflicting objectives, typically producing a set of Pareto-optimal solutions that reflect trade-offs among objectives.
Traditional optimization methods face challenges in addressing complex nonlinear, non-convex problems without gradient information. Evolutionary multi-objective optimization algorithms, leveraging population-based search mechanisms and strong global exploration capabilities, have been widely employed in engineering design. These algorithms, by simulating mechanisms such as natural selection, crossover, and mutation, can search multiple solutions simultaneously, approximating a complete Pareto front within a single run.

3. Finite Element Analysis of the Battery Pack Enclosure

3.1. Battery Pack Model

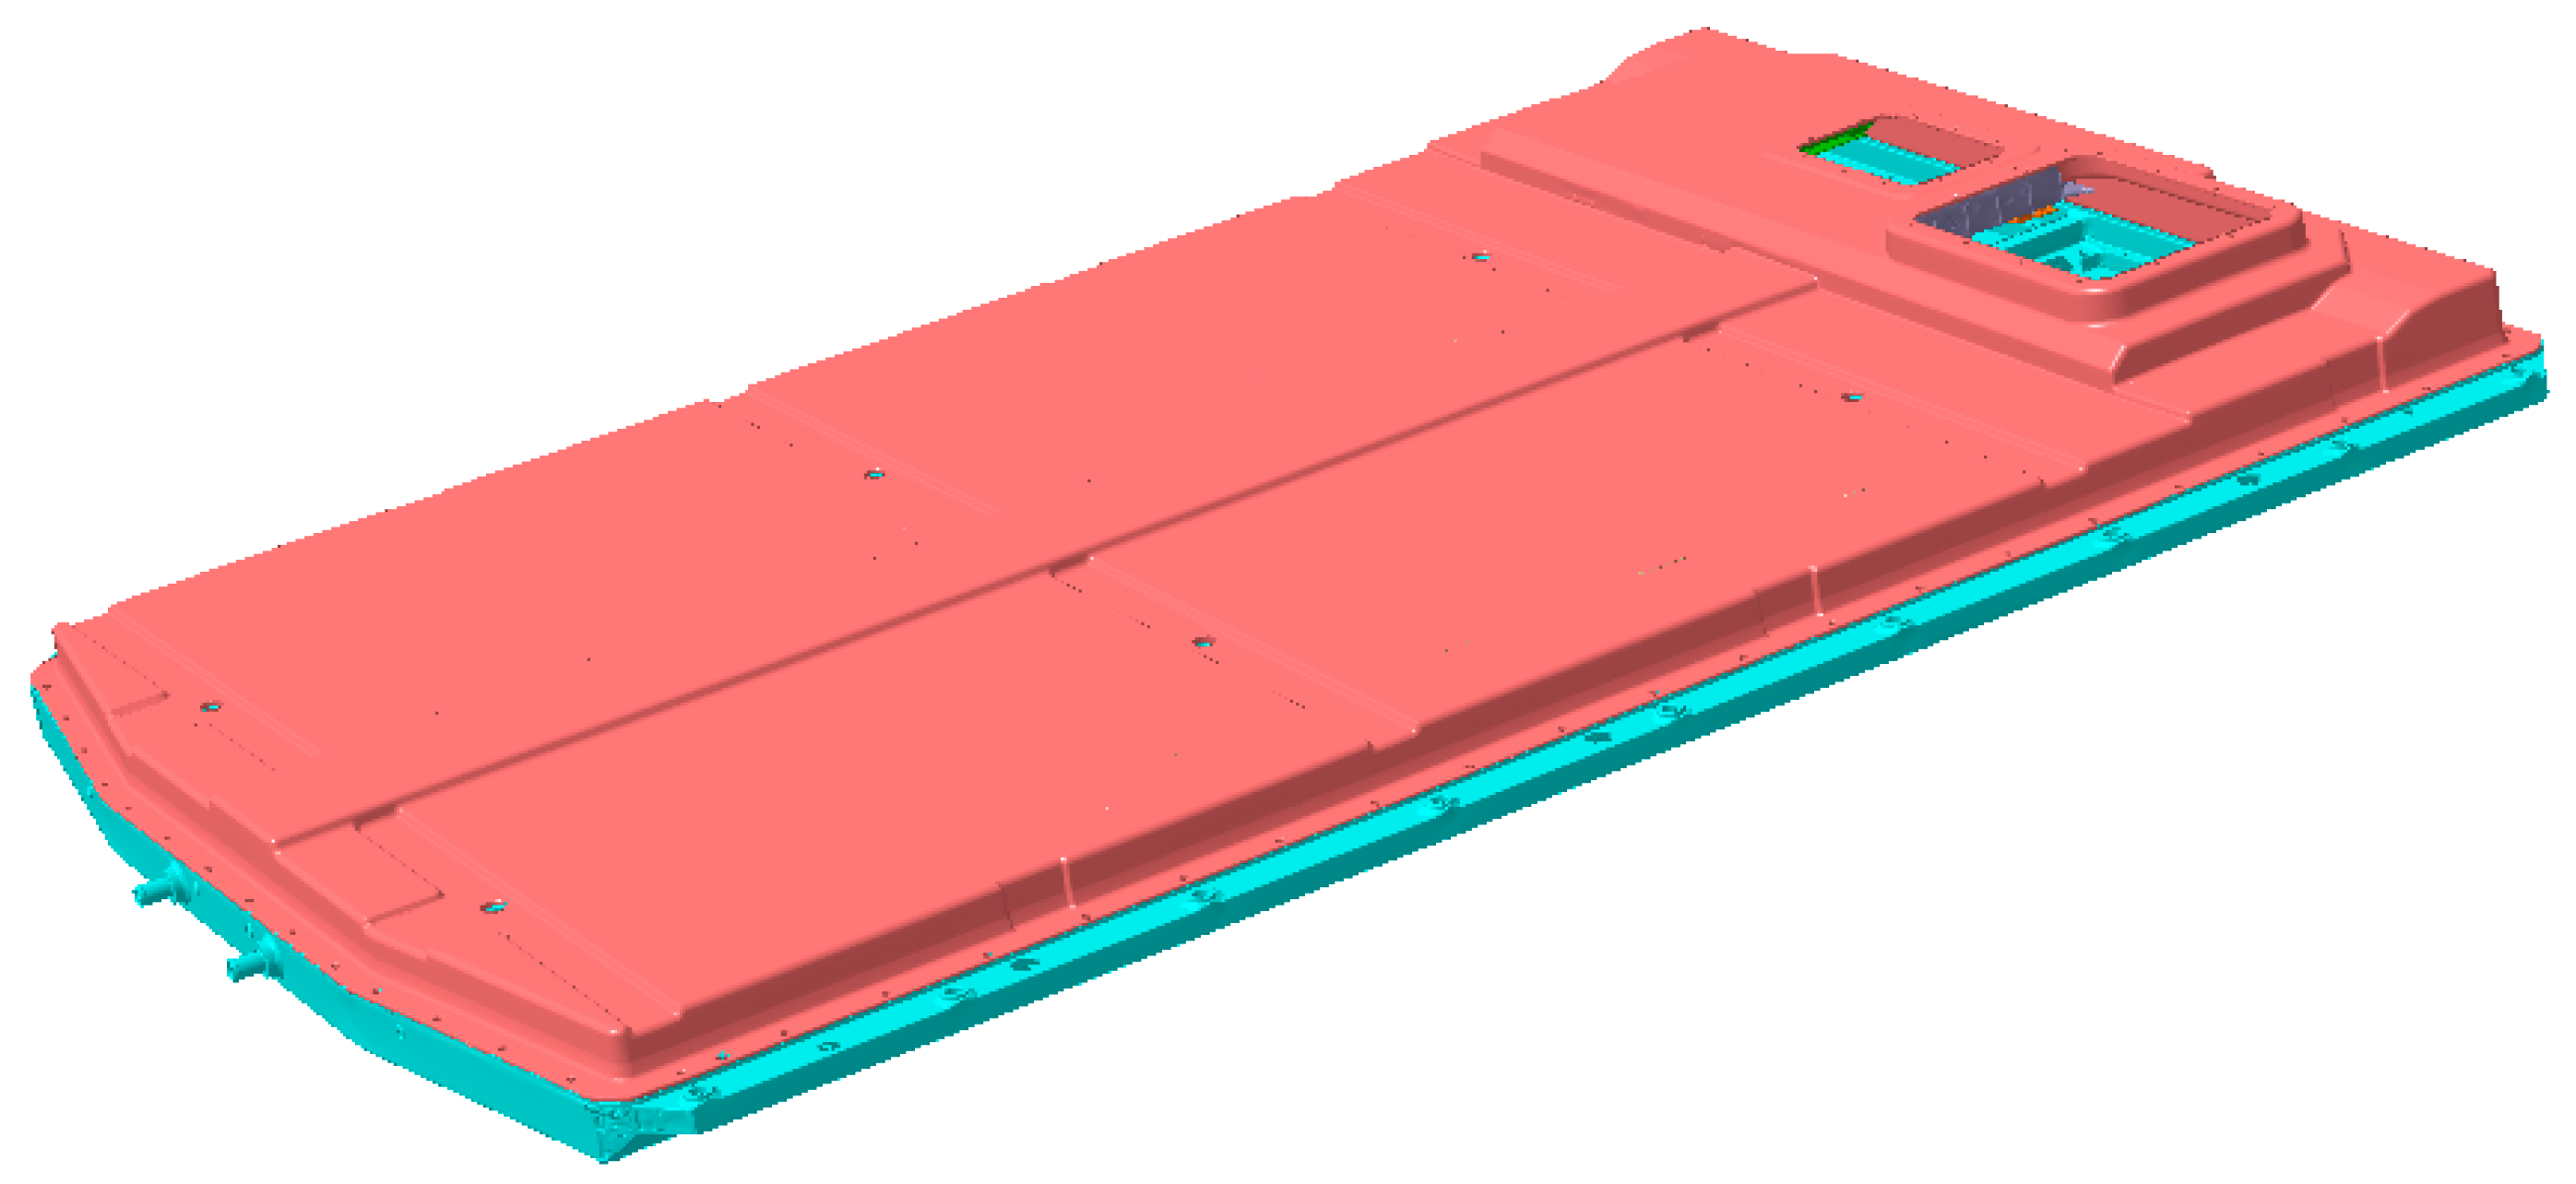
The reference battery pack enclosure (BPE) was modeled in SolidWorks, as shown in Figure 4. To keep explicit analyses computationally manageable, the geometry was simplified: features much smaller than the panel spans—small holes, local fillets, cosmetic texturing—were omitted, because they forced the inclusion of very small elements and an overly restrictive stable time step. All load-carrying and load-introducing regions were retained. The overall dimensions are approximately 2185 × 1600 × 233 mm, as shown in Figure 5.
Material system. The structure was a carbon-fiber–aluminum (CFRP–Al) hybrid. Composite lay-ups and equivalent orthotropic properties, together with the aluminum data, are given in Section 2, which also specifies the unit conventions and sources. Members of the same type shared one property set unless noted otherwise.
Mounting representation. Vehicle attachment was idealized by lug-type mounting tabs placed around the perimeter. These lugs preserve stiffness and load introduction at the correct locations without modeling bracket, rail, and fastener details.
For the optimization study, we varied thickness-type parameters that controlled the lateral load path under side compression, as summarized in Figure 6:
H 1
upper-cover thickness;
H 2
side-wall thickness (one value for both long and short walls);
H 3
lower-cover thickness;
H 4
internal longitudinal spine thickness—a central plate running the full internal length and height;
H 5
internal transverse bulkhead thickness—three plates normal to the long walls, equally spaced, with a common thickness;
H 6
support ledge/strip thickness—a narrow internal ledge with an inner retaining lip for supporting and positioning internal components;
H 7
lower-cover stiffening-rib thickness—rib features on the inner surface of the lower cover (rib count and spacing are fixed in this work).
Figure 6. Initial design variables of the battery pack enclosure.
Wevj 16 00632 g006
Together, H 1 , . . . ,   H 7 parameterized the closed shell (covers + side walls) and the internal skeleton (spine, bulkheads, ledge, ribs). In laminate theory, the bending response is governed by the laminate D-matrix and depends on the thickness and stacking sequences; coordinated changes of H 3 H 7 tuned the mass–stiffness–energy-absorption trade-off, while H 1 H 2 regulated global integrity and boundary restraint. Figure 5 and Figure 6 show the variable locations, thickness definitions, and the idealized lug interfaces.

3.2. Finite Element Model

To investigate the mechanical response under GB 38031-2025 side compression, a high-fidelity finite element model was built from the simplified geometry in Section 3.1 [31]. Geometry was created in SolidWorks, preprocessed in HyperMesh, and analyses were run in LS-DYNA. A consistent mm–ms–kg unit system was used.

3.2.1. Geometry and Simplification

The enclosure was represented as a closed shell (upper cover, side walls, lower cover) with an internal skeleton (one longitudinal spine, three transverse bulkheads, an internal support ledge with a retaining lip, and lower-cover ribs). Minor features that did not affect global crush—small holes, cosmetic filets, small chamfers—were removed to keep the model tractable. This strategy reduced computational cost while maintaining the accuracy required for impact analysis, as shown in prior studies [28]. The lug-type tabs in Figure 5 illustrate the installation but are omitted from the FE mesh: under §8.2.4, the compression load was applied by a platen at manufacturer-identified weak points rather than through lugs; small lug radii would force very fine local elements and reduce the stable time step, and idealized lugs can also introduce artificial stress concentrations and contact locking. Thickness assignments followed H 1 H 7 as defined in Section 3.1.

3.2.2. Mesh Generation and Element Type

Mid-surfaces were meshed with mixed quadrilateral/triangular shell elements; thickness assignments corresponded to H 1 H 7 . Mesh sizing and the convergence rationale are given in Section 2.4.2. Quality constraints were Jacobian > 0.5, aspect ratio ≤ 3, and warpage ≤ 10°. The final discretization contains 152,462 elements and 153,554 nodes.

3.2.3. Contact Modeling and Assembly Constraints

Shell-to-shell ties emulated welded/adhesive seams among the covers, side walls, spine, bulkheads, ledge, and ribs. The platen was rigid, and the enclosure was deformable.

3.2.4. Boundary and Loading Conditions

Here the pack is tested alone.
Platen. Half-cylinder, radius 75 mm, length greater than the pack height but ≤ 1 m.
Direction and location. Side compression at manufacturer-identified weak points.
Speed. Displacement-controlled 2 mm/s.
Stop criterion. Stop at 100 kN force or 30% crush along the compression axis, whichever occurs first.
The response metric L is the peak deformation in the loading direction on the enclosure.

3.3. Finite Element Experiment Scheme

3.3.1. Experimental Design

Compression loading follows Section 3.2 (GB 38031-2025 §8.2.4). Seven thickness variables ( H 1 H 7 ), as defined in Section 3.1 and Figure 6, are varied simultaneously; their bounds are given in Table 3. A single optimal Latin hypercube design (OLHD) was generated in the seven-dimensional space; run order was randomized, inputs were scaled to [0,1], and several center-point replicates were included.
Engineering bounds for each H i are given in Table 3. A single optimal Latin hypercube design (OLHD) in the 7-D space was generated; runs were randomized, inputs were scaled to 0 , 1 , and several center-point replicates were included. Each design point was evaluated under the side compression specified in GB 38031-2025 §8.2.4; the recorded responses were the enclosure mass M and the peak deformation L in the loading direction. The design matrix and FE results for 10 representative designs are reported in Table 4, while the full 64-run design matrix is given in Appendix A, Table A1.
Figure 7 illustrates the representative collision simulation setup used in the analysis.

3.3.2. Surrogate Model Construction

To approximate the FE responses over the seven-dimensional design space of Let x = ( H 1 , . . . , H 7 ), Gaussian process regression (GPR) was used. A GP prior was placed on the response,
y · ~ G P m x · , k θ · , ·
with a constant mean m ( ) = β and an ARD Matérn-5/2 covariance with a nugget term
k θ x , x = σ f 2 1 + 5 r + 5 3 r 2 e x p 5 r + σ n 2 δ x x ,   r = j = 1 7 x j x j 2 l j 2
where θ = σ f , l 1 , . . . , l 7 , l n . Hyperparameters were identified by maximizing the marginal likelihood (multi-start optimization). For a new x , the posterior predictions are as follows:
μ x = k K 1 y ,     s 2 x = k x , x k K 1 k
with K i j = k ( x i , x j ) and ( k ) i = k ( x , x i ) . Independent surrogates were trained for mass M ( x ) and peak deformation L ( x ) using the n = 64 DOE samples; inputs were scaled to [ 0,1 ] during training, and errors reported in Section 3.3.3 use physical units.

3.3.3. Validation and Diagnostics

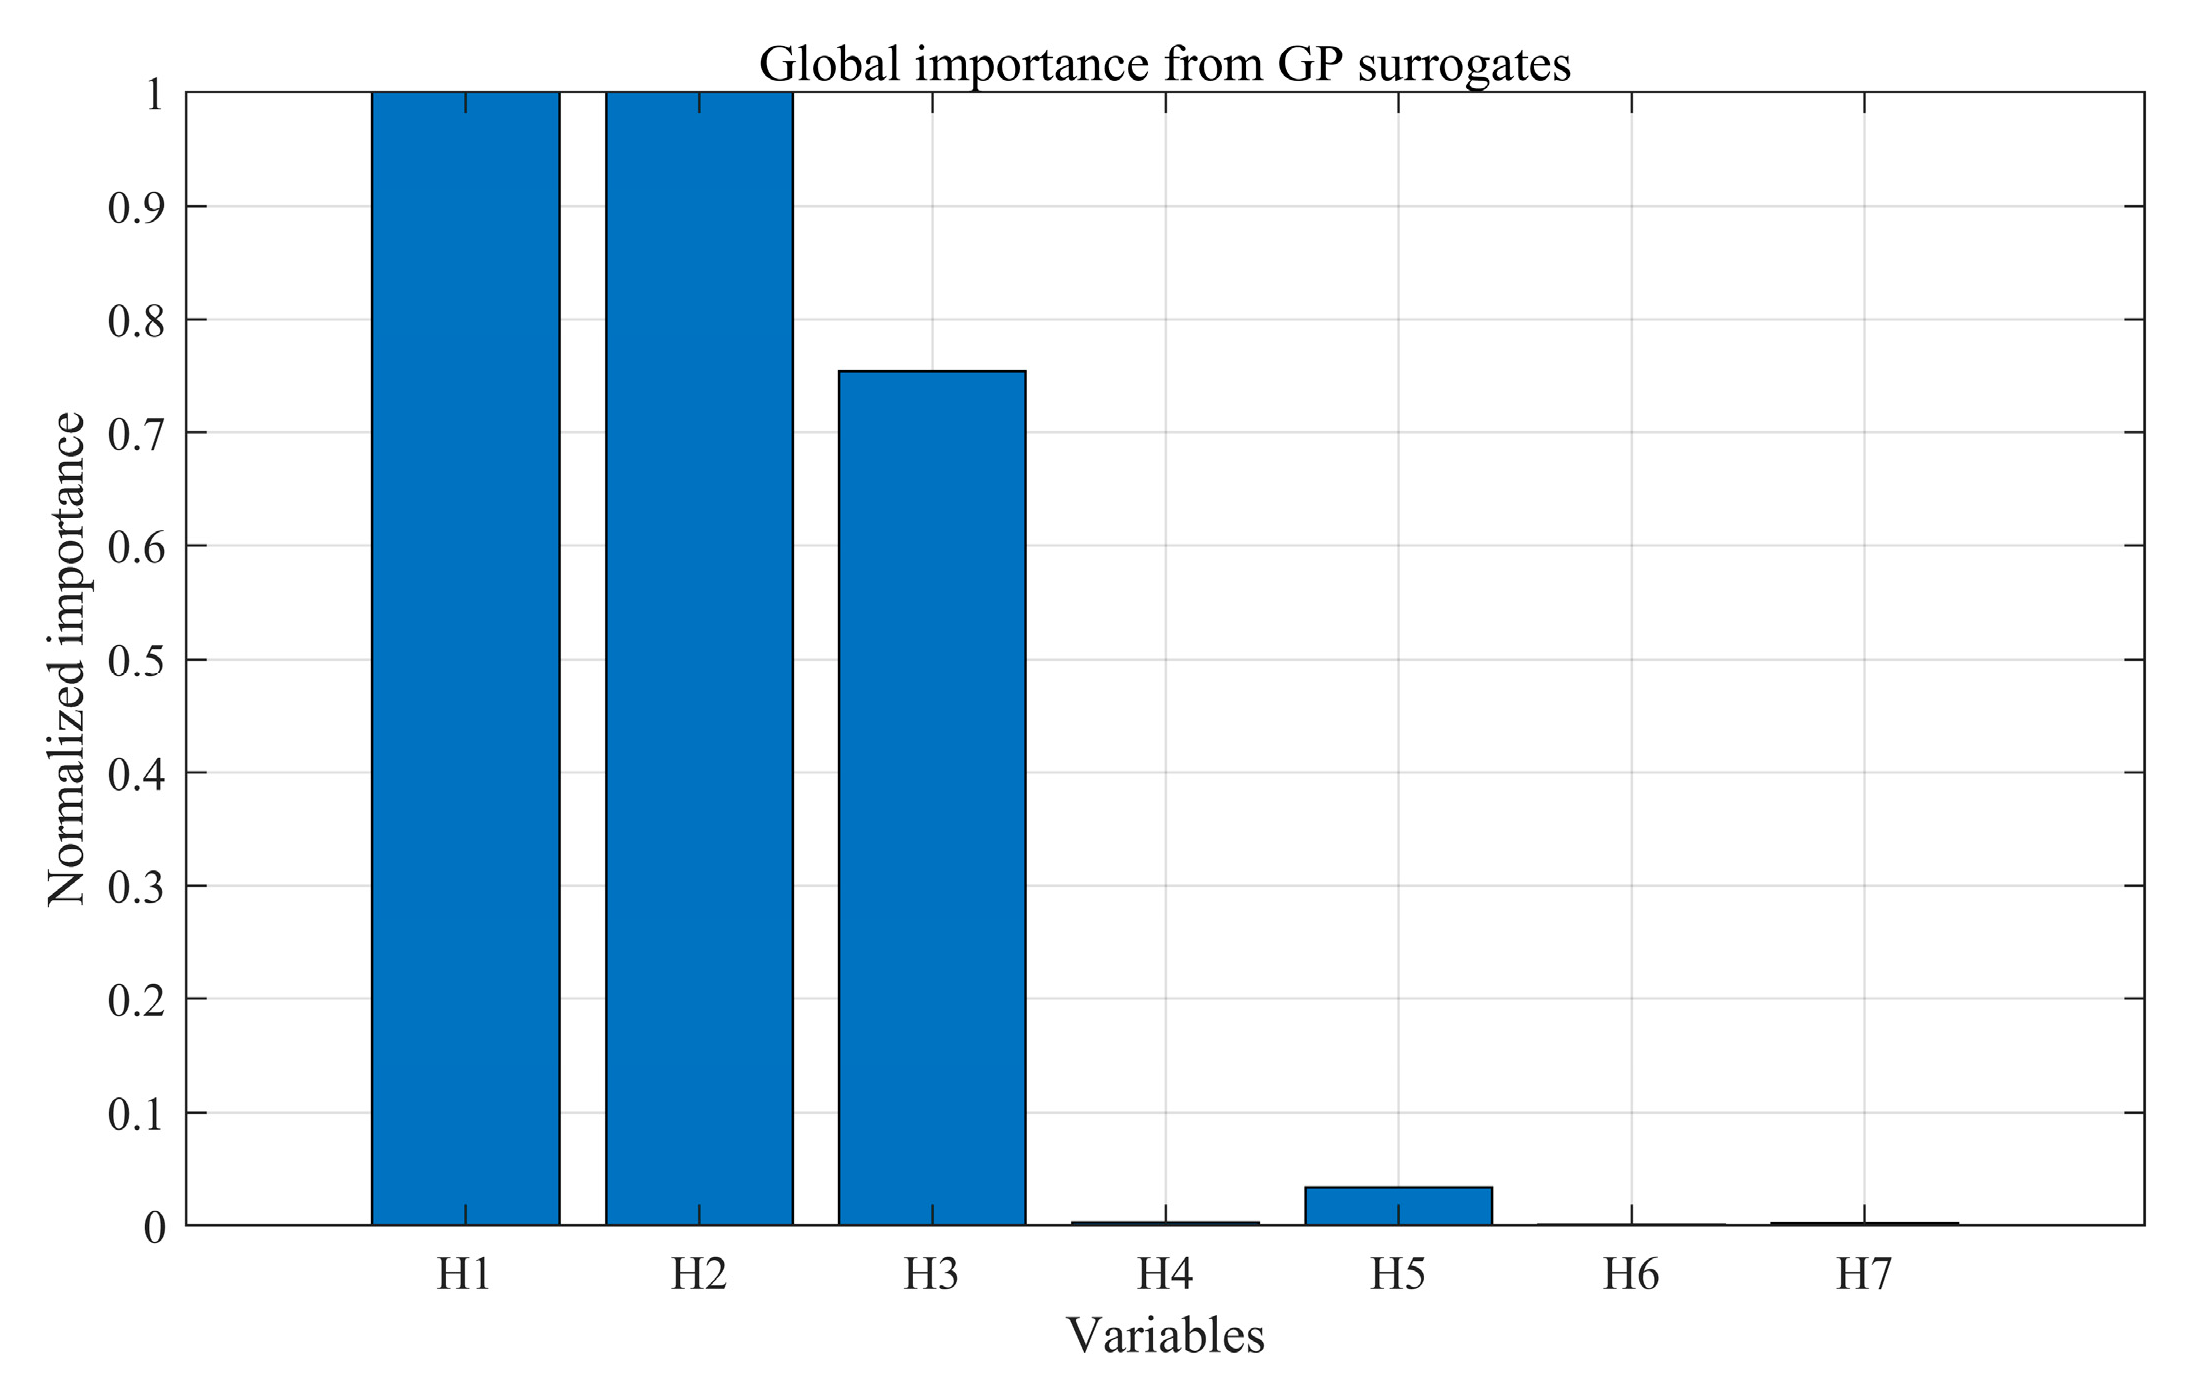
Leave-one-out cross-validation (LOOCV) yields R 2 = 0.977 , NRMSE = 0.036 for the mass surrogate M ( x ) , and R 2 = 0.943 , NRMSE = 0.051 for the deformation surrogate L ( x ) . Kernel hyperparameters ( σ f , σ n , mean function, NLML) are reported in Table 5. ARD length-scales l H j for both surrogates are listed in Table 6; inputs were scaled to [ 0,1 ] , so l H j are dimensionless. A smaller l H j indicates greater sensitivity to H j . An aggregated global-importance bar chart is provided in Appendix A (Figure A1). Residual Q–Q and residual-versus-fit plots show no systematic bias within the sampled range.
The smallest ARD length-scales occur at l H 3 , l H 1 , l H 5 for the mass surrogate and at l H 2 , l H 1 , l H 3 for the deformation surrogate; conversely, l H 6 and l H 7 are on the order of 10 4 10 5 , indicating negligible influence within the sampled domain.

3.3.4. Surrogate Outputs for Optimization

The validated surrogates define
x μ M x ,       μ L x ,       s M x ,       s L x
In Section 4, the baseline objective vector is
f x = μ M x ,   μ L x  
with a robustness-aware variant
f k x = μ M x + k s M x ,   μ L x + k s L x   ,         k 1 ,   2
Design-variable bounds follow Table 3; further constraints and optimization settings are given in Section 4.

3.3.5. Physics-Informed Surrogate and Validation

The mappings x = ( H 1 , , H 7 ) ( M , L ) were approximated by a transparent surrogate that embedded the bending-consistent trends and dominant load paths of the battery pack enclosure. The feature map comprised linear and squared terms, selected thickness-cubed terms ( t 3 ) for shell-like components, and interactions reflecting lateral indentation transfer (e.g., H 3 H 7 ,   H 2 H 3 ). Inputs were min–max scaled to [ 0,1 ] . Coefficients were L2-regularized; remaining smooth nonlinearities were captured by an ARD squared-exponential component. Hyperparameters were determined by marginal-likelihood optimization.
Generalization was assessed by k -fold cross-validation ( k = 5 ) on the DOE ( N = 64 ). For each fold and objective, we reported the MAE, RMSE, R 2 , and the concordance correlation coefficient (CCC). Calibration was examined by observed-vs-predicted plots with 1σ prediction bands (bootstrap). Residual adequacy was checked using Q–Q and scale–location plots; heteroscedasticity was screened by the Breusch–Pagan test.
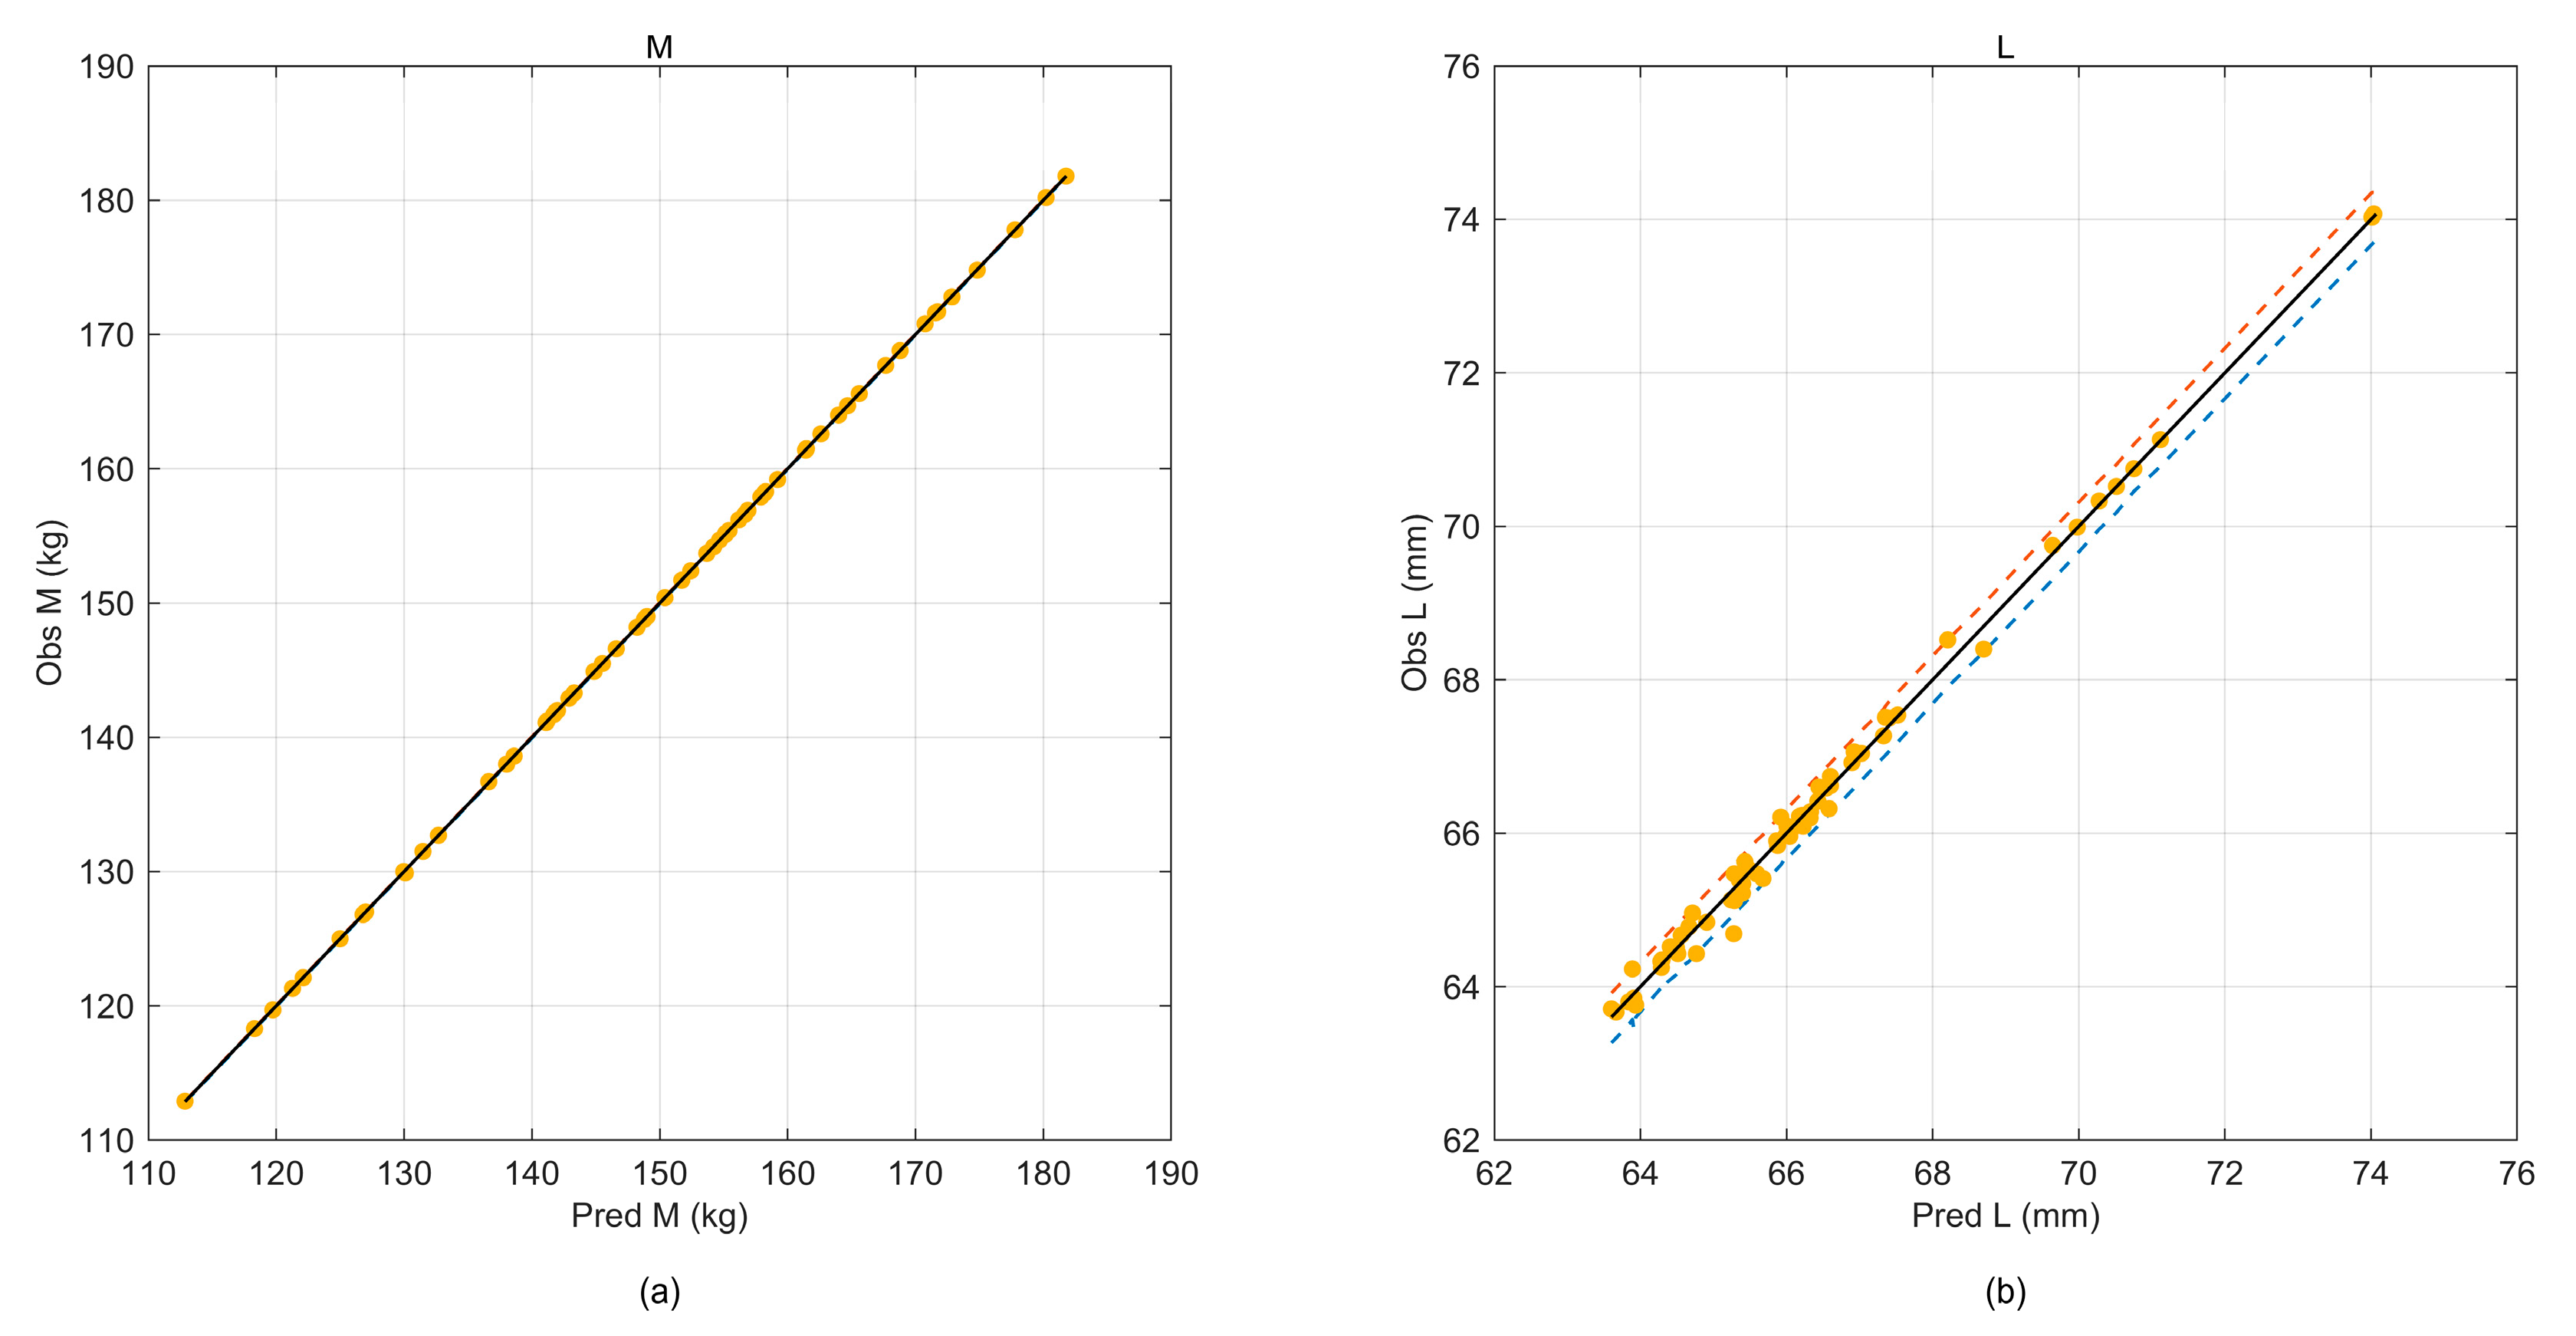
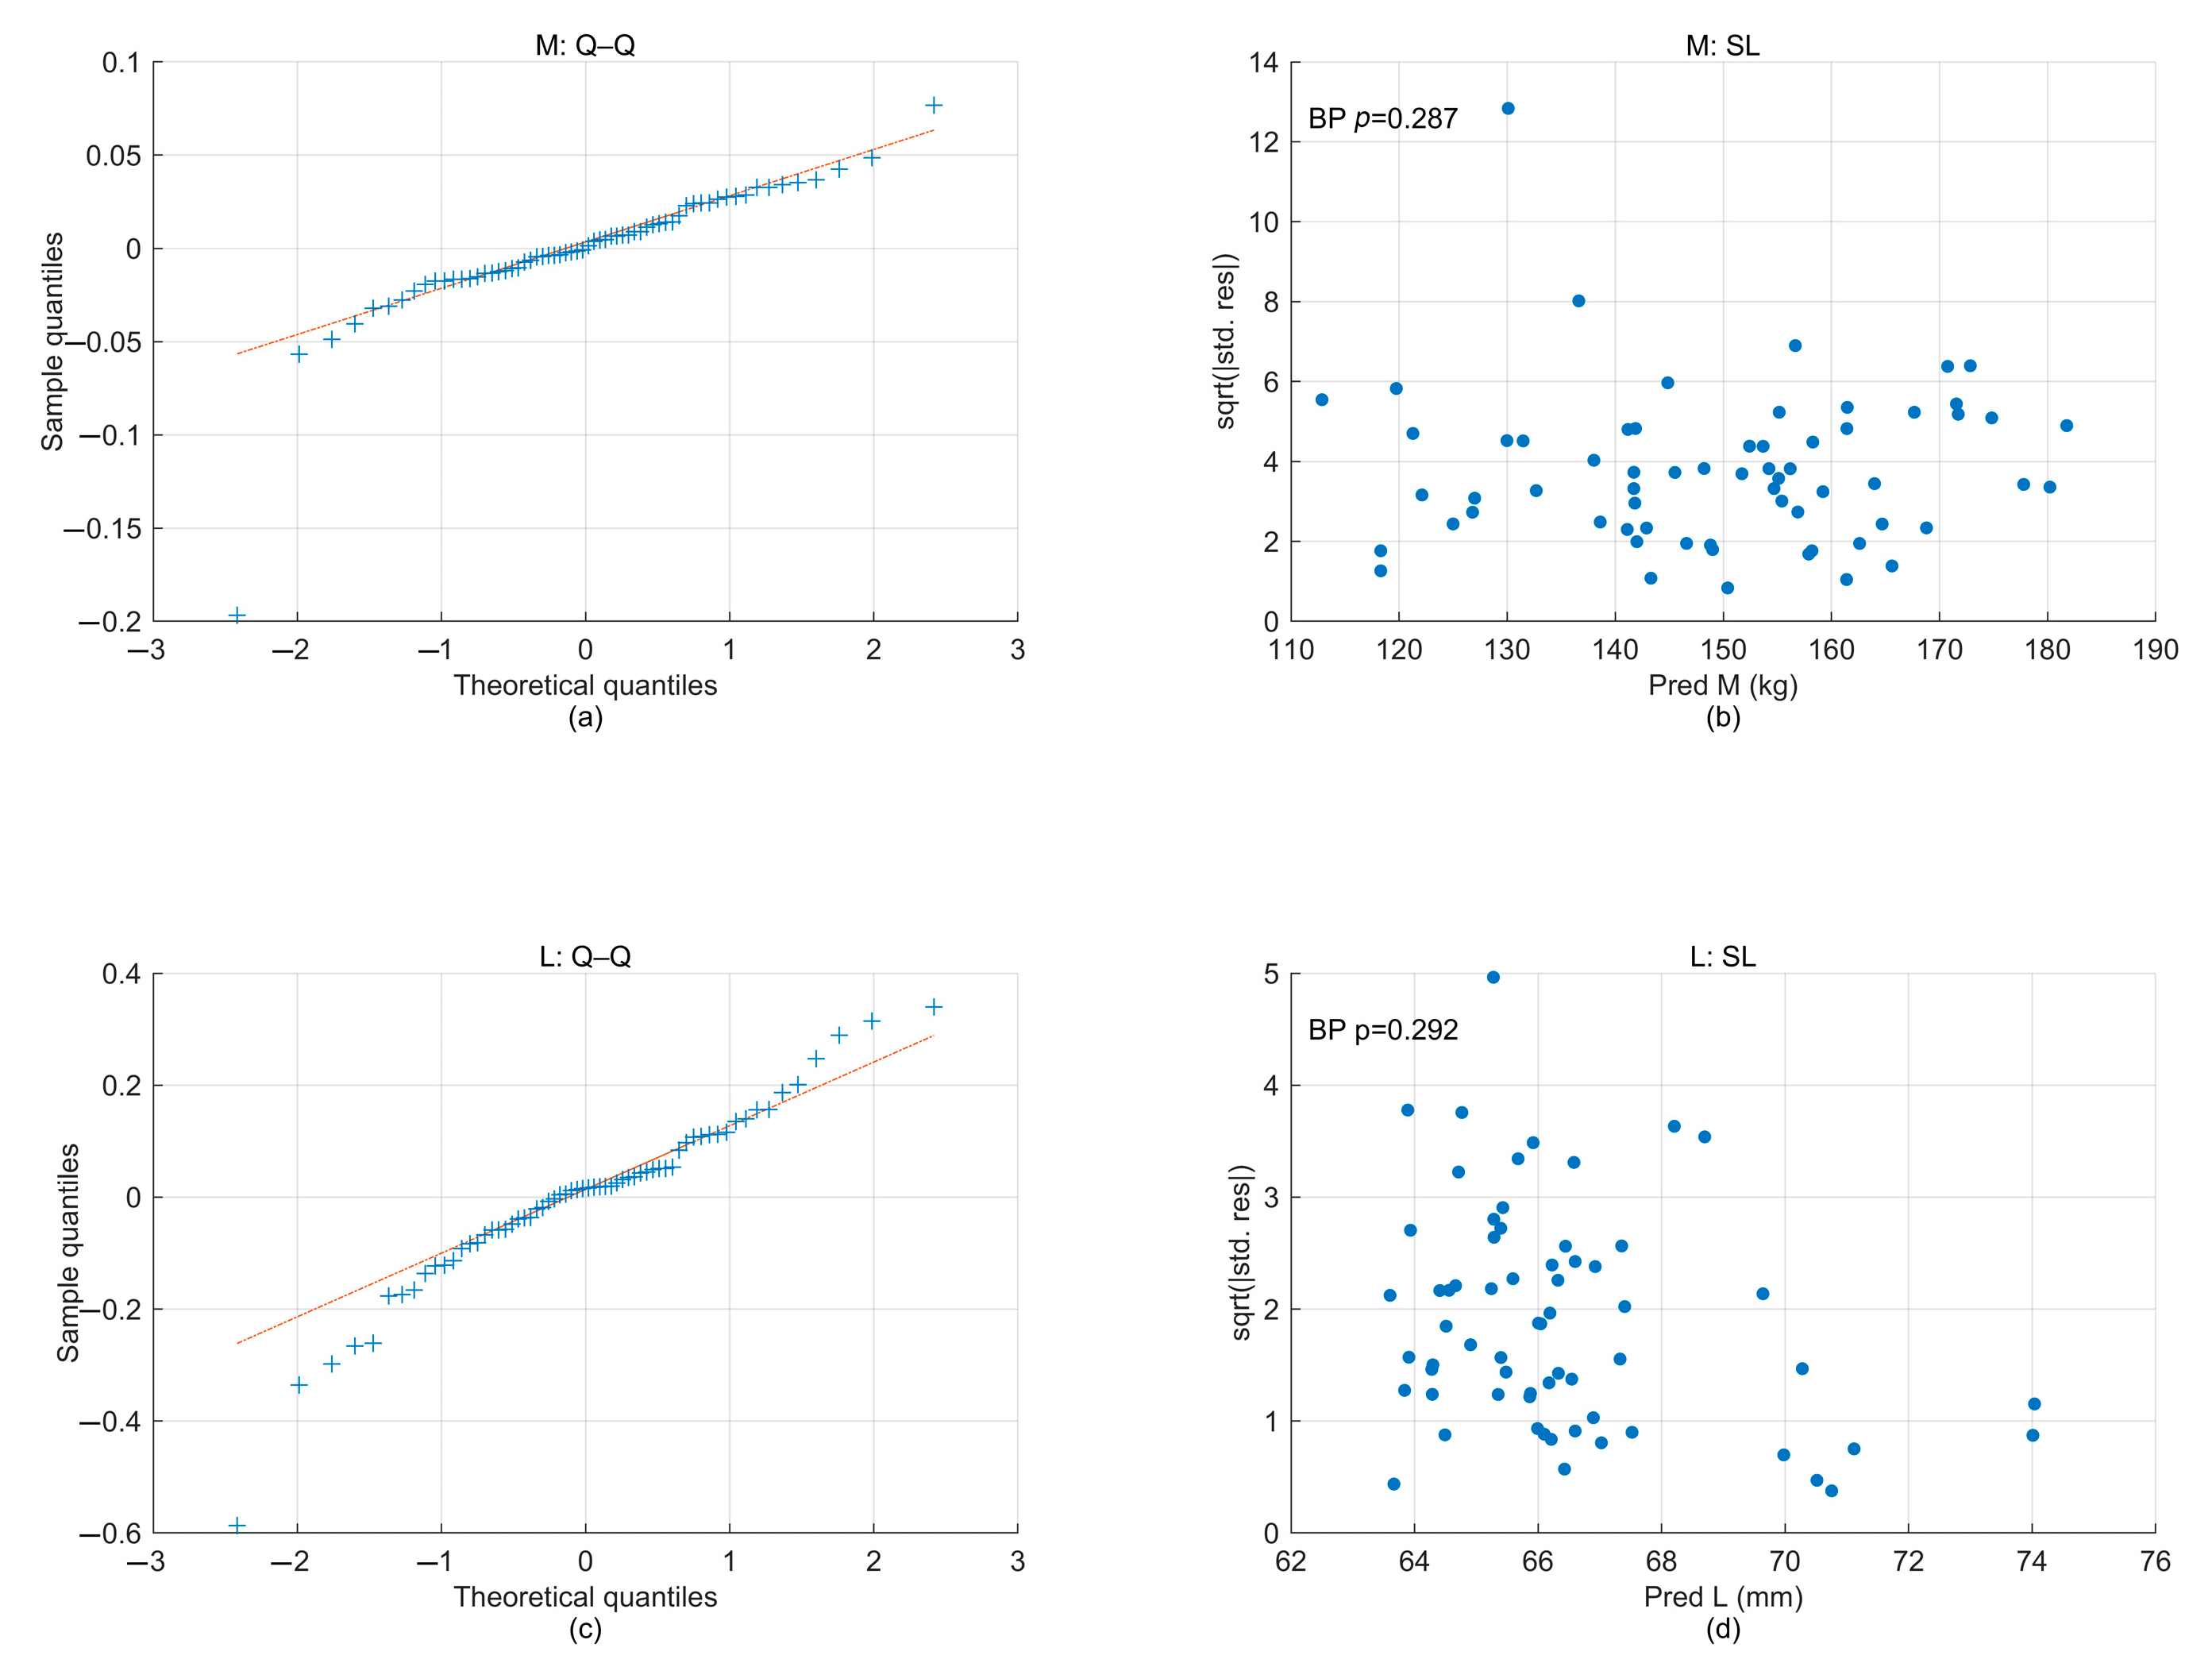
Compared with a plain quadratic surrogate, both Gaussian-process (GP) models provided a much better description of the data. In the baseline mean GPR, a Matérn-5/2 kernel was used; it enforces only moderate smoothness and can follow the small kinks and local curvature induced by contact and geometric nonlinearities in M ( x ) and L ( x ) . In the PI-GPR, a squared-exponential ARD (SE-ARD) kernel is adopted. This kernel was smoother and mainly acted as a regularized background model that captured the remaining slowly varying trends once the dominant bending-type polynomial behavior had been removed. In practical terms, the choice is a balance between flexibility and smoothness: the Matérn-5/2 kernel is better suited to potentially non-smooth response surfaces, whereas the SE-ARD kernel produces a more strongly smoothed view of the same data. For the present 64-run design, the two models yielded very similar cross-validated errors and essentially the same ordering of Pareto solutions (Table 7 and Section 4.5.4). The Matérn-5/2 GP was therefore used for the optimization runs, and the SE-ARD PI-GPR was retained for interpretation and cross-kernel checks, so that the main conclusions did not depend on a single kernel choice. Calibration remained close to linear, with prediction-interval coverage consistent with the nominal 1σ level (Figure 8), and the residuals were well centered, with no clear indications of heteroscedasticity at the sampled design points (Figure 9).
Points cluster around the 45° line; bootstrap-based prediction bands cover the majority of observations for M and L . Here, orange dots mark the FE sample points, and the coloured dashed curves represent the fitted surrogate together with its 95% prediction bands.
Q–Q plots are near-linear and scale–location plots show no pattern; Breusch–Pagan p -values indicate no material heteroscedasticity. In the Q–Q and scale–location panels, crosses represent the standardized residuals, while the straight reference lines and smooth curves indicate the expected normal trend and the fitted spread of the residuals.
Compared with the quadratic baseline, the physics-informed surrogate attains equal or lower MAE/RMSE and higher R 2 /CCC, with the most pronounced gains for L ; prediction-interval coverage is close to the nominal level.
Calibration aligns with the 45° line for both objectives, with adequate 95% prediction-interval coverage (Figure 8). Residuals are centered; scale–location plots show no systematic trend, and Breusch–Pagan tests are not significant at α = 0.05 (Figure 9). Cross-validated metrics are summarized in Table 7.

4. Multi-Objective Optimization

4.1. Problem and Test Conditions

The battery pack enclosure (BPE) was optimized under the side-pole impact condition (GB 38031-2025 §8.2.4). Let x = ( H 1 , , H 7 ) denote the thickness vector of the battery pack enclosure (upper cover, side walls, lower cover, longitudinal spine, transverse bulkheads, support ledge, lower-cover ribs). The feasible set X is defined by the engineering bounds in Table 3 and two manufacturability rules: a thickness grid step Δ t and an adjacent-panel transition limit H i H k   Δ t m a x . Candidates are projected onto X after each variation step.
Objectives and baseline surrogate. Optimization is conducted on the baseline mean-GPR with ARD Matérn-5/2 kernels trained on the 64-run OLHD dataset (Section 3), i.e.,
m i n   f x x X = μ M x ,   μ L x
A robustness-aware score is considered post hoc:
f k ( x ) = ( μ M ( x ) + k s M ( x ) ,   μ L ( x ) + k s L ( x ) ) , k { 1,2 }
where μ ( ) and s ( ) denote the predictive mean and standard deviation. Equation (13) is not used to drive the search; it is used to re-score the non-dominated set in the model-dependence check (Section 4.5).
Cross-model diagnostic. Consistent with Section 3.3.5, the physics-informed semiparametric surrogate (PI-sGPR)—which embeds t 3 trends and targeted interactions with a SE-ARD GP residual—is retained for interpretability and cross-model checks only; optimization uses the baseline mean GPR in Equation (12).

4.2. Data and Surrogate Modeling

Two independent ARD Matérn-5/2 Gaussian-process surrogates approximated M ( x ) and L ( x ) . Hyperparameters were estimated by multi-start marginal-likelihood maximization with standardized inputs and a constant mean. To temper over-confidence, the predictive variance was inflated as
s ~ 2 = s 2 + σ C V 2
Model diagnostics—cross-validated accuracy (5-fold CV on the 64-run OLHD dataset), calibration, residual checks, and Breusch–Pagan tests—are provided in Section 3.3.4 and Section 3.3.5 (Figure 8 and Figure 9; Table 7).

4.3. NSGA-II: Algorithm and Settings

NSGA-II was used with population size N = 100 and G = 200 generations. Crossover is simulated binary (SBX; η c = 10 ); mutation is polynomial ( η m = 20 ,   p m = 1 / d ). The initial population was generated by Latin-hypercube sampling within the design bounds. After each variation step, individuals were projected onto X to satisfy manufacturability rules (thickness grid Δ t ; adjacent-panel transition H i H k Δ t m a x ). Each candidate x was evaluated by the surrogates to obtain μ M ( x ) and μ L ( x ) . Ranking followed standard fast non-dominated sorting with respect to ( μ M , μ L ) . Diversity was maintained by the objective-space crowding distance. These are implementation choices intended to improve stability and reproducibility while remaining within the canonical NSGA-II framework. Table 8 summarizes the key settings; in particular, the line “Objectives for ranking” should read:
Objectives for ranking: μ M ( x ) , μ L ( x ) (mean-GPR, Matérn-5/2 (ARD)).

4.4. Performance Evaluation and Results

All runs follow the NSGA-II configuration in Section 4.3. To assess stability, the optimizer was executed for ⟨R⟩ independent random seeds. To eliminate scale effects, all indicators (HV, IGD, GD) were computed in a normalized objective space obtained by min–max scaling of M and L using the pooled outcomes across all runs. The HV reference point in the normalized space is
r = ( 1 + ε , 1 + ε ) , ε = 10 3
Figure 10 reports the normalized HV progression (mean across seeds with 95% bootstrap confidence intervals, B = 2000 ) over G = 1 200 . HV rises rapidly during the early generations and then plateaus by the mid-to-late stage, indicating consistent convergence. Final indicators at G = 200 are summarized in Table 9 as mean ± SD with 95% bootstrap confidence intervals. Dispersion across seeds is small for all metrics, and the non-dominated sets are well distributed along the ( M , L ) front without boundary crowding.
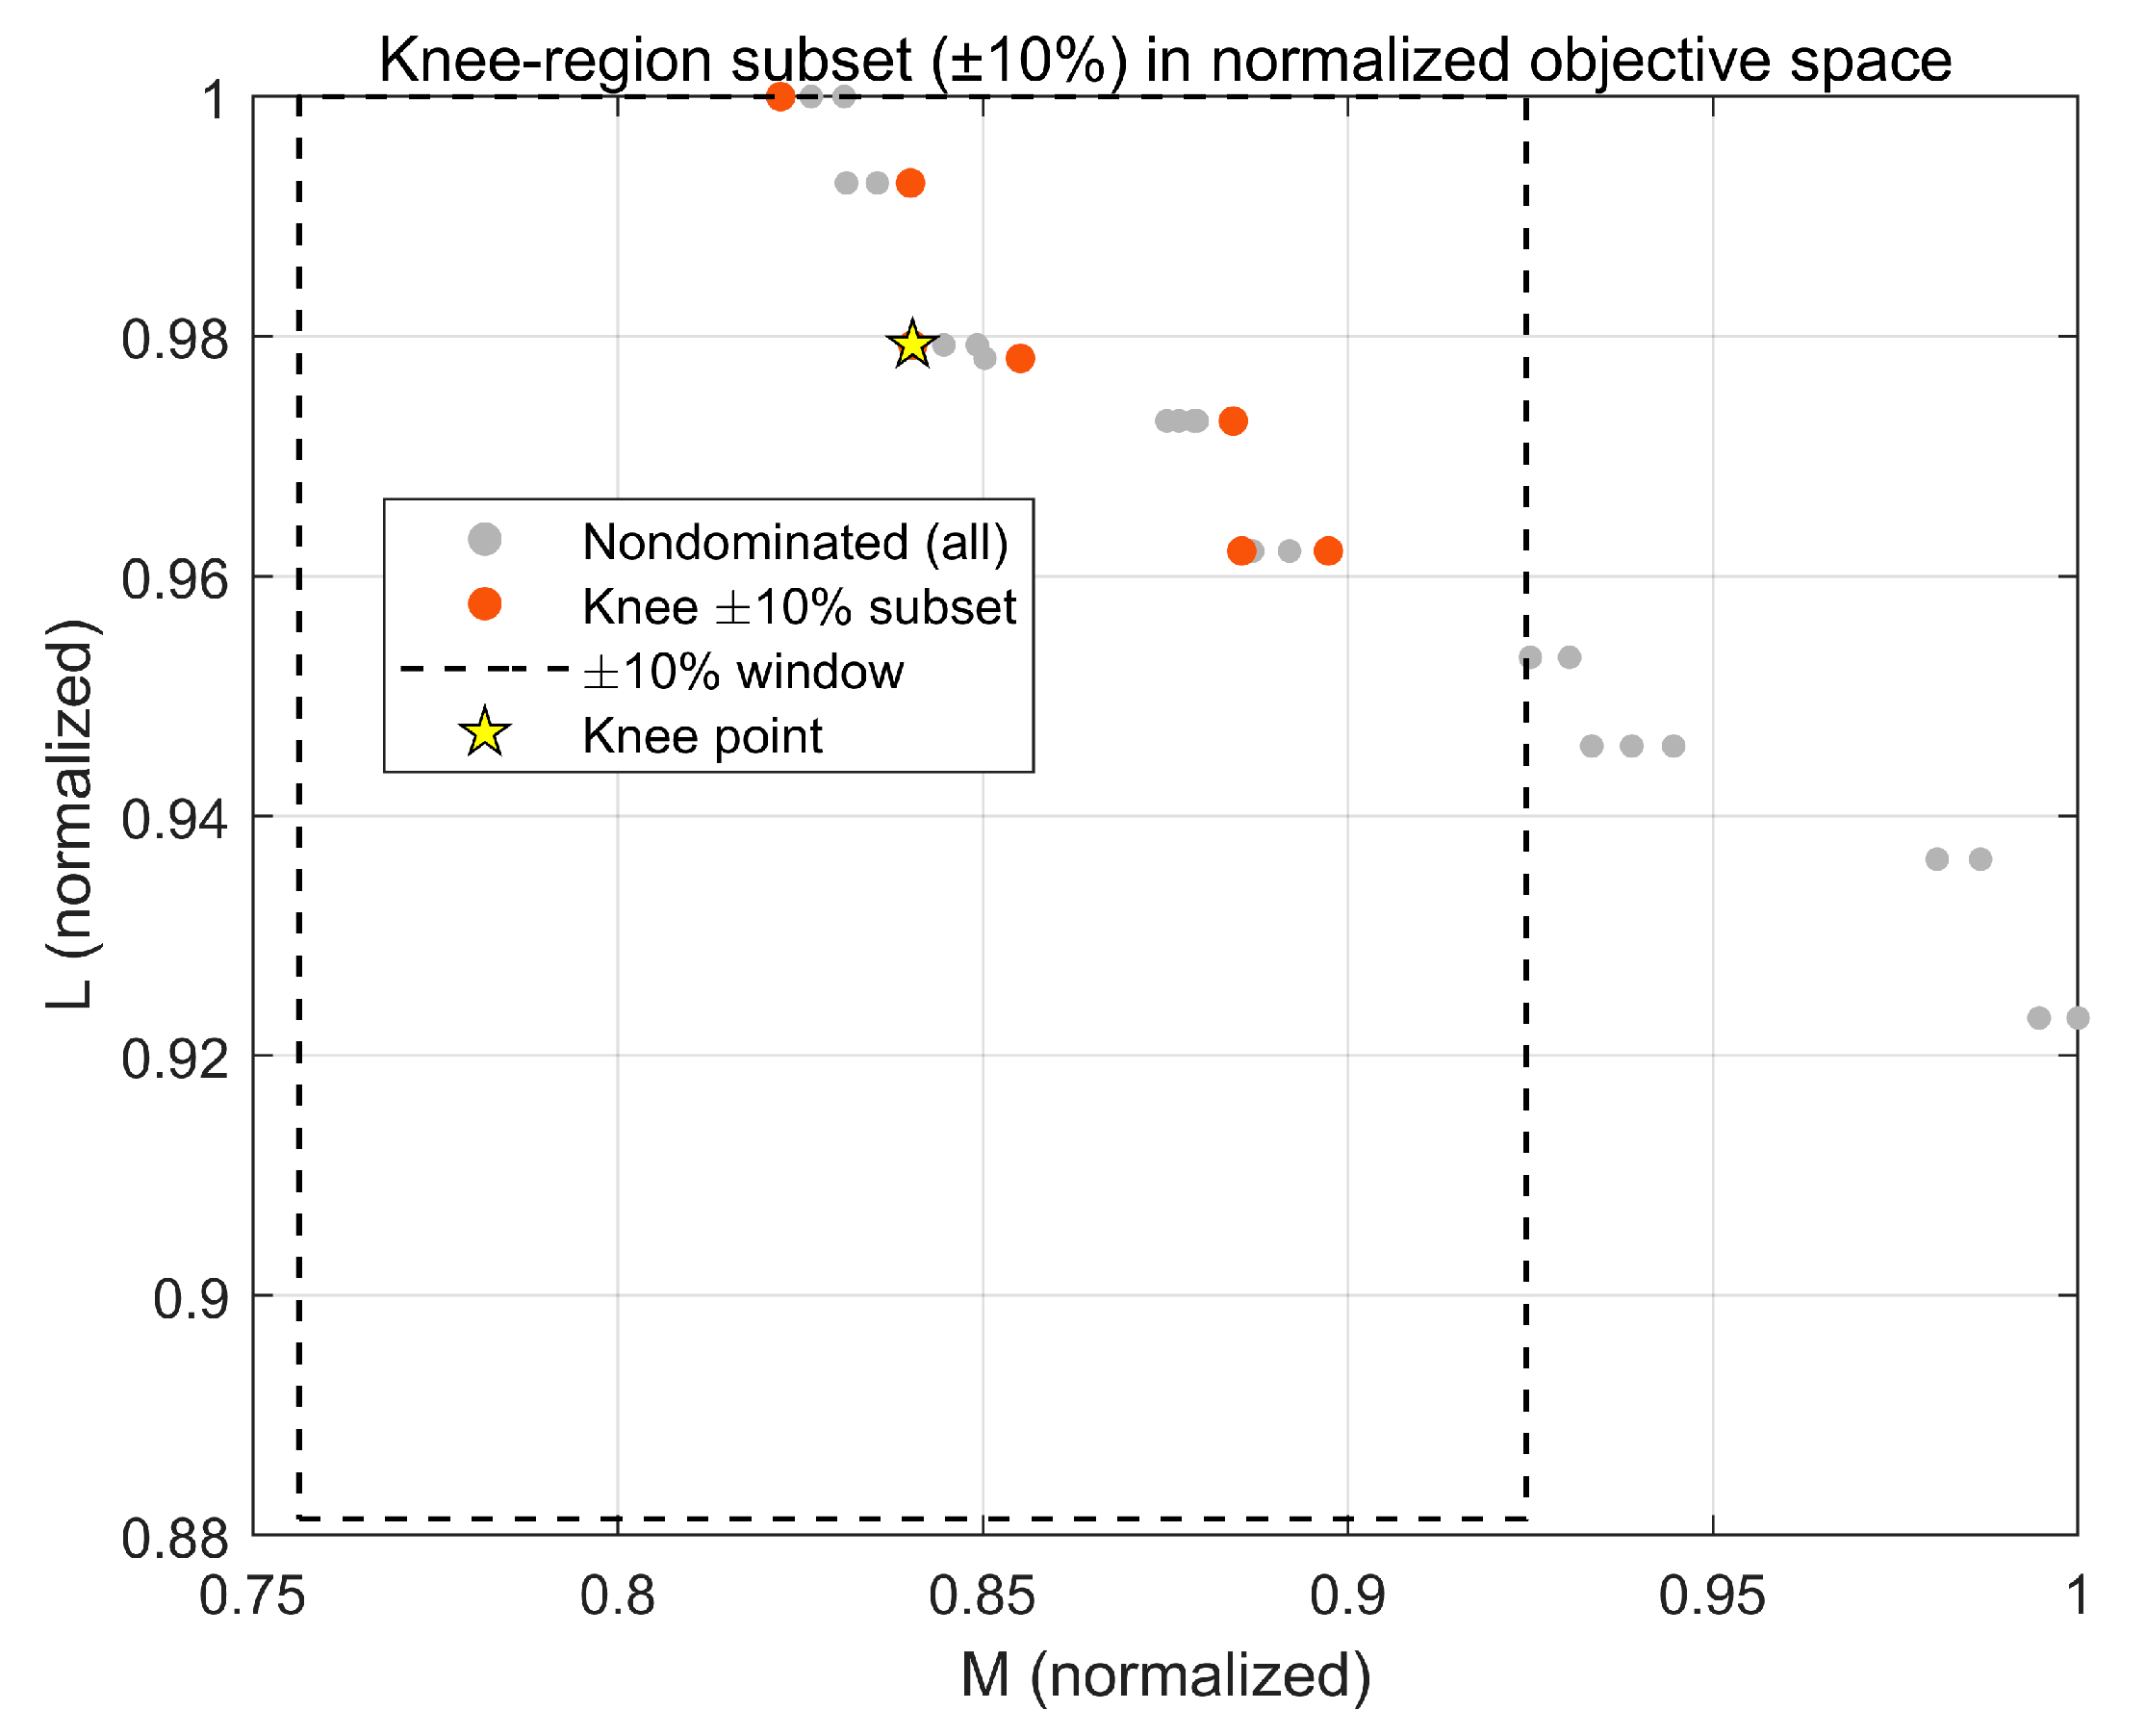
For decision making, a diversity-preserving subset is retained by taking a ±10% window around the knee region in the normalized ( M , L ) space, which avoids near-duplicates and supports the TOPSIS procedure in Section 4.5.

4.5. Decision Making and Robustness

4.5.1. Diversity-Preserving Candidate Set

All decisions were made in the normalized objective space defined in Section 4.4. Let P denote the pooled nondominated set formed by the final generation of each seed. The knee point z knee was identified by the closest-to-utopia criterion in the normalized ( M , L ) plane. A ±10% rectangular window centered at z knee was then applied to both objectives, and near-duplicates were removed by enforcing a minimum pairwise spacing of 0.01 in the normalized space. After projecting thicknesses onto the manufacturability grid Δ t = 0.5 m m , the final candidate set was S 2 = 2 . The geometry of the selection is illustrated in Figure 11; the individual designs are listed in Table 10.
In Table 10, both retained designs exhibit the same predicted deformation L 63.19 m m (normalized L n o r m 0.221 ), while differing in mass. Candidate ID 1 has M = 115.88   k g ( M n o r m = 0.445 ) ; candidate ID 2 has M = 116.46 k g ( M n o r m = 0.471 ) .

4.5.2. TOPSIS Ranking

TOPSIS is applied to S 2 with equal weights,
w = ( w M , w L ) = ( 0.5,0.5 )
Let z + = ( M m i n , L m i n ) and z = ( M m a x , L m a x ) denote the ideal and negative-ideal points in the normalized space. For any x S 2 ,
D + ( x ) = w ( z + z ( x ) ) 2 , D ( x ) = w ( z ( x ) z ) 2 , C ( x ) = D ( x ) D + ( x ) + D ( x )
Candidates were ranked by C in descending order. Consistent with Table 10, ID 1 attained the highest closeness C = 0.658 (Rank = 1), followed by ID 2 with C = 0.644 (Rank = 2). Because L is identical across the two designs, the ordering is mass-driven (ID 1 is lighter by 0.586 kg).

4.5.3. Post Hoc Uncertainty Penalization (Equation (13))

Sensitivity to predictive uncertainty is examined by re-scoring S 2 using Equation (13) with variance-inflated standard deviations s ~ M ,     s ~ L defined in Equation (14). For each k , objectives are re-normalized and TOPSIS is re-applied. Table 11 (a) shows that the ranking is invariant under k = 1 ,   2 (median Δ r a n k = 0 , max Δ r a n k = 0 ), and the TOPSIS winner remains ID 1 (selection frequency = 2/2).

4.5.4. Model-Dependency Audit

Model dependence was probed by replacing the Matérn-5/2 (ARD) baseline with a squared-exponential ARD GP (SE-ARD), while keeping the normalization and TOPSIS protocol identical. Table 11 (d) reports Kendall’s τ = 1.00 for both the full set and the top subset, indicating identical orderings between the two surrogate families (knee-point shift = 24.87% of the unit-diagonal length in the normalized ( M , L ) plane).

4.5.5. Weight Sensitivity

Preference sensitivity is assessed over ω { ( 0.3,0.7 ) , ( 0.5,0.5 ) , ( 0.7,0.3 ) } . As summarized in Table 11 (b, c), the same design (ID 1) remains top-ranked for all weights (selection frequency = 3/3), and the shortlist membership is unchanged relative to the baseline in each case (Jaccard similarity = 1.00).

4.5.6. Final Selection and Verification Hand-Off

Based on the above analyses, the representative optimum x (ID 1) and one diverse companion (ID 2) are retained for verification. Section 5 conducts independent finite-element reruns and checks compliance with GB 38031-2025 §8.2.4 (side-pole impact), followed by a before/after comparison against the baseline design.
Table 11 consolidates the decision-robustness checks. Panel (a) shows post hoc uncertainty penalization with variance-inflated scores (Equation (14); k { 1,2 } ): the ranking is invariant, with median and maximum Δ rank equal to zero for all candidates, and the TOPSIS winner x unchanged across k (selection frequency 2/2). Panel (b) probes weight sensitivity over w { ( 0.3,0.7 ) , ( 0.5,0.5 ) , ( 0.7,0.3 ) } ; the same design (ID 1) remains top-ranked under all weights. Panel (c) summarizes frequencies and overlap: x is selected in all three weight settings (3/3), and the Top-3 sets are identical to the baseline in each case (Jaccard similarity = 1.00). Panel (d) audits model dependence by replacing the Matérn-5/2 (ARD) baseline with an SE-ARD GP; Kendall’s τ equals 1.00 for both the full set and the Top-10, indicating identical ordinal rankings, while the knee point shifts by 24.9% of the unit-diagonal length in the normalized ( M , L ) plane. Overall, the choice of x is insensitive to uncertainty inflation, reasonable preference shifts, and the surrogate family used for scoring.
Notation: τ denotes Kendall’s rank correlation; “knee shift (%)” is measured relative to the unit-diagonal length in the normalized ( M , L ) space.

5. Results and Validation

5.1. Verification Setup and Acceptance Criteria

Independent finite-element reruns were performed for the representative optimum x (Table 12, ID 1) and one companion (Table 12, ID 2). The side-pole configuration was used; thickness vectors were taken from Table 12 and constrained by the manufacturability grid Δ t = 0.5 m m . Modeling and numerical settings (mesh, element type, contact and friction, time integration) were the same as before; no mass scaling was applied. The performance metric was the peak deformation L , extracted with the same post-processing definition. Compliance was assessed against GB 38031-2025 §8.2.4.

5.2. Independent FE Reruns (Aluminum Baseline)

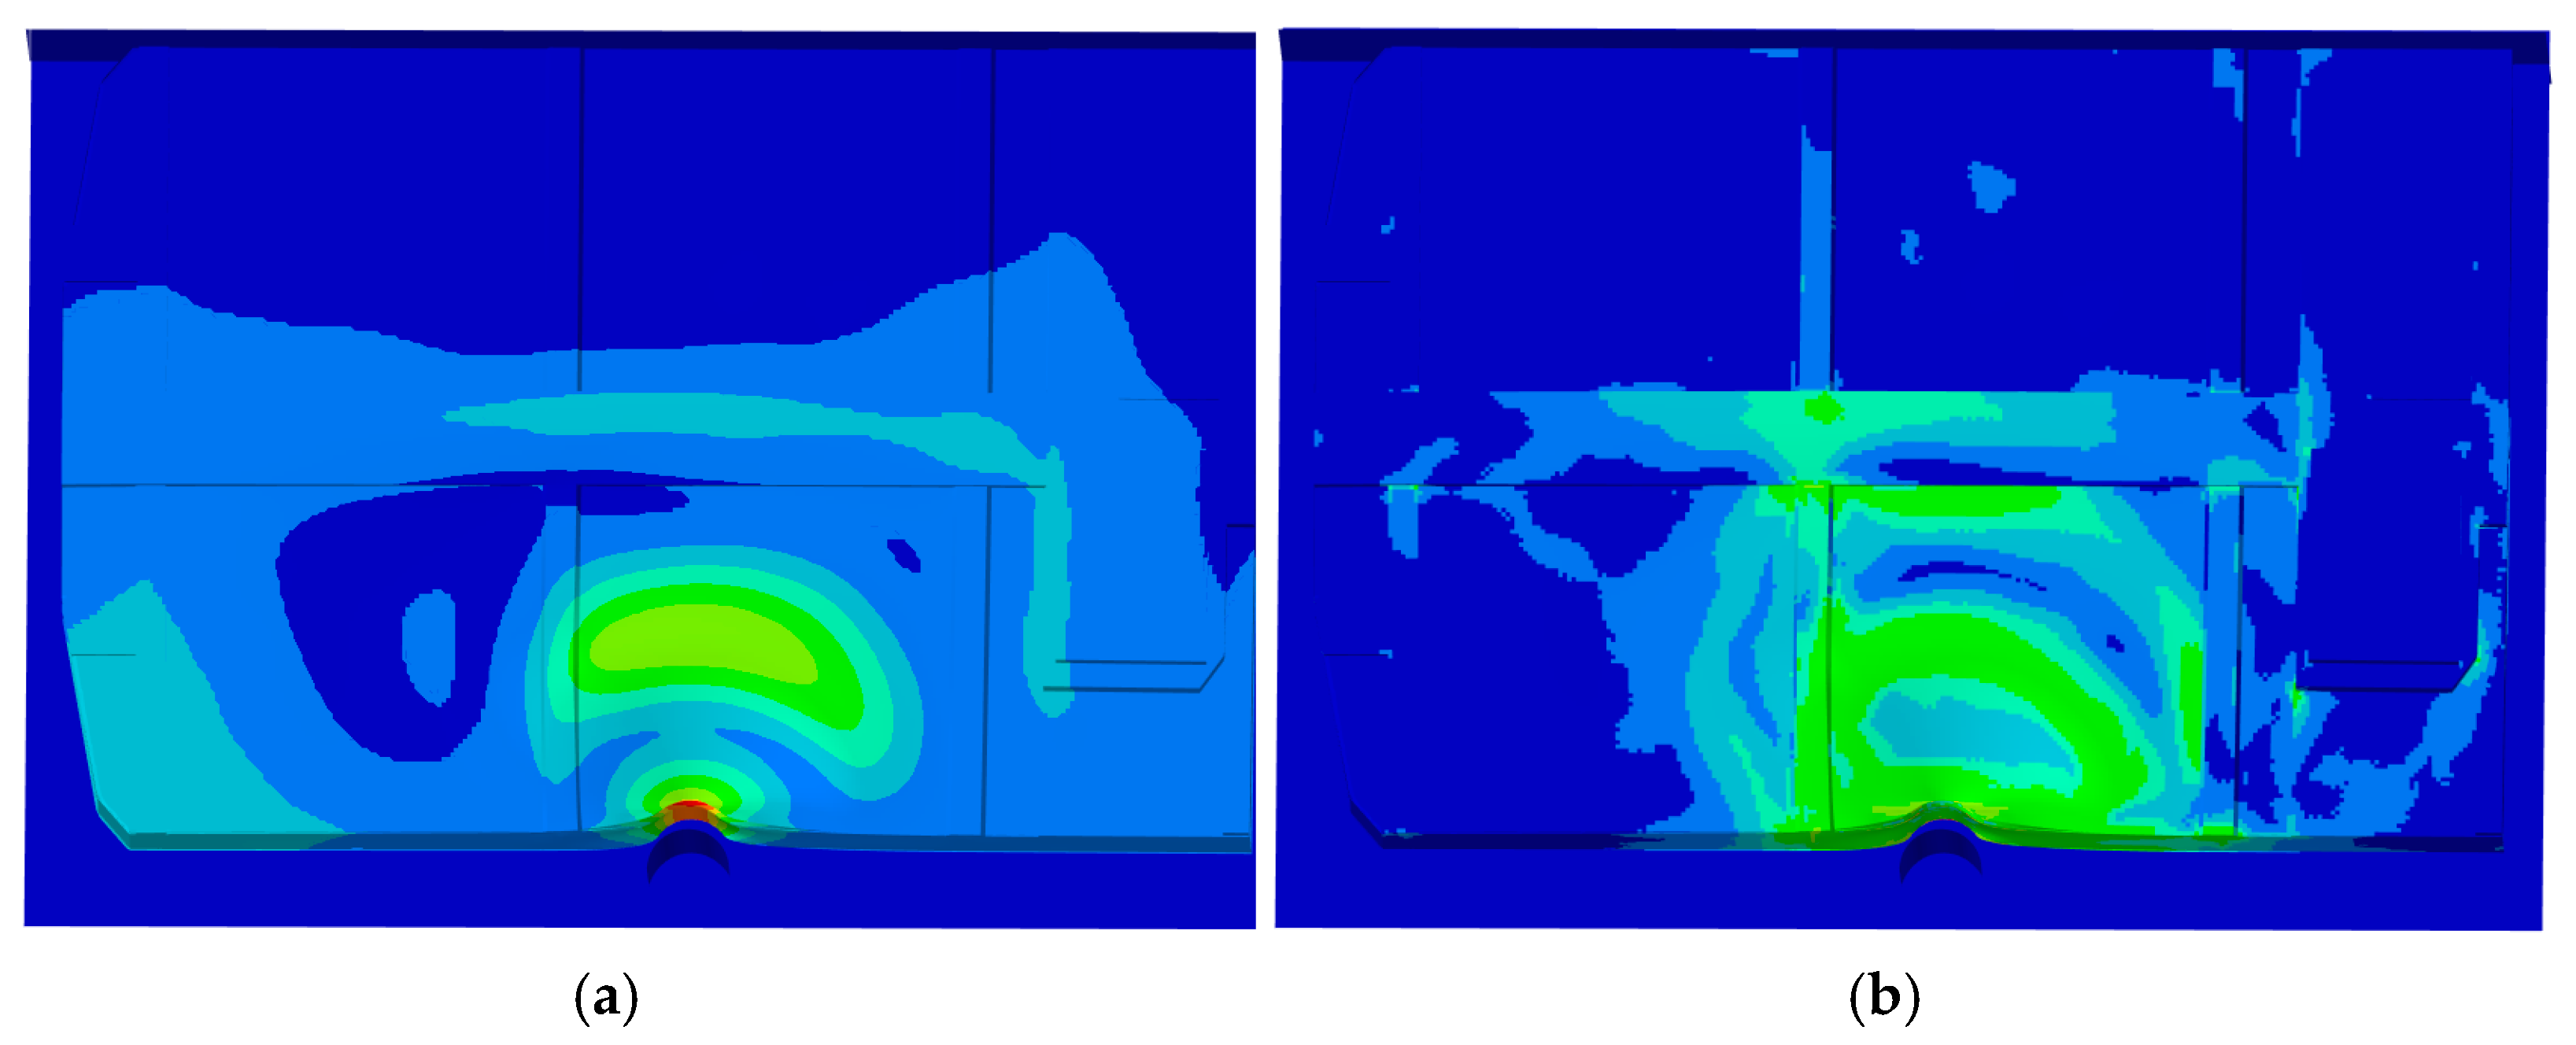
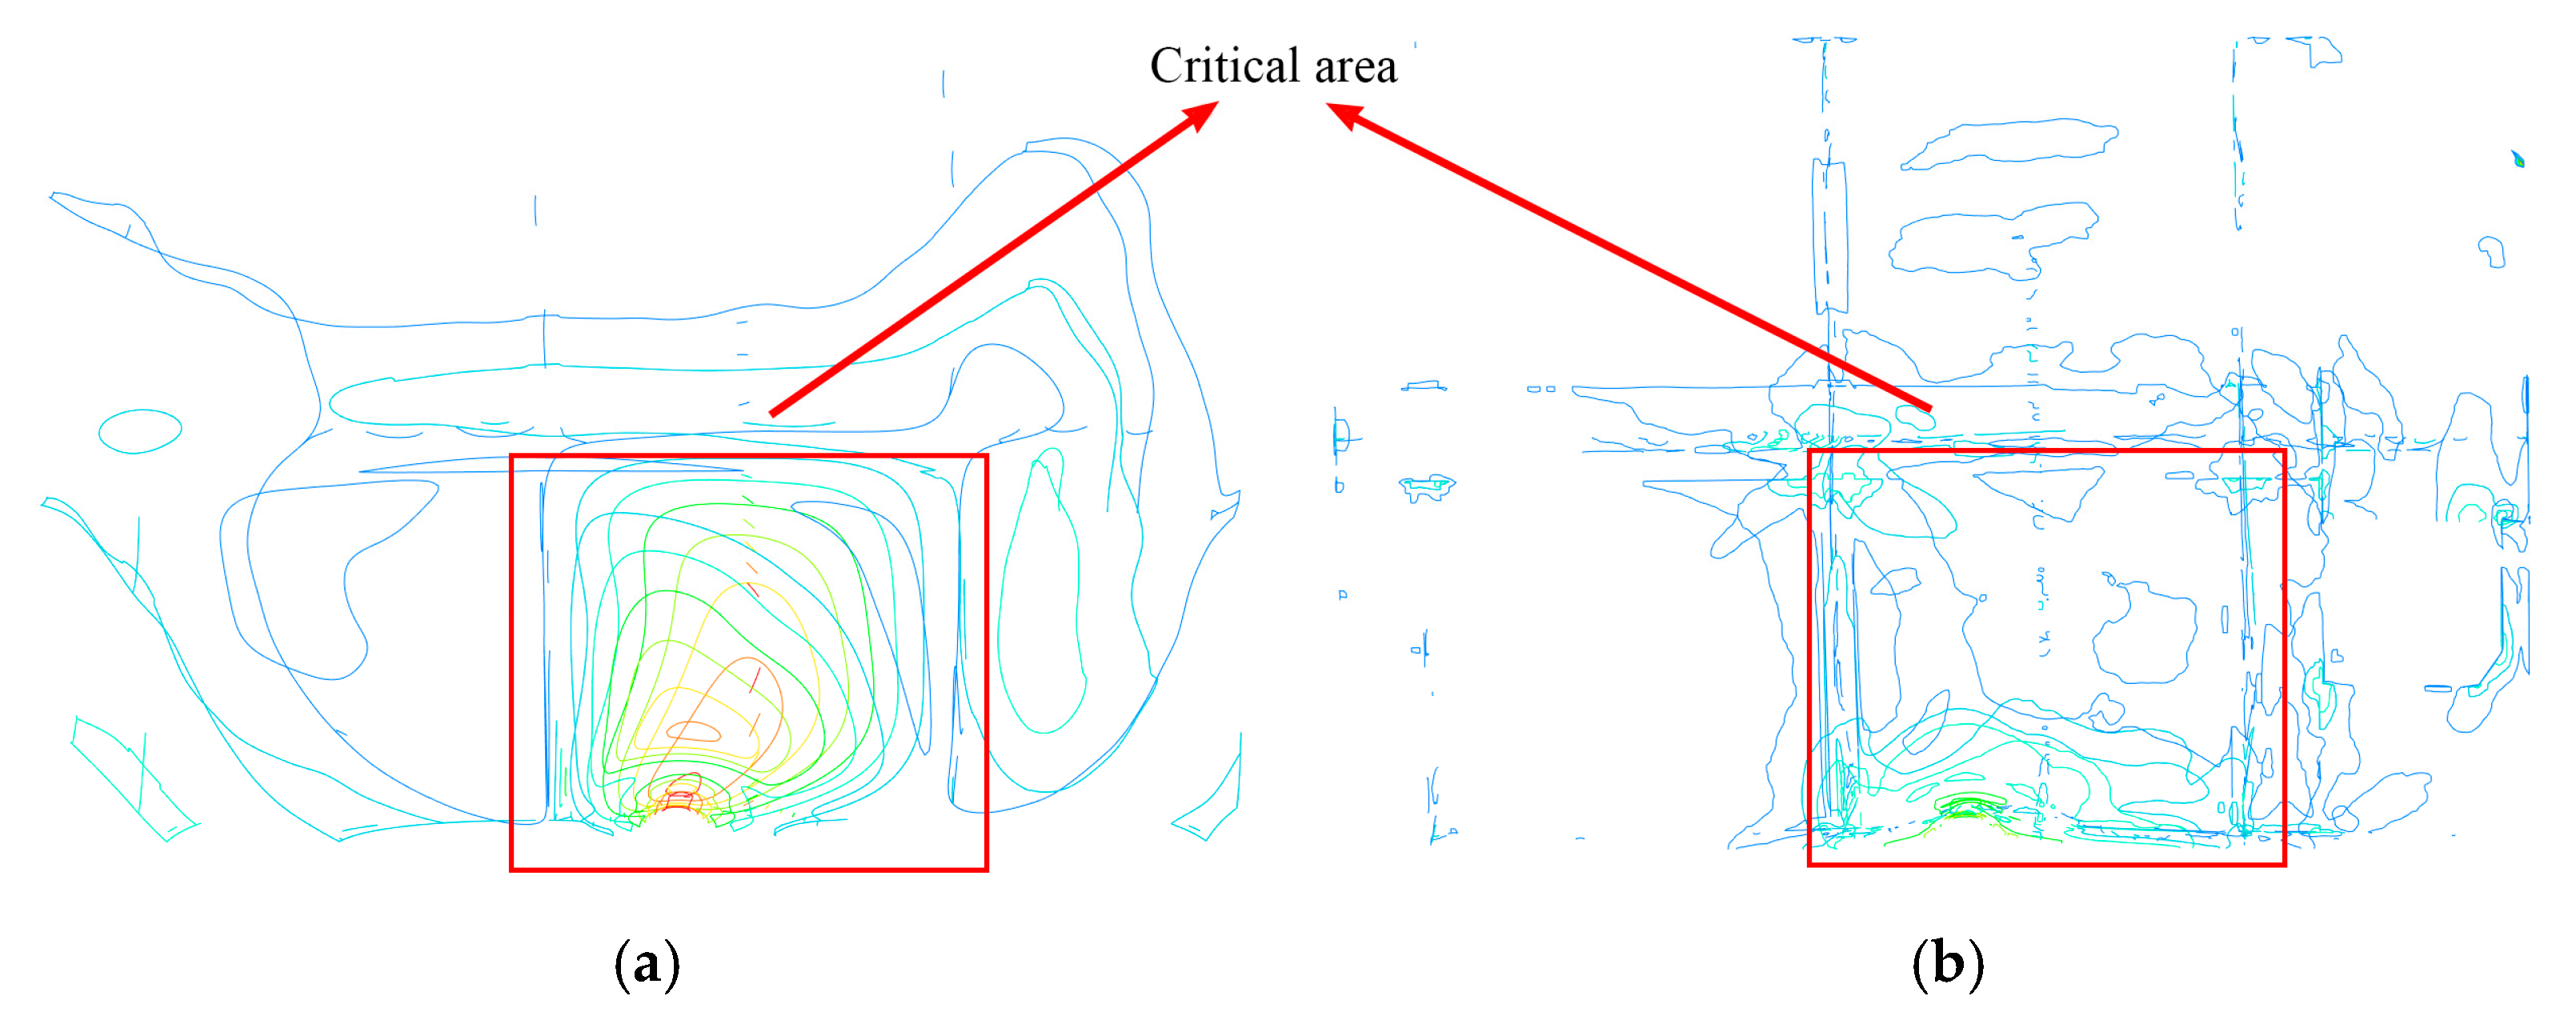
Independent finite-element reruns were performed for the representative optimum x (Table 12, ID 1) and a companion (ID 2) under the established side-pole condition. Thickness vectors follow Table 12 and the manufacturability grid Δ t = 0.5 m m . Table 12 reports mass M and peak deformation L alongside the surrogate predictions, with relative deviations. Figure 12 shows the displacement magnitude and von Mises stress for x . Peak displacement occurs at the impact-facing edge of the lower cover, while stress concentrates along the load path into the lower-cover ribs and the adjacent bulkhead, delineating the critical region. Here, warmer colors mark regions of higher displacement or stress, and cooler colors mark lower levels.
Key findings:
  • Peak displacement occurs at the impact-facing edge of the lower cover; stress is guided along the load path into the lower-cover ribs and the adjacent bulkhead.
  • For the representative optimum (ID 1), the FE peak deformation is 66.25 mm; the surrogate predicted 63.19 mm, giving a deviation of +4.83%.
  • Relative to the baseline (66.17 mm), the change in peak deformation is +0.12%.

5.3. Before/After Comparison Against the Baseline

The baseline design was rerun under the same numerical and modeling settings. Table 13 contrasts the baseline with x (ID 1): mass decreases from 149.40 to 115.20 kg (−22.89%), while peak deformation remains essentially unchanged (66.17 to 66.25 mm; +0.12%).

5.4. Cross-Material Verification (CFRP)

To examine material dependence, a cross-material check was performed by substituting the upper cover H 1 and side walls H 2 with an orthotropic linear-elastic CFRP, using homogenized properties from the coupon tests (Table 2). Damage evolution was not modeled. The deformation metric L is defined as the maximum nodal displacement magnitude of the battery enclosure shells during the contact phase [ 0 , t s e p ] .
Two mappings relative to the aluminum optimum x are considered:
(A) Iso-thickness. H 1 and H 2 retain the thicknesses of x (rounded to Δ t = 0.5 mm); other panels remain aluminum.
(B) Constrained iso-mass. Because H 2 7.0 mm (Table 1), strict mass matching is infeasible when only H 1 and H 2 are substituted. A constrained case is therefore reported with H 2 = 7.0 and H 1 increased in 0.5 mm steps to approach the aluminum mass as closely as allowed.
Meshing, contact, time-integration, and post-processing follow Section 3.2–5.2. Reported metrics are mass M and peak deformation L .
Results. Table 14 lists ( H 1 , , H 7 ) , total mass M , and peak deformation for L aluminum x and for CFRP under (A) and (B), with changes relative to aluminum x . Under (A), the CFRP substitution reduces mass to 90.40 kg (−21.53%) and yields L = 68.67 mm (+3.65%) compared with 66.25 mm. Under (B), the constrained iso-mass setting ( H 1 = 7.0   mm , H 2 = 7.0   m m gives 111.70 kg (−3.04%) and L = 80.85 mm (+22.04%). Although CFRP exhibits higher in-plane Young’s moduli than aluminum, the orthotropic laminate used here has much lower transverse-shear moduli ( G 12 , G 13 / 23 ), and the side-pole response contains a sizable shear component. Under these conditions, replacing only H 1 and H 2 —while leaving the rest of the enclosure unchanged—can increase the shear fraction of the total deflection and shift the location of the global maximum to adjacent panels. Damage evolution is not modeled; results reflect stiffness-dominated trends under the stated bounds. For the constrained iso-mass case, thickening H 1 increases local bending stiffness but also adds mass where the pulse is introduced. Because the laminate’s shear moduli remain low, and only H 1 and H 2 are re-materialized, the global maximum displacement is governed by the shear-sensitive load path across neighboring panels rather than by H 1 alone. The additional mass further reduces the dominant frequency, making the first peak more susceptible to dynamic amplification. Consequently, the peak L can increase even when H1 is thicker. The increase in is consistent with the laminate’s much lower transverse-shear moduli ( G 12 , G 13 / 23 ) and the associated rise in the shear component of deflection under side-pole loading; the location of the global maximum may also shift to adjacent panels.
These cross-material checks test material dependence under identical geometry and process constraints, rather than optimizing a CFRP lay-up. Within this scope, the aluminum-based optimum remains a valid choice. CFRP is a feasible alternative, but achieving a lower L would require lay-up and joint design targeted at shear-dominated loading, which is outside the present study.

5.5. Sensitivity and Diagnostics

A local perturbation analysis around x indicates that H 3 (lower cover) governs the peak deformation L , consistent with Section 4.4; variations in H 1 and H 2 are secondary. With CFRP substitution of H 1 and H 2 , the pattern persists but shows stronger directional dependence due to orthotropy.

5.6. Engineering Implications

On a Δ t = 0.5 mm manufacturability grid, the aluminum optimum achieves ~23% mass reduction while keeping L in a comparable range to the baseline over the contact phase. CFRP substitution of H 1 and H 2 is feasible but shear-sensitive: at iso-thickness, mass decreases by ~22% with a modest increase in L ; under the constrained iso-mass setting ( H 1 = 7.0   mm , H 2 = 7.0   mm ) , L rises by ~22%. Achieving stiffness parity at similar mass would require lay-up and joint design tailored to shear-dominated loading. The optimization and decision workflow applies without modification across materials.
CFRP panels generally carry higher material and processing costs than automotive aluminum sheets at comparable geometry. Beyond fiber/resin price, common CFRP routes (lay-up and cure, RTM/compression molding, bonding/fastening, and tighter QA/inspection) tend to involve longer cycle times, dedicated tooling, and greater scrap sensitivity, whereas aluminum benefits from mature stamping and resistance-spot-welding lines with short takt and high yield. Under the present H 1 / H 2 substitution, the iso-thickness case delivers mass savings but may partially offset benefits through increased process complexity; the constrained iso-mass case requires thickening H 1 to its upper bound, narrowing any cost-per-stiffness advantage. The results are therefore presented as a technical feasibility check rather than a cost recommendation; quantifying economic trade-offs would require a program-specific cost model (production volume, automation level, cycle time, tooling amortization, repairability).
From a thermal point of view, the choice of enclosure material also influences pack-level heat spreading. As discussed in the introduction, aluminum has relatively high thermal conductivity, which helps distribute heat along the covers and side walls and promotes more uniform cell temperatures during fast charging and under abusive conditions. The CFRP laminate, in contrast, has much lower through-thickness conductivity, so a design with a larger fraction of composite material tends to rely on additional thermal paths or dedicated heat-spreading features to achieve similar safety margins. These thermo-mechanical interactions are not included in the present FE surrogates and are deferred to future work that couples the structural model with a more detailed thermal analysis.

6. Discussion

This study developed a surrogate-assisted, constraint-aware workflow for battery pack enclosure (BPE) thickness mapping under side-pole loading, combining a 64-run OLHD dataset, ARD Matérn-5/2 Gaussian-process surrogates, and NSGA-II search with decision making via knee-region windowing and TOPSIS. The representative optimum x selected on a Δ t = 0.5 mm grid delivers substantial mass reduction with essentially unchanged peak deformation in verification reruns. Specifically, mass drops from 149.40 kg to 115.20 kg (−22.89%) while peak deformation changes by +0.12% (66.17 → 66.25 mm).
Decision robustness was confirmed by post hoc uncertainty penalization, weight-sensitivity checks, and a model-dependency audit against an SE-ARD GP, yielding identical rankings (Kendall’s τ = 1.00 ) and a moderate knee shift in the normalized plane. Independent FE reruns matched surrogate predictions to within ~0.6% (mass) and ~5% (peak deformation) for the two retained designs.
A focused cross-material verification substituting H 1 / H 2 with an orthotropic CFRP (iso-thickness and constrained iso-mass mappings) showed that, under the present shear-sensitive load path and without lay-up tailoring or joint redesign, CFRP can lower mass but may increase the global peak deformation. The observed trends are consistent with laminate shear moduli and the induced load redistribution.
Key findings
  • A manufacturable aluminum optimum on Δ t = 0.5 mm achieves ~23% mass reduction with comparable peak deformation in FE verification.
  • The ranking from TOPSIS remains invariant under uncertainty inflation and moderate preference shifts; cross-kernel auditing preserves order ( τ = 1.00 ).
  • CFRP substitution of H 1 / H 2 alone, under iso-thickness or constrained iso-mass, is shear-sensitive; achieving stiffness parity would require laminate/joint design directed at shear-dominated paths.
Engineering/economic note.
The representative thickness-mapped aluminum design selected on a Δ t = 0.5 mm grid reduces pack mass by approximately 23% (ΔM ≈ 34 kg), which directly lowers raw-material usage. The overall cost impact additionally depends on gauge availability, forming and joining routes, tooling amortization, and quality-assurance requirements. A full life-cycle cost assessment is beyond the present scope and is planned as follow-on work.
Limitations and outlook.
Limitations: The present study addresses enclosure-level mass–stiffness trade-offs with shell models; detailed joints/fasteners, module clearance, and laminate damage evolution are not explicitly modeled.
The deformation metric L is defined as the peak nodal displacement magnitude during the contact phase of the side-pole load case.
The cross-material check substituted H1/H2 only with linear-elastic orthotropic CFRP (iso-thickness or constrained iso-mass mappings); lay-up tailoring and joint redesign were not included.
At present, no pack-level side-pole test data are available for direct comparison; the only experimental inputs are the coupon tests in Section 2.2, which were used to calibrate the material models. The staged validation route outlined below is intended to bridge this gap as resources become available.
Conducting a full-vehicle side-pole crash would require pack integration into a body-in-white, full instrumentation, and accredited facility time; a single test typically costs tens to (low) hundreds of thousands of USD, which is beyond the current project budget.
Outlook: Couple enclosure deformation with explicit module-clearance criteria (acceptance per GB 38031-2025 §8.2.4) to convert stiffness surrogates into pass/fail-aware objectives/constraints.
Introduce joint/connector models and contact details to capture load transfer and potential local compliance.
Incorporate laminate damage and pursue lay-up optimization targeted at shear-dominated load paths to close the CFRP stiffness gap.
Execute a staged physical-validation plan as resources permit:
(i)
Perform coupon/sub-component tests for material calibration (aluminum, CFRP);
(ii)
A durability-oriented follow-on plan includes fatigue safety factors for joints/ribs, environmental conditioning with repeated-load variants, and model–test correlation;
(iii)
sled/pendulum tests to emulate the side-pole pulse;
(iv)
model–test correlation using peak deformation and hotspot metrics.

Author Contributions

All authors contributed to the study’s conception and design. Review, editing, funding acquisition, supervision, and project administration were performed by D.Z. Methodology, data analysis, software support, and writing—original draft were performed by Z.S. Software support, review, and funding acquisition were performed by H.Z. Software support and review were performed by J.L. All authors have read and agreed to the published version of the manuscript.

Funding

This research was funded by the Natural Science Foundation of Heilongjiang Province of China (Grant No. LH2022E100) and the Self-financed Project of Harbin Science and Technology Program (Grant No. 2023ZCZJCG036).

Data Availability Statement

Anonymized keyword decks, the DOE table, surrogate scripts, and optimization codes are available upon reasonable request to the corresponding author.

Conflicts of Interest

The authors declare no conflicts of interest.

Appendix A

Table A1. Complete 64-run optimal Latin hypercube plan.
Case H 1 H 2 H 3 H 4 H 5 H 6 H 7 M/kgL/mm
15.665.517.642.553.152.873.97152.465.39
23.664.368.543.623.52.253.91136.766.74
35.83.289.982.832.593.632.61168.870.52
46.615.046.383.662.523.672.49150.464.43
54.153.576.094.622.832.983.57118.364.25
66.016.557.75.114.843.922.24164.065.63
75.176.887.475.213.613.353.37151.764.52
85.033.798.824.525.223.413.41156.667.54
93.584.636.35.454.882.182.26119.764.43
105.865.887.825.882.223.482.94158.365.47
113.073.967.84.012.432.742.68121.366.08
125.36.457.63.245.883.613.75155.465.12
136.086.068.383.412.942.022.53164.765.84
145.116.738.674.894.252.452.04161.565.53
155.753.117.15.025.393.912.36148.270.75
164.053.529.092.083.912.393.94143.366.09
173.054.286.185.175.272.913.62112.964.35
186.376.828.245.524.082.092.08171.765.22
194.944.758.365.434.753.532.33153.766.60
204.846.157.293.282.72.953.51141.764.96
215.484.76.664.183.33.033.25141.164.69
226.295.167.333.093.773.152.38156.965.47
234.543.259.824.383.232.473.21155.266.59
244.923.177.952.183.432.643.08141.267.04
256.683.428.913.045.132.792.22172.874.03
264.385.26.93.72.312.152.43130.065.13
274.264.949.914.685.952.53.02161.467.51
283.356.097.032.74.582.832.31125.064.51
293.254.119.544.743.822.593.63141.966.92
303.726.46.725.32.913.553.68127.063.80
313.993.758.113.975.682.612.83138.666.21
326.775.718.622.775.473.83.25177.865.97
333.154.157.182.453.733.163.82118.365.34
346.715.678.694.263.012.933.9174.866.09
353.474.899.434.444.673.293.47146.667.06
365.336.219.293.884.472.042.94167.766.28
373.526.979.675.984.332.713.05154.765.90
386.544.398.754.074.053.122.76171.670.33
393.394.599.243.562.452.432.8129.966.32
405.245.086.053.482.043.252.69131.564.23
414.775.67.914.3352.562.16149.065.41
424.716.766.85.325.522.373.31142.963.76
436.993.667.212.982.643.392.89158.274.07
444.634.878.042.224.763.333.7145.566.23
456.846.316.955.62.792.343.5162.664.33
466.245.289.74.994.263.273.54180.267.50
474.376.369.375.815.123.463.8161.466.20
483.846.582.9353.573.17122.164.84
494.486.577.552.383.982.23.33142.064.78
506.54.467.425.652.13.852.02157.969.99
513.283.878.145.835.363.692.56132.766.22
526.146.666.512.025.793.752.58154.263.67
536.414.549.183.162.322.692.13170.869.75
545.615.836.845.733.553.992.65148.864.67
554.085.986.222.655.612.252.44126.863.71
565.973.348.492.284.183.042.11159.271.13
575.425.86.323.344.513.943.12141.763.85
584.2138.34.873.362.293.74138.066.42
595.924.26.453.823.092.073.38141.868.52
603.843.449.014.215.693.832.97144.966.10
615.523.99.453.814.392.762.87165.668.40
624.595.359.62.352.173.23.87156.267.27
636.945.388.942.615.823.073.15181.865.96
643.925.489.84.83.663.742.74155.166.62
Figure A1. Global importance (normalized to 1) of thickness variables H 1 H 7 estimated from the GP surrogates. Note. Bars show the aggregated importance.
Wevj 16 00632 g0a1

References

  1. IEA. Emissions from Oil and Gas Operations in Net Zero Transitions. Available online: https://www.iea.org/reports/emissions-from-oil-and-gas-operations-in-net-zero-transitions (accessed on 21 September 2025).
  2. Arshad, K.; Hussain, N.; Ashraf, M.H.; Saleem, M.Z. Air pollution and climate change as grand challenges to sustainability. Sci. Total Environ. 2024, 928, 172370. [Google Scholar] [CrossRef]
  3. Hu, R.; Cai, T.; Xu, W. Exploring the technology changes of new energy vehicles in China: Evolution and trends. Comput. Ind. Eng. 2024, 191, 110178. [Google Scholar] [CrossRef]
  4. Chen, S.; Zhou, M.; Zhao, X.; Zhang, Z.; Hu, L. Space-efficient protection for cylindrical batteries embedded into multi-cell structures: Evaluation and mechanistic investigation. Thin-Walled Struct. 2024, 197, 111630. [Google Scholar] [CrossRef]
  5. Li, R.; Zhao, Z.; Bao, H.; Pan, Y.; Wang, G.; Liu, B.; Liao, T.; Li, J. Bio-inspired honeycomb structures to improve the crashworthiness of a battery-pack system. Eng. Fail. Anal. 2024, 158, 108041. [Google Scholar] [CrossRef]
  6. Pan, Y.; Xiong, Y.; Wu, L.; Diao, K.; Guo, W. Lightweight design of an automotive battery-pack enclosure via advanced high-strength steels and size optimization. Int. J. Automot. Technol. 2021, 22, 1279–1290. [Google Scholar] [CrossRef]
  7. Wang, S.; Guo, S.; Li, R.; Hu, Z.; Leng, Q. On crashworthiness design of hybrid metal–composite battery-pack enclosure structure. Mech. Adv. Mater. Struct. 2025, 32, 2548–2559. [Google Scholar] [CrossRef]
  8. Kulkarni, S.S.; Hale, F.; Taufique, M.; Soulami, A.; Devanathan, R. Investigation of crashworthiness of carbon fiber-based electric vehicle battery enclosure using finite element analysis. Appl. Compos. Mater. 2023, 30, 1689–1715. [Google Scholar] [CrossRef]
  9. Agarwal, N.; Rangamani, A.; Bhavsar, K.; Virnodkar, S.S.; Fernandes, A.A.A.; Chadha, U.; Srivastava, D.; Patterson, A.E.; Rajasekharan, V. An overview of carbon-carbon composite materials and their applications. Front. Mater. 2024, 11, 1374034. [Google Scholar] [CrossRef]
  10. Zhou, G.; Tang, H.; Sun, Q.; Li, D.; Peng, Y.; Zeng, D.; Su, X. Analysis of the crushing behaviors of woven carbon fiber reinforced plastic hat section component under dynamic bending and axial crushing loading. Thin-Walled Struct. 2021, 161, 107426. [Google Scholar] [CrossRef]
  11. Tiryakioğlu, M.; Robinson, J.; Salazar-Guapuriche, M.; Zhao, Y.; Eason, P. Hardness–strength relationships in the aluminum alloy 7010. Mater. Sci. Eng. A 2015, 631, 196–200. [Google Scholar] [CrossRef]
  12. Zhao, T.; Jiang, Y. Fatigue of 7075-T651 aluminum alloy. Int. J. Fatigue 2008, 30, 834–849. [Google Scholar] [CrossRef]
  13. Guo, H.; Zhou, X.; Liu, Z. Advanced lightweight structural materials for automobiles: Properties, manipulation, and perspective. Sci. Adv. Mater. 2024, 16, 563–580. [Google Scholar] [CrossRef]
  14. Committee, A.H. Properties and Selection: Nonferrous Alloys and Special-Purpose Materials; ASM International: Russell Township, OH, USA, 1990. [Google Scholar]
  15. Lv, Y.; Yang, X.; Li, X.; Zhang, G.; Wang, Z.; Yang, C. Experimental study on a novel battery thermal management technology based on low density polyethylene-enhanced composite phase change materials coupled with low fins. Appl. Energy 2016, 178, 376–382. [Google Scholar] [CrossRef]
  16. Das, S. Recycling and Life Cycle Issues for Lightweight Vehicles; Elsevier: Amsterdam, The Netherlands, 2021; pp. 373–404. [Google Scholar]
  17. Severson, P.; Camber, K.; El Hajjar, R. Carbon fiber reinforced plastics with aluminum honeycomb core design methodology for space and surface mining applications. Acta Astronaut. 2022, 193, 721–730. [Google Scholar] [CrossRef]
  18. Sinmazçelik, T.; Avcu, E.; Bora, M.Ö.; Çoban, O. A review: Fibre metal laminates, background, bonding types and applied test methods. Mater. Des. 2011, 32, 3671–3685. [Google Scholar] [CrossRef]
  19. Naresh, G.; Praveenkumar, T.; Madheswaran, D.K.; Solomon, J.M.; Goud Kureli, S.; Kolhe, Y.K.; Lalvani J, I.J.R. Advancing structural efficacy and resonance performance of battery enclosures through multi-objective optimization. J. Low Freq. Noise Vib. Act. Control 2024, 43, 1895–1909. [Google Scholar] [CrossRef]
  20. Qiao, W.; Yu, L.; Zhang, Z.; Pan, T. Study on the battery safety in frontal collision of electric vehicle. Proc. J. Phys. Conf. Ser. 2021, 2137, 012008. [Google Scholar] [CrossRef]
  21. Wang, H.; Wang, Z.; Fan, Y.; Gao, Q.; Wang, H. Multi-objective lightweight design of automotive battery pack box for crashworthiness. Int. J. Crashworthiness 2024, 29, 292–307. [Google Scholar] [CrossRef]
  22. Sterling, J.; Tattersall, L.; Bamber, N.; De Cola, F.; Murphy, A.; Millen, S. Composite structure failure analysis post Lithium-Ion battery fire. Eng. Fail. Anal. 2024, 160, 108163. [Google Scholar] [CrossRef]
  23. Szabo, I.; Scurtu, L.I.; Raboca, H.; Mariasiu, F. Topographical optimization of a battery module case that equips an electric vehicle. Batteries 2023, 9, 77. [Google Scholar] [CrossRef]
  24. Gilaki, M.; Walsh, R.; Sahraei, E. Model-based design of an electric bus lithium-ion battery pack. J. Electrochem. Energy Convers. Storage 2021, 18, 020914. [Google Scholar] [CrossRef]
  25. Dhoke, A.; Dalavi, A. Optimal design of honeycomb battery pack enclosure for electric vehicle. Int. J. Simul. Multidiscip. Des. Optim. 2024, 15, 23. [Google Scholar] [CrossRef]
  26. Deb, K.; Pratap, A.; Agarwal, S.; Meyarivan, T. A fast and elitist multiobjective genetic algorithm: NSGA-II. IEEE Trans. Evol. Comput. 2002, 6, 182–197. [Google Scholar] [CrossRef]
  27. Lin, C.; Gao, F.; Wang, W.; Chen, X. Multi-objective optimization design for a battery pack of electric vehicle with surrogate models. J. Vibroeng. 2016, 18, 2343–2358. [Google Scholar] [CrossRef]
  28. Huang, D.; Zhou, S.; Yan, X. Multi-objective optimization design of power pack structures based on floating projection topology optimization. Eng. Optim. 2025, 57, 361–383. [Google Scholar] [CrossRef]
  29. GB/T 228.1-2021; Metallic Materials—Tensile Testing—Part 1: Method of Test at Room Temperature. Standards Press of China: Beijing, China, 2021.
  30. ASTM D3039/D3039M-17; Standard Test Method for Tensile Properties of Polymer Matrix Composite Materials. ASTM International: West Conshohocken, PA, USA, 2017.
  31. GB 38031-2025; Electric Vehicles Traction Battery Safety Requirements. Standards Press of China: Beijing, China, 2025.
Figure 1. Aluminum and CFRP specimens. (a) 7075-T651 aluminum; (b) CFRP (carbon fiber-reinforced polymer).
Wevj 16 00632 g001
Figure 2. Experimental test. (a) 7075-T651 aluminum; (b) CFRP (carbon fiber-reinforced polymer).
Wevj 16 00632 g002
Figure 3. Comparative mechanical responses of aluminum and CFRP. Note. A—initial elastic stiffness of 7075-T651. B—stable plastic deformation with multiple load drops indicating progressive necking. C—large displacement at failure, corresponding to high plastic energy absorption. D—0.2% proof-stress region. E—extended plastic deformation and strain-hardening regime, with multiple small load drops. F—large failure strain (≈13%), indicating high ductility. G—almost linear force–displacement response with high initial stiffness. H—abrupt load drop at low displacement, characteristic of brittle failure. I—linear elastic response up to the ultimate tensile strength. J—brittle failure at low strain (≈1.1%), limited plasticity.
Wevj 16 00632 g003
Figure 4. Reference battery pack enclosure model.
Wevj 16 00632 g004
Figure 5. Simplified battery pack model.
Wevj 16 00632 g005
Figure 7. Peak displacement and stress. (a) Displacement; (b) Von Mises stress.
Wevj 16 00632 g007
Figure 8. Calibration for M (a) and L (b) with 95% prediction bands.
Wevj 16 00632 g008
Figure 9. Residual Q–Q (a,c) and scale–location (b,d) plots; Breusch–Pagan p -values.
Wevj 16 00632 g009
Figure 10. Normalized HV vs. generation.
Wevj 16 00632 g010
Figure 11. Knee-region windowing and diversity-preserving selection in the normalized ( M , L ) space.
Wevj 16 00632 g011
Figure 12. Displacement and stress fields for x under side-pole loading. (a) Displacement magnitude; (b) von Mises stress.
Wevj 16 00632 g012
Table 1. Specimen configurations.
IDMaterialThickness (mm)Replicates
Al7075-T65135
CFRPCFRP/epoxy35
Table 2. Tensile properties (mean ± SD; n = 5).
IDMaterialThickness, t (mm)Young’s Modulus, E (GPa) 0.2 %   Proof   Stress ,   σ 0 2 σ(MPa) Ultimate   Tensile   Strength ,   σ u (MPa) Failure   Strain ,   ε f (%)
Al7075-T6513.1373.6502.8575.512.9%
CFRPCFRP/epoxy2.8782.7N.A.690.91.1%
Table 3. Design-variable bounds and baseline (units: mm).
FactorLowerBaselineUpper
H 1 357
H 2 357
H 3 6810
H 4 246
H 5 246
H 6 234
H 7 234
Note. H 1 H 7 are thickness variables; units: mm.
Table 4. Ten representative designs from the optimal Latin hypercube plan.
Case H 1 H 2 H 3 H 4 H 5 H 6 H 7 ML
15.665.517.642.553.152.873.97152.465.39
23.664.368.543.623.52.253.91136.766.74
35.83.289.982.832.593.632.61168.870.52
46.615.046.383.662.523.672.49150.464.43
54.153.576.094.622.832.983.57118.364.25
66.016.557.75.114.843.922.24164.065.63
75.176.887.475.213.613.353.37151.764.52
85.033.798.824.525.223.413.41156.667.54
93.584.636.35.454.882.182.26119.764.43
105.865.887.825.882.223.482.94158.365.47
Note. H 1 H 7 : thickness variables (mm); L : peak deformation (mm); M : mass (kg).
Table 5. Kernel hyperparameters for the GPR surrogates.
ParameterM-ModelL-Model
σ f 80.94.68
σ n 0.1680.294
MeanFcnconstantconstant
NLML12466.8
Note. NLML is reported as—LogLikelihood (MATLAB R2024a). Inputs were standardized during training; errors reported here use physical units.
Table 6. ARD length-scales for the GPR surrogates.
LengthScaleM-ModelL-Model
l H 1 13.872.95
l H 2 69.131.94
l H 3 4.448.81
l H 4 203.85216.45
l H 5 16.7571,269.40
l H 6 421.2642,900.11
l H 7 55.6072,996.87
Table 7. Surrogate accuracy (5-fold CV).
ObjectiveModelMAERMSER2CCCPI cov. (1σ)
M (kg)Baseline0.68 ± 0.271.34 ± 0.870.989 ± 0.0120.994 ± 0.0070.397 ± 0.482
M (kg)PI-GPR0.85 ± 0.171.45 ± 0.680.989 ± 0.0120.994 ± 0.0060.238 ± 0.296
L (mm)Baseline0.50 ± 0.190.66 ± 0.330.867 ± 0.1240.936 ± 0.0600.338 ± 0.281
L (mm)PI-GPR0.54 ± 0.130.70 ± 0.150.868 ± 0.0800.934 ± 0.0390.108 ± 0.241
Table 8. NSGA-II algorithm settings.
ItemSetting
AlgorithmNSGA-II
Population size N100
Generations G200
Evaluations N × G20,000
InitializationLatin-hypercube within bounds
CrossoverSBX
SBX   η c 10
Crossover   prob   p c 1
MutationPolynomial
Mutation   η m 20
Mutation   prob   p m p m = 1/d = 1/7
Design dimension d7
Projection/constraints Δ t = 0.5   mm ;   H i H k 1.0 m m
Objectives for ranking μ M x ,   μ L x (mean-GPR, Matern-5/2 (ARD))
Dominance ranking Fast   non-dominated   sort   on   ( μ M ,   μ L )
Diversity preservationCrowding distance (objective space)
Termination200 generations
Random seed r n g s _ r , s r s e e d L i s t , (default r a n d i 1 e 9 , 1 , R ); RNG: twister; CI: seed = 2025
Note. Bootstrap confidence intervals were computed post hoc with a fixed seed (2025); this does not affect the optimization RNG state.
Table 9. Normalized performance.
MetricMean ± SD95% CI
HV0.229 ± 0.418[0.118, 0.361]
IGD0.295 ± 0.548[0.149, 0.469]
GD0.289 ± 0.539[0.146, 0.460]
Table 10. Diversity-preserving candidates and TOPSIS ranking.
IDH1H2H3H4H5H6H7ML M n o r m L n o r m CstarRank
13.57.06.02.52.02.02.0115.863.190.4450.2210.6581
23.57.06.02.52.52.02.0116.463.190.4710.2210.6442
Note. With L unchanged, the TOPSIS ranking reflects mass differences; no near-duplicate remains after the spacing rule (0.01, normalized) and Δ t projection.
Table 11. Robustness summary for decision making.
(a) Uncertainty penalization (Equation (13); variance-inflated).
kMedian Δ r a n k Max Δ r a n k
100
200
( b )   Weight   sensitivity :   TOPSIS   top-1   under   different   weights   ω = ω M , ω L     .
ω M ω L TOP-1 ID
0.30.71
0.50.51
0.70.31
(c) Weight-sensitivity summary (selection frequency and Jaccard similarity).
x * freq over x *   freq   over   ω 0.3 , 0.7 , 0.5 , 0.5 , 0.7 , 0.3 Jaccard :   ω 0.3 , 0.7 vs. ω 0.5 , 0.5 Jaccard :   ω 0.7 , 0.3 vs. ω 0.5 , 0.5
2311
(d) Cross-model dependency (SE-ARD): Kendall’s τ and knee shift (normalized plane).
Kendall’s τ (All)Kendall’s τ (Top-10)Knee shift (%)
1124.87
Note. τ denotes Kendall’s rank correlation. Knee shift is reported relative to the unit-diagonal length in the normalized ( M , L ) plane.
Table 12. Aluminum baseline: independent FE reruns and prediction comparison.
IDH1H2H3H4H5H6H7 M p r e d L p r e d M F E L F E Δ M Δ L
13.57.06.02.52.02.02.0115.863.19115.266.25−0.59%4.83%
23.57.06.02.52.52.02.0116.463.19116.066.66−0.40%5.48%
Table 13. Baseline vs. optimized design.
Design M L Δ M vs. Baseline (%) Δ L vs. Baseline (%)
Baseline149.466.17−22.89+0.12
x * (ID 1)115.266.25
Note: x * denotes the selected optimum used for FE verification.
Table 14. Cross-material check at x : aluminum vs. CFRP (iso-thickness and iso-mass).
DesignH1H2H3H4H5H6H7 M L Δ M   vs.   A l   x * ( % ) Δ L   vs.   A l   x * ( % )
Al x (ID 1)3.5762.5222115.266.25--
CFRP (A) iso-thickness3.5762.522290.468.67−21.533.65
CFRP (B) iso-mass7762.5222111.780.85−3.0422.04
Note. Only H 1 and H 2 are re-materialized; other panels remain aluminum. For (A), H 1 and H 2 use the thicknesses of aluminum x (rounded to Δ t = 0.5 mm). For (B), strict iso-mass is infeasible under H 2 7.0 mm; a constrained case is reported with H 1 = 7.0 mm and H 2 = 7.0 mm (Δ columns computed against aluminum x : 115.20 kg, 66.25 mm).
Disclaimer/Publisher’s Note: The statements, opinions and data contained in all publications are solely those of the individual author(s) and contributor(s) and not of MDPI and/or the editor(s). MDPI and/or the editor(s) disclaim responsibility for any injury to people or property resulting from any ideas, methods, instructions or products referred to in the content.