Emission/Reliability-Aware Stochastic Optimization of Electric Bus Parking Lots and Renewable Energy Sources in Distribution Network: A Fuzzy Multi-Objective Framework Considering Forecasted Data
Abstract
1. Introduction
- Insufficient focus on EBPL integration in distribution networks: Despite several studies [8,9,10,11,12,13,15,16,22,23] analyzing the integration of EVs with renewable energy sources, the majority focus on light-duty or dispersed EVs, with limited consideration for centralized electric bus parking lots (EBPLs). These have distinguishing characteristics due to their extensive storage capacity, controllability, and significant impact on network operation. There is a shortage of detailed studies on EBPL planning and operation under conditions of renewable abundance, which limits understanding of their impact on network reliability and cost-effectiveness.
- Inadequate treatment of uncertainty in renewable and load parameters: Despite stochastic considerations being partially addressed in some contributions [8,10,11,19,21,22,24], uncertainty is often handled using simplified or deterministic approaches, neglecting the true variability of solar, wind, and demand profiles. The majority of existing models apply fixed scenarios or probability distributions without considering temporal correlation or variability propagation. This gap highlights the need for a robust stochastic framework capable of addressing multiple sources of uncertainty simultaneously.
- Limitations of existing metaheuristic optimization techniques: Most works employ metaheuristic approaches such as PSO [19], MEWOA [22], NSGA-II [26], and other evolutionary algorithms [13,14,18], but these techniques are often affected by premature convergence, poor adaptability, and diminished exploration in high-dimensional, multi-objective environments. Few works have explored innovative or hybrid optimization techniques that dynamically trade off exploration and exploitation or maintain solution diversity to improve global search efficacy.
- Limited integration of forecasting within optimization frameworks: Though renewable forecasting is identified as crucial for system operation, few studies [17,20,25] integrate predictive information on renewable generation or load behavior directly. Nearly all existing works conduct optimization using static or past data, without accounting for the possible benefit of forecast-driven optimization. The absence of hybrid forecasting–optimization models limits the ability to minimize energy not supplied (ENS), emission levels, and operating costs based on real-world uncertainties.
- High computational burden of classical stochastic techniques: Previous work using conventional stochastic techniques such as Monte Carlo simulation (MCS) or cloud models [8,19,24] entails heavy computational effort and inconsistent outcomes due to the substantial number of samples required to ensure convergence. These limitations point to the need for computationally effective stochastic optimization models with high-quality, stable output at lower processing requirements without sacrificing reliability or robustness.
- Combined Planning of EBPL and RES in Distribution Systems: Unlike previous work that primarily addressed dispersed light-duty EVs [8,9,10,11,12,13,15,22,23], this article presents a comprehensive planning scheme that integrates centralized EBPLs with PV and WT resources. The method simultaneously accounts for operational, emission, and energy-loss expenses and demonstrates the value of EBPLs as controllable, high-capacity resources that enhance system reliability and cost savings.
- Novel Multi-Objective Optimization Algorithm (MO-ESCHO): To overcome the convergence and exploration limitations of conventional metaheuristics such as PSO [19], MEWOA [22], and NSGA-II [26], a new multi-objective entropy-guided Sinh–Cosh Optimizer (MO-ESCHO) is proposed. Unlike existing methods that use static entropy weighting or heuristic parameter tuning [27], MO-ESCHO employs a dynamic entropy-based exploration–exploitation controller that adaptively controls the search process based on population diversity and convergence rate. Moreover, its multi-objective extension maintains both Pareto-front diversity and convergence precision simultaneously, a feature not addressed by earlier models. The entropy-based learning process maintains population diversity, prevents premature convergence, and generates well-distributed Pareto-optimal solutions for multiple objective functions.
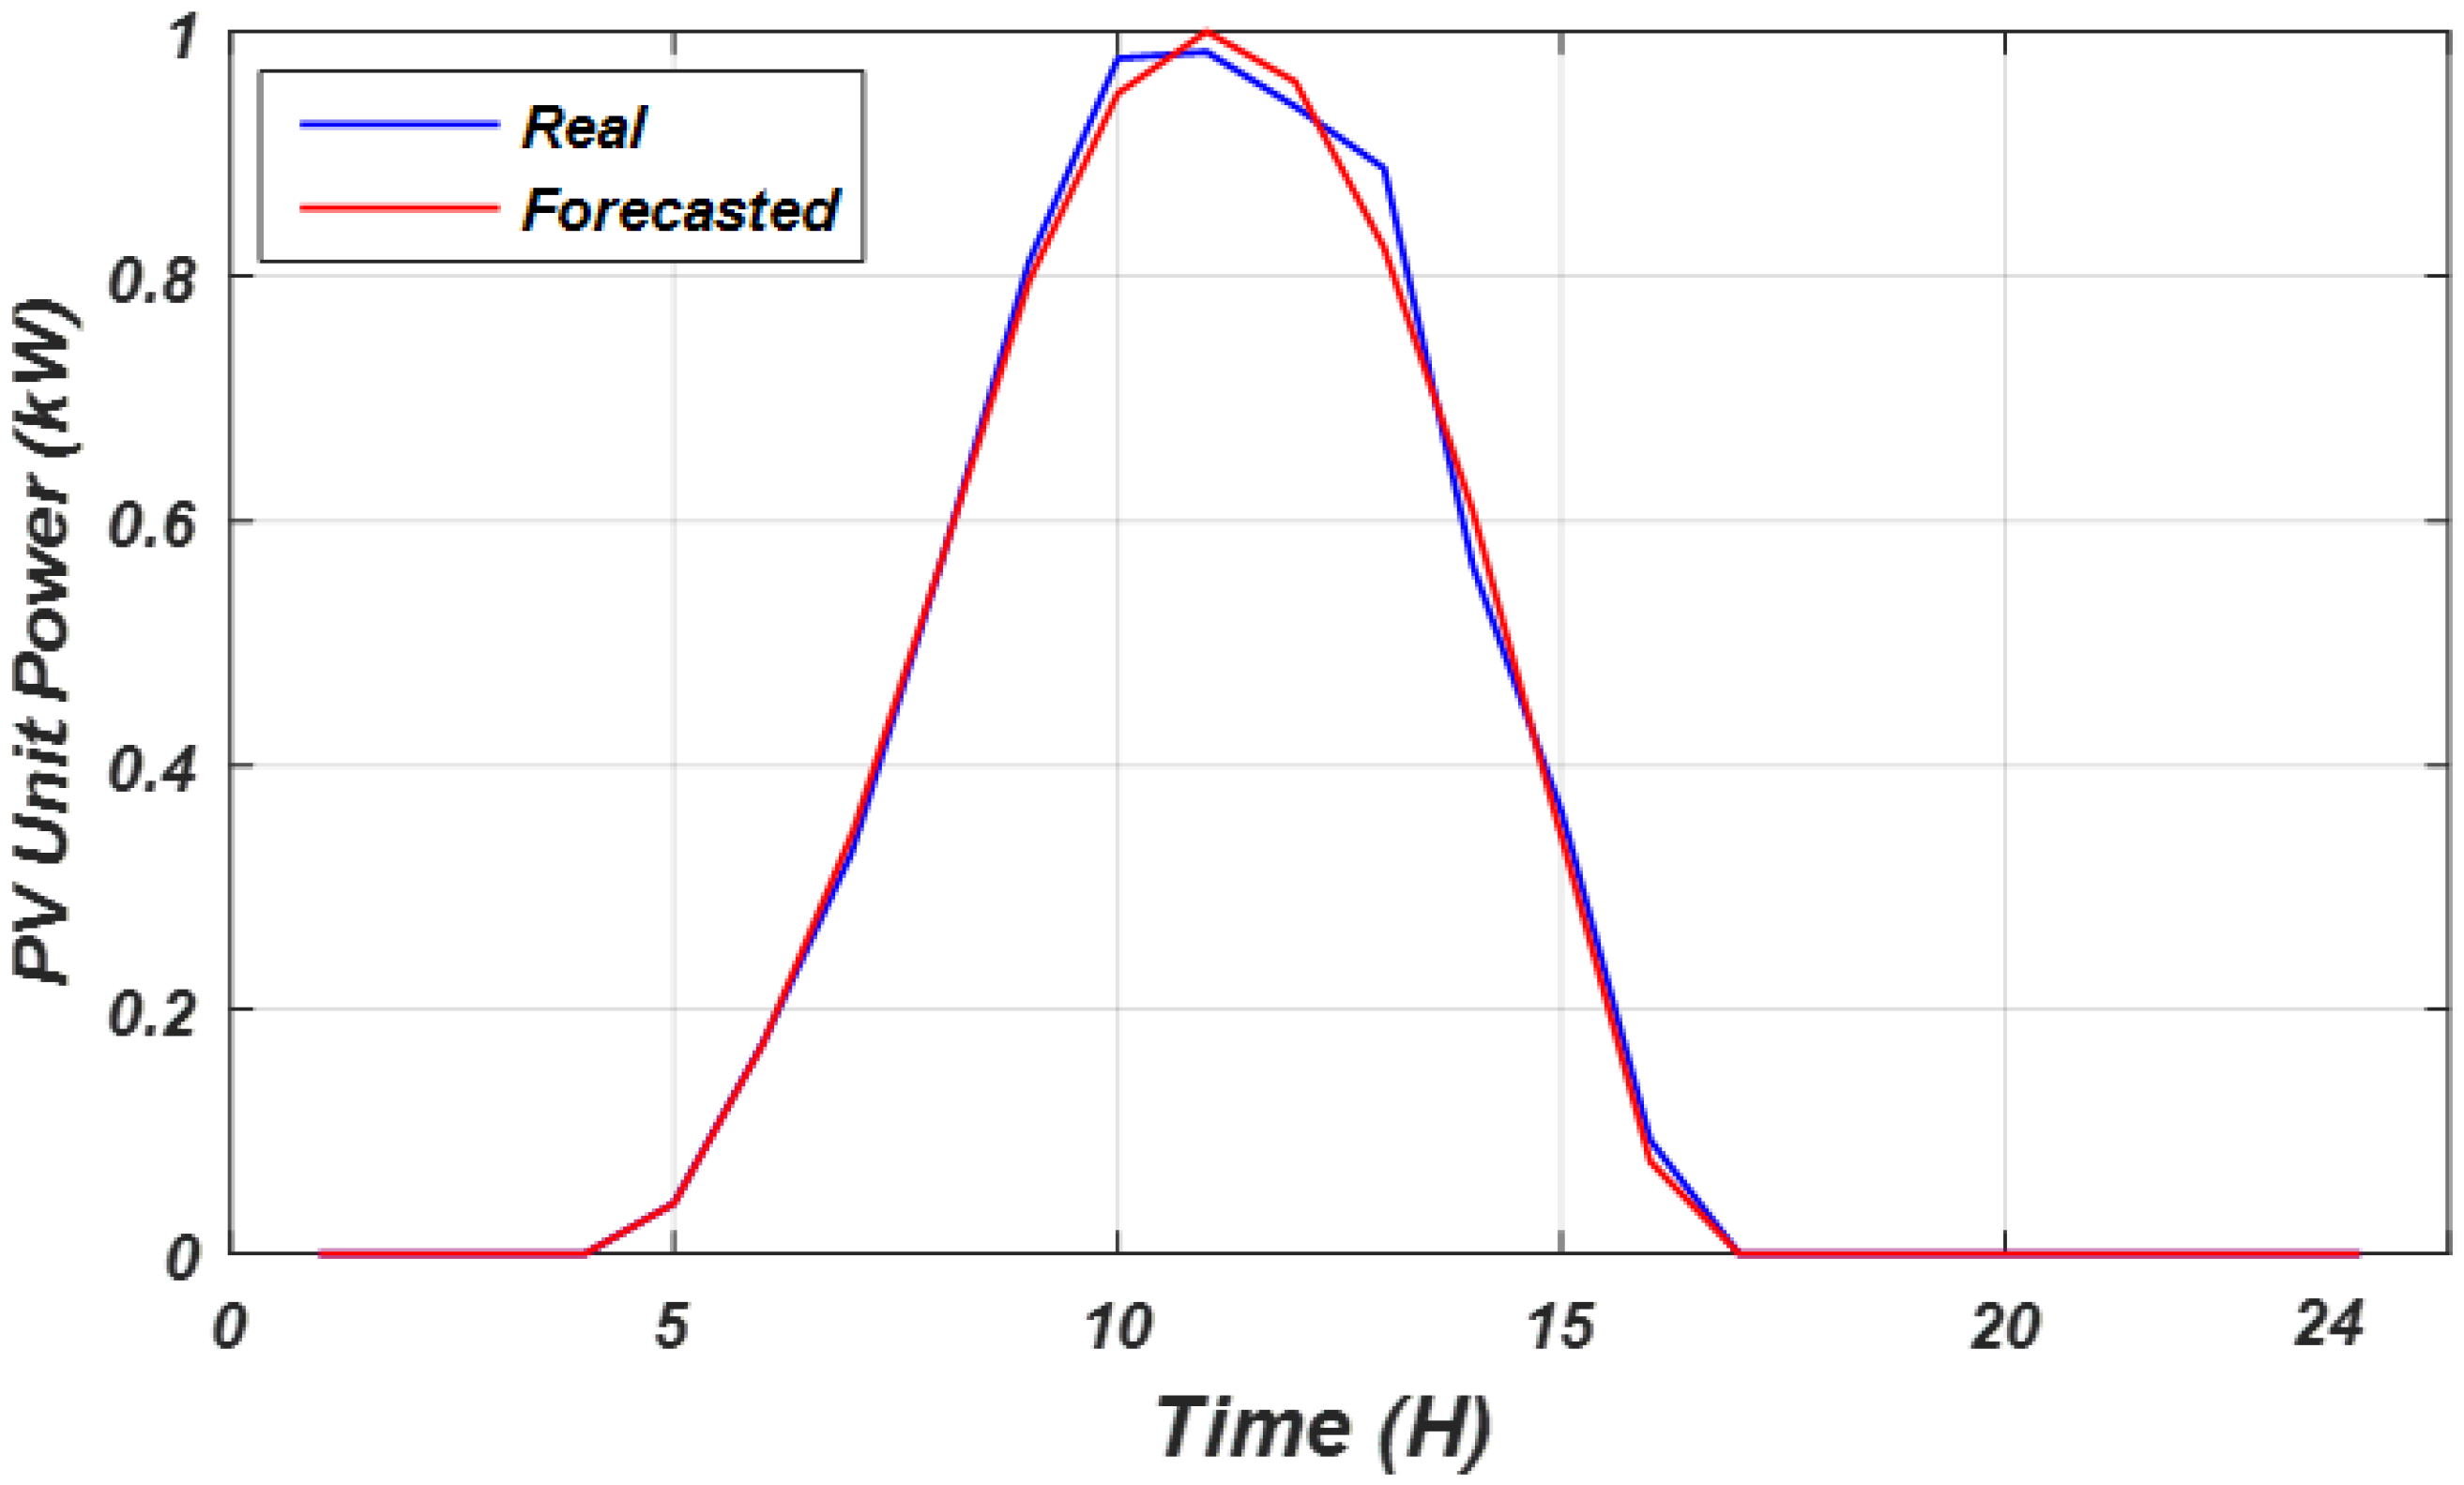
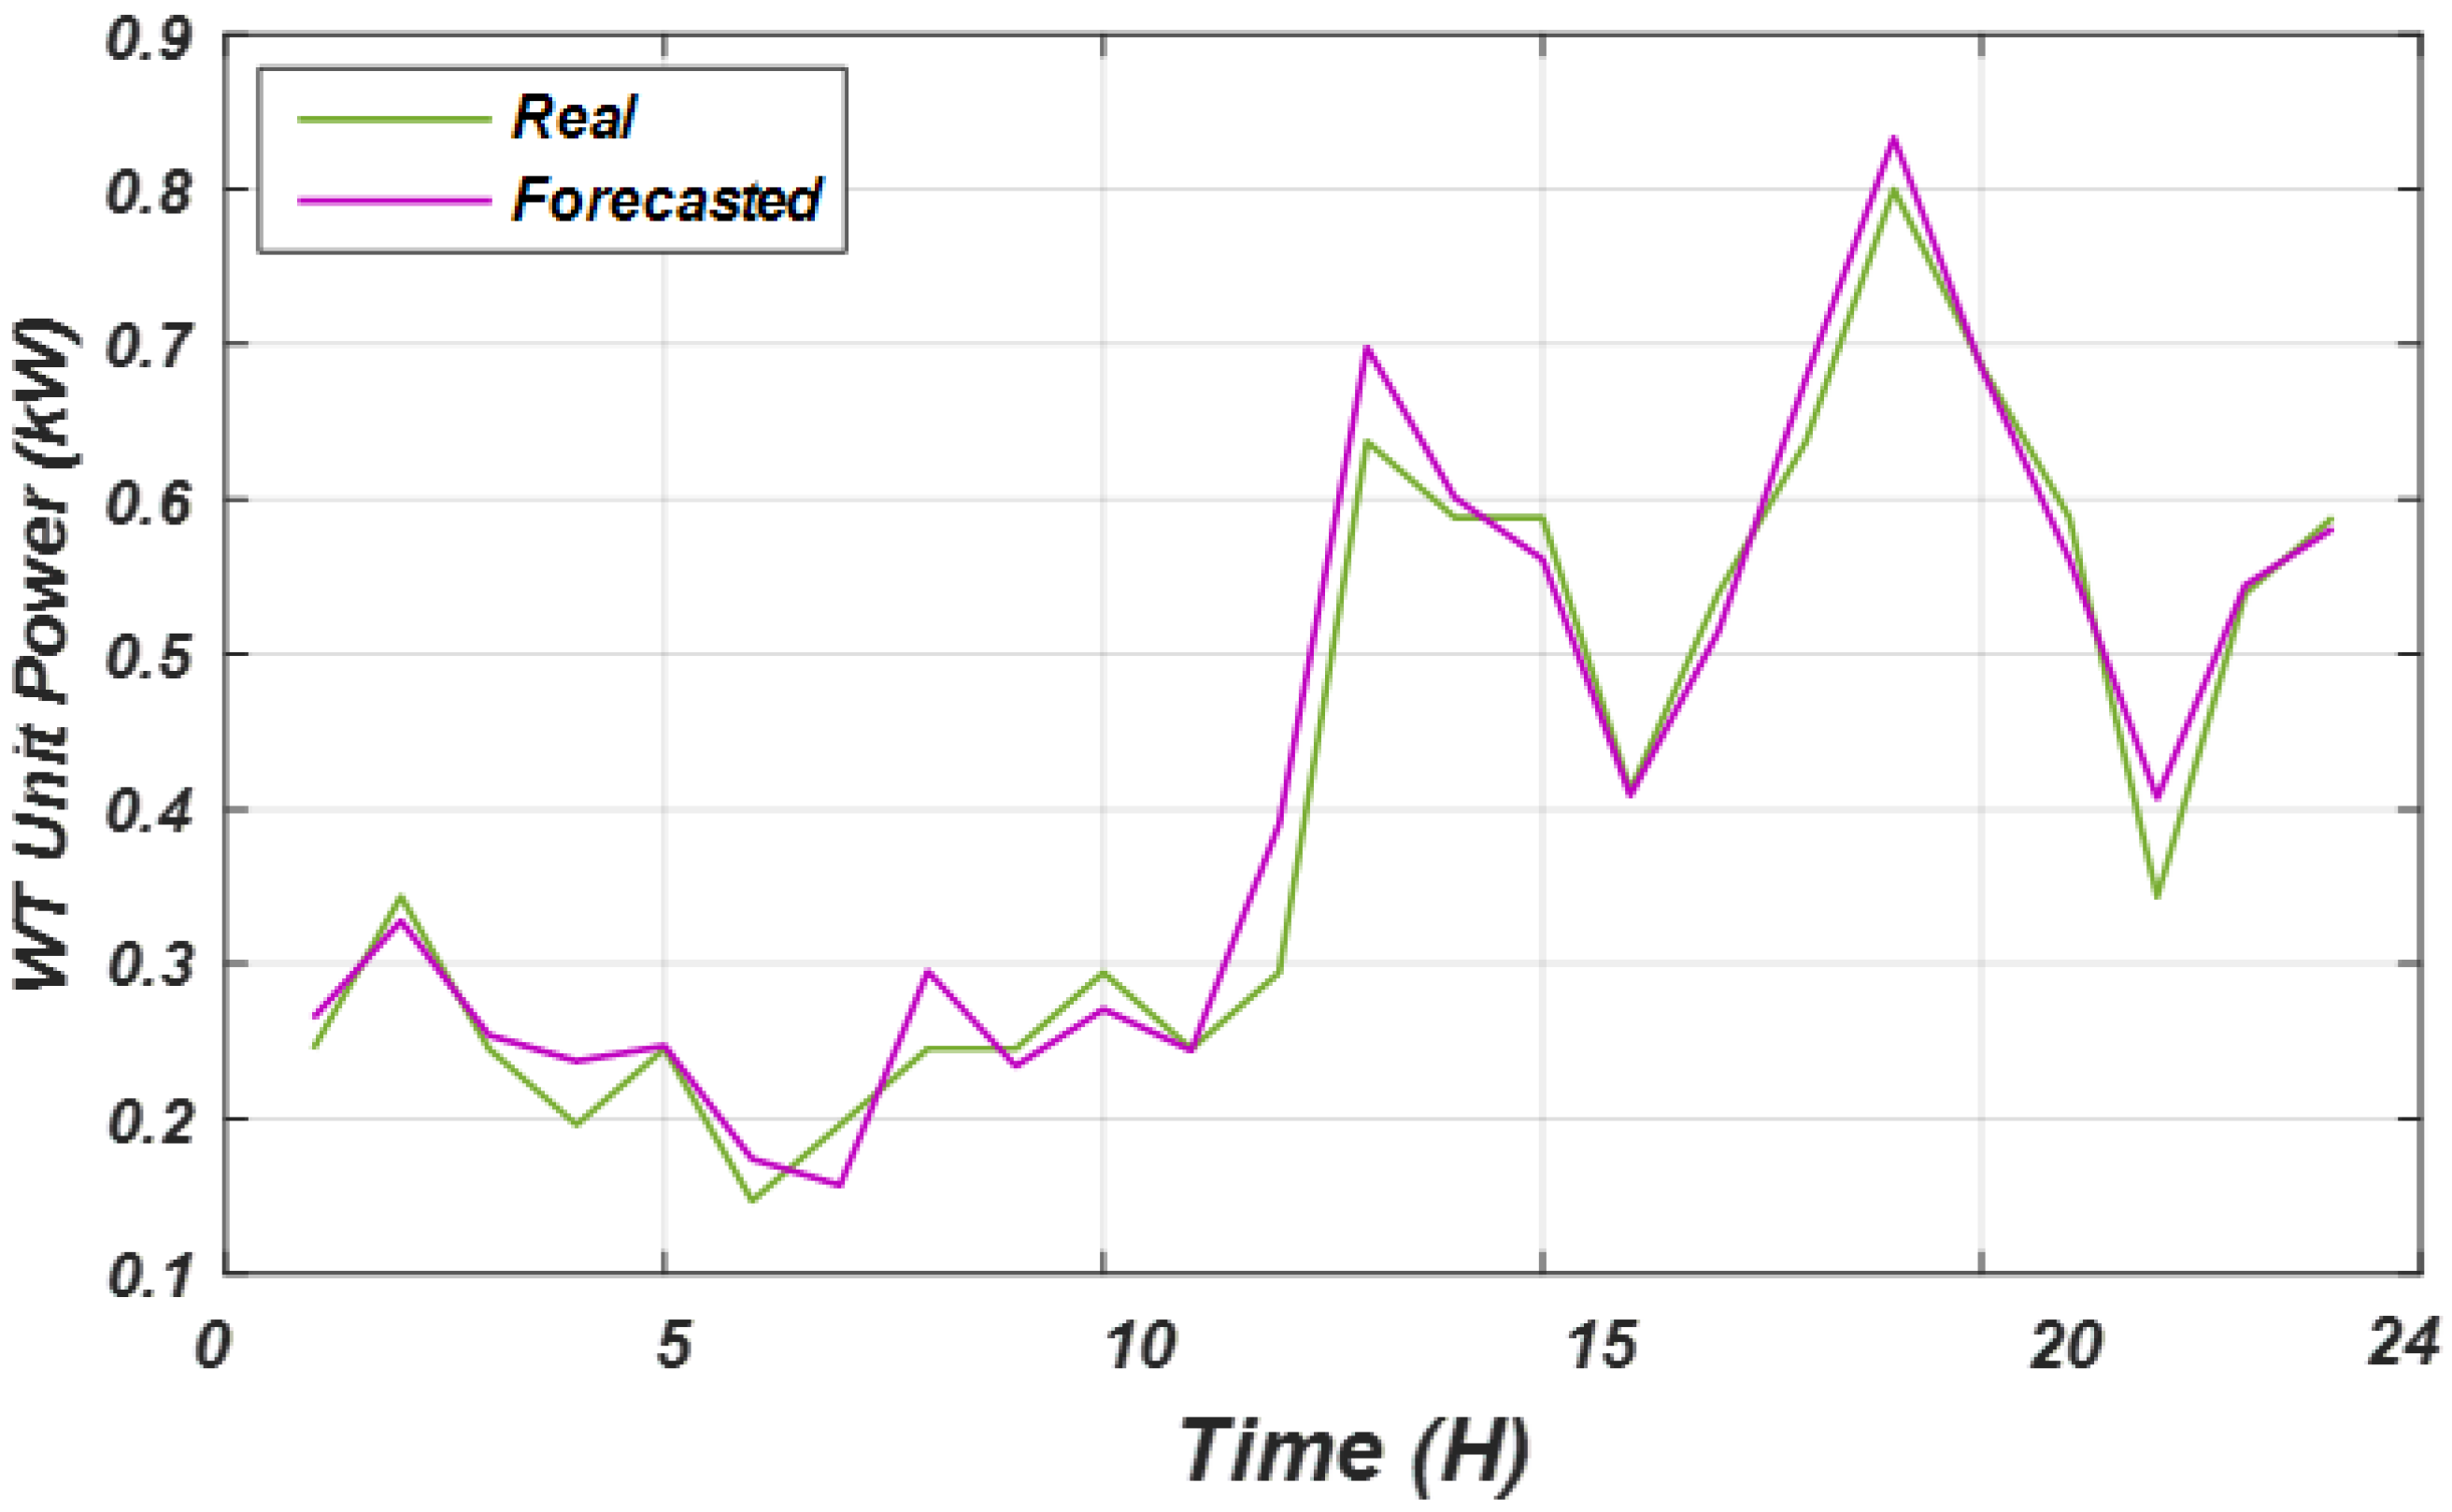
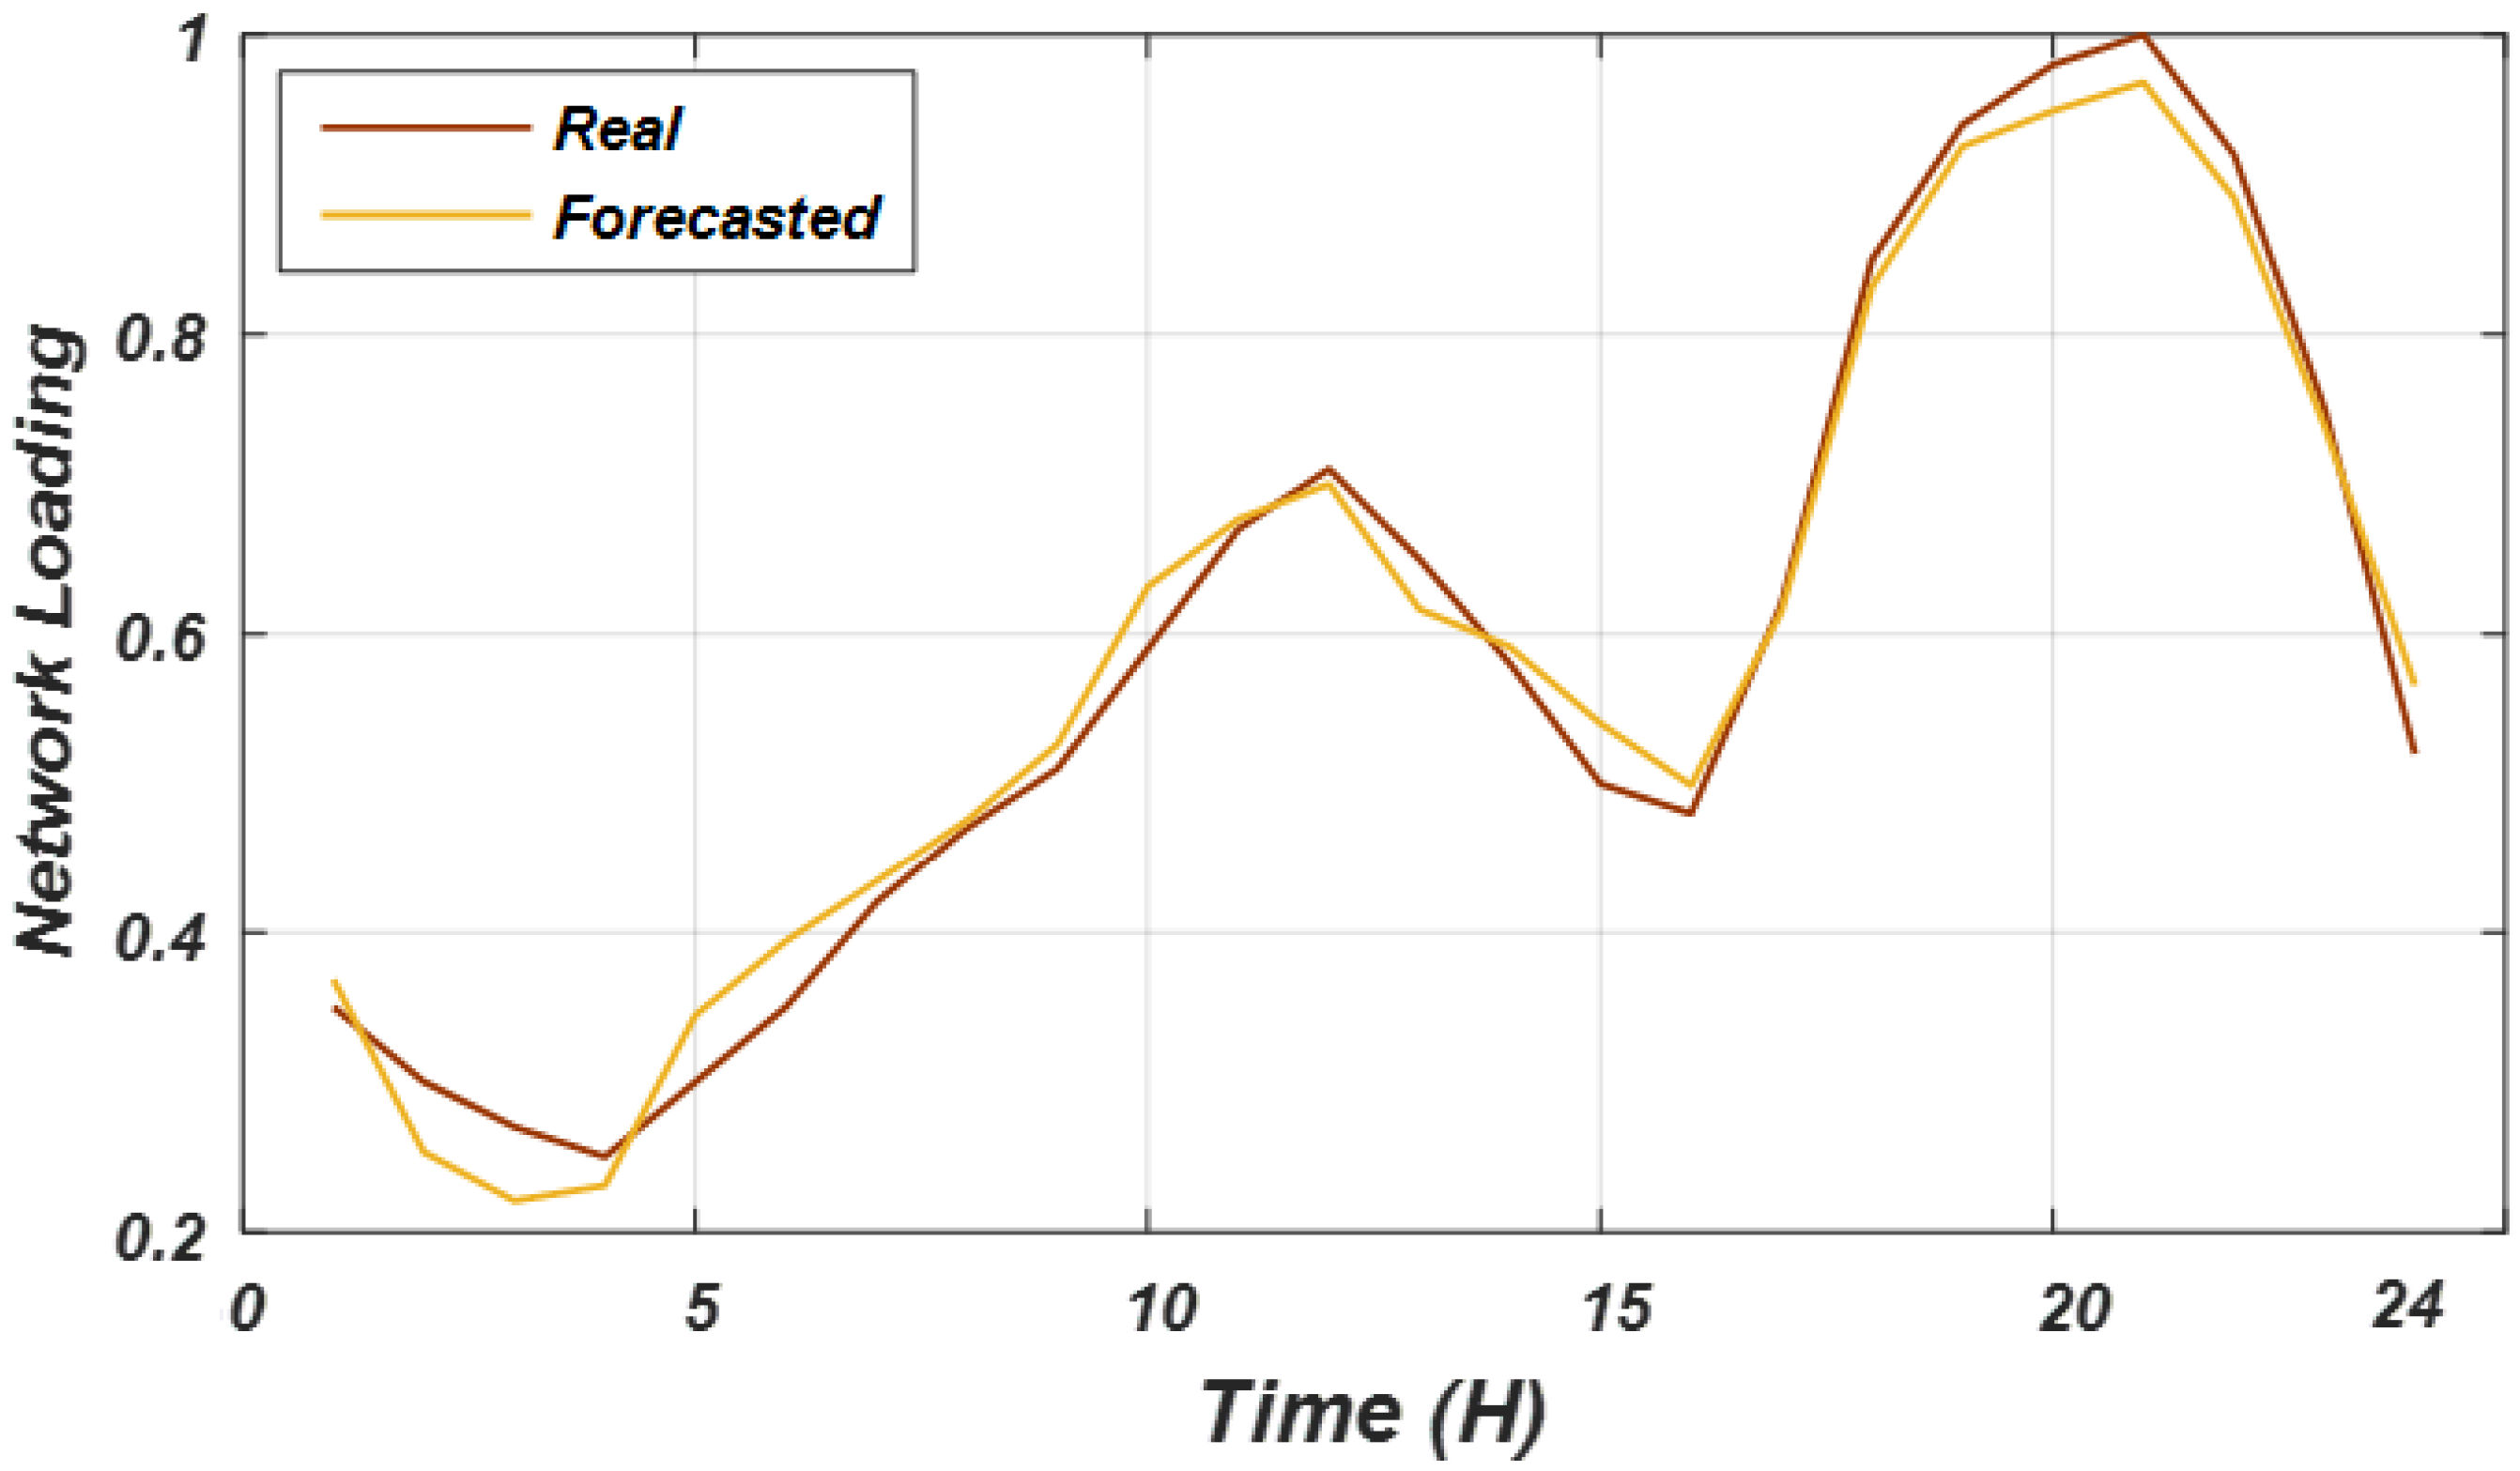
- Hybrid Forecasting–Optimization Mechanism: Addressing the limited use of forecasting models in prior works [17,20,25], a hybrid artificial neural network (ANN) model is embedded within the optimization framework. Through this hybridization, PV, WT, and load-profile forecasting accuracy are improved, resulting in improved reliability of stochastic planning and the overall decision-making process for RES–EBPL coordination.
- Enhanced Stochastic Modeling through UT–CQR Method: To avoid the computational complexity and accuracy issues of traditional stochastic approaches such as MCS and classical UT [8,19,24], this paper proposes a hybrid Unscented Transformation–Cubature Quadrature Rule (UT–CQR) method. The proposed method captures the probabilistic behavior of renewable generation and load demand more precisely with significantly reduced sampling requirements, facilitating efficient real-time operation of the proposed framework under uncertainty.
- Scenario-Based Comparative Analysis: The performance of the proposed model is examined across five distinct operational scenarios that sequentially add EBPLs, demand response (DR), forecast data, and stochastic modeling. The multi-scenario analysis provides a comprehensive overview of the role of each functional module in reducing costs, emissions, and the reliability index in practical distribution-network environments.
- Cumulative Improvement: In summary, the proposed methodology offers a methodologically rigorous and computationally efficient solution to multi-objective stochastic optimization in smart grids. It lays the groundwork for future research on improving the sustainability, emission footprint, and reliability of power distribution systems with renewable generation and large-scale electric–mobility infrastructure.
2. Methodology
2.1. Devices Modeling
2.1.1. WT Model
2.1.2. PV Model
2.1.3. EBPL Model
2.2. Objective Functions
2.2.1. Maximizing the Reliability
2.2.2. Minimizing the Operating Cost
2.2.3. Minimizing the Emission Cost
2.3. Constraints
2.3.1. WT Generation
2.3.2. PV Generation
2.3.3. EBPL
2.3.4. Grid Power
2.3.5. Power Balance
2.3.6. Network Bus Voltage
2.3.7. Network Line Current
2.4. Proposed Forecasting Approach
2.4.1. Hybrid ESCHO-ANN Forecasting Approach
2.4.2. The Data Preprocessing Procedure
2.4.3. Model Performance Assessment and Outcomes
2.5. Proposed Stochastic Approach
- Cubature point selection
- Propagation through the nonlinear function
- Mean estimation
- Covariance estimation
| Algorithm 1. Pseudocode of the UT-CQR approach |
| Input: Mean of input state: μ_x Covariance of input state: σ_x Dimension of state: n Nonlinear function: f(·) Step 1: Generate Cubature Points For i = 1 to n: X_i = μ_x + sqrt(n) * e_i X_(i+n) = μ_x − sqrt(n) * e_i End Total cubature points = 2n Step 2: Propagation Through Nonlinear Function For each point X_i: Y_i = f(X_i) End Step 3: Compute Mean of Output μ_y = (1/(2n)) * Σ (Y_i), i = 1 to 2n Step 4: Compute Covariance of Output σ_y = (1/(2n)) * Σ ((Y_i − μ_y)(Y_i − μ_y)^T), i = 1 to 2n Output: Estimated mean μ_y Estimated covariance σ_y |
3. Numerical Results and Discussion
3.1. System Data and Simulation Cases
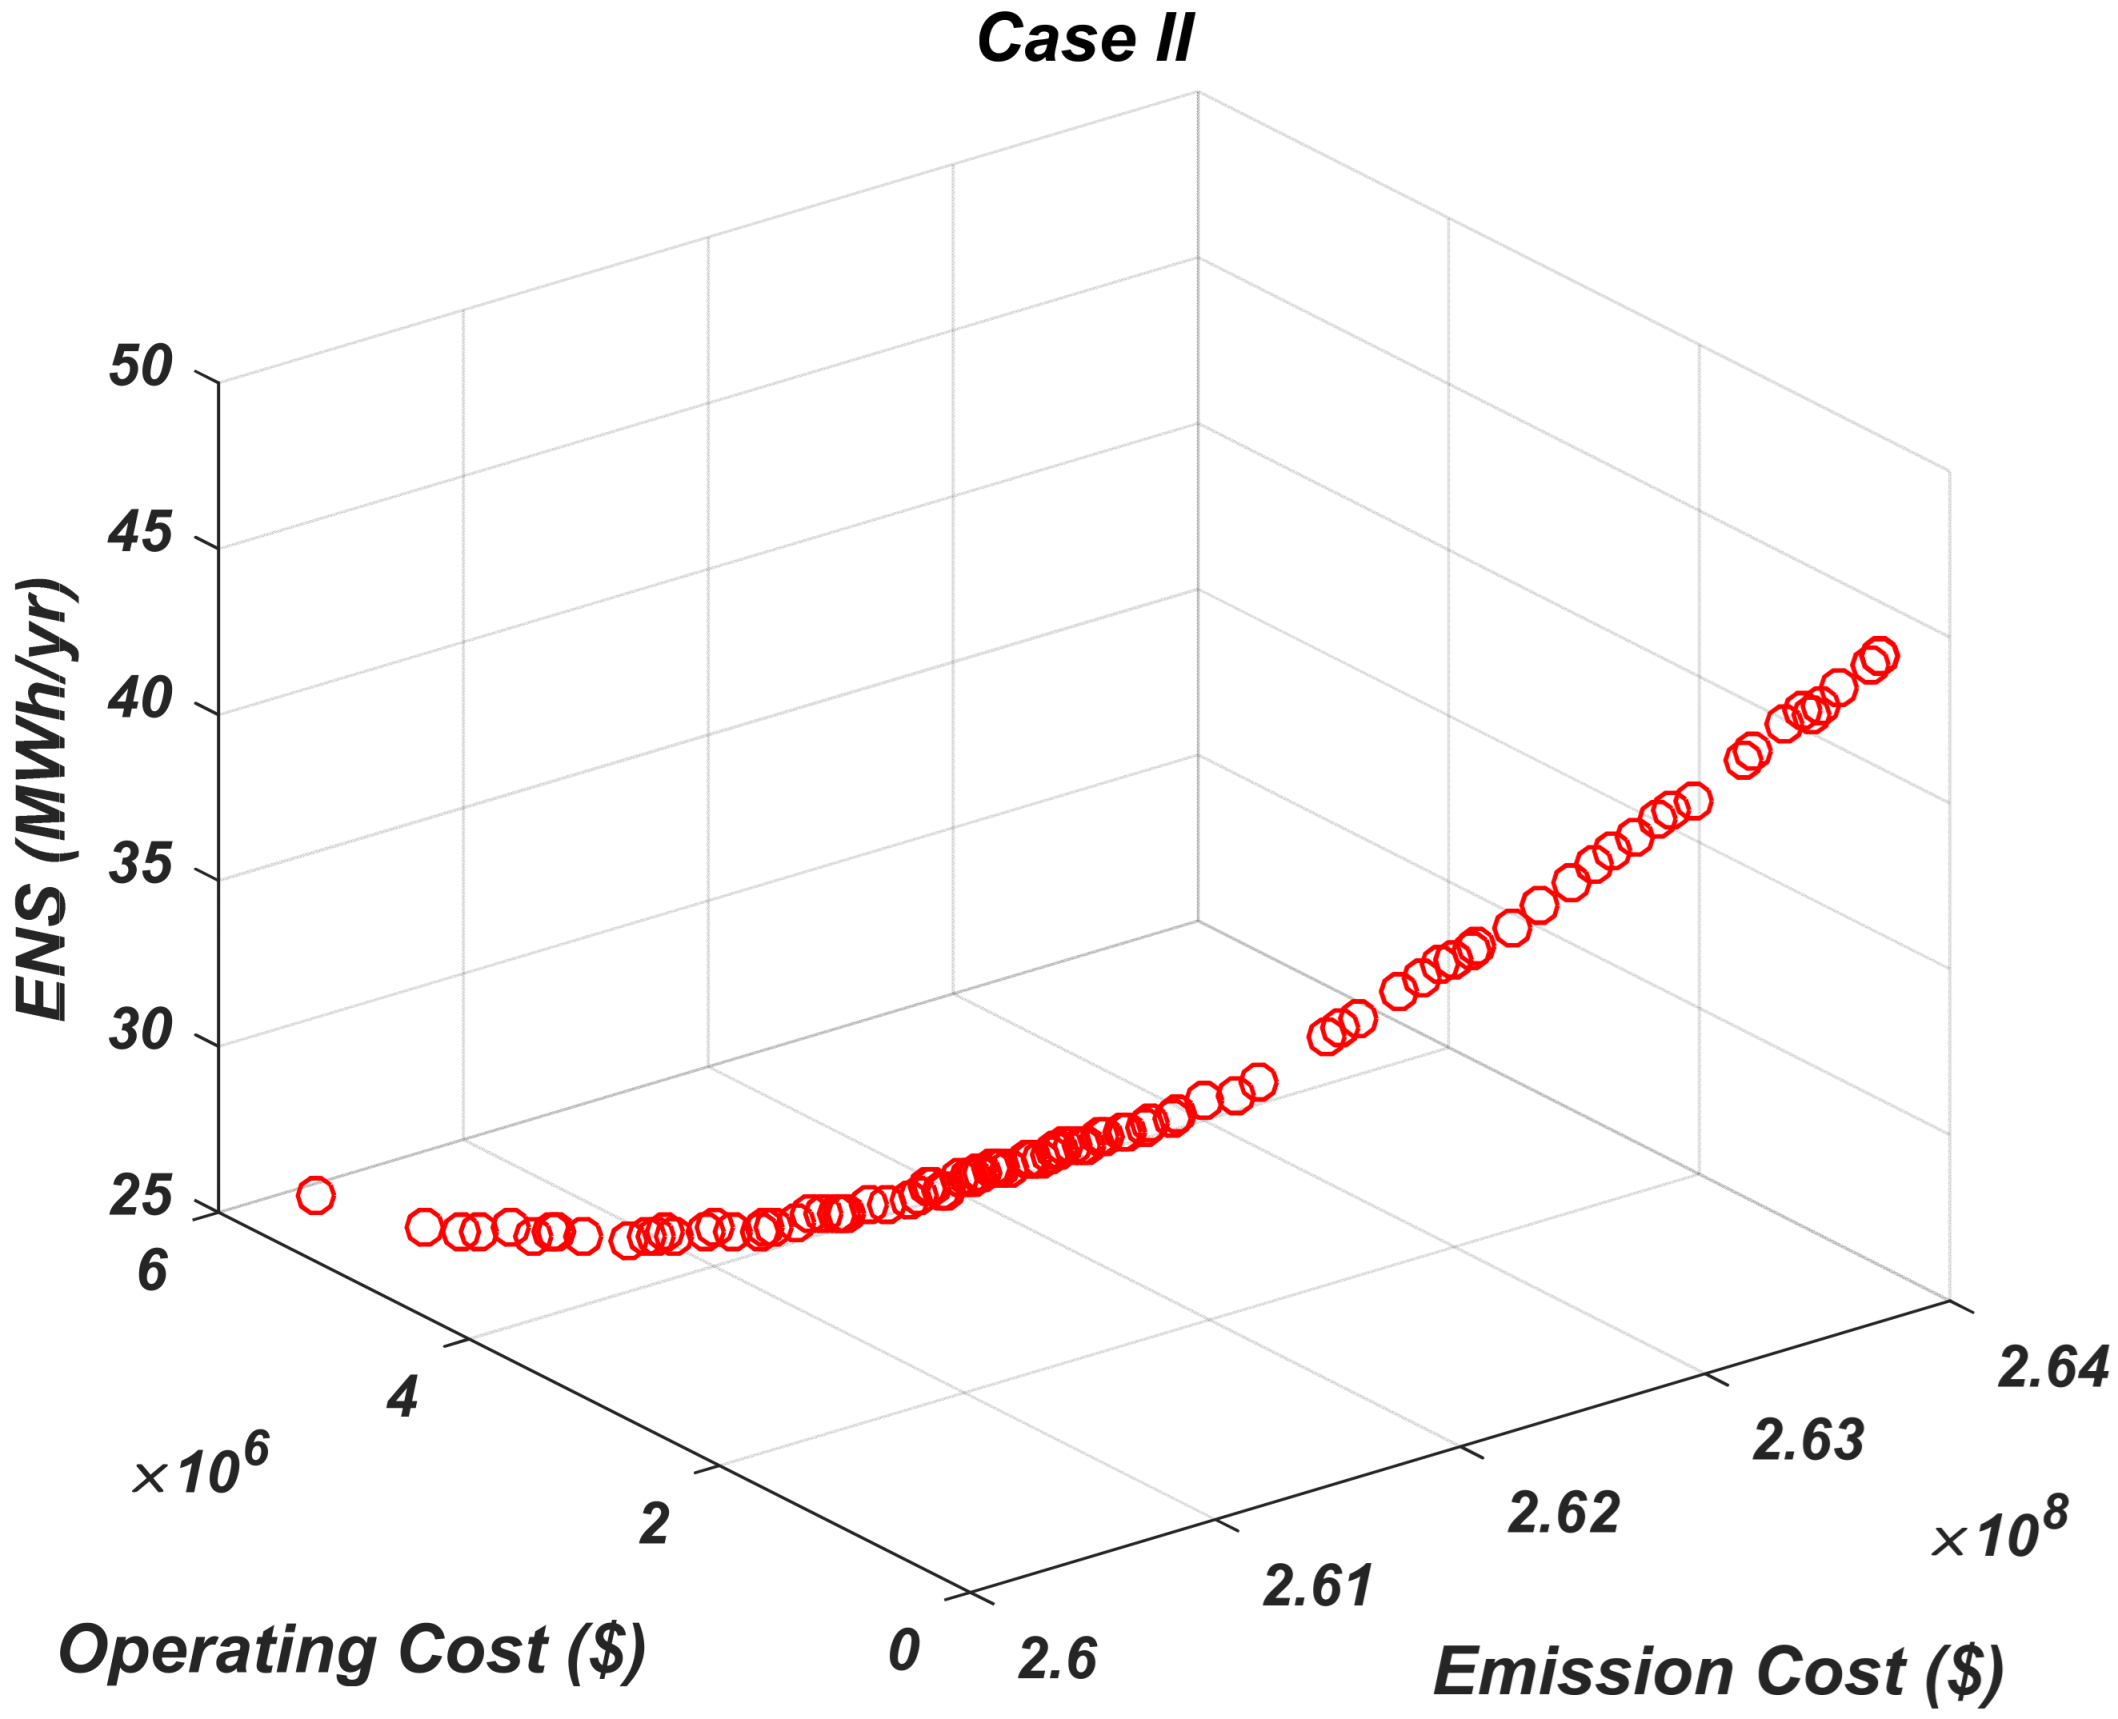
3.2. Results of Case I, RES Without EBPL with Real Data
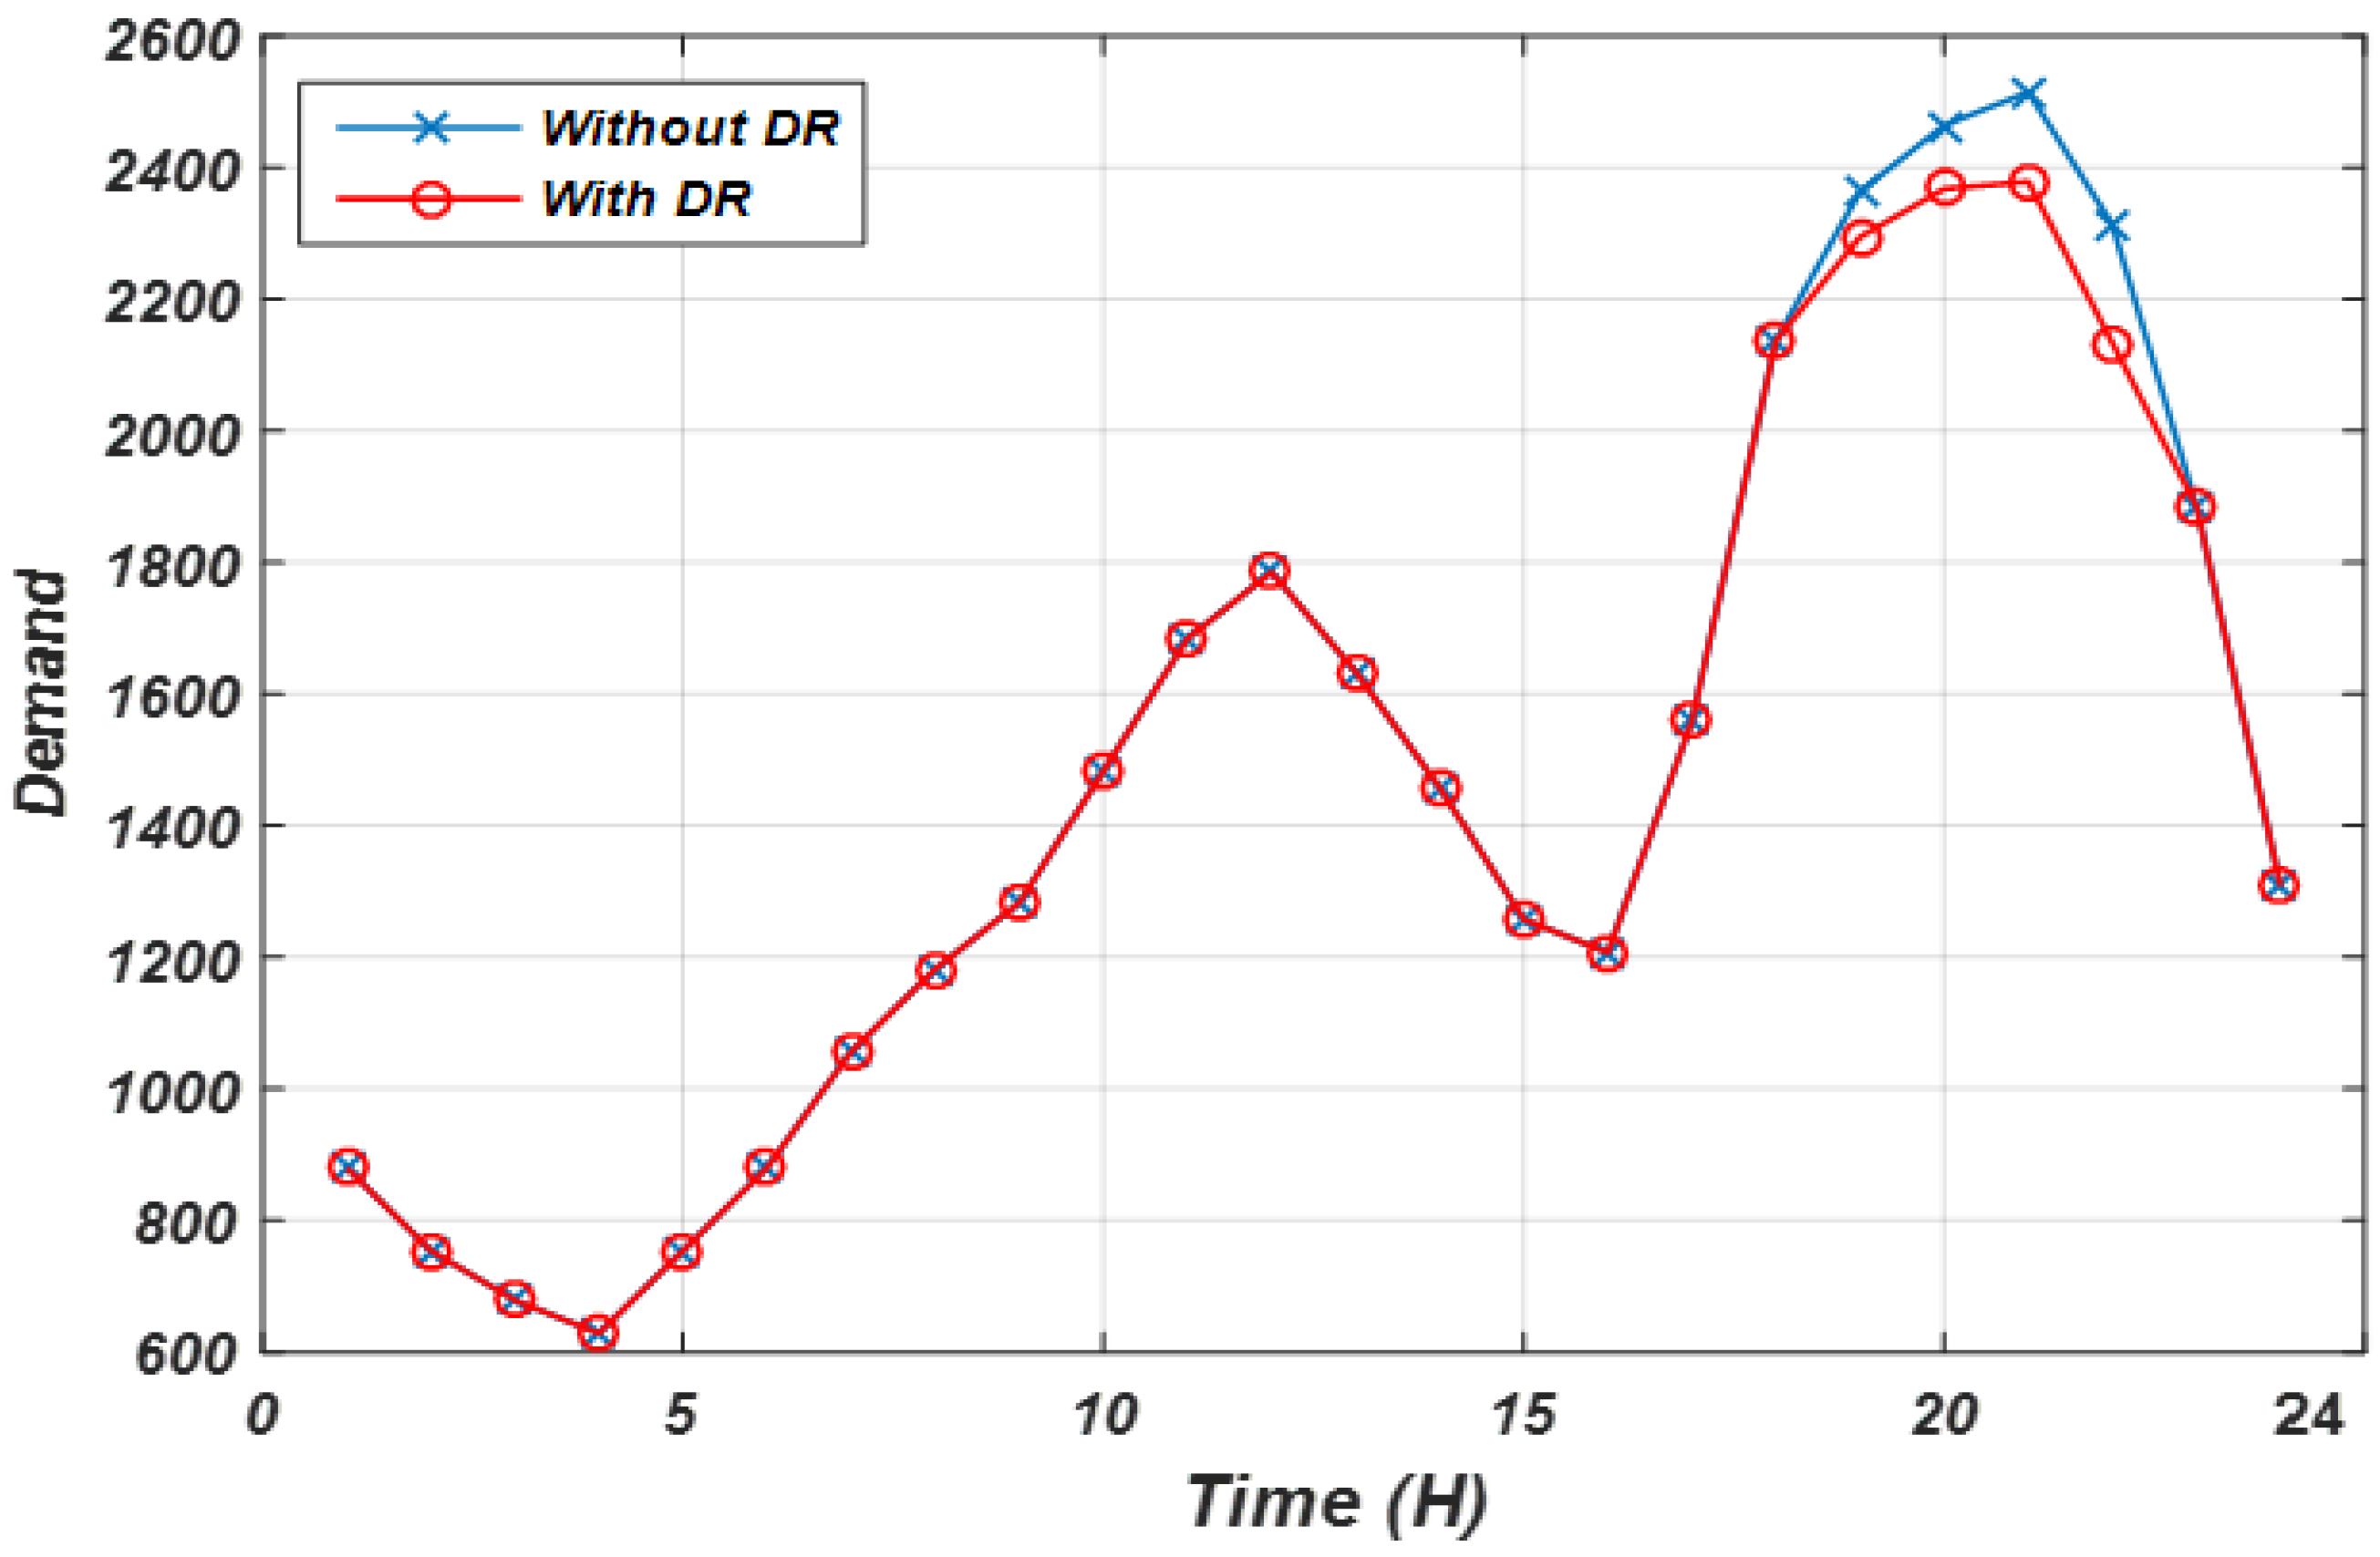
3.3. Results of Case III, RES with EBPL and DR
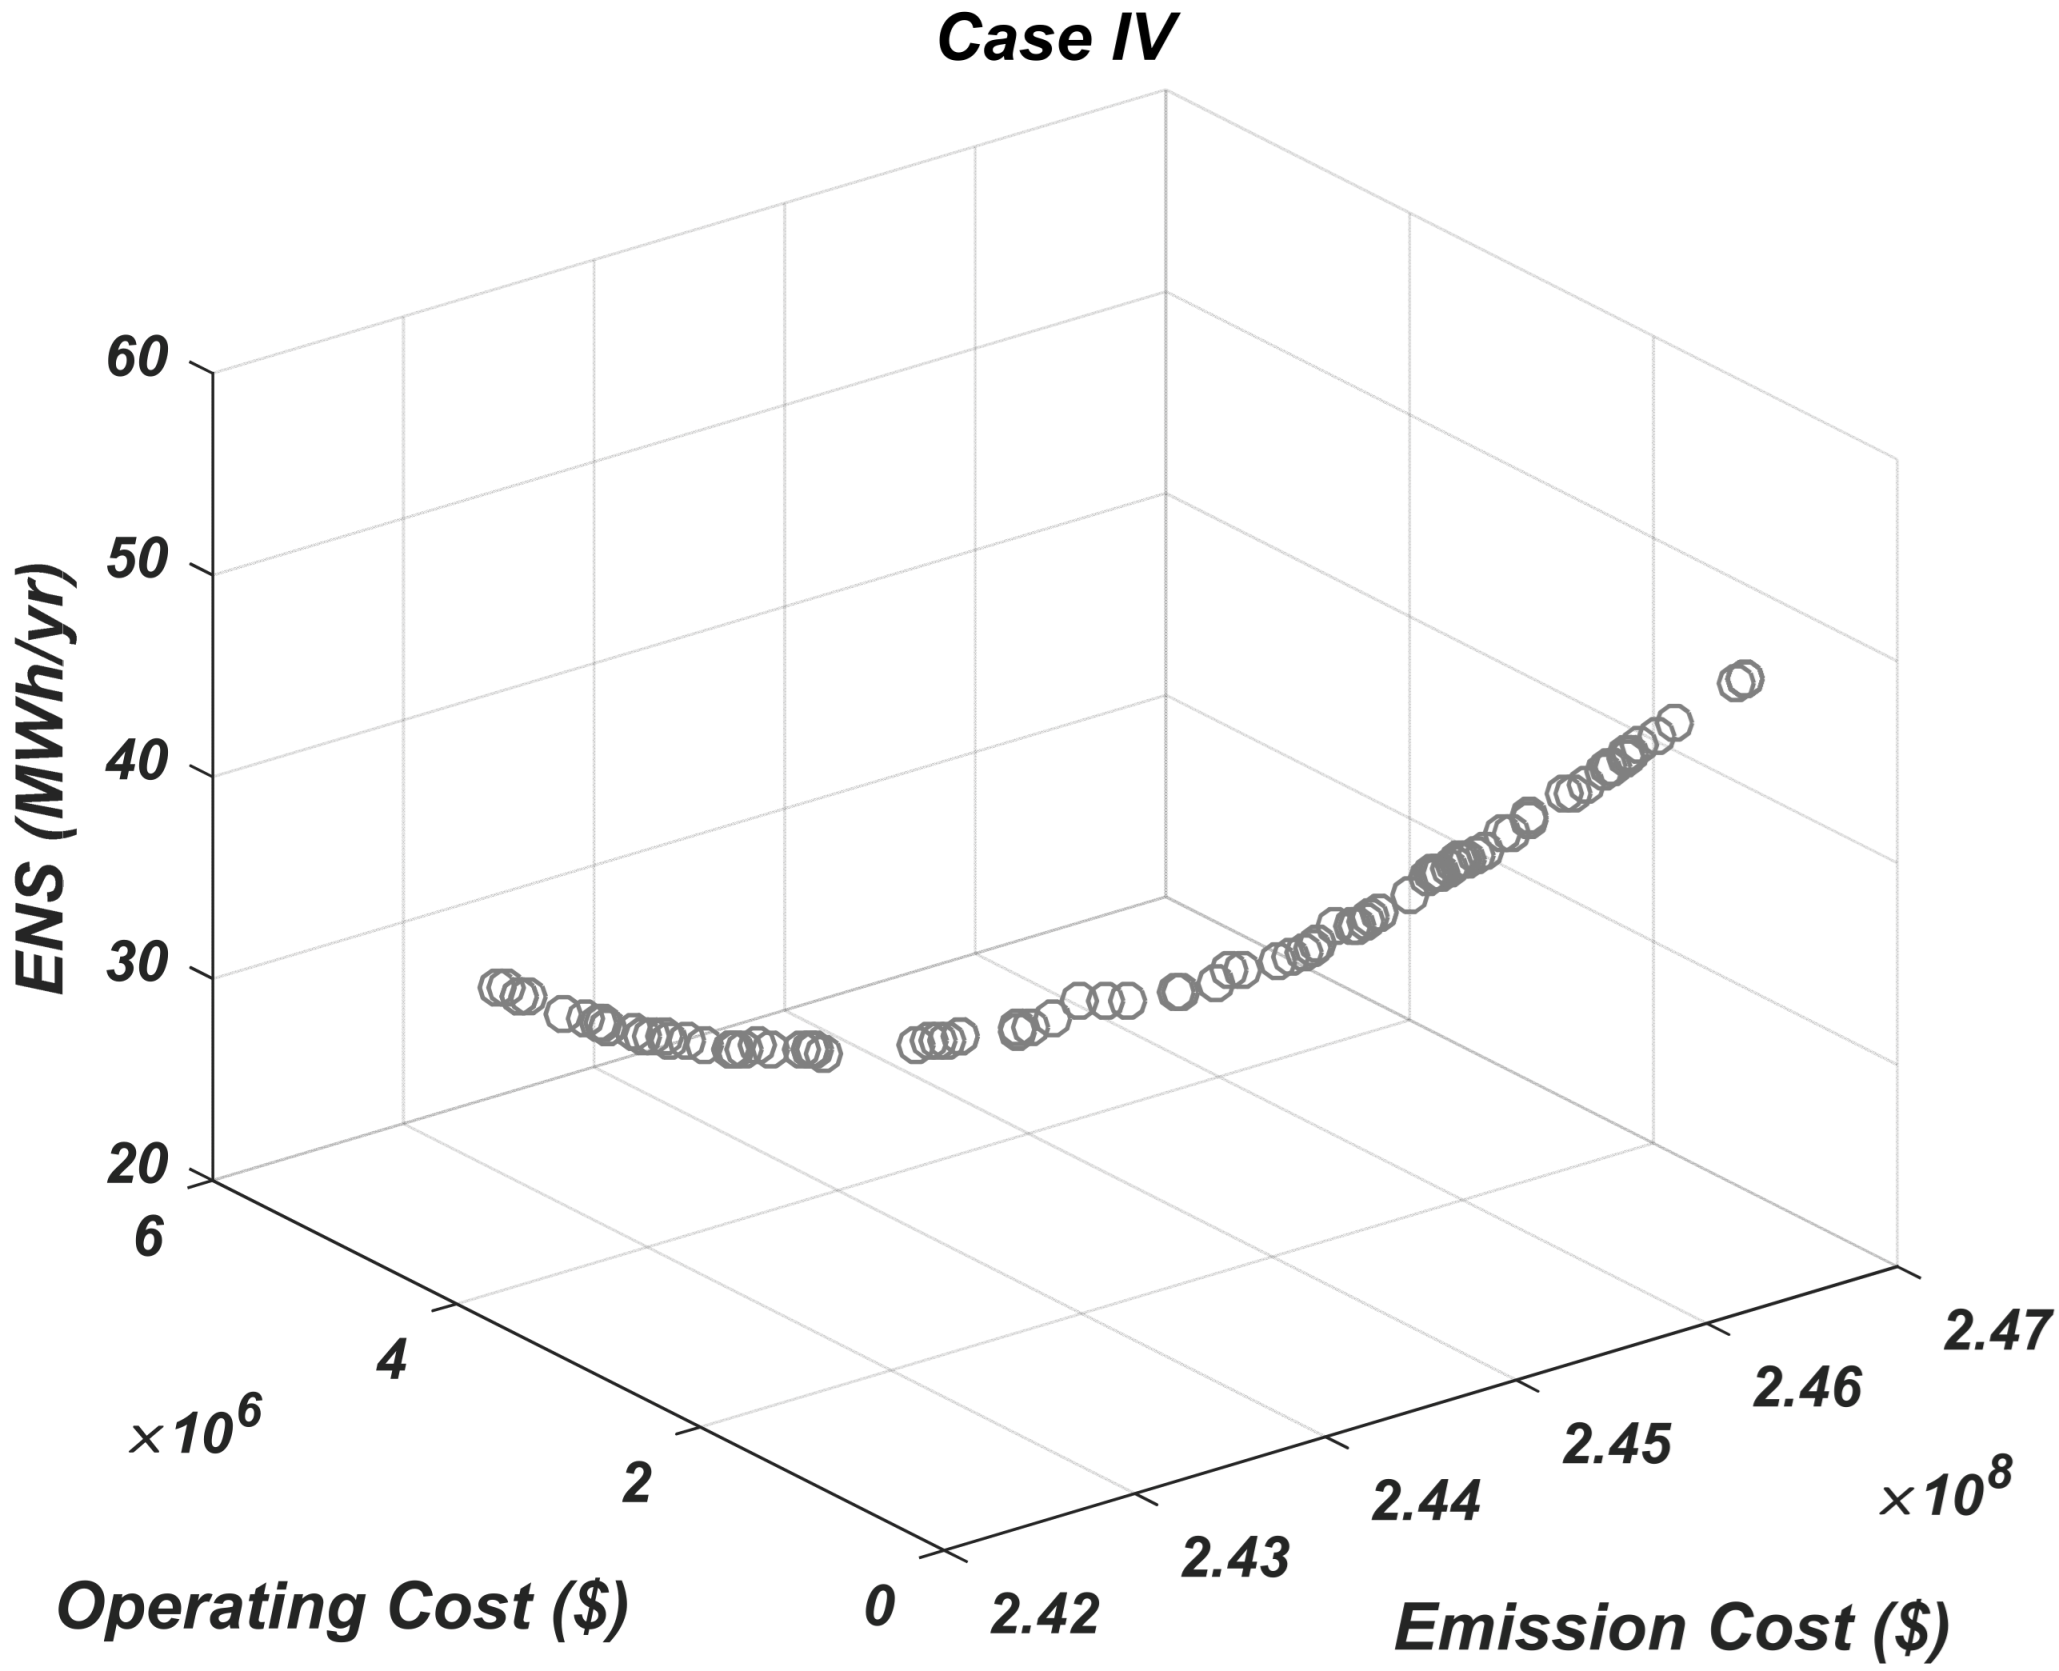
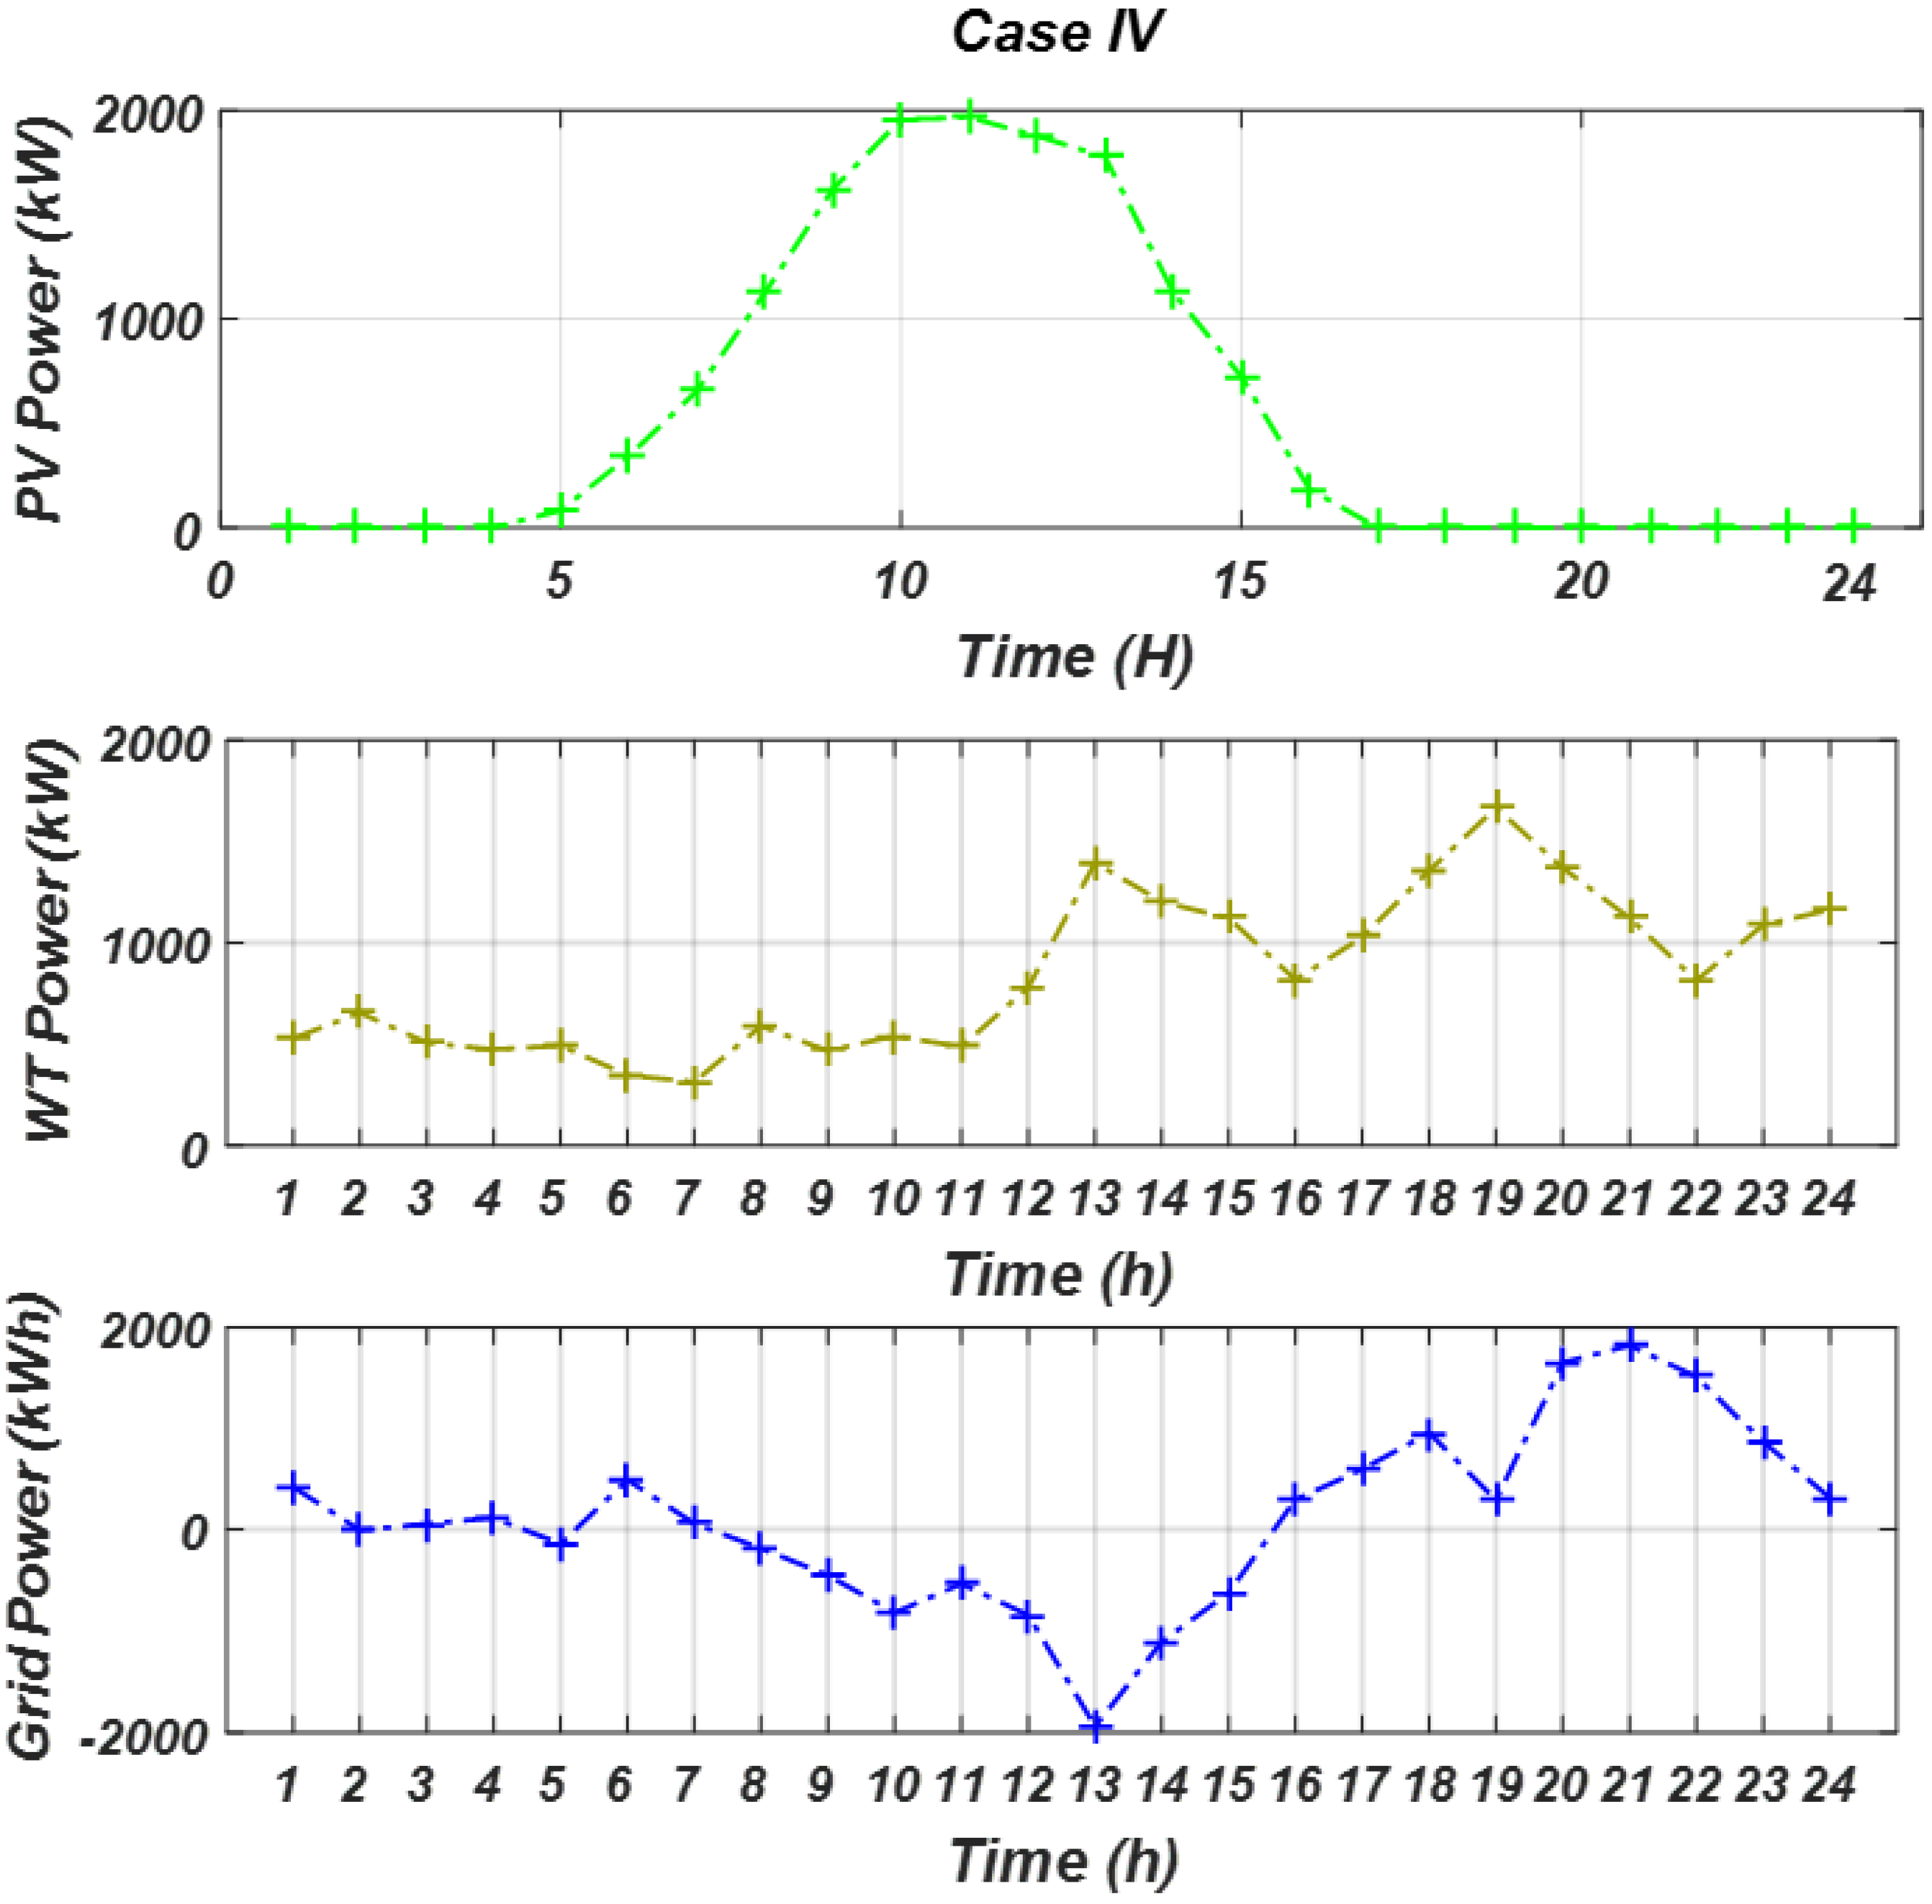
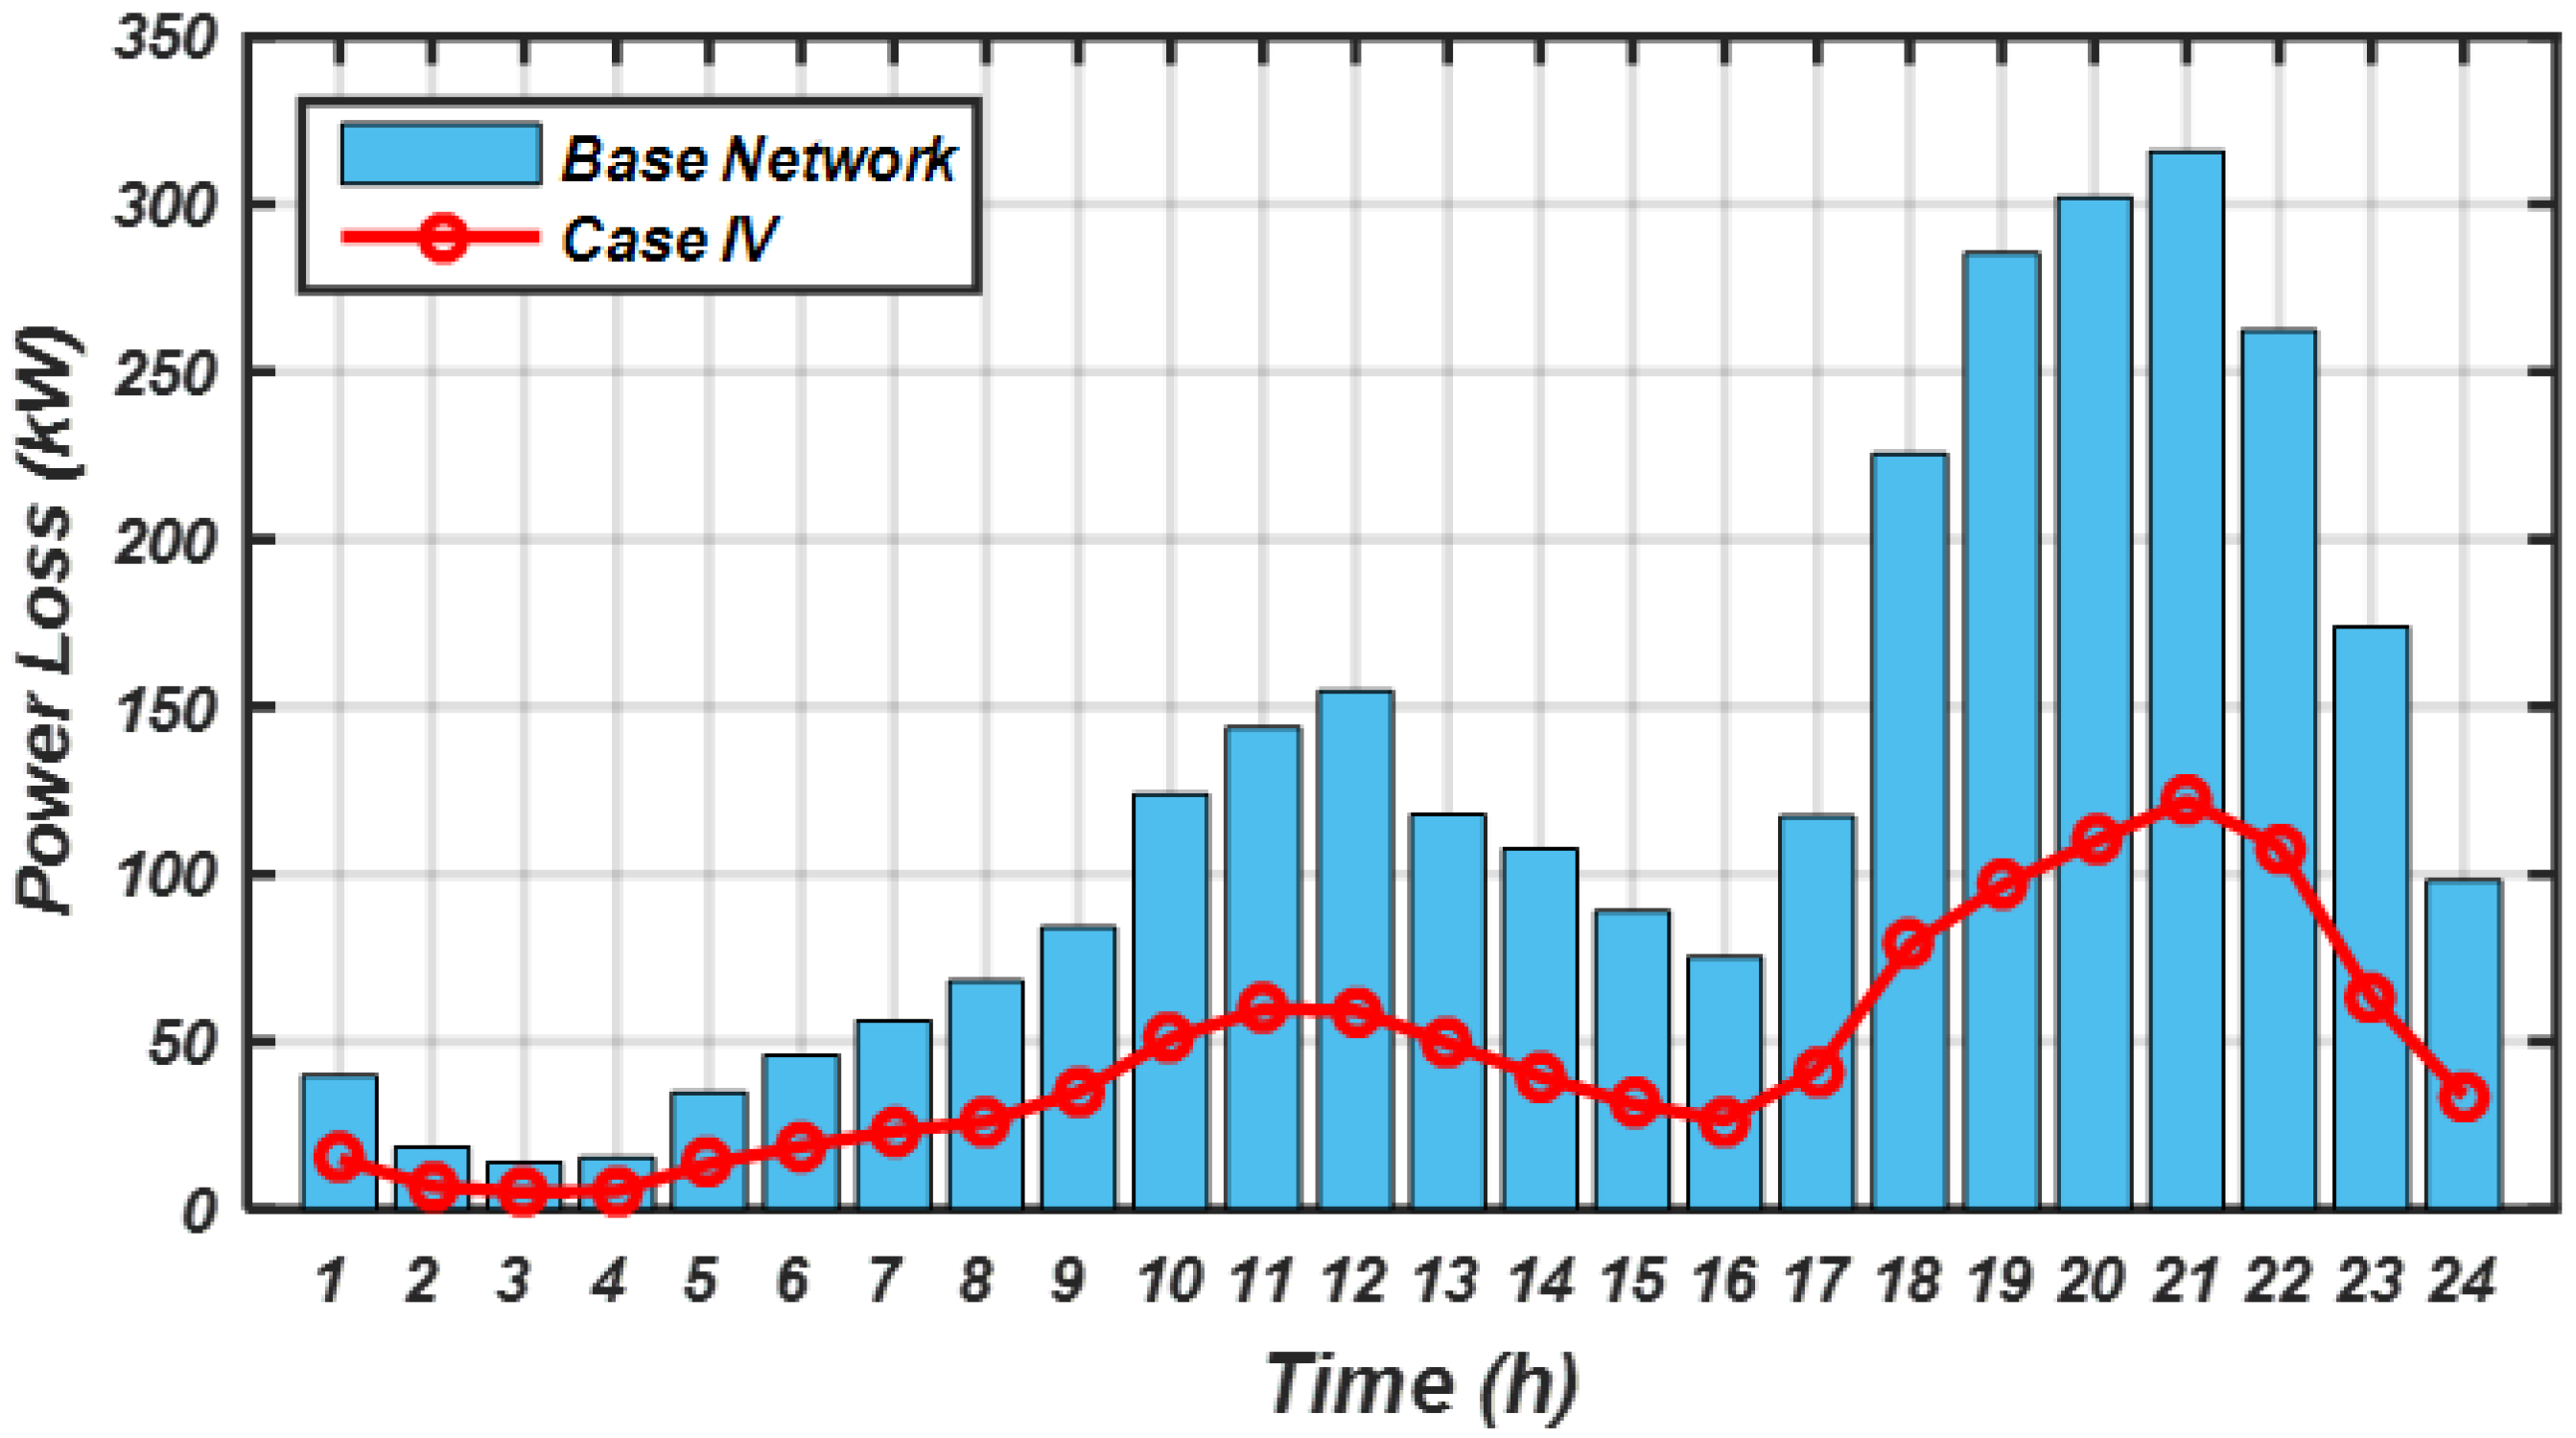
3.4. Results of Case IV, RES with EBPL Under Forecasted Data
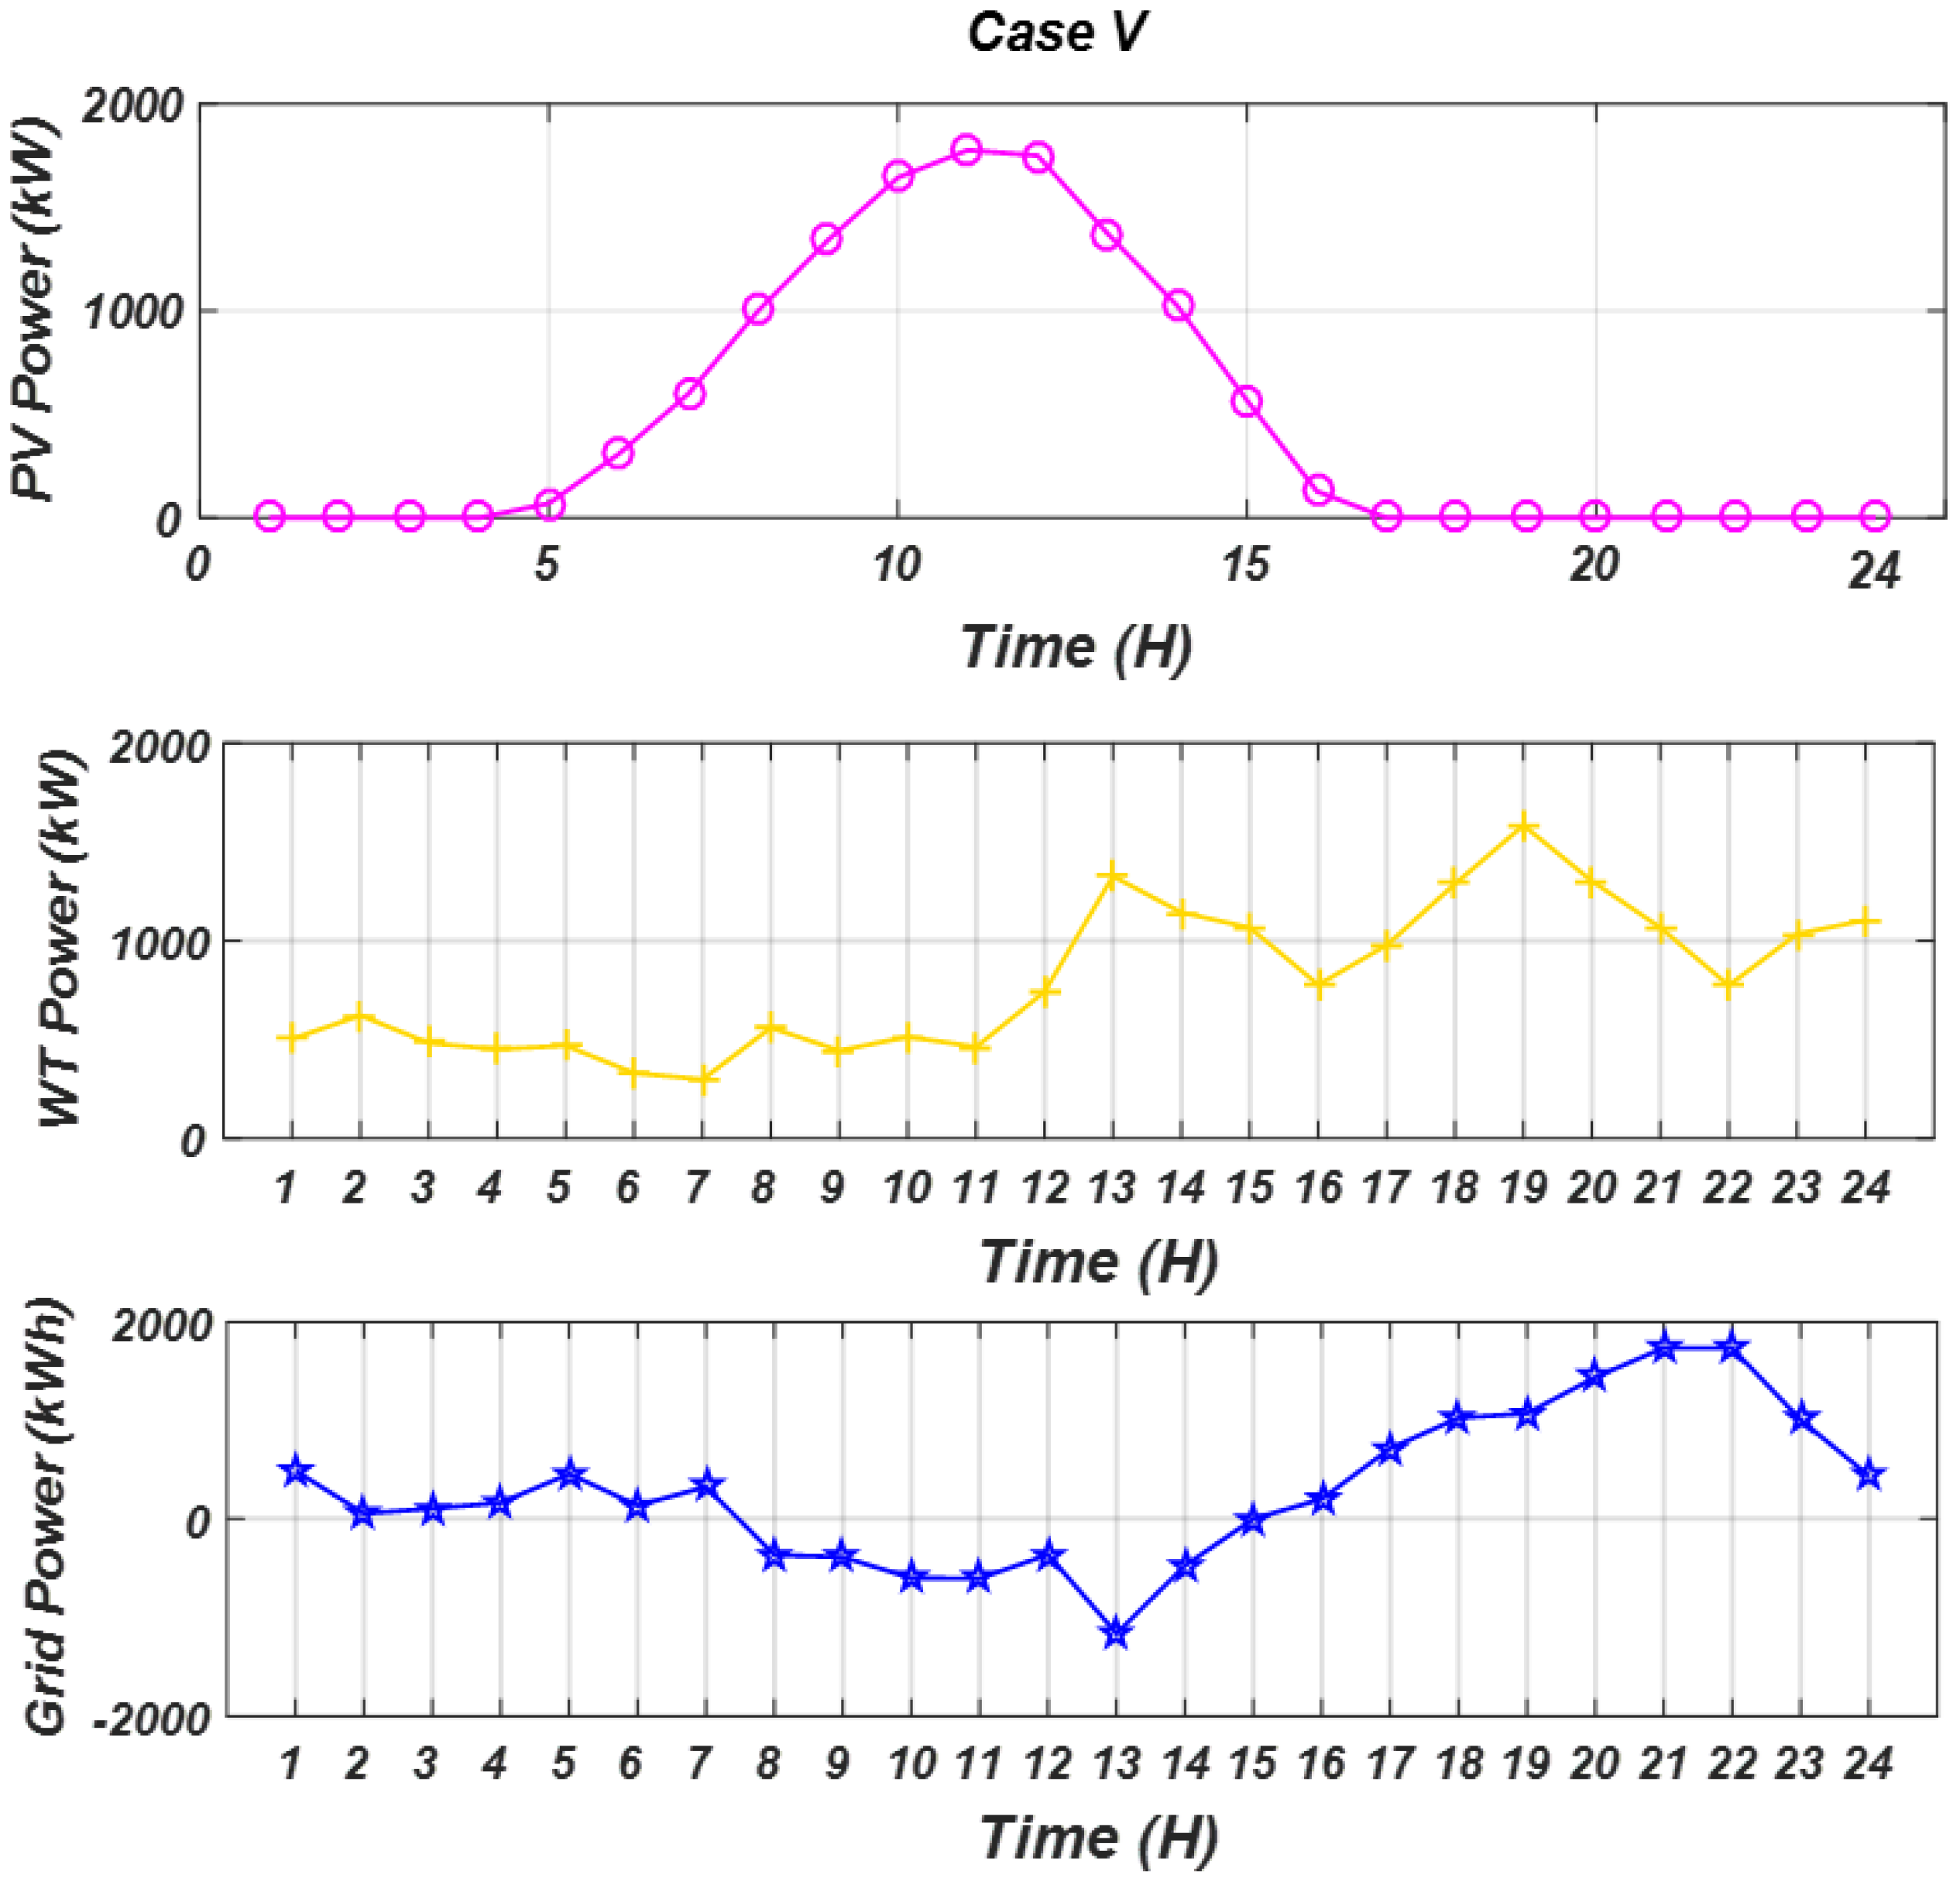
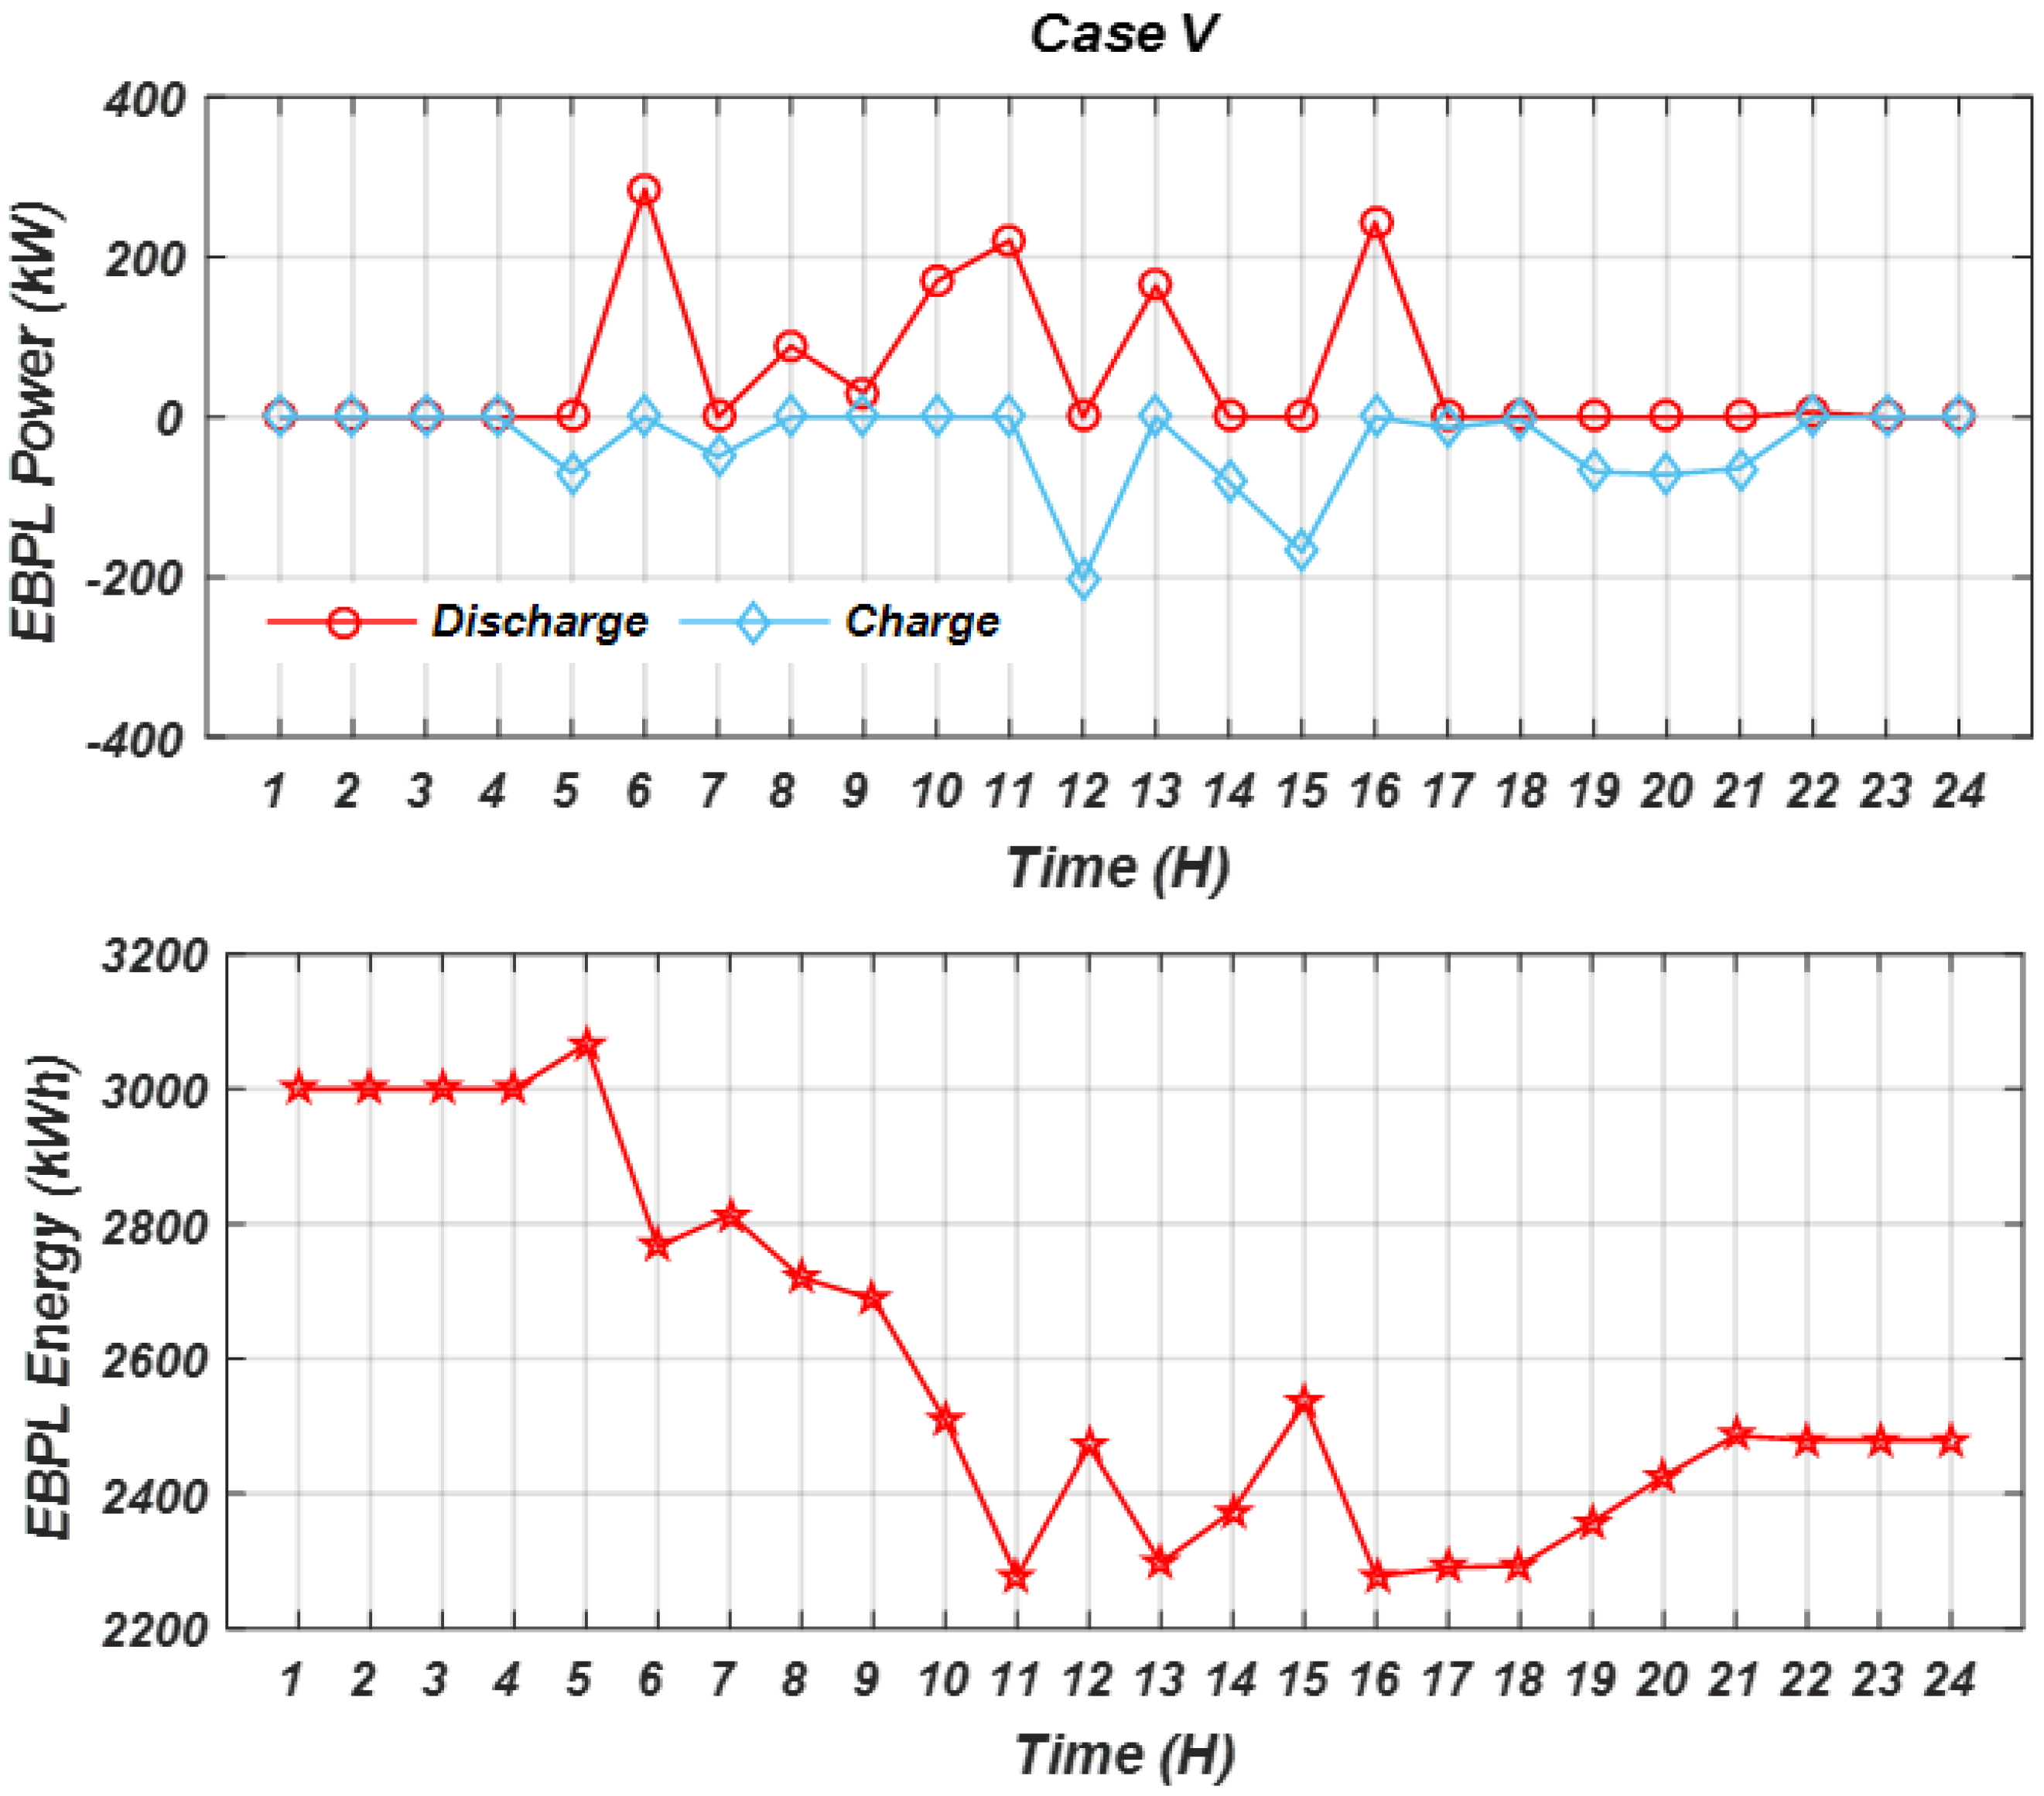
3.5. Results of Case V, RES with EBPL Under Forecasted Data and Stochastic Model
3.6. Comparison of the Scenarios Results
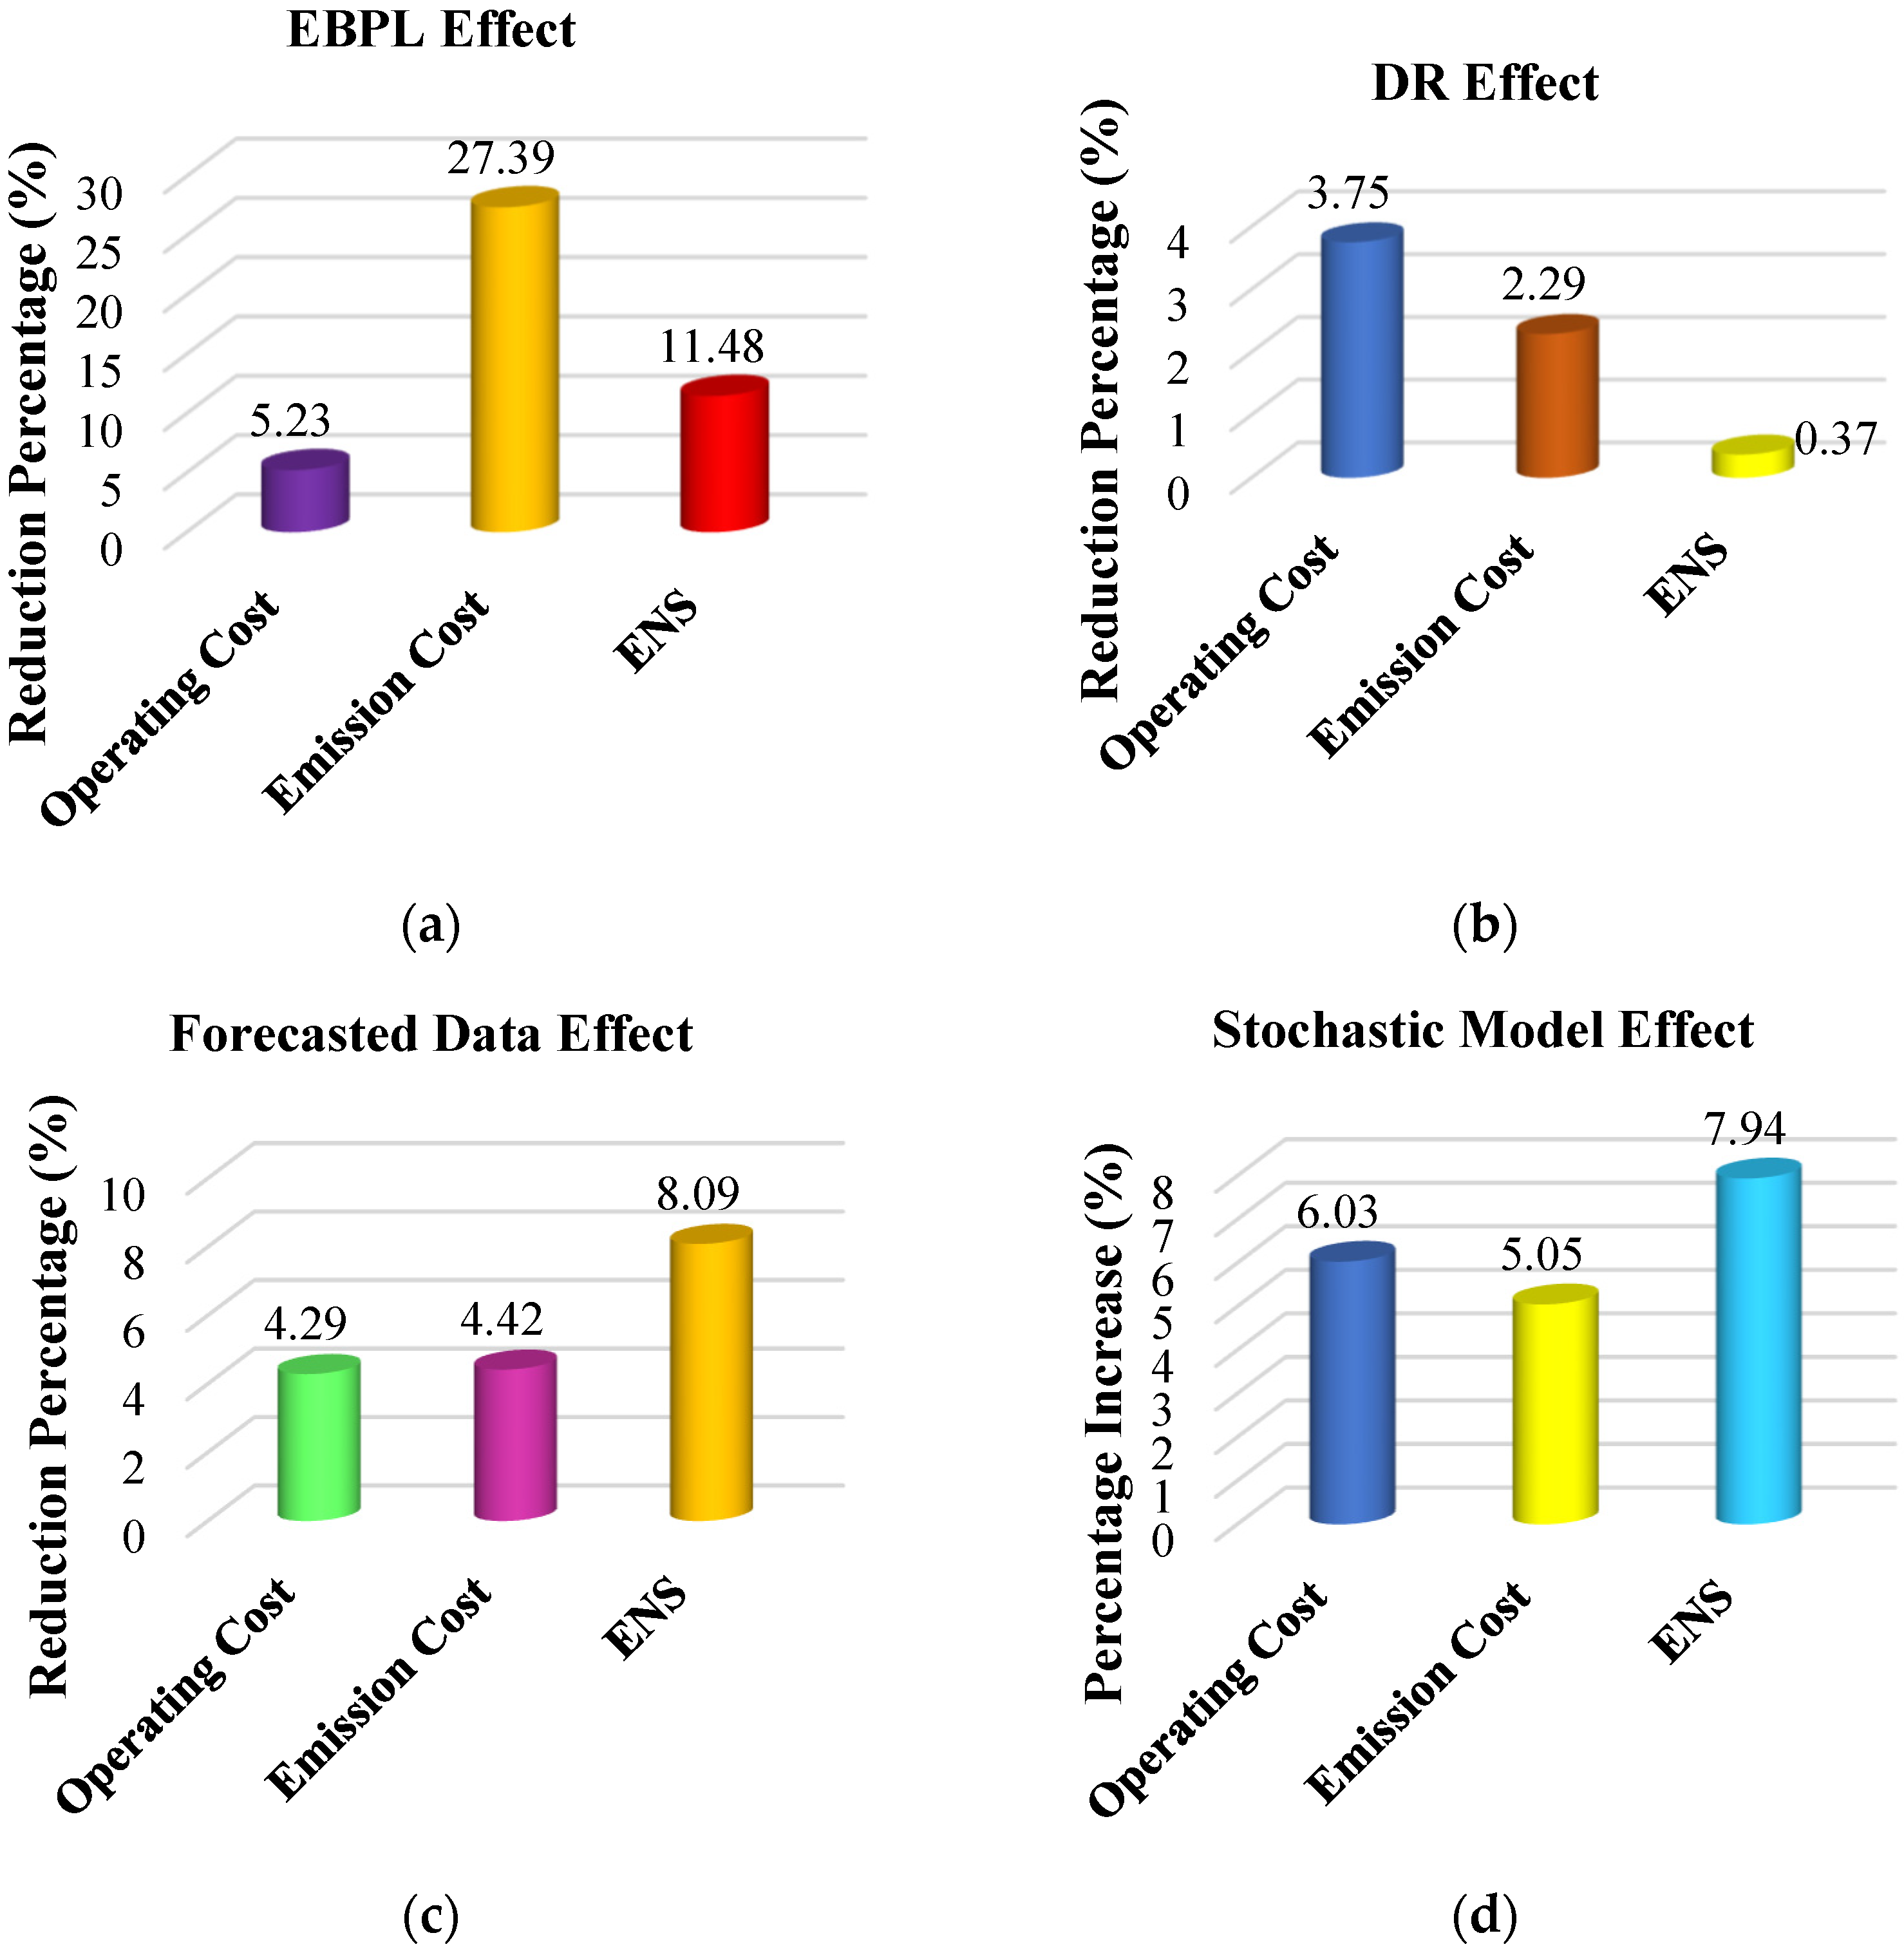
3.6.1. Effect of EBPL Application
3.6.2. Effect of DR Application
3.6.3. Effect of Forecasted Data Application
3.6.4. Effect of Incorporating Stochastic Model
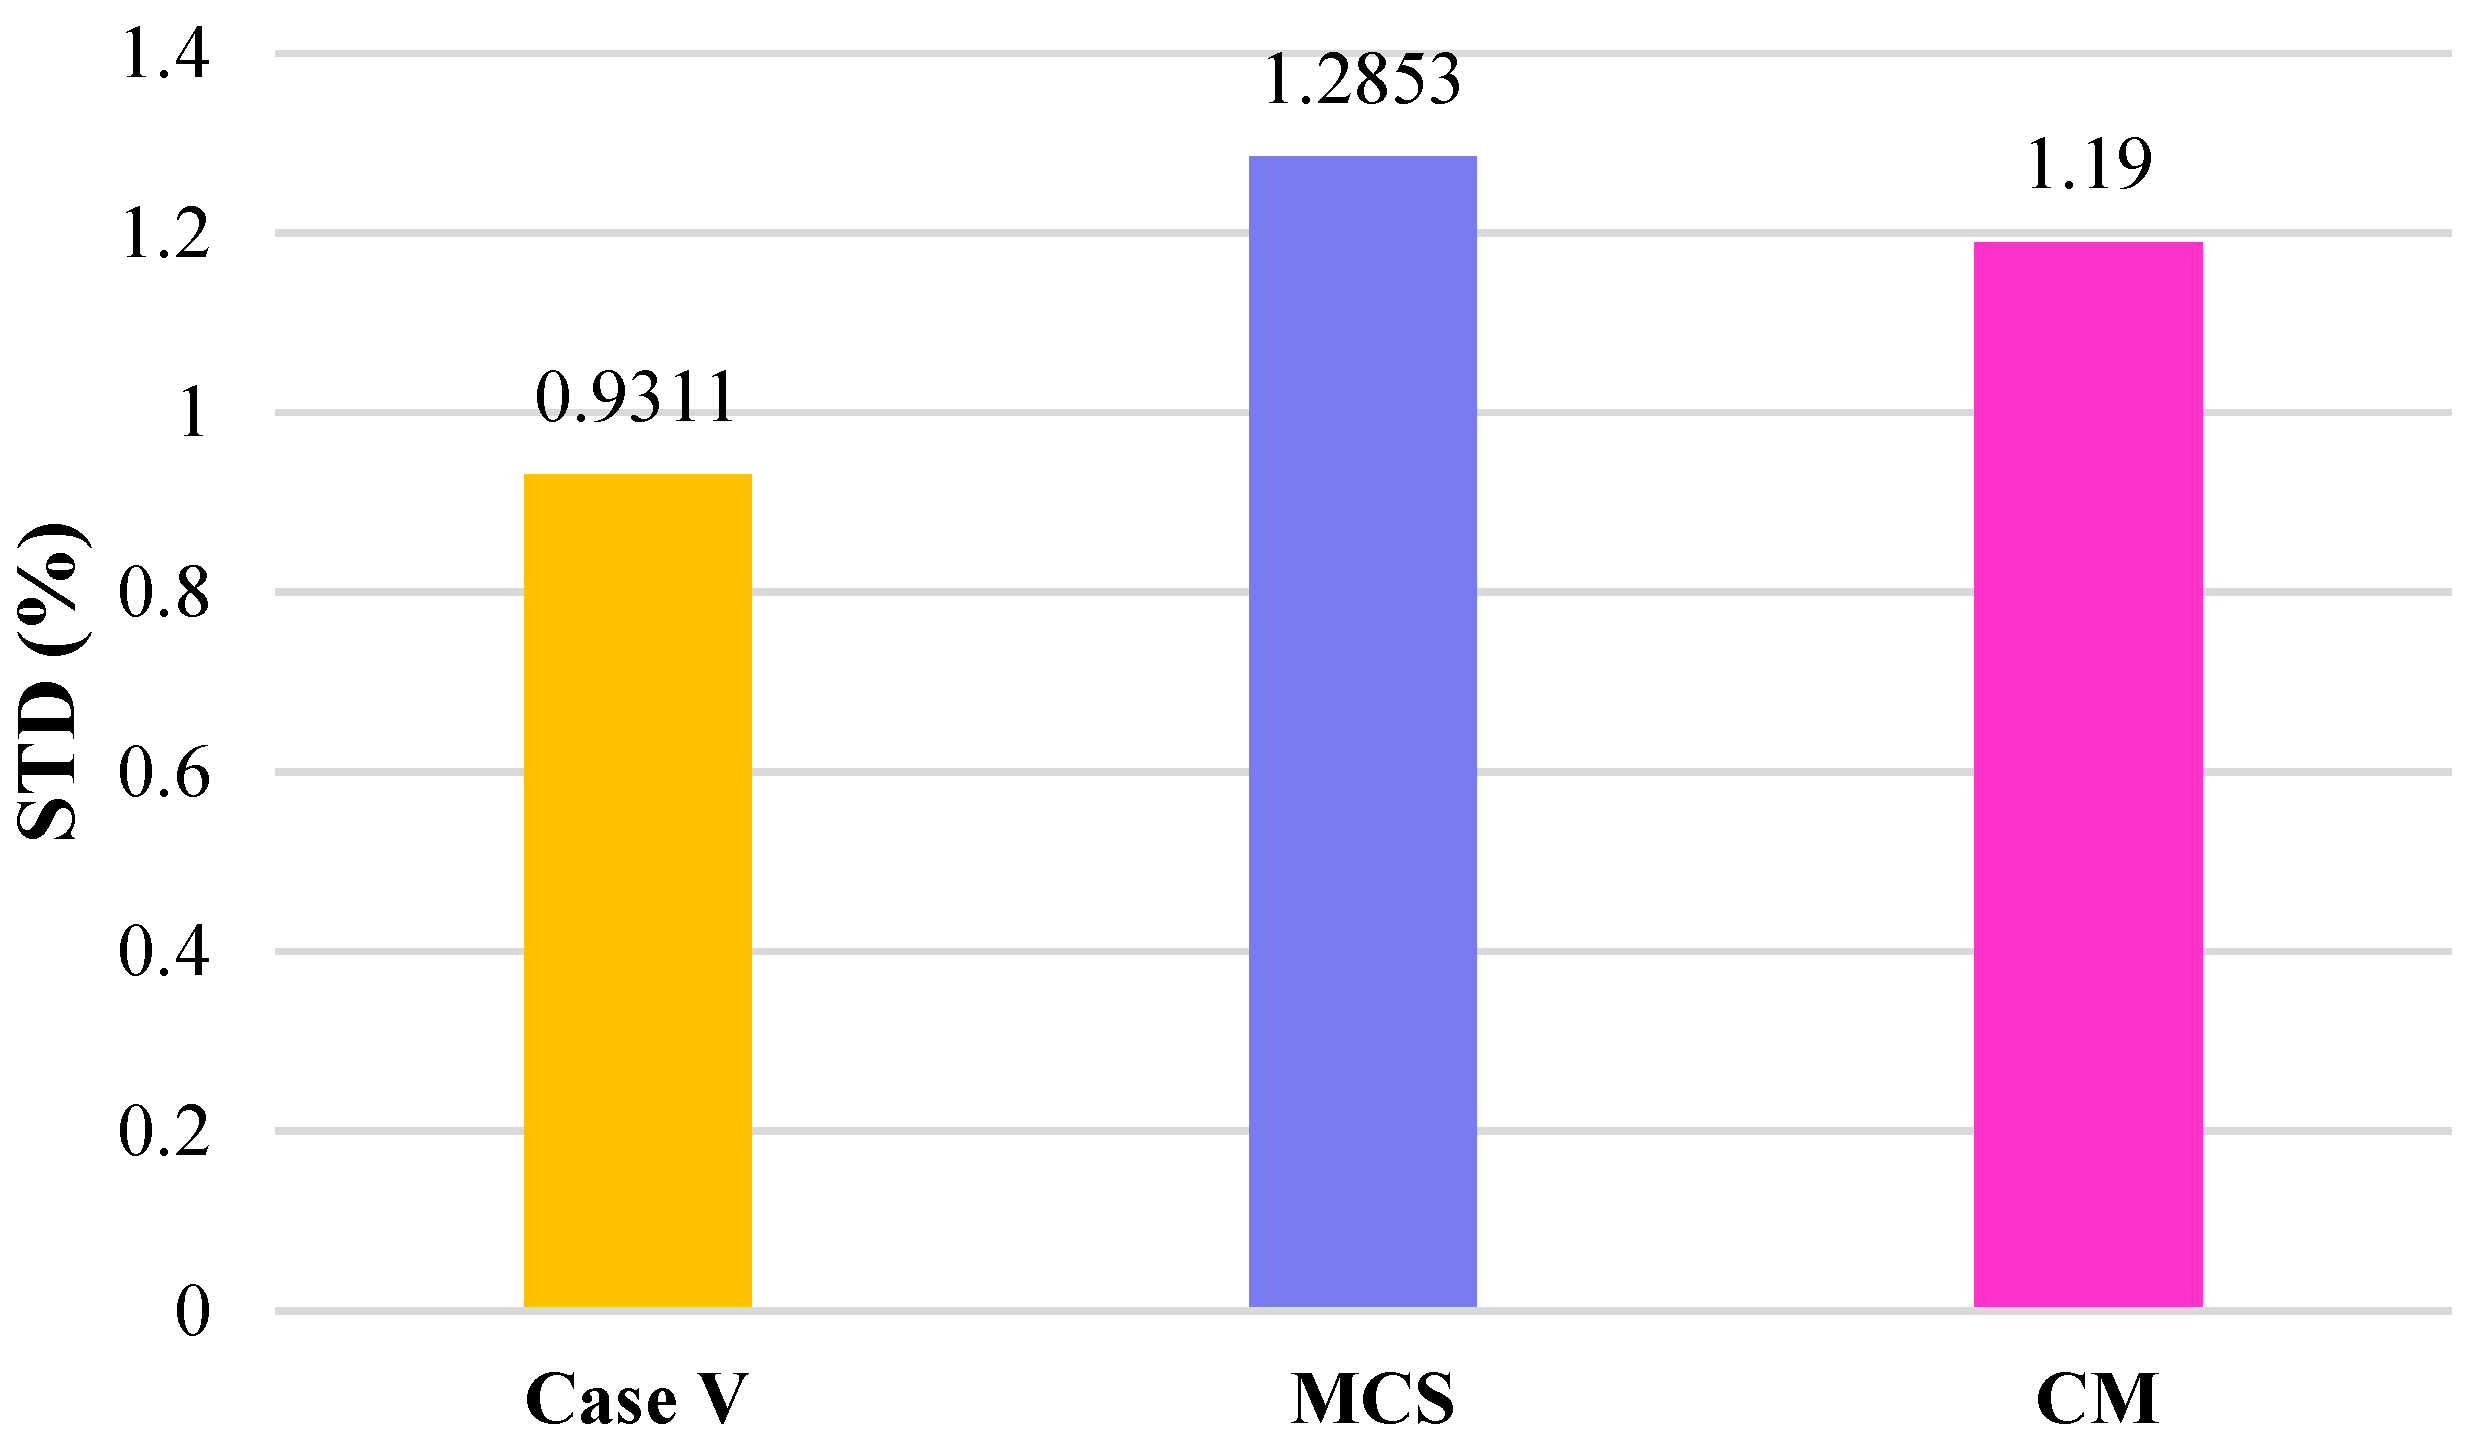
3.7. Comparing with Conventional Stochastic Methods
3.8. Sensitivity Analysis
3.8.1. The Effect of EBPL Initial SOC Variations
3.8.2. The Effect of EBPL Capacity Variations
4. Conclusions
- −
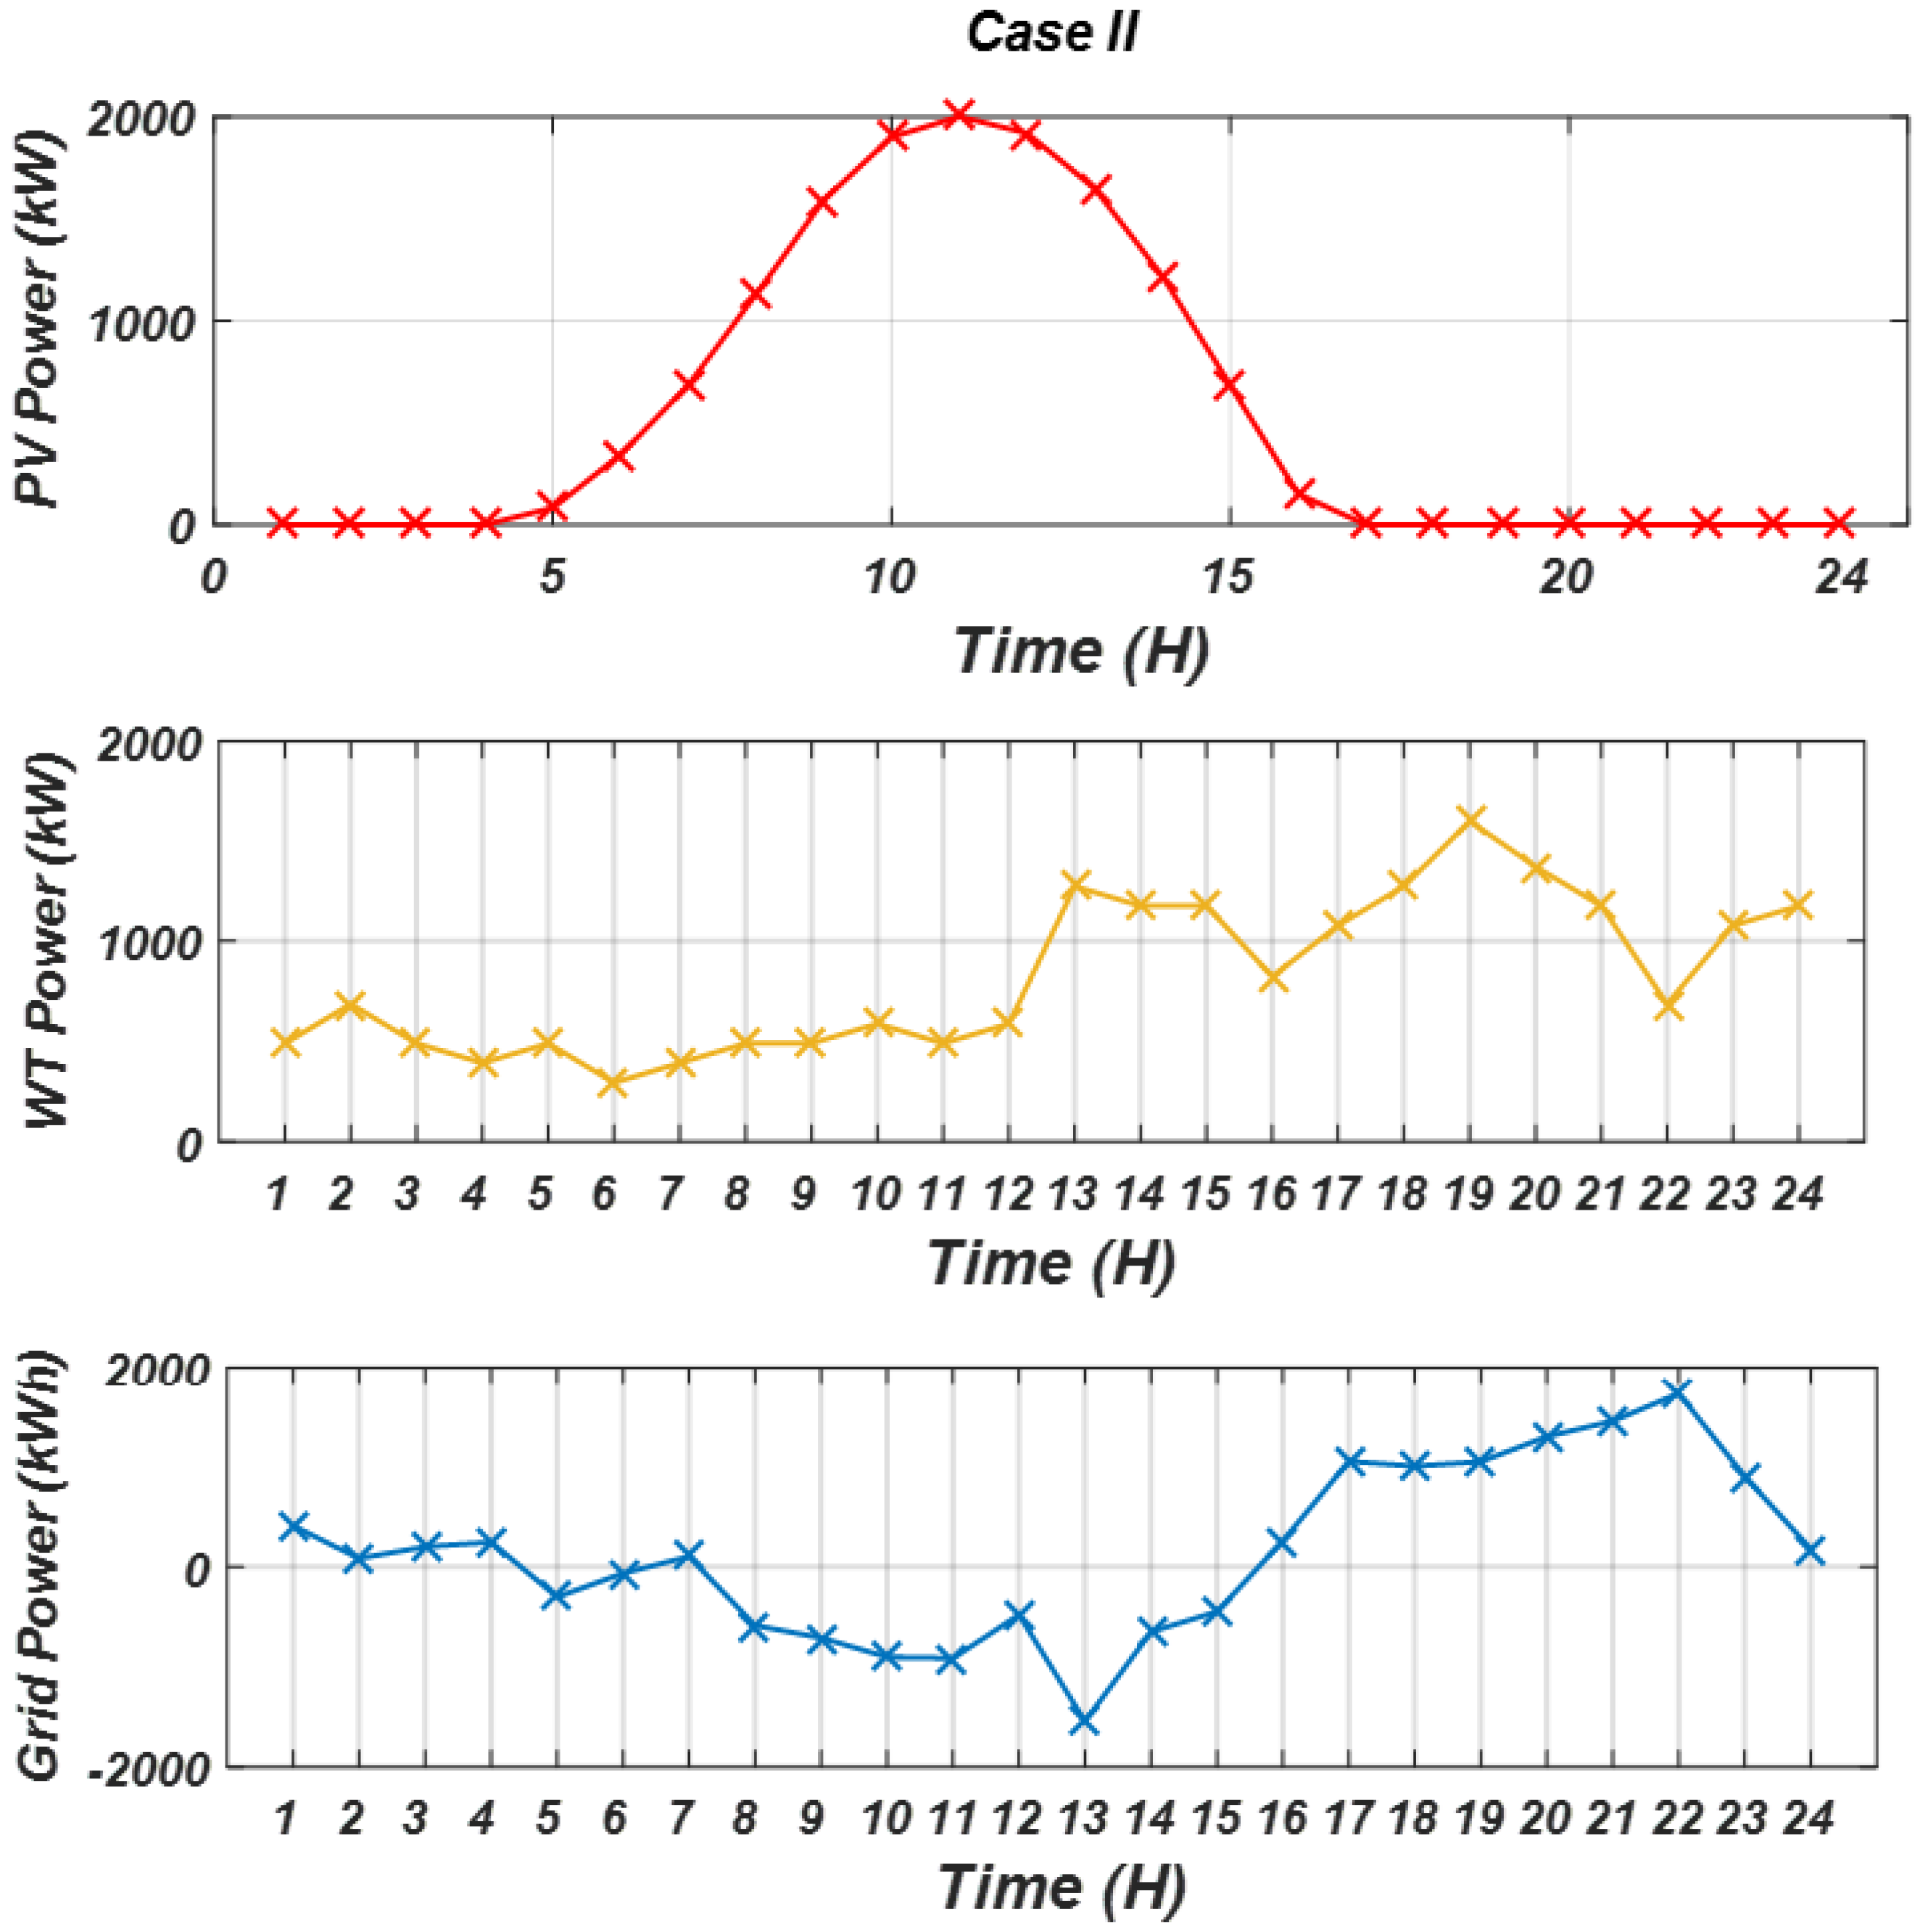
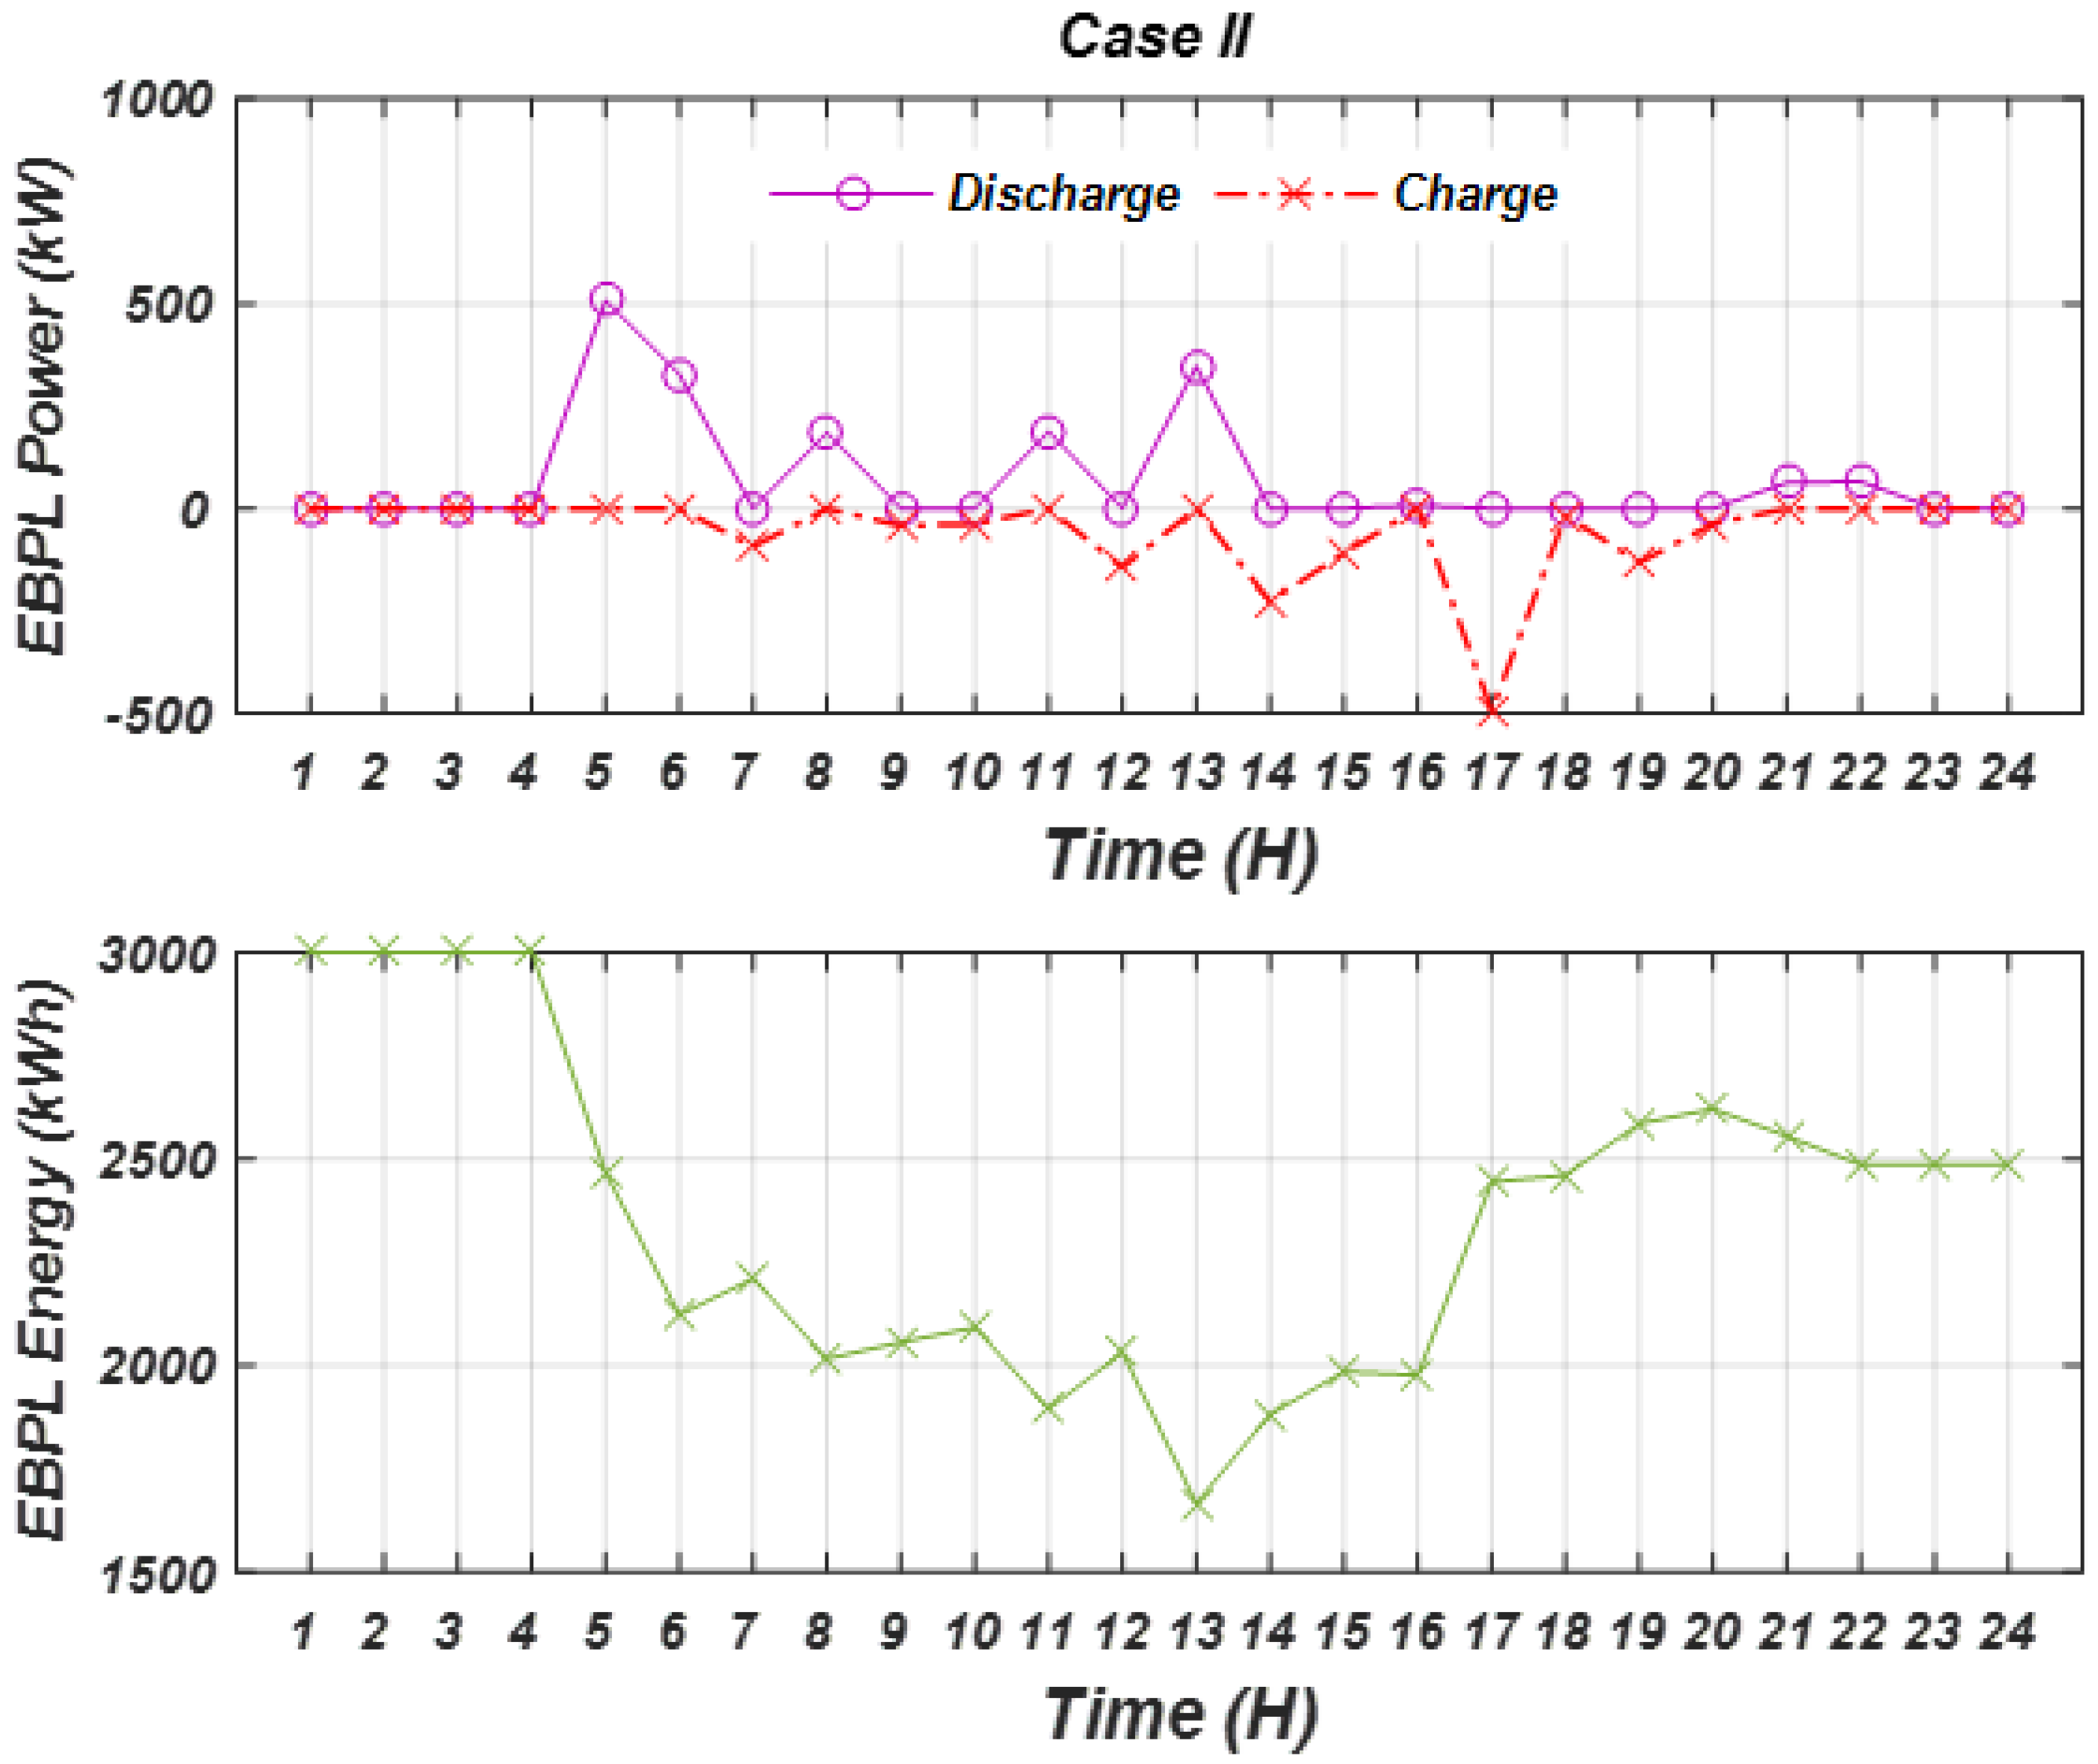
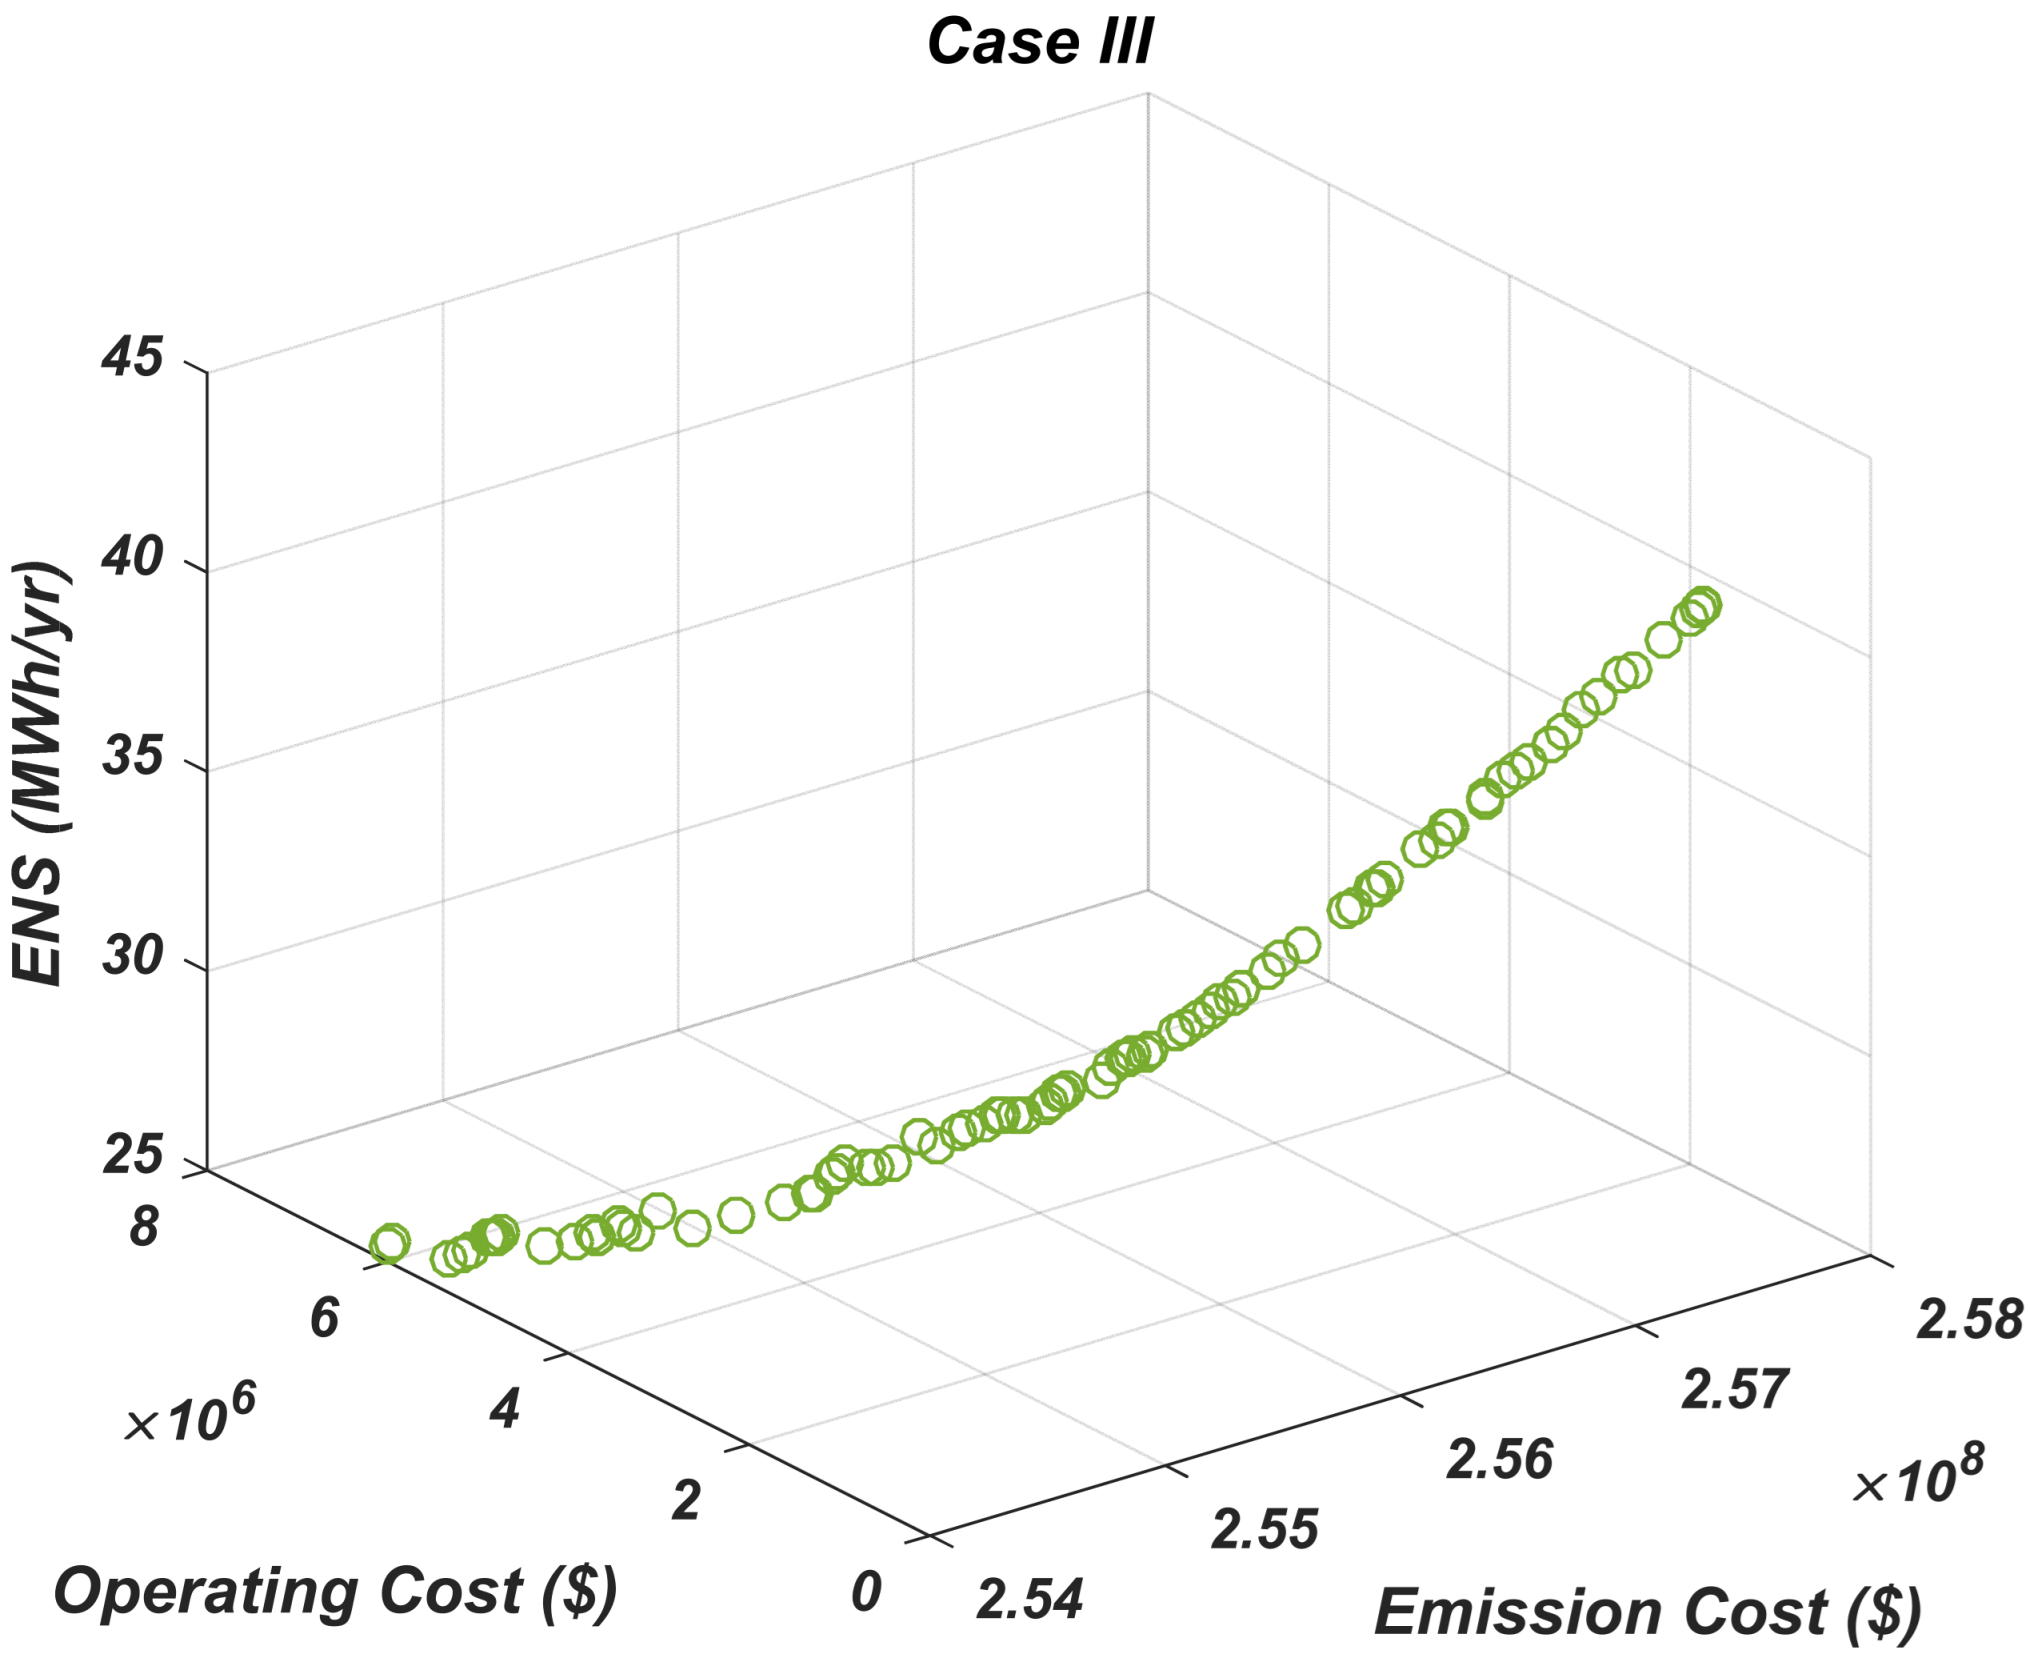
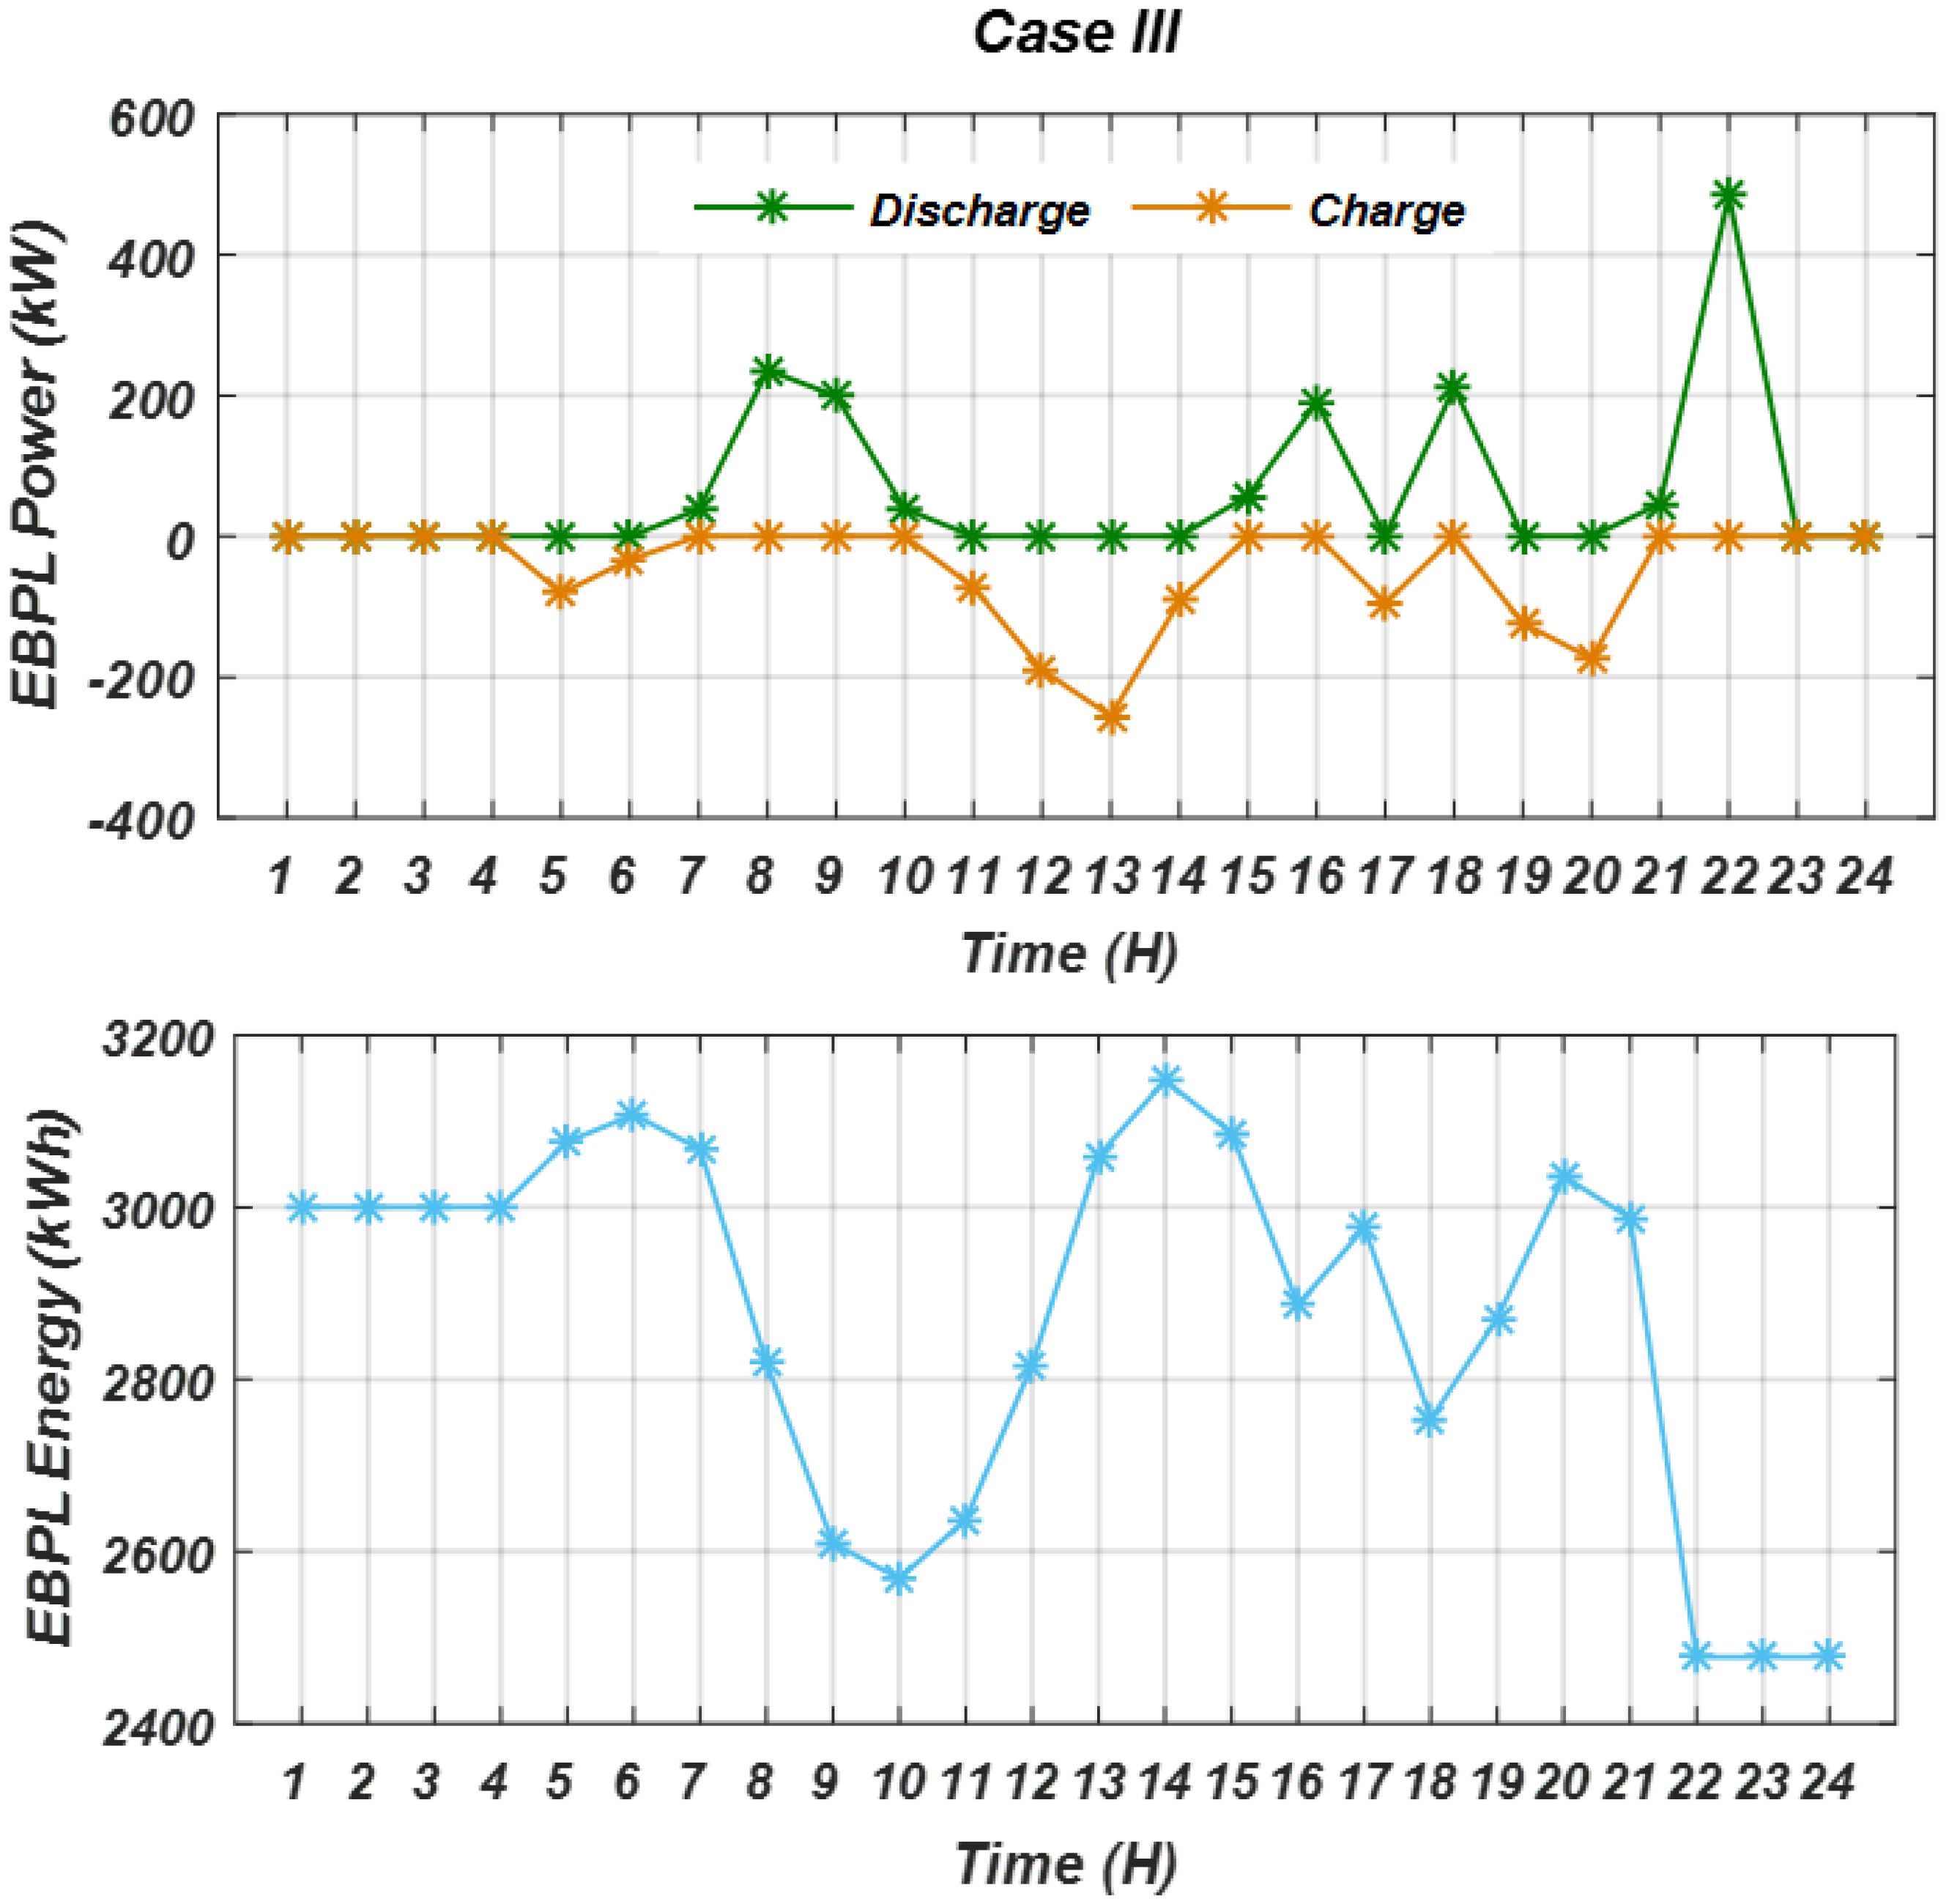
- Implementing EBPLs with RES (Case I vs. II) reduced operating cost by 5.23%, emission cost by 27.39%, and ENS by 11.48%, demonstrating the significant role of EBPLs in improving economic and reliability indices. Incorporating DR (Case II vs. III) increased operating cost by 3.75% and emission cost by 2.29%, while slightly reducing ENS by 0.37%. Using forecasted data (Case III vs. IV) further reduced operating cost by 4.29%, emission cost by 4.42%, and ENS by 8.09%. Adding stochastic modeling (Case IV vs. V) increased operating cost by 6.03%, emission cost by 5.05%, and ENS by 7.94%, but yielded a more realistic and stable model under uncertainty.
- −
- The proposed MO-ESCHO outperformed MO-SCHO, MO-PSO, and MO-SCA in convergence rate, Pareto-front distribution, and diversity metrics (Hypervolume and Spacing), consistently achieving a better balance among objectives without premature convergence.
- −
- Compared with conventional stochastic approaches, the UT–CQR hybrid achieved higher accuracy with substantially reduced computational time (348 s vs. 1953 s for Monte Carlo and 1755 s for the Cloud Model) while maintaining stability across multiple experiments. It also yielded lower output variance over 20 independent runs (0.93% vs. 1.29% and 1.19%), demonstrating robustness under uncertainty. By integrating the Cubature Quadrature Rule into the Unscented Transformation, the hybrid approach required fewer evaluation points, mitigated the curse of dimensionality, and provided precise statistical estimates. These strengths support its superiority for real-time operation of distribution networks, where efficiency and reliability are crucial.
- −
- Despite these promising results, the model was tested on an 85-bus system and focused on PV, WT, and EBPLs. Future work should extend the framework to larger real distribution networks, consider additional sources of uncertainty such as market-price variations, and test the method in industrial-scale EBPL deployments. Potential industrial applications include optimal EBPL planning for smart cities, emission-mitigation strategies for public transport, and demand-side management integration in renewable-rich grids.
Author Contributions
Funding
Data Availability Statement
Conflicts of Interest
Nomenclature
| Parameter | Definition | Parameter | Definition |
| ANN | Artificial Neural Network | Network loss at time t | |
| Celoss | Cost of energy loss (USD/kWh) | Nominal power of the wind turbine | |
| Cems | Cost of emissions coefficient (USD/kg) | Power generated by the PV system at time t | |
| CGrid | Cost per kW of grid power | PSTC | PV output under standard test conditions |
| CO2,Grid | Carbon dioxide emission of grid at time t | Active power output of the wind turbine at time t | |
| CPV | Cost per kW of PV power | PSO | Particle Swarm Optimization |
| CWT | Cost per kW of wind power | PV | Photovoltaic array |
| Total grid emissions at time t (kg/kWh) | RES | Renewable Energy Sources | |
| EBPL | Electric Bus Parking Lot energy storage system | RMSE | Root Mean Square Error |
| ENS | Energy Not Supplied | SEBPL | Storage capacity of the bus batteries |
| ESCHO | Enhanced Sinh-Cosh Optimizer | SCA | Sine Cosine Algorithm |
| G | Solar irradiation on the module surface | SO2,Grid | Sulfur dioxide emission of grid at time t |
| GSTC | Irradiance at STC | SOC | State of Charge |
| Ii | Current of line i | STC | Standard Test Conditions |
| Line current at time t | Ta | Ambient air temperature | |
| Maximum allowable current of the line | Tc | PV temperature under STC | |
| K | Temperature coefficient | Tref | Reference cell temperature |
| MAPE | Mean Absolute Percentage Error | TC | Temperature in standard test condition |
| MO-ESCHO | Multi-Objective Enhanced Search Chimp Optimization | UT-CQR | Unscented Transform with CQR quadrature rule |
| MO-PSO | Multi-Objective Particle Swarm Optimization | WT | Wind turbine |
| MO-SCA | Multi-Objective Sine Cosine Algorithm | Membership value associated with the optimal decision function | |
| MO-SCHO | Multi-Objective Sinh Cosh Optimizer | Cut-in wind speed | |
| Nl | Number of lines in the network | Cut-out wind speed | |
| Nlp | Number of interrupted loads due to outage of line l | Nominal wind speed | |
| NOx,Grid | Nitrogen oxides emission of grid at time t | Wind speed at time t | |
| NOCT | Nominal Operating Cell Temperature | Bus voltage at time t | |
| NSGA-II | Non-dominated Sorting Genetic Algorithm II | Maximum allowable bus voltage | |
| Charging power of EBPL batteries at time t | Minimum allowable bus voltage | ||
| Discharging (releasing) power of EBPL batteries at time t | ϖeloss | Annual cost of network energy losses | |
| Upper limit of grid power injected to the distribution network | ϖems | Annual emission cost | |
| Upper limit of PV power | ϖGrid | Annual cost of grid power | |
| Upper limit of WT power | ϖPV | Annual cost of PV power | |
| Lower limit of grid power injected to the distribution network | ϖWT | Annual cost of WT power | |
| Lower limit of PV power | Arrival time of the EBs (entry instant) | ||
| Lower limit of WT power | Departure time of the EBs (exit instant) | ||
| Network load power at time t | Network loss at time t |
Appendix A. Multi-Objective ESCHO (MO-ESCHO) and Implementation
Appendix A.1. Conventional Sinh–Cosh Optimizer (SCHO)
Appendix A.2. The Enhanced SCHO (ESCHO) Based on Entropy-Guided Exploration Control
- Population Entropy
- Entropy-Guided Exploration Coefficient
- Position Update Rule with Entropy Control
- Diversity Recovery Mechanism
Appendix A.3. Multi-Objective Optimization Approach
Appendix A.4. Implementing the MO-ESCHO

| Algorithm A1: Pseudo-code of the MO-ESCHO. |
| % Initialize MO-ESCHO parameters: ct, T, BS1, u, m, n, α, β, p, and q % Initialize entropy-control parameters: λmin, λmax, γ, and entropy threshold Hth % Initialize candidate solutions X randomly X = rand(N, dim) * (ub − lb) + lb; % Initialize objective matrix F and external archive A_ext F = zeros(N, M); A_ext = ∅; % Main optimization loop for t = 1:MaxIter % Evaluate all objective functions for i = 1:N F(i,:) = evaluateMultiObjective(X(i,:)); % <-- user-defined objectives end % Perform non-dominated sorting and compute crowding distance [Fronts, Rank] = nonDominatedSorting(F); CD = crowdingDistance(Fronts, F); % Calculate population entropy and update λ adaptively pi = normalizeFitness(F); H = -sum(pi .* log(pi + eps)); λ = λmin + (λmax − λmin) * (H/Hmax); % Select leader from the first Pareto front X_best = selectLeader(Fronts, CD, X); for i = 1:N for j = 1:dim % Compute switching parameter A A = computeA(t, MaxIter, ct, p, q); % Check for bounded search phase if mod(t, BS1) == 0 % Reinitialize candidate within bounds X(i,j) = lb(j) + rand() * (ub(j) − lb(j)); end % Choose phase based on A if A > 1 % Exploration Mode (entropy-guided) a1 = 2 − t/MaxIter; r1 = rand(); r2 = rand(); W1 = a1 * r1 − a1; W2 = a1 * r2; if t <= T % Early exploration step X(i,j) = X(i,j) + λ * (W1 * (X_best(j) − X(i,j)) + W2 * sinh(r1)); else % Late exploration step epsilon = 0.003; W2 = W2 * epsilon; X(i,j) = X(i,j) + λ * W2; end else % Exploitation Mode (entropy-guided) a1 = 2 − t/MaxIter; r3 = rand(); W3 = a1 * r3; if t <= T % First exploitation step X(i,j) = X(i,j) + λ * (W3 * cosh(r3) * (X_best(j) − X(i,j))) + rand(); else % Local refinement phase X(i,j) = X(i,j) + λ * epsilon * W3; end end % Diversity restoration based on entropy threshold if H < Hth R = −1 + 2 * rand(); % R_(i,j)^t ∼ U(−1,1) X(i,j) = X(i,j) + γ * R; end % Bound control X(i,j) = max(min(X(i,j), ub(j)), lb(j)); end end % Update external archive with non-dominated solutions A_ext = updateArchive(A_ext, X, F); % Compute fuzzy membership for final decision μ = computeFuzzyMembership(F); end % Extract Pareto front and determine fuzzy-best compromise PF = extractParetoFront(A_ext); X_best_fuzzy = fuzzyDecision(PF, μ); |
References
- Verma, H.K.; Gupta, N.; Agrawal, P.K.; Niazi, K.R.; Swarnkar, A. EV charging strategies for office parking lots to relieve local grids. Sustain. Energy Grids Netw. 2025, 44, 101942. [Google Scholar] [CrossRef]
- Nurmuhammed, M.; Akdağ, O.; Karadağ, T.; Kafafy, M. Multi-Factor Optimization for Electric Bus Charging Stations: Integrating Electrical, Social, and Environmental Perspectives. Energy Nexus 2025, 19, 100500. [Google Scholar] [CrossRef]
- Yánez, A.H.; Cindy, F.G.; Yánez, E.R.; Delgado, J.C.V.; Barzola-Monteses, J. A brief review of the techniques used to locate electric bus charging stations. In Proceedings of the 2024 IEEE Eighth Ecuador Technical Chapters Meeting (ETCM), Cuenca, Ecuador, 15–18 October 2024; IEEE: New York, NY, USA, 2024; pp. 1–6. [Google Scholar]
- Orbe, D.; Salazar, L.; Vásquez, P.; Chamorro, W.; Medina, J. Influence of Optimal Charging Station Integration on Electric Power Distribution Grid: Case of Electric Bus-Based Transport System. Eng. Proc. 2024, 77, 22. [Google Scholar]
- Hadi Abdulwahid, A.; Al-Razgan, M.; Fakhruldeen, H.F.; Churampi Arellano, M.T.; Mrzljak, V.; Arabi Nowdeh, S.; Moghaddam, M.J.H. Stochastic multi-objective scheduling of a hybrid system in a distribution network using a mathematical optimization algorithm considering generation and demand uncertainties. Mathematics 2023, 11, 3962. [Google Scholar] [CrossRef]
- Tong, X.; Zhao, S.; Chen, H.; Wang, X.; Liu, W.; Sun, Y.; Zhang, L. Optimal dispatch of a multi-energy complementary system containing energy storage considering the trading of carbon emission and green certificate in China. Energy 2025, 314, 134215. [Google Scholar] [CrossRef]
- De Lima, T.D.; Cordero, L.G.; Soares, J.; Franco, J.F. Optimal probabilistic framework for grid cost operation considering voltage probability constraints and high penetration of EVs, wind and PV generation. J. Clean. Prod. 2025, 521, 146241. [Google Scholar] [CrossRef]
- De Lima, T.D.; Franco, J.F.; Lezama, F.; Soares, J.; Vale, Z. Joint optimal allocation of electric vehicle charging stations and renewable energy sources including CO2 emissions. Energy Inform. 2021, 4 (Suppl. S2), 33. [Google Scholar] [CrossRef]
- Ghofrani, M.; Majidi, M. A comprehensive optimization framework for EV-Renewable DG coordination. Electr. Power Syst. Res. 2021, 194, 107086. [Google Scholar] [CrossRef]
- Veisi, M. Economic sizing and placement of hydrogen fueling and electric vehicles charging stations powered by renewable and battery systems in smart distribution network. Results Eng. 2025, 27, 106657. [Google Scholar] [CrossRef]
- Alahyari, A.; Ehsan, M.; Mousavizadeh, M. A hybrid storage-wind virtual power plant (VPP) participation in the electricity markets: A self-scheduling optimization considering price, renewable generation, and electric vehicles uncertainties. J. Energy Storage 2019, 25, 100812. [Google Scholar] [CrossRef]
- Yao, M.; Moradi, Z.; Pirouzi, S.; Marzband, M.; Baziar, A. Stochastic economic operation of coupling unit of flexi-renewable virtual power plant and electric spring in the smart distribution network. IEEE Access 2023, 11, 75979–75992. [Google Scholar] [CrossRef]
- Gupta, K.; Achathuparambil Narayanankutty, R.; Sundaramoorthy, K.; Sankar, A. Optimal location identification for aggregated charging of electric vehicles in solar photovoltaic powered microgrids with reduced distribution losses. Energy Sources Part A Recovery Util. Environ. Eff. 2024, 46, 6289–6304. [Google Scholar] [CrossRef]
- Affolabi, L.; Shahidehpour, M.; Gan, W.; Yan, M.; Chen, B.; Pandey, S.; Vukojevic, A.; Paaso, E.A.; Alabdulwahab, A.; Abusorrah, A. Optimal transactive energy trading of electric vehicle charging stations with on-site PV generation in constrained power distribution networks. IEEE Trans. Smart Grid 2021, 13, 1427–1440. [Google Scholar] [CrossRef]
- Liu, J.; Zhong, C. An economic evaluation of the coordination between electric vehicle storage and distributed renewable energy. Energy 2019, 186, 115821. [Google Scholar] [CrossRef]
- Turan, M.T.; Ates, Y.; Erdinc, O.; Gokalp, E.; Catalão, J.P. Effect of electric vehicle parking lots equipped with roof mounted photovoltaic panels on the distribution network. Int. J. Electr. Power Energy Syst. 2019, 109, 283–289. [Google Scholar] [CrossRef]
- Nasab, M.A.; Al-Shibli, W.K.; Zand, M.; Ehsan-Maleki, B.; Padmanaban, S. Charging management of electric vehicles with the presence of renewable resources. Renew. Energy Focus 2024, 48, 100536. [Google Scholar] [CrossRef]
- Almazroui, A.; Mohagheghi, S. Coordinated Control of Photovoltaic Resources and Electric Vehicles in a Power Distribution System to Balance Technical, Environmental, and Energy Justice Objectives. Processes 2025, 13, 1979. [Google Scholar] [CrossRef]
- Bonela, R.; Roy Ghatak, S.; Swain, S.C.; Lopes, F.; Nandi, S.; Sannigrahi, S.; Acharjee, P. Analysis of Techno–Economic and Social Impacts of Electric Vehicle Charging Ecosystem in the Distribution Network Integrated with Solar DG and DSTATCOM. Energies 2025, 18, 363. [Google Scholar] [CrossRef]
- Al-Sahlawi, A.A.K.; Ayob, S.M.; Tan, C.W.; Ridha, H.M.; Hachim, D.M. Optimal design of grid-connected hybrid renewable energy system considering electric vehicle station using improved multi-objective optimization: Techno-economic perspectives. Sustainability 2024, 16, 2491. [Google Scholar] [CrossRef]
- Nareshkumar, K.; Das, D. Optimal location and sizing of electric vehicles charging stations and renewable sources in a coupled transportation-power distribution network. Renew. Sustain. Energy Rev. 2024, 203, 114767. [Google Scholar] [CrossRef]
- Zangmo, R.; Sudabattula, S.K.; Mishra, S.; Dharavat, N.; Golla, N.K.; Sharma, N.K.; Jadoun, V.K. Optimal placement of renewable distributed generators and electric vehicles using multi-population evolution whale optimization algorithm. Sci. Rep. 2024, 14, 28447. [Google Scholar] [CrossRef] [PubMed]
- Veisi, M. Stochastic economic placement and sizing of electric vehicles charging station with renewable units and battery bank in smart distribution network. Sci. Rep. 2025, 15, 24235. [Google Scholar] [CrossRef]
- Zhang, J.; Wang, S.; Zhang, C.; Luo, F.; Dong, Z.Y.; Li, Y. Planning of electric vehicle charging stations and distribution system with highly renewable penetrations. IET Electr. Syst. Transp. 2021, 11, 256–268. [Google Scholar] [CrossRef]
- Alam, M.J.E.; Muttaqi, K.M.; Sutanto, D. Effective utilization of available PEV battery capacity for mitigation of solar PV impact and grid support with integrated V2G functionality. IEEE Trans. Smart Grid 2015, 7, 1562–1571. [Google Scholar] [CrossRef]
- Haji-Aghajani, E.; Hasanzadeh, S.; Heydarian-Forushani, E. A novel framework for planning of EV parking lots in distribution networks with high PV penetration. Electr. Power Syst. Res. 2023, 217, 109156. [Google Scholar] [CrossRef]
- Kumar, R.; Singh, S.; Bilga, P.S.; Jatin; Singh, J.; Singh, S.; Scutaru, M.-L.; Pruncu, C.I. Revealing the benefits of entropy weights method for multi-objective optimization in machining operations: A critical review. J. Mater. Res. Technol. 2021, 10, 1471–1492. [Google Scholar] [CrossRef]
- Davoudkhani, I.F.; Zishan, F.; Mansouri, S.; Abdollahpour, F.; Grisales-Noreña, L.F.; Montoya, O.D. Allocation of renewable energy resources in distribution systems while considering the uncertainty of wind and solar resources via the multi-objective Salp Swarm algorithm. Energies 2023, 16, 474. [Google Scholar] [CrossRef]
- Kalantari, A.; Lesani, H. Operation Scheduling of Distribution Network with Photovoltaic/Wind/Battery Multi-Microgrids and Reconfiguration considering Reliability and Self-Healing. Int. J. Energy Res. 2024, 2024, 5724653. [Google Scholar] [CrossRef]
- Nowdeh, S.A.; Davoudkhani, I.F.; Moghaddam, M.H.; Najmi, E.S.; Abdelaziz, A.Y.; Ahmadi, A.; Razavi, S.; Gandoman, F.H. Fuzzy multi-objective placement of renewable energy sources in distribution system with objective of loss re-duction and reliability improvement using a novel hybrid method. Appl. Soft Comput. 2019, 77, 761–779. [Google Scholar] [CrossRef]
- Shayeghi, H.; Davoudkhani, I.F. Uncertainty aware energy management in microgrids with integrated electric bicycle charging stations and green certificate market. Sci. Rep. 2025, 15, 26374. [Google Scholar] [CrossRef]
- Habibi, S.; Effatnejad, R.; Hedayati, M.; Hajihosseini, P. Stochastic energy management of a microgrid incorporating two-point estimation method, mobile storage, and fuzzy multi-objective enhanced grey wolf optimizer. Sci. Rep. 2024, 14, 1667. [Google Scholar]
- Bai, J.; Li, Y.; Zheng, M.; Khatir, S.; Benaissa, B.; Abualigah, L.; Wahab, M.A. A sinh cosh optimizer. Knowl.-Based Syst. 2023, 282, 111081.F. [Google Scholar] [CrossRef]
- Lei, H.; Guo, Y.; Khan, N. Forecasting energy use and efficiency in transportation: Predictive scenarios from ANN models. Int. J. Hydrogen Energy 2025, 106, 1373–1384. [Google Scholar] [CrossRef]
- Pereira, S.; Canhoto, P.; Salgado, R. Development and assessment of artificial neural network models for direct normal solar irradiance forecasting using operational numerical weather prediction data. Energy AI 2024, 15, 100314. [Google Scholar] [CrossRef]
- NASA Remote Sensing Validation Data: Saudi Arabia. Available online: https://www.nrel.gov/grid/solar-resource/saudi-arabia (accessed on 25 February 2025).
- Hai, T.; Singh, N.S.S.; Jamal, F. Energy management of a microgrid with integration of renewable energy sources considering energy storage systems with electricity price. J. Energy Storage 2025, 110, 115191. [Google Scholar] [CrossRef]
- Butler, Q.; Ziada, Y.; Gadsden, S.A. Gaussian Filtering using a Spherical-Radial Double Exponential Cubature. IEEE Open J. Signal Process. 2025, 6, 1056–1076. [Google Scholar] [CrossRef]
- Prakash, D.B.; Lakshminarayana, C. Optimal siting of capacitors in radial distribution network using whale optimization algorithm. Alex. Eng. J. 2017, 56, 499–509. [Google Scholar] [CrossRef]
- Fathy, A.; Abdelaziz, A.Y. Competition over resource optimization algorithm for optimal allocating and sizing parking lots in radial distribution network. J. Clean. Prod. 2020, 264, 121397. [Google Scholar] [CrossRef]
- Billinton, R.; Allan, R.N. Reliability Assessment of Large Electric Power Systems; Springer Science & Business Media: New York, NY, USA, 2012. [Google Scholar]
- Kennedy, J.; Eberhart, R. Particle swarm optimization. In Proceedings of the ICNN’95—International Conference on Neural Networks, Perth, Australia, 27 November–1 December 1995; IEEE: New York, NY, USA, 1995; Volume 4, pp. 1942–1948. [Google Scholar]
- Mirjalili, S. SCA: A sine cosine algorithm for solving optimization problems. Knowl.-Based Syst. 2016, 96, 120–133. [Google Scholar] [CrossRef]







| Ref. No. | Device | Objective Function | Findings | Limitations |
|---|---|---|---|---|
| [8] | PV, WT, EV | Minimize investment and operational costs | Optimal allocation of RE and EV | Did not assess emission |
| [9] | EV, PV, WT | Maximize participant revenue via optimal EV charge/discharge | Enhanced system efficiency and voltage regulation | Focused mainly on market |
| [10] | PV, WT, Hydrogen, Battery | Minimize total annual cost | Cost-effective stochastic siting of EV and hydrogen stations | Did not exchange real-time operation with grid |
| [11] | PV, WT, EV | Minimize operational cost and participate in reserve markets | Economic efficiency and renewable utilization | Did not evaluate the grid hosting |
| [12] | PV, WT, EV | Maximize expected profits under market uncertainties | Flexible energy and reactive power participation | Limited reliability |
| [13] | PV, WT, EV (V2G) | Minimize power loss, voltage deviation; enhance voltage stability | Grid resilience and efficiency via V2G coordination | Did not include stochastic model |
| [14] | PV, EV | Enable energy trading among EVCSs with on-site PV | Efficiency enhancement | Ignored stochastic operation |
| [15] | PV, WT, EV | Evaluate techno-economic performance of EV-RE coordination strategies | Smart charging with V2G | No formal stochastic optimization |
| [16] | PV, EV | Minimize energy losses and grid dependency | Reliability enhancement | Did not incorporate stochastic optimization |
| [17] | PV, EV | Minimize operational cost; optimize EV behavior prediction | Intelligent management of EV charging | Focused on prediction, not stochastic planning |
| [18] | PV, EV, Responsive Loads | Minimize PV curtailment, system losses, unmet demand | Balanced trade-offs and stable voltage profile | Computationally heavy |
| [19] | PV, EV, DSTATCOM | Optimize site/capacity to minimize cost and emissions | Techno-economic assessment of EVCE integration | Did not examine operational stochastic model |
| [20] | PV, WT, Battery, EV | Optimize hybrid system sizing, minimize cost, maximize grid export | Hybrid RE-EVCS performance via V2G operation | Limited study on reliability impacts |
| [21] | EV, DG | Minimize user/network costs; maximize operator profit | Stochastic EVCS allocation | Did not consider emissions and reliability |
| [22] | PV, WT, EV | Reduce power loss, enhance voltage stability | Network performance under uncertain load | Did not analyze emission |
| [23] | PV, WT, Bio-waste, EV | Minimize annual operating and energy loss costs | Validated cost reduction | Complex coordination; lacks adaptability |
| [24] | WT, EV | Minimize total cost, energy losses; maximize traffic flow | Accounted for wind generation uncertainty | Did not study on emission |
| [25] | PV, EV | Mitigate overvoltage and reverse flow | Better voltage support and reduced reverse power flow | Focused on operational control |
| [26] | EV | Maximize profit via probabilistic EV arrival modeling | Enhanced allocation and reduced congestion | Did not include emission analysis |
| [27] | WT, EV, Battery | Minimize cost-to-revenue ratio under uncertainty | Reliable scheduling considering uncertainty | Did not explore emission and reliability |
| Item/Method | ANN | SCHO-ANN | ESCHO-ANN |
|---|---|---|---|
| Number of hidden neurons | 8 | 10 | 12 |
| Learning rate (α) | 0.02 | 0.015 | 0.010 |
| Momentum coefficient | 0.6 | 0.7 | 0.8 |
| Activation function | Sigmoid | Sigmoid–ReLU hybrid | Sigmoid–Tanh hybrid |
| Maximum training epochs | 800 | 1000 | 1200 |
| MAPE (%)–PV unit power | 10.36 | 7.45 | 6.72 |
| MAPE (%)–WT unit power | 10.67 | 7.82 | 6.93 |
| MAPE (%)–Network loading | 8.41 | 5.70 | 4.65 |
| RMSE (kW)–PV unit power | 0.084 | 0.063 | 0.054 |
| RMSE (kW)–WT unit power | 0.091 | 0.067 | 0.058 |
| RMSE (kW)–Network loading | 0.072 | 0.052 | 0.043 |
| R2–PV unit power | 0.925 | 0.953 | 0.972 |
| R2–WT unit power | 0.918 | 0.949 | 0.968 |
| R2–Network loading | 0.933 | 0.958 | 0.975 |
| Device | Value |
|---|---|
| PV unit power cost (USD/kW) | 0.045 |
| WT unit power cost (USD/kW) | 0.070 |
| EBPL unit energy cost (USD/kWh) | 0.055 |
| Algorithm | Parameter | Value |
|---|---|---|
| SCHO [33] | Sensitive variable, u Constant parameter, m Coefficient, n | 0.388 0.45 0.5 |
| PSO [42] | Inertia weight Cognitive and social factors | Linear decrease from 0.9 to 0.1 2, 2 |
| SCA [43] | r1 | Decreases linearly from 2 to 0 |
| Item/Value | Base Network | MO-ESCHO | MO-SCHO | MO-PSO | MO-SCA |
|---|---|---|---|---|---|
| PV Size (kW)/@PV Site (Bus) | -- | 2000/@4 | 2000/@4 | 2000/@57 | 2000/@57 |
| WT Size (kW)/@WT Site (Bus) | -- | 1596.07/@20 | 1612.65/@46 | 1600.36/@8 | 1585.65/@25 |
| Operating Cost (USD) | -- | 1,237,651.10 | 1,241,651.10 | 1,239,515.50 | 1,240,592.67 |
| Emission Cost (USD) | 822,276,015.03 | 360,474,505.31 | 371,739,026.25 | 368,863,911.58 | 372,502,114.25 |
| Energy Not Supplied (MWh) | 58.74 | 39.63 | 39.93 | 39.72 | 39.90 |
| Energy Loss Cost (USD) | 96,732.12 | 56,768.30 | 57,214.35 | 57,125.14 | 57,266.17 |
| PV Cost (USD) | -- | 219,150.00 | 219,150.00 | 219,150.00 | 219,150.00 |
| WT Cost (USD) | -- | 755,072.30 | 761,375.16 | 756,240.36 | 751,083.44 |
| Hypervolume | -- | 0.8627 | 0.8453 | 0.8571 | 0.8460 |
| Spacing | -- | 0.2356 | 0.2459 | 0.2411 | 0.2438 |
| Item/Value | Base Network | MO-ESCHO | MO-SCHO | MO-PSO | MO-SCA |
|---|---|---|---|---|---|
| PV Size (kW)/@Site (Bus) | -- | 2000/@5 | 2000/@21 | 1992/@32 | 1886/@60 |
| WT Size (kW)/@Site (Bus) | -- | 1605.12/@28 | 1611.58/@27 | 1637.36/@61 | 1792.15/@34 |
| EBPL Size (kW)/@Site (Bus) | -- | 3115/@32 | 3133/@60 | 3104/@12 | 3162/@51 |
| Operating Cost (USD) | -- | 1,172,889.61 | 1,181,573.58 | 1,177,246.01 | 1,179,536.40 |
| Emission Cost (USD) | 822,276,015.03 | 261,716,433.24 | 265,735,803.72 | 262,762,118.25 | 264,342,500.66 |
| Energy Not Supplied (MWh) | 58.74 | 35.08 | 35.73 | 35.46 | 35.59 |
| Energy Loss Cost (USD) | 96,732.12 | 37,683.897 | 37,924.76 | 37,794.18 | 37,764.36 |
| PV Cost (USD) | -- | 219,150.00 | 219,150.00 | 217,820.73 | 201,905.96 |
| WT Cost (USD) | -- | 716,686.22 | 718,527.35 | 726,922.86 | 788,482.85 |
| EBPL Charge Cost (USD) | -- | 46,619.27 | 62,897.61 | 622,904.20 | 64,157.08 |
| EBPL Discharge Cost (USD) | -- | 33,927.40 | 34,520.08 | 44,327.91 | 31,512.37 |
| Hypervolume | -- | 0.8741 | 0.8639 | 0.8652 | 0.8663 |
| Spacing | -- | 0.2157 | 0.2293 | 0.2285 | 0.2276 |
| Item/Value | Base Network | MO-ESCHO | MO-SCHO | MO-PSO | MO-SCA |
|---|---|---|---|---|---|
| PV Size (kW)/@Site (Bus) | -- | 2000/@5 | 1980.78/@41 | 1957/@21 | 1971/@21 |
| WT Size (kW)/@Site (Bus) | -- | 1600.04/@28 | 1589.14/@20 | 1631.04/@47 | 1689.04/@27 |
| EBPL Size (kW)/@Site (Bus) | -- | 3148/@29 | 3082/@69 | 3156/@43 | 3101/@43 |
| Operating Cost (USD) | -- | 1,128,894.06 | 1,142,975.44 | 1,130,705.21 | 1,140,575.49 |
| Emission Cost (USD) | 822,276,015.03 | 255,709,362.56 | 257,200,346.08 | 257,110,226.32 | 257,184,223.37 |
| Energy Not Supplied (MWh) | 58.74 | 34.11 | 34.35 | 34.26 | 34.31 |
| Energy Loss Cost (USD) | 96,732.12 | 36,597.84 | 37,088.53 | 36,754.68 | 36,915.34 |
| PV Cost (USD) | -- | 219,150.00 | 216,715.27 | 214,281.33 | 211,428.40 |
| WT Cost (USD) | -- | 687,793.15 | 681,014.93 | 674,104.02 | 690,371.87 |
| DR Cost (USD) | -- | 31,107 | 33,536 | 31,560.75 | 31,744.06 |
| EBPL Charge Cost (USD) | -- | 39,081.58 | 41,915.22 | 42,536.41 | 41,885.24 |
| EBPL Discharge Cost (USD) | -- | 30,175.90 | 37,631.84 | 30,175.90 | 30,128.01 |
| Hypervolume | -- | 0.8976 | 0.8473 | 0.8420 | 0.8478 |
| Spacing | -- | 0.1932 | 0.1975 | 0.1964 | 0.1979 |
| Item/Value | Base Network | MO-ESCHO | MO-SCHO | MO-PSO | NSGA-II | MO-SCA |
|---|---|---|---|---|---|---|
| PV Size (kW)/@Site (Bus) | -- | 1966.49/@5 | 1874.73/@5 | 2000/@61 | 2000/@61 | 2000/@61 |
| WT Size (kW)/@Site (Bus) | -- | 1668.53/@9 | 1776.94/@29 | 1689.11/@29 | 1692.53/@29 | 1794.65/@26 |
| EBPL Size (kW)/@Site (Bus) | -- | 3235.23/@16 | 3495.38/@46 | 3105.35/@24 | 3117.31/@46 | 2850.71/@44 |
| Operating Cost (USD) | -- | 1,080,464.50 | 1,135,574.21 | 1,110,937.53 | 1,118,732.38 | 1,112,283.27 |
| Emission Cost (USD) | 822,276,015.03 | 244,394,019.89 | 246,175,914.50 | 244,734,118.06 | 244,966,504.14 | 244,966,720.48 |
| Energy Not Supplied (MWh) | 58.74 | 32.36 | 33.15 | 32.57 | 32.64 | 32.83 |
| Energy Loss Cost (USD) | 96,732.12 | 37,231.87 | 39,463.82 | 37,472.28 | 37,506.95 | 37,885.61 |
| PV Cost (USD) | -- | 213,150.00 | 205,339.20 | 219,150.00 | 219,150.00 | 219,150.00 |
| WT Cost (USD) | -- | 656,686.10 | 685,178.18 | 661,186.65 | 661,288.91 | 692,186.65 |
| EBPL Charge Cost (USD) | -- | 62,007.44 | 60,400.06 | 61,929.80 | 61,947.33 | 56,122.07 |
| EBPL Discharge Cost (USD) | -- | 41,698.82 | 38,248.03 | 40,056.71 | 40,107.56 | 37,883.61 |
| Hypervolume | -- | 0.8930 | 0.8829 | 0.8875 | 0.8859 | 0.8842 |
| Spacing | -- | 0.1945 | 0.1988 | 0.1976 | 0.1980 | 0.1982 |
| Item/Value | Base Network | RES with EBPL (Case IV) | RES with EVPL |
|---|---|---|---|
| PV Size (kW)/@Site (Bus) | -- | 1966.49/@5 | 2000/@61 |
| WT Size (kW)/@Site (Bus) | -- | 1668.53/@9 | 1695.37/@29 |
| ESS Size (kW)/@Site (Bus) | -- | 3235.23/@16 | 3186.94/@46 |
| Operating Cost (USD) | -- | 1,080,464.50 | 1,107,520.13 |
| Emission Cost (USD) | 822,276,015.03 | 244,394,019.89 | 244,574,237.46 |
| Energy Not Supplied (MWh) | 58.74 | 32.36 | 33.19 |
| Energy Loss Cost (USD) | 96,732.12 | 37,231.87 | 37,455.82 |
| PV Cost (USD) | -- | 213,150.00 | 219,150.00 |
| WT Cost (USD) | -- | 656,686.10 | 662,224.37 |
| ESS Charge Cost (USD) | -- | 62,007.44 | 61,975.01 |
| ESS Discharge Cost (USD) | -- | 41,698.82 | 40,412.29 |
| Item/Value | Base Network | Case IV | Case V |
|---|---|---|---|
| PV Size (kW)/@Site (Bus) | -- | 1966.49/@5 | 2000/@5 |
| WT Size (kW)/@Site (Bus) | -- | 1668.53/@9 | 1785.36/@9 |
| EBPL Size (kW)/@Site (Bus) | -- | 3235.23/@16 | 3466.08/@28 |
| Operating Cost (USD) | -- | 1,080,464.50 | 1,145,701.19 |
| Emission Cost (USD) | 822,276,015.03 | 244,394,019.89 | 256,742,669.36 |
| Energy Not Supplied (kWh) | 58.74 | 32.36 | 34.93 |
| Energy Loss Cost (USD) | 96,732.12 | 37,231.87 | 39,422.037 |
| PV Cost (USD) | -- | 213,150.00 | 219,150.00 |
| WT Cost (USD) | -- | 656,686.10 | 692,370.51 |
| EBPL Charge Cost (USD) | -- | 62,007.44 | 65,714.18 |
| EBPL Discharge Cost (USD) | -- | 41,698.82 | 44,260.89 |
| Item/Value | Base Network | Case I | Case II | Case III | Case IV | Case V |
|---|---|---|---|---|---|---|
| PV Size (kW)/@Site (Bus) | -- | 2000/@4 | 2000/@5 | 2000/@5 | 1966.49/@5 | 2000/@5 |
| WT Size (kW)/@Site (Bus) | -- | 1596.07/@20 | 1605.12/@28 | 1600.04/@28 | 1668.53/@9 | 1785.36/@9 |
| EBPL Size (kW)/@Site (Bus) | -- | -- | 3115/@32 | 3148/@29 | 3235.23/@16 | 3466.08/@28 |
| Operating Cost (USD) | -- | 1,237,651.10 | 1,172,889.61 | 1,128,894.06 | 1,080,464.50 | 1,145,701.19 |
| Emission Cost (USD) | 822,276,015.03 | 360,474,505.31 | 261,716,433.24 | 255,709,362.56 | 244,394,019.89 | 256,742,669.36 |
| Energy Not Supplied (MWh) | 58.74 | 39.63 | 35.08 | 35.21 | 32.36 | 34.93 |
| Energy Loss Cost (USD) | 96,732.12 | 56,768.30 | 37,683.897 | 36,597.84 | 37,231.87 | 39,422.037 |
| PV Cost (USD) | 219,150.00 | 219,150.00 | 219,150.00 | 213,150.00 | 219,150.00 | |
| WT Cost (USD) | 755,072.30 | 716,686.22 | 687,793.15 | 656,686.10 | 692,370.51 | |
| EBPL Charge Cost (USD) | -- | 46,619.27 | 31,107 | 62,007.44 | 65,714.18 | |
| EBPL Discharge Cost (USD) | -- | 33,927.40 | 39,081.58 | 41,698.82 | 44,260.89 |
| Item/Value | Case V (UT–CQR) | MCS | CM |
|---|---|---|---|
| PV Size (kW)/@Site (Bus) | 2000/@5 | 2000/@5 | 2000/@5 |
| WT Size (kW)/@Site (Bus) | 1785.36/@9 | 1794.36/@20 | 1770.50/@27 |
| EBPL Size (kW)/@Site (Bus) | 3466.08/@28 | 3457.08/@28 | 3579.34/@32 |
| Operating Cost (USD) | 1,145,701.19 | 1,150,716.44 | 1,148,701.87 |
| Emission Cost (USD) | 256,742,669.36 | 258,522,795.10 | 258,135,494.36 |
| Energy Not Supplied (kWh) | 34.93 | 35.04 | 35.13 |
| Energy Loss Cost (USD) | 39,422.037 | 395,17.81 | 39,496.05 |
| PV Cost (USD) | 219,150.00 | 219,150.00 | 219,150.00 |
| WT Cost (USD) | 692,370.51 | 694,743.88 | 688,802.23 |
| EBPL Charge Cost (USD) | 65,714.18 | 68,311.56 | 66,214.50 |
| EBPL Discharge Cost (USD) | 44,260.89 | 45,073.89 | 44,191.48 |
| Computational Cost (s) | 348 | 1953 | 1755 |
| Standard Deviation (%) | 0.9311 | 1.2853 | 1.19 |
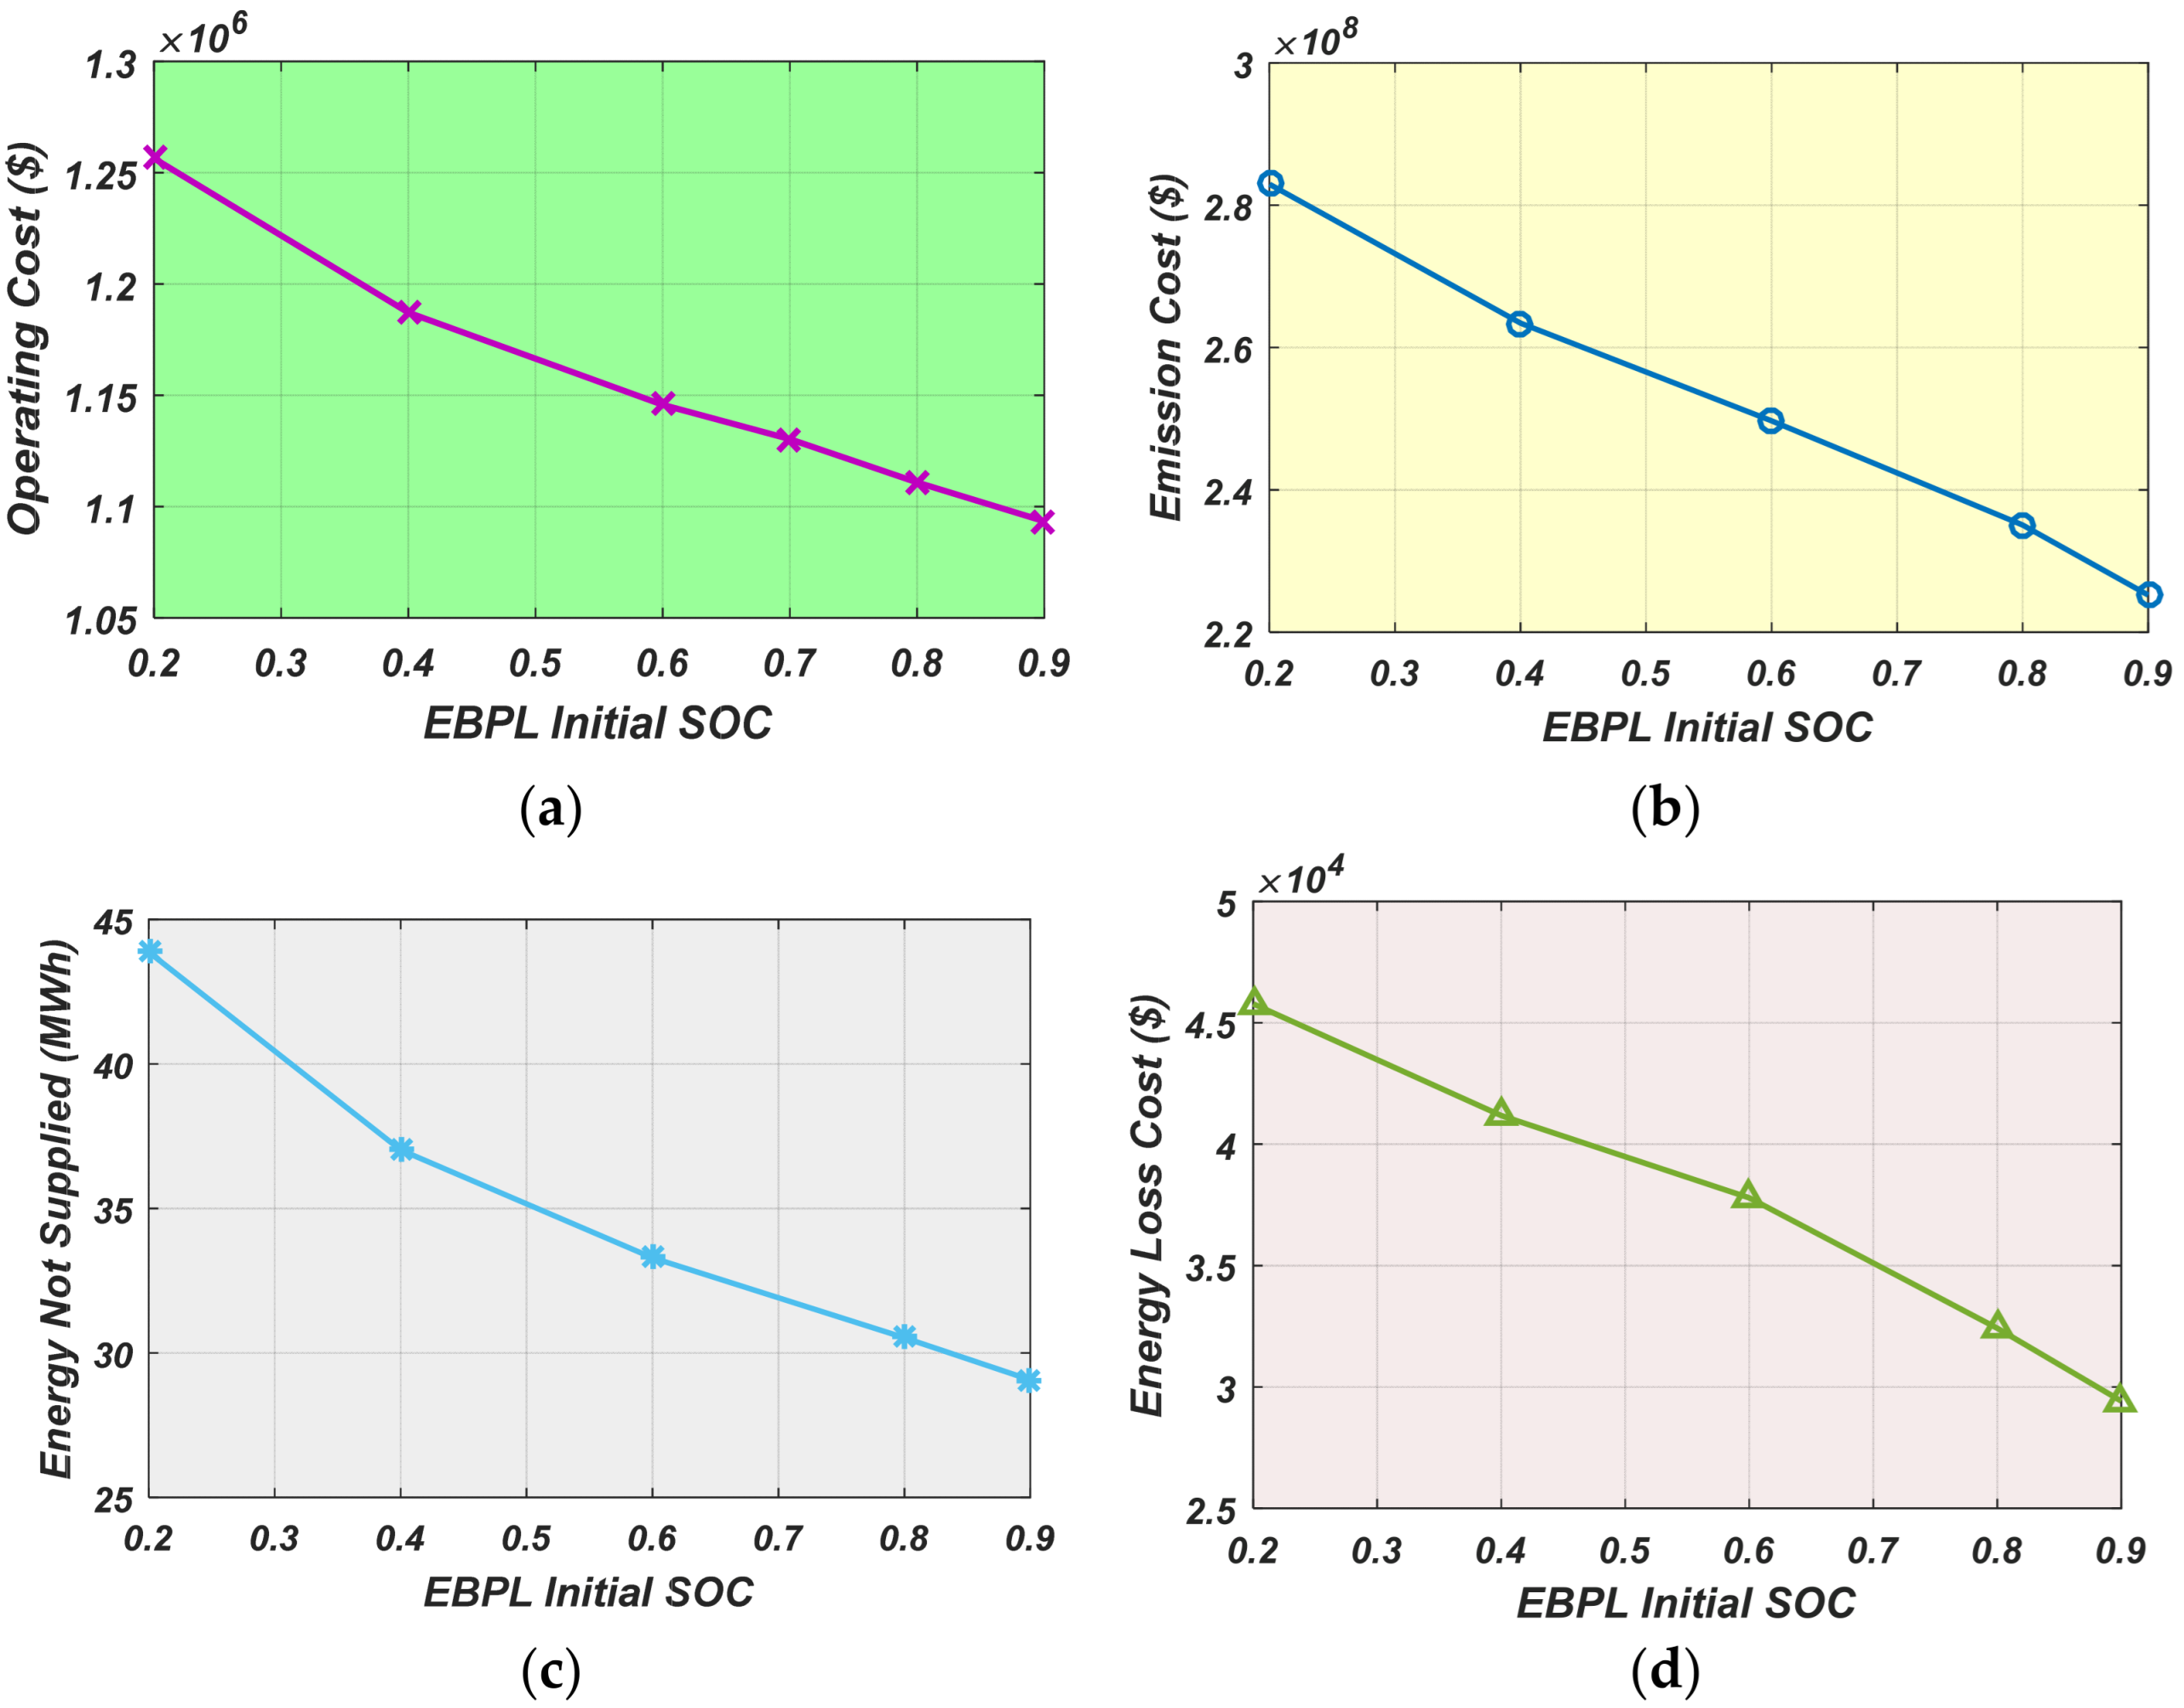
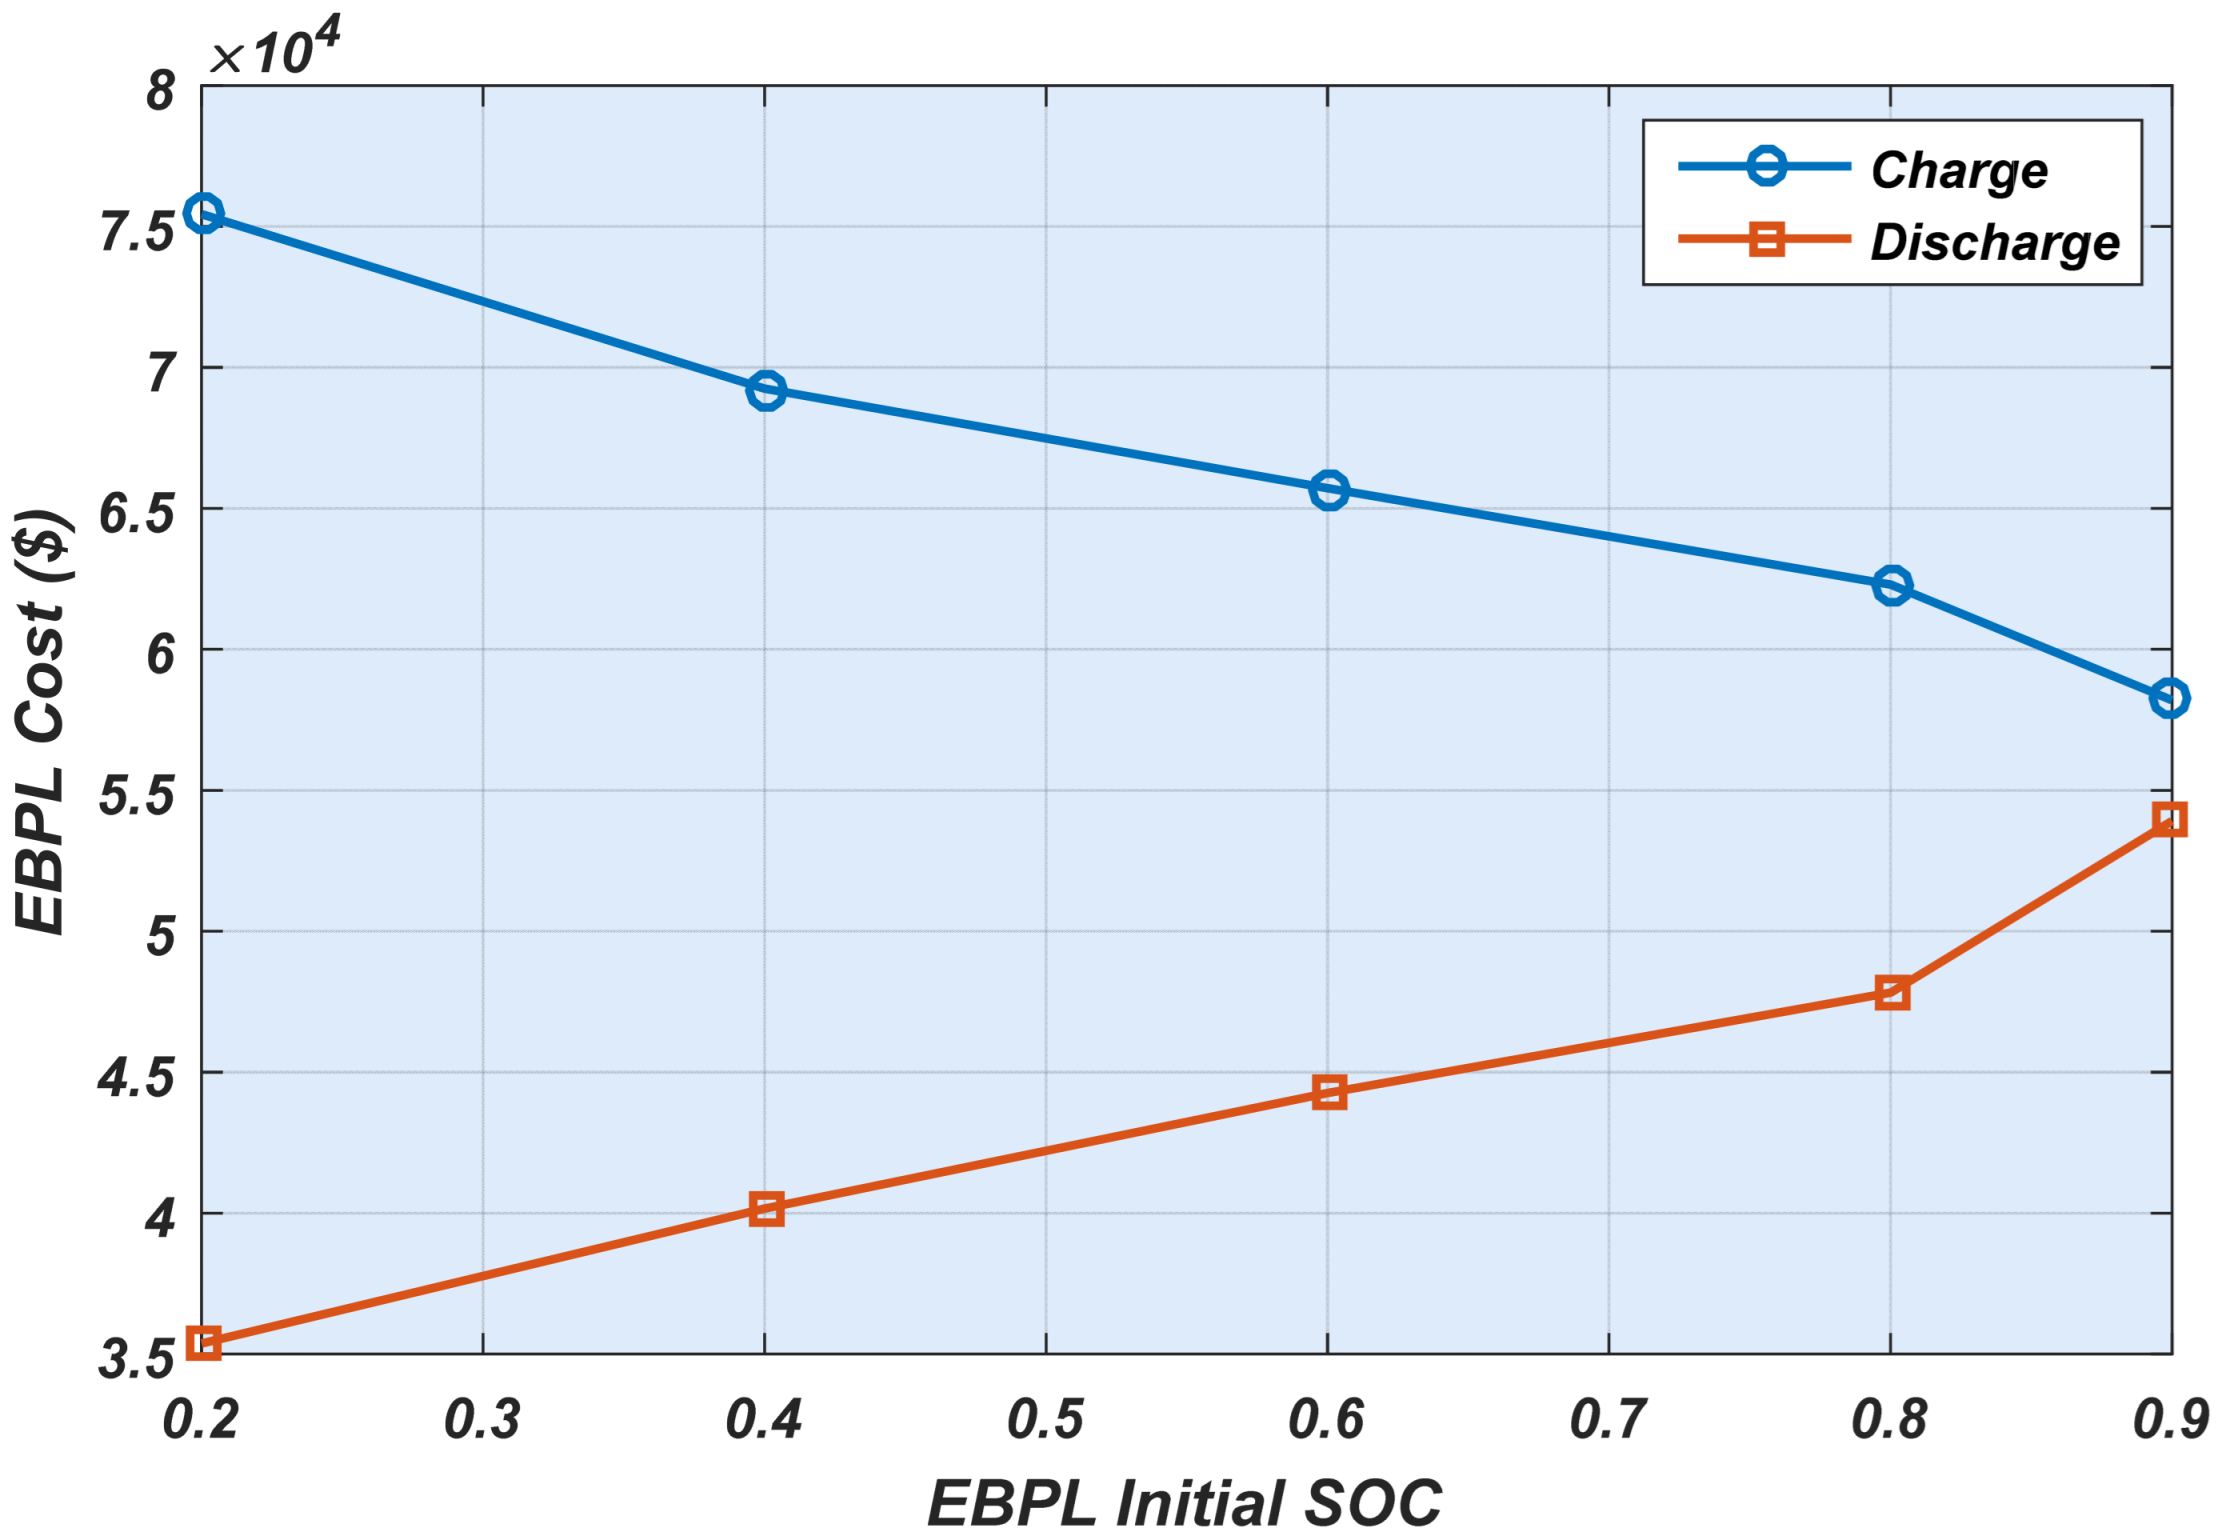
| Item/Value | 20% | 40% | 60% | 70% | 80% | 90% |
|---|---|---|---|---|---|---|
| Operating Cost (USD) | 1,256,442.37 | 1,187,212.58 | 1,145,701.19 | 1,130,241.73 | 1,110,904.95 | 1,093,460.44 |
| Emission Cost (USD) | 278,932,576.621 | 268,487,882.003 | 256,742,669.36 | 248,523,356.29 | 238,982,528.62 | 227,195,051.14 |
| Energy Not Supplied (MWh) | 43.87 | 38.60 | 34.93 | 33.02 | 31.11 | 29.06 |
| Energy Loss Cost (USD) | 45,783.760 | 42,489.704 | 39,422.037 | 37,509.822 | 33,615.162 | 29,422.512 |
| EBPL Charge Cost (USD) | 75,440.11 | 69,245.49 | 65,714.18 | 62,299.90 | 58,194.60 | 53,245.97 |
| EBPL Discharge Cost (USD) | 35,383.97 | 40,167.45 | 44,260.89 | 47,820.86 | 53,906.31 | 59,231.91 |
| Item/Value | 2.5 MWh | 3.0 MWh | 3.5 MWh | 4.0% |
|---|---|---|---|---|
| Operating Cost (USD) | 1,156,415.31 | 1,148,912.46 | 1,145,701.19 | 1,145,682.53 |
| Emission Cost (USD) | 265,127,519.442 | 258,369,115.27 | 256,742,669.36 | 256,740,275.28 |
| Energy Not Supplied (MWh) | 37.18 | 35.12 | 34.93 | 34.93 |
| Energy Loss Cost (USD) | 41,928.61 | 39,835.267 | 39,422.037 | 39,420.816 |
| EBPL Charge Cost (USD) | 59,472.32 | 63,211.47 | 65,714.18 | 65,717.26 |
| EBPL Discharge Cost (USD) | 38,625.08 | 42,289.16 | 44,260.89 | 44,262.31 |
Disclaimer/Publisher’s Note: The statements, opinions and data contained in all publications are solely those of the individual author(s) and contributor(s) and not of MDPI and/or the editor(s). MDPI and/or the editor(s) disclaim responsibility for any injury to people or property resulting from any ideas, methods, instructions or products referred to in the content. |
© 2025 by the authors. Published by MDPI on behalf of the World Electric Vehicle Association. Licensee MDPI, Basel, Switzerland. This article is an open access article distributed under the terms and conditions of the Creative Commons Attribution (CC BY) license (https://creativecommons.org/licenses/by/4.0/).
Share and Cite
ur Rehman, M.; Shirode, U.R.; Pawar, A.S.; Wong, T.J.; Khudaynazarov, E.; Arabi Nowdeh, S. Emission/Reliability-Aware Stochastic Optimization of Electric Bus Parking Lots and Renewable Energy Sources in Distribution Network: A Fuzzy Multi-Objective Framework Considering Forecasted Data. World Electr. Veh. J. 2025, 16, 624. https://doi.org/10.3390/wevj16110624
ur Rehman M, Shirode UR, Pawar AS, Wong TJ, Khudaynazarov E, Arabi Nowdeh S. Emission/Reliability-Aware Stochastic Optimization of Electric Bus Parking Lots and Renewable Energy Sources in Distribution Network: A Fuzzy Multi-Objective Framework Considering Forecasted Data. World Electric Vehicle Journal. 2025; 16(11):624. https://doi.org/10.3390/wevj16110624
Chicago/Turabian Styleur Rehman, Masood, Ujwal Ramesh Shirode, Aarti Suryakant Pawar, Tze Jin Wong, Egambergan Khudaynazarov, and Saber Arabi Nowdeh. 2025. "Emission/Reliability-Aware Stochastic Optimization of Electric Bus Parking Lots and Renewable Energy Sources in Distribution Network: A Fuzzy Multi-Objective Framework Considering Forecasted Data" World Electric Vehicle Journal 16, no. 11: 624. https://doi.org/10.3390/wevj16110624
APA Styleur Rehman, M., Shirode, U. R., Pawar, A. S., Wong, T. J., Khudaynazarov, E., & Arabi Nowdeh, S. (2025). Emission/Reliability-Aware Stochastic Optimization of Electric Bus Parking Lots and Renewable Energy Sources in Distribution Network: A Fuzzy Multi-Objective Framework Considering Forecasted Data. World Electric Vehicle Journal, 16(11), 624. https://doi.org/10.3390/wevj16110624


