Abstract
This study aims to evaluate the operational efficiency of electric vehicle (EV) charging stations and explore optimization strategies to enhance resource utilization and service performance. A systematic review approach was first applied to identify the main evaluation indicators and influencing factors from existing studies. Subsequently, a super-efficiency Data Envelopment Analysis (DEA) model was used to assess the efficiency of six EV charging stations in a certain City, China. The robustness analysis was carried out, and the output variables were replaced, and the evaluation results did not change. The results show substantial disparities in efficiency across stations: C1 exhibits the highest operational efficiency, while C3 performs the lowest. The inefficiencies primarily result from supply–demand mismatches and redundant capacity investment. Based on these findings, the study proposes both overall and localized optimization strategies to improve operational performance. The results provide valuable insights for urban energy infrastructure planning and contribute to the enhancement of high-quality, low-carbon transportation development in China.
1. Introduction
1.1. Research Background
Driven by the global energy structure transformation and low-carbon development trend, the transportation sector is undergoing profound changes. As a key link in the electrification of transportation, the construction of charging infrastructure is becoming an important guarantee for the rapid development of new energy vehicles (NEVs). Especially against the backdrop of China’s strategic goals of “carbon peak and carbon neutrality”, electric vehicles (EVs) are expected to reduce transportation carbon emissions and promote green travel. As the core of energy supply for EVs, the layout scale, technical level, and service capability of charging facilities have become key factors restricting industrial development. Therefore, accelerating the construction of charging infrastructure, optimizing the layout of charging networks, and enhancing service guarantee capabilities are essential paths for promoting the high-quality development of NEVs.
In recent years, China has attached great importance to the construction of charging infrastructure, viewing it as a crucial lever for building a modern energy system and promoting transportation transformation [1]. Since the State Council issued the “Guiding Opinions on Accelerating the Construction of Electric Vehicle Charging Infrastructure” in 2015, the country has introduced a series of policy documents, systematically outlining the development direction, construction goals, standards, and financial support for charging infrastructure [2]. These policies aim to accelerate the construction of charging and battery swapping networks, expand the coverage of fast-charging networks in cities and on highways, and enhance the intelligence and standardization of charging piles. Local governments have also responded positively by formulating local plans and subsidy policies, promoting the integrated development of public charging networks with residential, office, commercial, and other areas.
According to the latest news released by the China Electric Vehicle Infrastructure Promotion Alliance, the total number of new charging stations added nationwide in 2024 was 4.222 million. Among them, the increase in public charging stations decreased by 8.1% year-on-year, with 853,000 new public charging stations and 3.368 million new private charging stations. As of the end of 2024, the number of charging stations built nationwide is 12.818 million, with a vehicle to station ratio of approximately 2.7:1. The development scale of pure electric vehicles basically meets the planning requirements of the “Guiding Opinions of the General Office of the State Council on Accelerating the Construction of Electric Vehicle Charging Infrastructure”, but the number of charging piles has obviously not reached the national overall plan and is still far from meeting the charging needs of pure electric vehicles. To complete the above charging facility construction plan, the government has provided a large amount of construction and operation subsidies to charging facility construction enterprises. The subsidy measures have greatly promoted the construction speed of charging facilities and played an important role in promoting China’s new energy industry [3].
With the rapid expansion of charging infrastructure, the construction of electric vehicle (EV) charging stations has accelerated significantly. However, the level of operational management has not kept pace, revealing a range of challenges that hinder high-quality development [4]. First, the spatial distribution of charging stations remains uneven, leading to inefficient resource allocation—some regions experience infrastructure redundancy, while others, particularly high-demand areas, continue to face a shortage of charging facilities. Second, operational inefficiencies are prevalent, including low utilization rates, high equipment idle times, and a mismatch between service capacity and actual demand. These issues result in prolonged investment payback periods and mounting pressure on operators. Additionally, station management remains largely dependent on manual experience, lacking systematic data support and scientific evaluation mechanisms, which limits the ability to identify and address potential problems in a timely manner.
Against this backdrop, improving the operational efficiency of EV charging stations has become a key strategy for optimizing infrastructure management, enhancing user satisfaction, and advancing the transition to green mobility [5]. This study develops a performance evaluation framework tailored to EV charging stations and employs a super-efficiency Data Envelopment Analysis (DEA) model to conduct a systematic efficiency assessment. The analysis aims to identify inefficiencies and resource misallocations, based on which targeted strategies are proposed to optimize operations and support the efficient, intelligent, and sustainable development of charging infrastructure.
1.2. Literature Review
Battery electric vehicles (BEVs) and their supporting charging infrastructure are inherently complementary. However, compared with the rapid development of BEVs, research on the construction and planning of supporting charging stations has significantly lagged behind. With growing attention from scholars both domestically and internationally, research on charging infrastructure has expanded considerably in recent years. This study draws inspiration from a rich body of existing literature.
From the existing research results, it can be seen that there are two ideas related to the operation efficiency of charging stations in our country. For example, the evaluation model of Cai Jianming et al. to select the optimal location of the charging and swapping station integrates multi-standard decision-making. The index system is constructed from four dimensions: economy, technology, social and environmental, and a six-stage evaluation model integrating fuzzy DEMATEL and enhanced MultiMOORA-Borda algorithm is proposed [6]. Fatih Ecer et al. took 7 charging stations in Izmir, Turkey as examples, and constructed an evaluation system including 4 main criteria and 13 sub-criteria including economic, environmental, social and technical criteria, among which system reliability and construction cost were confirmed to be the most critical factors [7]. Zhao et al. constructed a comprehensive multi-criterion decision-making evaluation index system for electric vehicle charging stations, covering four main dimensions: economic cost, traffic conditions, grid standards, and environmental tolerance, and calculated the comprehensive weight by combining subjective weight (DEMATEL) and objective weight (entropy weight method), and optimized the site selection decision through the fusion model of gray correlation analysis (GRA) and TOPSIS method [8].
Zhang Yu et al. used the public transportation operation data of 36 central cities in our country from 2010 to 2013 as samples and constructed an evaluation model of operational efficiency and service effectiveness by using stochastic frontier analysis method and beyond logarithmic production function. In the selection of input indicators, the number of employees, fuel volume and vehicle standard number are selected as the core input variables, which represent labor, energy and capital investment, respectively. The output indicators are divided into operational efficiency output and service effect output [9]. Qimengren used the geographic information system (GIS) to construct a spatial visualization evaluation index system including population distribution, transportation organization, infrastructure, land use, and regional economy, and comprehensively evaluated and analyzed the factors affecting the spatial demand of PCS by integrating subjective and objective factors in spatial geography [10].
Some scholars have approached the problem from the perspective of multi-objective site selection and capacity planning. For example, Huang et al. considered installation, operation, and maintenance costs, and incorporated a user-equilibrium traffic assignment model that accounts for station congestion and travel time, thereby providing a solution for siting fast-charging stations within urban networks [11]. Upchurch et al. determined the capacity of charging stations based on peak charging demand data. However, this planning approach significantly increases the construction and operational costs of charging stations and fails to account for the adverse effects of demand fluctuations on the power grid, thus presenting certain limitations [12]. Wang et al. formulated a queuing theory model with the dual objectives of maximizing charging pile utilization and minimizing electric vehicle charging costs, thereby deriving an optimal configuration scheme for charging piles [13]. Huang et al. proposed a capacity planning method for charging stations based on traffic flow and the charging demand at nodes along highways [14]. Similarly, Yang Bing et al. applied a queuing model to calculate the charging station capacity at various distribution network nodes and employed a particle swarm optimization algorithm to determine the optimal construction capacity of charging piles at each node of the power distribution network [15]. Cao et al. proposed a spatiotemporal demand forecasting method for electric vehicle charging based on station attractiveness and traffic time index. An attractiveness model was developed by considering factors such as travel distance, number of available charging piles, number of queued vehicles, and expected waiting time [16]. For the facility planning and optimization of charging stations, Liu et al. constructed a dual-objective site selection model to minimize the construction cost and maximize the coverage of charging stations [17]. Wang et al. employed a robust optimization algorithm to solve the site selection model [18]. Yang et al. investigated a cost-minimization facility location model under both charging and battery-swapping modes for electric logistics vehicles [19]. Gan et al. demonstrated the feasibility and effectiveness of a bi-level planning model for integrated charging, swapping, discharging, and energy storage stations, proposing an upper-level optimization for site selection and a lower-level division of service areas, thereby extending the functional scope of electric vehicle charging stations [20]. Lin et al. carried out interdisciplinary joint optimization planning under the transportation system and power grid, proposed a spatio-temporal model for determining the site and scale of electric vehicle charging stations, and proposed a multi-stage infrastructure planning strategy [21]. Wang et al. comprehensively considered factors such as charging demand, urban planning, service level of charging stations, geographic location, and competitive capacity. By introducing factors such as station attractiveness and regional heterogeneity, their study incorporated the perspectives of multiple stakeholders, including the government, power grid, operators, and users [22]. Some scholars have integrated urban geographic information and incorporated charging convenience and waiting time as constraints, thereby enabling more effective determination of charging station locations and the number of chargers required [23,24]. Tan Yangyang et al. constructed a bi-level optimization model for electric vehicle charging stations that couples investment returns with user utility, demonstrating that the planning of EV charging stations should consider not only investment costs and returns but also user choices and satisfaction [25]. From an international research perspective, Europe, the United States and the Asia–Pacific region have accumulated rich experience in charging infrastructure planning and efficiency assessment. Scholars in the United States and Europe generally use multi-criteria decision-making and DEA models to evaluate the location and service reliability of charging stations [26]. Japanese and Korean scholars pay more attention to the collaborative optimization of charging facilities with renewable energy and smart grid systems [27].
There is little literature to propose the operation efficiency of charging stations and propose optimization schemes, and there is a lack of systematic operation management analysis and multi-dimensional efficiency evaluation. At the same time, there is insufficient attention to user charging behavior, supply and demand matching, and intelligent management, and the promotion and innovation of empirical research need to be improved. Existing DEA-based studies focus on inter-city or regional macro efficiency measurements, and lack micro-empirical studies on single operating entities. Therefore, the basic idea of this study is as follows: firstly, taking 6 charging stations in a city as an example, the operation efficiency of charging stations is evaluated on the basis of establishing an evaluation index system and DEA evaluation model; Secondly, the impact of supply and demand matching on the operational efficiency of different charging stations is analyzed, and the core influencing factors affecting the operation efficiency of charging stations are determined as the mismatch between supply and demand. Then, suggestions are made for the optimization of the operation of the charging station.
The innovations of this paper are mainly reflected in the following aspects: constructing an evaluation index system, proposing a DEA model for the operation efficiency evaluation of operated dedicated charging stations, and introducing an ultra-efficient DEA model on the basis of the traditional DEA model to make up for the defects of classical DEA that cannot distinguish effective units, and realize the refined ranking of efficiency between different charging stations; At the same time, for the first time, starting from the “supply and demand matching relationship”, the key factors affecting the efficiency of charging stations are identified, and the structural contradiction between oversupply and insufficient demand is revealed. Although this paper refers to the structure of systematic reviews, the core of the research is to conduct empirical analysis of typical cases through the DEA model, so it belongs to “empirical case studies” rather than systematic review studies in the strict sense.
The structure of the paper is as follows: Section 1 outlines the research background, problem statement, objectives, significance, and based on a review of domestic and international studies—defines the main research content and technical framework. Section 2 introduces the theoretical foundations of the DEA and super-efficiency DEA models used for operational efficiency evaluation. Section 3 provides contextual background on charging stations, followed by a detailed analysis of the six selected charging stations. Section 4 conducts efficiency evaluation and put forward charging station operation optimization strategies for efficiency Improvement. Section 5 draws conclusions and proposes policy implications. The framework of this article is shown in Figure 1.
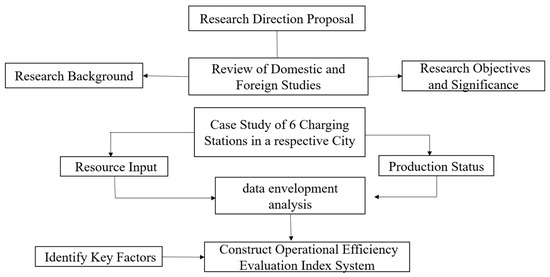
Figure 1.
Technology roadmap.
2. Methodology
2.1. DEA Evaluation Model
Data envelopment analysis (DEA) is an efficiency evaluation method for multiple decision units with multiple inputs and outputs, which was created by CHARNES and COOPER in 1978. DEA is a systematic analysis method based on relative efficiency for the relative effectiveness evaluation of the relationship between multiple indicators input and output of multiple evaluated units. Compared with the parametric model that relies on specific function assumptions, DEA can process multi-dimensional input and output indicators at the same time under limited sample conditions without presetting the production function form, which is suitable for efficiency measurement and optimization analysis of complex service systems such as charging stations.
DEA is a linear programming model expressed as the ratio of output to input. It attempts to maximize the efficiency of a service unit by comparing the efficiency of a particular unit with the performance of a group of similar units providing the same service. In this process, some units that achieve 100% efficiency are called relative efficient units, while others that score less than 100% efficiency are called inefficient units. In this way, business managers can use DEA to compare a group of service units, identify relatively inefficient units, measure the severity of inefficiency, and find ways to reduce inefficiency by comparing inefficiency and efficient units. The DEA method has an absolute advantage in dealing with the multi-input and multi-output problems in this study [28].
The two most widely used classical DEA models are the CCR model and the BCC model. The CCR model assumes constant returns to scale (CRS) and measures total technical efficiency, while the BCC model assumes variable returns to scale (VRS), allowing for the decomposition of total efficiency into pure technical efficiency and scale efficiency.
In the classical DEA framework, the efficiency score of each DMU satisfies the condition ≤ 1. When < 1, the DMU is deemed DEA-inefficient, allowing for performance comparisons and rankings. However, when = 1, the DMUs are considered DEA-efficient, but cannot be ranked among each other, which may result in significant evaluation bias when many DMUs appear equally efficient.
Suppose there are two Decision n Making Units (DMUs), which are recorded as . Each DMU has m input indicators () and s output indicator ). The objective is to assess the relative efficiency of the evaluated unit O.
- (1)
- CCR model
Input-Oriented
where θ ∈ (0, 1] is the efficiency value; represents the reference set weight; = 1 and there is no relaxation variable; effective for DEA.
Output-Oriented
where indicates the output magnification; when ; is valid for DEA.
- (2)
- BCC model
Add scale constraints to the CCR model:
Get the BBC model:
Input Orientation:
The model can eliminate the return of scale factor and measure only “pure technical efficiency”.
2.2. Super-Efficiency DEA Model
Anersen and Petersen proposed an extended model of DEA in 1993—the super-efficient DEA model, which excludes a certain decision unit from the set of decision units when evaluating it, so that the relatively effective decision units in the classical DEA model remain relatively effective, and the properties of the relatively ineffective decision units do not change, and the calculated efficiency value is allowed to exceed 1, and each decision unit can be compared and sorted by the size of the efficiency value. This improves the accuracy of evaluation [29].
Suppose there are n Decision-Making Units (DMUs). Each DMU has m input indicators and s output indicators, and the input vector is . The output vector is . The evaluated unit is O.
- (1)
- Enter the Guided Super efficiency Model
The optimal solution is . The super efficiency score is defined as:
If > 1, the DMU is a unit of super efficiency.
- (2)
- Output-oriented super efficiency model
The best solution is ,
The super efficiency score is:
If > 1, this indicates that the efficiency of the DMU exceeds the effective front, which is a unit of super-efficiency.
3. Case Study of Charging Stations
3.1. Project Overview
Currently, battery electric vehicles (BEVs) in a representative city can be broadly categorized into three types: public vehicles, private vehicles, and other commercially operated vehicles (such as ride-hailing cars, taxis, and logistics vehicles). The city’s electric vehicle operations are divided between two companies: one operating in the urban center and the other in surrounding township areas. The charging infrastructure for the electric vehicle fleets of these two companies is operated by Company R and Company C, respectively.
This study focuses on the charging stations operated by Company R, evaluating the input–output dynamics of its operations.
3.1.1. Project Background
Company R was established in May 2019 with a registered capital of 20 million RMB. It currently operates six charging stations, equipped with 152 charging guns and a total installed charging capacity of 6000 kW. As the exclusive charging service provider for electric vehicles in the representative city, Company R serves a fleet of 148 electric vehicles. In 2020, the company’s total electricity output reached 5.715 million kWh, generating a revenue of 3.12 million RMB, with a net profit after tax of −600,000 RMB.
The Representative City Vehicle Transport Company was founded in October 1992. As a state-owned enterprise specializing in urban vehicle transportation, it operates seven vehicle terminals and manages a fleet of 630 vehicles. There are 190 new energy vehicles, comprising 110 gasoline—electric hybrids and 80 gas—electric hybrids, representing 57% of the entire fleet. The company operates 61 routes covering the urban area, with around 3000 daily departures and a total daily mileage of 80,000 km. The vehicle ownership rate is 20.1 units per 10,000 people, and the system serves approximately 170,000 passengers per day.
Prior to 2019, the vehicle transport company independently operated one charging station, serving 30 electric vehicles. After Company R was founded, the station was handed over for upgrading and operation by Company R.
3.1.2. Project Investment and Revenue Expectations
According to the investment agreement, Company R planned to build six new charging stations in 2019, equipped with 150 charging guns and a total charging capacity of 9000 kW. The total investment was projected at 18.75 million RMB, covering both high-voltage distribution and low-voltage charging components.
In 2019, the Representative City Vehicle Company procured 150 new electric vehicles, with plans to replace 50 additional vehicles annually until electric vehicles account for 60% of the fleet. Each electric vehicle is expected to travel an average of 180 km per day, with an energy consumption rate of 0.85 kWh/km. Based on these assumptions, electricity demand is projected at 4.17 million kWh in 2019 and 10.1 million kWh in 2020. With a charging service fee of 0.70 RMB/kWh, net profits are estimated at 490,000 RMB for 2019 and 1.91 million RMB for 2020. From 2021 onward, annual net profits are expected to grow steadily, reaching approximately 3.5 million RMB by 2024.
3.1.3. Project Construction Plan
According to the investment agreement, Company R initially planned to install 75 integrated charging units (each with dual charging guns) to achieve a 1:1 vehicle-to-charger ratio for the 150 new electric vehicles procured in 2019. This configuration required a total charging capacity of 9000 kW and a transformer capacity of 10,588 kVA.
However, during implementation, Company R adopted modular intelligent flexible charging stack technology in line with advancements in the charging market. This allowed the company to maintain the 1:1 vehicle-to-charger ratio while reducing the total charging capacity to 6000 kW, thereby lowering the overall power distribution cost. Detailed specifications of the station configurations are provided in Table 1.

Table 1.
Brief introduction to the charging station infrastructure of company R.
The representative city’s electric vehicles fleet consists of two vehicle models: the 12-m vehicles and the 8.5-m vehicles. According to actual measurements, the 12-m vehicles model is equipped with a 303 kWh battery and has an average energy consumption of 1.13 kWh/km. The 8.5-m vehicles model features a 187 kWh battery with an average consumption of 0.66 kWh/km. Both models use lithium iron phosphate (LFP) batteries supplied by Contemporary Amperex Technology Co., Limited (CATL), with a maximum charging current of 250 Ah.
According to operational data, the maximum daily mileage for the 12-m vehicles model is 250 km, while the 8.5-m vehicles model reaches up to 230 km. Energy consumption statistics indicate that both models retain at least 20% of their battery capacity upon completion of daily operations. Vehicles services begin as early as 5:30 AM and end around 10:00 PM, at which point vehicles return to the depot. Given these operating patterns, Company R has adopted a centralized overnight charging strategy. As long as the battery is fully charged before the start of service, the vehicle can complete its full day of operation without the need for midday recharging. Vehicles are recharged at night upon returning to the depot.
Based on the required daily energy replenishment and the overnight parking window, the charging system is designed to ensure that each vehicle can be fully charged during its nightly downtime. In other words, as long as the available charging capacity during overnight parking is sufficient to fully recharge each vehicle, the daily operational energy needs can be reliably met.
where denote the total available charging duration, the total daily charging demand, and the total charging capacity available at the station.
Based on Equation (1), the minimum required charging power at each site can be derived. Taking into account future increases in the number of electric vehicles due to the fleet replacement plan, as well as potential range reductions caused by battery degradation (which may lead to temporary midday recharging needs), the charging and high-voltage distribution configuration for the five charging stations is shown in Table 1.
According to the characteristics of flexible modular charging stack technology, the standard charging power is 30 kW per charging pile under equal-load charging conditions across all vehicles in the station. In anticipation of potential midday emergency recharging, each charging station is also equipped with fast-charging piles, allocated based on the number and routes of vehicles served at each terminal. The maximum power output for these fast-charging piles is 120 kW.
3.2. Analysis of Charging Station Operations
In light of electric vehicle charging demand and the State Grid’s local distribution policy—which limits a single transformer (box-type substation) to no more than 630 kVA, with a maximum of two 630 kVA transformers in series—R Company prioritized the installation of dedicated transformer rooms where space was sufficient. In space-constrained areas, series-connected box-type transformers were adopted instead, allowing for future scalability.
3.2.1. Investment Cost Analysis of Charging Stations
(1) Capital investment in charging stations
R Company invested a total of 17.3228 million RMB in the construction of charging stations. This investment covers high-voltage power distribution systems, low-voltage charging systems, above-ground structures, and design costs. A detailed breakdown is provided in Table 2.
Table 2.
Detailed investment breakdown of charging station construction by company R.
(2) Personnel investment
To ensure proper management of the charging stations, Company R employs 8 administrative staff, with a total annual compensation of 1.2 million RMB (including employee benefits). In addition, 6 on-site charging operators are employed, with total annual wages of 330,000 RMB.
(3) Other expenditures
Routine operational expenses—including office rental, vehicle use, and business hospitality—amount to approximately 500,000 RMB per year. Annual costs for equipment maintenance and repair are estimated at 80,000 RMB.
3.2.2. Output Performance of the Charging Stations
As the charging stations became operational at the end of 2019, data from that year is not representative. This study evaluates the output performance based on actual operational data from 2020.
According to the 2020 annual financial report of Company R, the six charging stations sold a total of 8.5 million kWh of electricity, generating charging revenues of 4.62 million RMB, but recorded a net loss of 600,000 RMB.
(1) Return on investment analysis
In 2020, with a total electricity sales volume of 8.5 million kWh and revenue of 4.62 million RMB, the charging stations operated at a loss of 600,000 RMB. This reflects a significant gap between actual performance and the investment feasibility projections. The variance between expected and actual returns is detailed in Table 3.
Table 3.
Discrepancies between actual output and investment targets of company R.
(2) Output deviation analysis
According to the project feasibility study, the charging station system was expected to serve 200 electric vehicles by 2020. However, only 148 electric vehicles were actually deployed. In addition, advancements in electric vehicle and battery technologies reduced the average daily electricity consumption per vehicle from the estimated 153 kWh to 120 kWh. These two factors directly contributed to the lower-than-expected electricity sales volume in 2020.
The project feasibility report assumed a maximum charging service price of 1.34 RMB/kWh (including electricity costs), with the net service fee after deducting electricity costs expected to be 0.70 RMB/kWh. In reality, due to the delay in transferring the electricity account to Company R, electricity costs were borne by the electric vehicle company, and the service fee was charged at the upper limit of 0.52 RMB/kWh, as regulated by The Representative City Development and Reform Commission in June 2019. This pricing constraint led to a significant decline in total revenue relative to the initial projections.
As a result of the 26% shortfall in the number of vehicles in operation, a 43% reduction in electricity sales, and a 26% drop in gross margin per kWh, the net profit for 2020 fell short of the target set out in the feasibility report.
3.2.3. Analysis of the Current Operational Status of Charging Stations
C1 Charging Station: Located within a major transportation hub, the C1 charging station demonstrates a high utilization rate. Owing to its limited number of chargers, queuing often occurs during peak hours, whereas some idle capacity is observed during nighttime or off-peak periods. Despite its modest number of charging piles and total power capacity, C1 achieves strong operational performance through efficient scheduling and effective service matching. It records the highest net profit per kilowatt, with both power and time utilization rates ranking above the city-wide average. The annual utilization hours per kilowatt are also substantially higher than those of other stations, indicating that high output can be achieved with relatively low investment. Overall, the station exhibits sound supply–demand matching and excellent operational efficiency.
C2 Charging Station: The C2 station is located in the underground parking lot of an office complex, where the demand for vehicle charging remains low. Its construction cost, number of chargers, and total installed power capacity are significantly higher than the optimal configuration. Both time and power utilization rates are relatively low, leading to an evident oversupply and idle capacity. This imbalance reflects an inefficient allocation of charging resources.
C3 Charging Station: Situated in a resort area surrounded by leisure facilities and partially abandoned parking lots, the C3 station suffers from an unstable and sporadic customer flow. The absence of continuous residential or commercial activity results in prolonged idle periods for most chargers. With extremely low utilization and persistent financial losses, C3 exhibits the weakest operational efficiency among all analyzed stations.
C4 Charging Station: The C4 station is positioned on the outskirts of a commercial district, where nearby residential communities already possess sufficient charging infrastructure. As a result, its daily charging demand is limited. The ratio between output and investment is moderate, suggesting a relatively reasonable facility configuration. Both power and time utilization rates fall within the mid-range among all stations. However, insufficient electricity sales and relatively low charging prices constrain profitability, leading to a lower net profit per kilowatt.
C5 Charging Station: Although C5’s geographic location is less favorable than that of C1, its revenue is roughly comparable, supported by a greater number of chargers and higher total power capacity. The station reports a high net profit per kilowatt and the highest power utilization rate, reflecting superior charging efficiency and strong per-vehicle contribution. Nevertheless, the number of charging sessions remains limited, with long idle intervals and low time utilization. Consequently, despite achieving high output under a relatively high investment level, its supply–demand matching and overall operational efficiency are only moderate.
C6 Charging Station: Located near a commercial district, the C6 station operates using leased power distribution facilities. It achieves the highest time utilization rate among all six stations, indicating effective cost control and operational scheduling. However, its power utilization rate is relatively low, suggesting that its peak output capacity is not fully exploited. Furthermore, the reliance on leased facilities may obscure the station’s true cost structure, resulting in seemingly high efficiency while concealing the risk of latent idle capacity.
In summary, the comparative analysis reveals considerable heterogeneity in operational efficiency across stations, primarily driven by differences in location, capacity configuration, and demand matching. Stations with moderate investment and well-balanced supply–demand structures, such as C1 and C6, tend to achieve superior performance, whereas those with excessive capacity or weak location advantages face challenges in profitability and resource utilization.
4. Evaluation of Charging Station Operational Efficiency Based on DEA
4.1. Construction of the Evaluation Index System
This section evaluates the operational efficiency of charging stations using a DEA-based approach. The results serve as a decision-making reference for optimizing station operations. The first step involves defining the input and output variables for the evaluation. This study focuses on dedicated electric vehicle charging stations and evaluates their operational efficiency by analyzing the economic and scale benefits generated under a certain resource input. Optimization measures are then proposed based on the evaluation outcomes.
4.1.1. Definition of Input Indicators
The input variables represent the resource investment of each charging station. In this study, such inputs include capital investment, personnel input, management input, and equipment input.
- Capital investment refers to expenditures incurred during the construction phase, including procurement of high-voltage distribution equipment, design and civil works for the high-voltage system; and for the low-voltage system, the purchase of charging piles and modular chargers, station design, construction, and supporting systems (e.g., lighting, monitoring).
- Personnel input includes operational, maintenance, and management staff assigned to ensure day-to-day functionality of the station.
- Management input involves customer management, market development, and administrative support for ongoing operations.
- Equipment input primarily reflects the total installed charging power and the number of charging piles.
In this study, the following four indicators are selected as input variables for each station:
- Construction cost of each charging station
- Labor cost of charging operators
- Number of charging piles
- Total installed charging power of the station
Due to unified administration across all six stations by a single operator, management costs cannot be disaggregated to individual stations. Therefore, for the sake of evaluation consistency, operational costs exclude enterprise-level management and miscellaneous expenses.
Additionally, due to construction delays and the impact of COVID-19 in early 2020, the electricity usage data from January to March is considered unstable and is excluded from analysis. Only data from April to December 2020, when operations stabilized, is used in the efficiency evaluation. The input indicators are detailed in Table 4.
Table 4.
Input indicators for efficiency evaluation.
4.1.2. Definition of Output Indicators
The core output of a charging station lies in its economic returns. In this study, the following three output indicators are selected to comprehensively evaluate operational efficiency:
(1) For net profit per unit power capacity, this refers to the ratio of the station’s annual net profit to its total installed charging capacity (KW), which reflects the station’s economic performance per unit of investment in charging infrastructure.
(2) For time utilization rate, this is defined as the ratio of effective charging hours throughout the year to the total service hours offered by the charging station. It serves as an indicator of the extent of time-based asset utilization.
(3) For power utilization rate, this refers to the ratio of the station’s total annual electricity output (kWh) to the maximum possible electricity output based on its installed capacity and operating hours. It reflects the degree to which the available charging power is utilized.
These three indicators jointly capture both the economic efficiency and the equipment utilization efficiency, serving as a comprehensive basis for evaluating the overall performance of each charging station.
Each charging station’s annual unit net profit (excluding enterprise-level management costs and other business expenditures), time utilization rate, and power utilization rate are selected as output indicators. Based on the statistical data provided by Company R, the output indicators for the efficiency evaluation are summarized in Table 5.
Table 5.
Output indicators for efficiency evaluation.
4.2. Construction of the Efficiency Evaluation Model
This study focuses on evaluating the operational efficiency of charging stations. As identified earlier, the selected input and output variables encompass various units, such as monetary values, personnel numbers, equipment counts, and efficiency ratios, resulting in non-uniform measurement units across indicators.
Given this complexity, the Data Envelopment Analysis (DEA) method is adopted to evaluate and analyze the performance of each charging station. DEA is particularly suited for this context due to its capacity to handle multiple inputs and outputs with heterogeneous units, enabling a relative efficiency assessment without requiring pre-specified weights or functional forms.
4.2.1. Selection of the Evaluation Model
In this study, the evaluation targets are six dedicated electric vehicle charging stations, each treated as a decision-making unit (DMU). As described in Section 3, the configuration of charging infrastructure follows a 1:1 ratio between charging piles and electric vehicles, and the power distribution capacity is determined based on the number of charging piles.
Given this setup, the overall input and output of each charging station exhibit linear scalability, indicating the presence of constant returns to scale (CRS). Therefore, the CCR model is adopted to evaluate the operational efficiency of the charging stations.
This study employed the DEA-SOLVER Pro 5.0 Professional Edition software to measure the operational efficiency of six charging stations. The analysis adopted an input-oriented CCR model under the assumption of constant returns to scale (CRS), aiming to minimize input levels while maintaining constant output. The model was solved using a linear programming simplex algorithm, with a convergence tolerance of 1 × 10⁻⁶ and a maximum of 500 iterations.
All input and output variables were entered in their original measurement units without additional standardization. The software internally performs normalization to eliminate scale differences among variables. The final output of the model consists of the calculated efficiency scores for each charging station.
4.2.2. Operational Data Analysis of Charging Stations
(1) Evaluation based on the CCR-DEA model
Based on the computation results from DEA-SOLVER Pro 5.0, the operational efficiency scores and rankings of the six charging stations were obtained using the CCR-DEA model. The results are presented in Table 6 and Figure 2.
Table 6.
Evaluation scores of six charging stations based on the CCR-DEA model.
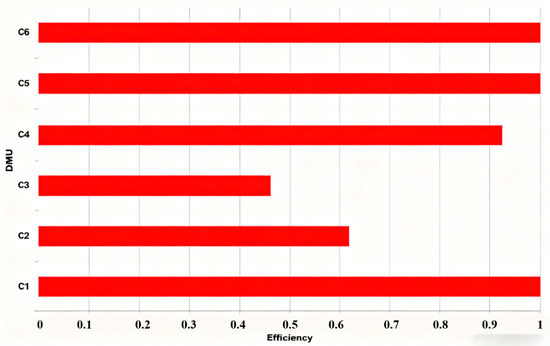
Figure 2.
Operational efficiency evaluation results of charging stations based on the CCR-DEA model.
The evaluation results indicate that the efficiency scores θ of charging stations C1, C5, and C6 are all equal to 1, implying that they are DEA efficient. In contrast, the efficiency scores of stations C2, C3, and C4 are all less than 1, indicating DEA inefficiency. Based on the efficiency values, the operational efficiency ranking among these three stations is C3 < C2 < C4.
According to the classical CCR-DEA model, since the efficiency scores θ of C1, C5, and C6 are all 1, their operational efficiencies cannot be distinguished. To further compare and analyze these three stations, the super-efficiency DEA model needs to be introduced.
(2) Evaluation and analysis based on the super-efficiency DEA model
In the DEA-SOLVER analysis, the Andersen-Petersen super-efficiency model was employed. During the calculation of each decision-making unit (DMU), the evaluated DMU itself was excluded from the reference set to differentiate among multiple efficient units with an efficiency score of 1. The input-output indicators from Table 4 and Table 5 were reanalyzed using DEA-SOLVER Pro 5.0 software to obtain the operational efficiency scores and rankings of the charging stations under the super-efficiency DEA model, as presented in Table 7 and Figure 3.
Table 7.
Operational efficiency scores of six charging stations based on the super-efficiency DEA model.
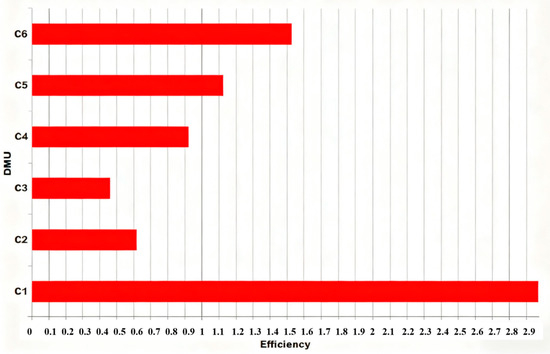
Figure 3.
Operational efficiency rankings of charging stations under the super-efficiency DEA model.
Compared to the classical CCR-DEA model, the efficiency scores and rankings of the three DEA-inefficient stations (C2, C3, and C4) remain unchanged under the super-efficiency DEA model. However, for the three DEA-efficient stations (C1, C5, and C6), the efficiency scores all exceed 1, and their rankings change. This approach provides a more accurate reflection and differentiation of operational efficiencies among the charging stations.
As shown in Table 8, under the super-efficiency DEA model, the actual inputs and outputs of the six charging stations were compared with their expected inputs and outputs. Among them, station C1 demonstrated outstanding performance across the four input indicators, with actual inputs significantly lower than expected, indicating high operational efficiency. Station C3 performed poorly on both input and output indicators, with actual inputs exceeding expected inputs and actual outputs falling far below expected outputs, resulting in the lowest operational efficiency. The remaining four stations exhibited varying degrees of deviation in both input and output indicators, warranting further detailed analysis.
Table 8.
Detailed evaluation results of charging stations under the super-efficiency DEA model.
(3) Robustness Analysis
To assess the robustness of the DEA results with respect to the choice of output indicators, we conducted a re-calculation using a commonly adopted output measure for charging stations in the literature-annual electricity sales (Hecht et al., 2022) [30]. All original model settings in DEA-SOLVER were maintained. The input indicators included construction cost, operator cost, number of chargers, and total charging power, while the output indicators consisted of annual electricity sales (kWh), time utilization rate, and power utilization rate. Efficiency scores for each decision-making unit (DMU) were obtained using the input-oriented CCR linear programming model. These scores were then compared with the original CCR results, which used net profit per kilowatt as the output indicator [30]. The operational efficiency scores for the six charging stations are presented in Table 9.
Table 9.
Efficiency Scores of Six Charging Stations under the CCR-DEA Model with Alternative Output Indicators.
Compared with the original CCR results, the alternative output experiment largely preserved the overall ranking of the stations, with C1, C5, and C6 forming the high-efficiency group and C2 and C3 remaining in the low-efficiency group. However, the efficiency score of C4 increased from 0.924 to 1.000. Overall, this robustness check indicates that the efficiency ranking and the study’s main conclusions are stable at the macro level, although minor variations in the evaluation of individual stations, such as C4, may occur depending on the choice of output indicators. This finding suggests that strategic recommendations should consider both profitability and energy output indicators to achieve a more comprehensive assessment of operational performance.
Subsequently, the Andersen-Petersen super-efficiency model was employed in DEA-SOLVER, excluding each decision-making unit (DMU) from its own reference set to distinguish among multiple units with an efficiency score of 1. Using the same input and output indicators, the super-efficiency DEA scores and rankings of the charging stations were calculated in DEA-SOLVER Pro 5.0, as presented in Table 10.
Table 10.
Super-Efficiency DEA Scores of Six Charging Stations Using Alternative Output Indicators.
The results indicate that replacing the output indicators did not alter the relative efficiency ranking of individual stations (e.g., C2, C3 versus C1, C5, and C6). Compared with the original CCR results, the alternative output experiment preserved the overall ranking, demonstrating that the study’s main conclusions are robust at the macro level.
4.2.3. Analysis of Evaluation Results
(1) Overall operational efficiency analysis
Under the classical CCR-DEA model, the number of evaluation indicators should be 2–3 times the number of decision-making units (DMUs) to ensure relatively accurate results. In this study, however, there are 7 input and output indicators but only 6 DMUs, which leads to the final evaluation result ranking as C1 = C5 = C6 > C4 > C2 > C3. Among them, charging stations C1, C5, and C6 all achieved the highest operational efficiency scores, making it impossible to distinguish the efficiency differences among these three stations (see Table 6 and Figure 2).
After applying the super-efficiency DEA model, the evaluation results were refined and optimized without altering the overall efficiency outcomes. This allowed for a more precise differentiation among the six charging stations. The corrected operational efficiency ranking is as follows: C1 > C6 > C5 > C4 > C2 > C3.
C1 achieved the highest score of 2.971, substantially exceeding those of the other stations, indicating that it attains high output with relatively low input. Combined with its location in a transportation hub, which contributes to high utilization rates, C1 experiences queuing during peak hours due to the limited number of chargers, while idle capacity remains during nighttime and off-peak periods. Despite having fewer chargers and lower total power capacity, the station demonstrates strong output performance, supported by effective operational scheduling and service matching. The super-efficiency score aligns with the station’s actual operational performance, confirming that C1 exhibits the highest operational efficiency among the six stations.
Conversely, C3 received the lowest score of 0.463, lower than all other stations, indicating relatively high input but comparatively low output. This is consistent with C3’s unstable customer flow, where most chargers remain unused for long periods, resulting in extremely low utilization and persistent financial losses. The evaluation score reflects the station’s real-world performance, confirming that C3 has the lowest operational efficiency among the six charging stations.
(2) Analysis of inputs and outputs
Based on Table 8, a detailed analysis of the input and output indicators of the six charging stations is presented.
C1 Charging Station: For the input indicators, C1 exhibits positive deviations in construction cost, total charging power, and number of charging piles, with deviation rates of 194.88%, 188.98%, and 197.11%, respectively. Regarding the output indicators, deviations in net profit per kilowatt, time utilization rate, and power utilization rate are small or negligible. C1 achieves the highest net profit per kilowatt, while its power and time utilization rates rank above average. Moreover, its annual utilization hours per kilowatt are significantly higher than the city-wide average for other operational stations. These results indicate that C1 attains high output with relatively low input, demonstrating effective supply–demand matching and operational efficiency. In comparison with the other five stations, C1 has the lowest relative input but high output, achieving the highest operational efficiency, and exemplifies an ideal operational strategy.
C2 Charging Station: For C2, all four input indicators show negative deviations, with the construction cost exceeding the ideal cost by 70.47%, and the number of charging piles exceeding the ideal number by 63.71%. In terms of output, the net profit per kilowatt falls short of the ideal value by 380.37%. These findings suggest that C2 experienced unreasonable investment during construction, with excessive allocation of charging piles. Its construction cost, number of piles, and total power capacity are all significantly higher than the optimal configuration. Additionally, both time and power utilization rates are low, resulting in oversupply and idle capacity. Operationally, the station fails to achieve returns commensurate with its input, indicating that its operational strategy requires improvement.
C3 Charging Station: For C3, all four input indicators exhibit negative deviations, with the largest deviation rates among the six stations. The construction cost exceeds the ideal cost by 81.59%, while total charging power and number of charging piles exceed the ideal configuration by 73.79% and 70.03%, respectively. Regarding output, the net profit per kilowatt falls short of the ideal value by 646.06%, the highest deviation among all stations. These results indicate substantial over-investment with low output, suggesting that, without adjustments to the operational strategy, the station may incur significant losses. In practice, C3 experiences unstable customer flow, with most chargers remaining unused for extended periods, resulting in extremely low utilization and persistent financial losses. Operational strategy modifications are therefore necessary.
C4 Charging Station: C4 shows negative deviations across all four input indicators, but the deviation rates are relatively small. Construction cost exceeds the ideal cost by 67.65%, and the number of chargers exceeds the ideal configuration by 65.34%. In terms of output, the net profit per kilowatt is 53.05% below the ideal value. These findings suggest slight over-investment and moderately lower output; minor adjustments to the operational strategy are sufficient. Operationally, the station experiences relatively low charging demand, with output and input roughly balanced. Power and time utilization rates are moderate, but electricity sales are insufficient, and charging prices are relatively low, resulting in a lower net profit per kilowatt. Adjustments to pricing strategies may be needed to attract more customers.
C5 Charging Station: In the overall DEA efficiency evaluation, C5 is classified as an efficient DMU, with a total score of 1.121, indicating generally satisfactory operational efficiency. However, the time utilization rate is 46.20% below the ideal value, suggesting that while charging efficiency per vehicle is high, the chargers remain idle for extended periods. The station exhibits high net profit per kilowatt and the highest power utilization rate, reflecting strong per-vehicle contribution and good charging efficiency. Nevertheless, the number of daily charging sessions is limited, leading to long idle intervals and low time utilization. Overall, C5 achieves high output with relatively high input, consistent with its actual operational performance. Increasing the number of service vehicles could help fully utilize its capacity.
C6 Charging Station:C6 also qualifies as an efficient DMU in the DEA evaluation, with a total score of 1.524, indicating generally satisfactory operational efficiency. Since its power distribution facilities are leased, construction cost input is lower than other stations but exceeds the ideal value by 52.43%, contributing to a higher overall efficiency score. However, output indicators reveal substantial underperformance: net profit per kilowatt is 74.66% below the ideal value, and power utilization is 80.83% below the ideal. These results indicate that, although C6 appears to achieve high output with low investment, the lack of actual investment in distribution facilities results in output that is significantly lower relative to the installed charging power. Operational attention and appropriate adjustments are recommended.
4.3. Identifying Key Factors Affecting Charging Station Operational Efficiency from the Supply–Demand Matching Perspective
As service venues, charging stations consist of two main parties: the equipment providers on the supply side and the pure electric vehicle (EV) users on the demand side. From the supply perspective, providers aim to maximize overall efficiency-minimizing inputs while maximizing returns. Conversely, from the demand side, users seek optimal service efficiency-minimizing service costs while maximizing service experience. The supply and demand sides often conflict: when supply exceeds demand, providers suffer operational losses; when demand exceeds supply, users face insufficient service, resulting in negative impacts. Accurately identifying the supply–demand relationship and optimizing management to balance both sides is the ultimate goal.
In this study, the charging station operator, Company R, acts as the supply side by providing charging equipment, supporting facilities, and related services. The demand side is represented by an electric vehicle company that operates electric vehicles, which use the stations for charging and pay corresponding service fees.
According to the DEA results presented in Section 4.2.3, station C1 achieves high output with relatively low input and adequately meets the daily charging demand of electric vehicles, indicating a relatively balanced supply–demand status.
C2 and C3 Charging Stations: The construction cost, total charging power, and number of charging piles for both C2 and C3 significantly exceed the ideal configuration, while the net profit per kilowatt falls far below the ideal value. This indicates excessive investment relative to demand, resulting in a severe oversupply situation. Furthermore, both stations face challenges related to geographic location and operational strategy, necessitating adjustments to improve efficiency and profitability.
C4 and C5 Charging Stations: Both C4 and C5 exhibit slight over-investment in construction cost, total charging power, and number of charging piles. The key differences lie in output performance: C4’s net profit per kilowatt is below the ideal level, whereas C5 shows relatively low power utilization. These observations suggest that C4 suffers from insufficient charging demand, while C5 experiences a limited number of vehicles on the demand side, resulting in mild oversupply at both stations. Additionally, the operational strategies and pricing structures of C4 and C5 are not sufficiently attractive to customers, indicating a need for adjustments in pricing and service strategies to increase utilization.
C6 Charging Station: C6 demonstrates a relatively ideal level of construction cost investment, but total charging power input is somewhat excessive. The output indicator of power utilization also reflects relatively low utilization. This suggests that, although leasing power distribution facilities reduces construction cost and improves the overall operational evaluation, the configuration of charging equipment leads to noticeable oversupply. To address this, C6 should optimize its operational strategy, adjust the leasing of distribution facilities appropriately, and attract more customers to fully utilize its installed capacity.
4.4. Charging Station Operation Optimization Strategies for Efficiency Improvement
This study aims to optimize charging station operation strategies to enhance operational efficiency and achieve desired benefits. From a supply–demand matching perspective, the analysis of six charging stations and current charging vehicles reveals that, except for station C1-which is in a relatively balanced supply–demand state-the other five stations experience varying degrees of oversupply. This indicates that the overall operational efficiency of the charging stations is relatively low and that improvements in overall operation strategies are needed. However, once overall operational strategies are optimized, the existing supply–demand relationships will inevitably change. Consequently, the supply–demand status of the charging stations must be reanalyzed and further optimized to improve the operational efficiency of individual stations. Based on this, to achieve the goal of enhancing charging station operational efficiency, operation strategy optimization can be divided into overall operation optimization strategies and localized operation optimization strategies.
4.4.1. Overall Operation Optimization Strategy
Starting from the overall strategic goals of the operating company, the enterprise’s core objectives serve as the expected benefits, which are to be achieved through optimization measures. Since the six charging stations operated by Company R are already constructed and in operation, according to Table 4, among the four input indicators in the DEA evaluation, three are fixed values except for personnel input cost, which accounts for a negligible portion of total cost and can be ignored. Therefore, the DEA input indicators can be assumed unchanged. Among the three output indicators-net profit per kilowatt, time utilization rate, and power utilization rate-all are variable. To improve overall operational efficiency, these output indicators need to be enhanced.
Increasing net profit per kilowatt can be achieved in two ways: one is to raise charging service fees without changing the existing charging volume to increase net profit. However, since the representative city has set regulations on charging service fees, this approach is not feasible. The other way is to increase the charging volume without changing the service fee, which can also improve the company’s net profit.
To increase time utilization rate and power utilization rate, given that the charging station configurations remain unchanged and the electric vehicle routes and schedules are relatively fixed with stable charging demand, the only way to improve these quality indicators is to increase the number of additional charging vehicles.
Thus, from an overall operation optimization perspective, increasing the number of electric vehicles and exploring the market potential of other charging vehicles within the charging station’s service area, along with intensifying market development efforts, are recommended. Increasing demand without altering the supply structure will raise the overall charging volume, which is the best way to enhance the overall operational efficiency of charging stations.
4.4.2. Local Operation Optimization Strategy
Focusing on the operational status of individual charging stations, the key indicators affecting each station’s operational efficiency should be identified and improvement measures implemented. In the overall operation optimization strategy, the key factor for improving overall efficiency is the number of charging vehicles. As the number of charging vehicles increases, some stations will have sufficient supply capacity to meet demand, while others may face supply constraints.
For charging stations with adequate supply capacity, their net profit per kilowatt, charging pile time utilization, and power utilization rates can improve, thus increasing operational efficiency without adjustment. However, for stations where supply capacity cannot meet demand, charging vehicles will queue upon arrival, causing customer loss, reduced overall charging volume, and decreased net profit, leading to lower operational efficiency.
To improve local charging station efficiency under supply constraints, local operation optimization strategies should be explored based on the new supply–demand relationship following overall operation optimization, thereby enhancing station performance.
Proposed Strategies for C1 Charging Station
(1) Expansion of Charging Facilities
Currently, C1 has a power distribution capacity of 630 kVA and a total installed charging facility capacity of 480 kW. Without increasing the distribution capacity, the total installed charging power should be maximized to improve service. During actual charging, electric vehicles enter a trickle charging mode toward the end of the charging process to protect battery life, during which the charging power is relatively low. As vehicles start charging at different times, the actual total charging power of the system is often below its maximum capacity, leaving the system underutilized. To optimize the use of distribution capacity while controlling costs, the total installed charging power can be configured at 1.3 times the distribution capacity, i.e., 630 × 1.3 = 817 kW. Considering that the most commonly used charging module on the market is 15 kW per unit, the total installed power can be set to 810 kW. With this configuration, the number of standard charging piles available at C1 would reach approximately 810/60 ≈ 13, significantly alleviating queuing issues and enhancing customer satisfaction.
(2) Service Improvement
When it is not feasible to increase the number of chargers or reduce queuing time, strategies should focus on improving the customer experience during waiting periods. Public charging stations increasingly provide auxiliary amenities, such as restaurants or lounges, to prevent negative emotions caused by long wait times. For C1, providing facilities such as driver rest and office areas can serve a similar purpose. The station operator can lease idle space within the station to create a rest lounge for social charging customers and equip it with entertainment and dining facilities, improving user satisfaction during charging and waiting periods.
(3) Time-Based Load Management
Based on the operational patterns observed at C1, vehicle charging can be divided into three times segments: off-peak periods (09:00–11:00 and 14:00–16:00) and peak meal time (12:00–13:00). Considering that operational vehicles have significant flexibility in charging time and are price-sensitive, time-based pricing can be applied. Charging fees are reduced during the off-peak periods (09:00–11:00 and 14:00–16:00) to incentivize customers who would otherwise charge during the 12:00–13:00 peak. This approach not only increases charger utilization during non-peak periods but also redistributes demand away from peak periods, reducing conflicts and queueing times, and ultimately enhancing the overall customer charging experience.
5. Conclusions and Policy Recommendations
With increasing government attention to battery electric vehicles (BEVs) and stricter environmental requirements, BEVs are expected to experience rapid growth in the near future. Significant technological advances have been made in electric vehicles, and in terms of driving range and safety, they are now comparable to conventional internal combustion engine vehicles. However, supporting charging infrastructure has lagged behind due to uncoordinated construction and inefficient operation, resulting in a persistent mismatch: vehicles cannot find available chargers while some chargers remain idle. This imbalance has gradually become a critical bottleneck for the development of BEVs.
Electric vehicle charging stations are typically located in advantageous areas with high charging capacity. If redundant capacity can be utilized to serve social (non-fleet) vehicles while ensuring BEV charging, it would not only meet additional charging demand but also improve the profitability of charging station operators, thereby reducing overall societal costs. This study addresses this challenge by focusing on operational optimization strategies for dedicated electric vehicle charging stations, providing valuable insights for similar stations.
The main findings of this study are as follows:
- Structural Imbalance in Input-Output Matching:
Charging stations exhibit structural mismatches between inputs and outputs. C1 demonstrates moderate construction investment and high output, emerging as the most efficient station. In contrast, C2 and C3 have high input but low output, with net profits even turning negative, indicating that expansion decisions did not adequately account for actual demand, resulting in resource redundancy. This “high input-low output” phenomenon reflects a disconnect between station construction and operational performance.
- 2.
- Supply–Demand Matching as a Key Determinant of Efficiency:
Time and power utilization rates show that C1, C5, and C6 achieve relatively high-power utilization, whereas C2 and C3 only reach 0.08–0.11, indicating a substantial mismatch between vehicle arrival rates, charging demand intensity, and station capacity. In other words, overinvestment in stations without considering local vehicle density, user convenience, or charging frequency can result in idle resources.
- 3.
- Input Structure and Profitability Are Not Simply Positively Correlated:
Increasing the number of chargers or installed capacity does not necessarily lead to higher operational efficiency. For example, C5 exhibits low time utilization but high-power utilization and net profit per kilowatt of 364.47 CNY/kW, demonstrating efficient output in its specific context. Conversely, C3, despite an input deviation of 80%, shows negative net profit per kilowatt, indicating potential issues in site selection and operational management.
- 4.
- Operational Management and Scheduling Efficiency Are Critical:
Average time utilization across six stations is below 0.13 and power utilization below 0.15, indicating high idle rates. Even high-scoring stations are far from fully loaded, highlighting unexploited capacity during off-peak or intermediate commuting periods. Lack of precise arrival prediction, user guidance, appointment systems, and efficiency-enhancing measures can constrain overall station performance.
Based on these findings and the current development of China’s new energy vehicle industry, the following recommendations are proposed:
(1) Optimize Planning Mechanisms to Improve Supply–Demand Matching
- Develop a Dynamic Supply–Demand Monitoring System:
Local governments should establish a bidirectional monitoring platform integrating charging resources and vehicle demand, consolidating data on station construction, vehicle ownership, session frequency, and charger utilization. Considering the high-input, low-output scenarios observed in C2 and C3, the platform should include monthly or quarterly updates of vehicle arrival forecasts, station utilization warnings, and idle rate monitoring, enabling dynamic adjustment of station layouts.
- 2.
- Differentiated Layout and Tiered Construction:
Stations in high-traffic areas, transportation hubs, or commercial complexes should be designated as “fast-charge, high-capacity” types, whereas areas with low accessibility or predominantly night-time demand should adopt “slow-charge, low-capacity” designs. Construction standards should account for local vehicle density, charging habits, and parking durations to prevent standardized “large-scale, high-power” templates.
- 3.
- Strengthen Multi-Stakeholder Collaboration:
A four-party collaboration involving government, power grid companies, operators, and vehicle manufacturers is recommended to coordinate land use, power access, charger-vehicle integration, and service alignment during planning. For example, in the case of C6, where cost control was effective but output underperformed, early grid involvement could assess peak-valley load matching, reserve capacity, and pricing advantages, avoiding resource wastage caused by isolated operator decisions.
(2) Enhance Operational Management to Improve Efficiency
- Implement Intelligent Operations Monitoring and Performance Evaluation:
Operators should deploy intelligent monitoring systems to track charger online rates, fault rates, idle durations, and user charging behaviors. Key performance indicators, such as average daily sessions per charger and idle hours, should guide corrective actions or exit decisions for underperforming stations.
- 2.
- Introduce Appointment and Off-Peak Charging Incentives:
For high-efficiency stations (e.g., C1), implement appointment systems and off-peak incentives to redistribute charging demand, while low-utilization stations (e.g., C3) could offer targeted promotions such as nighttime charging discounts or bundled parking-charging packages, improving charger utilization and optimizing grid load.
- 3.
- Integrate Stations with Surrounding Commercial and Parking Services:
Stations like C5, which show low time utilization but high per-charger output, can benefit from collaborations with shopping centers, restaurants, parking lots, or logistics hubs to create “charging, services” environments, increasing dwell time, charging frequency, and revenue per charger.
- 4.
- Regular Review and Transformation of Underutilized Stations:
For stations with persistent low utilization (e.g., C2 and C3), regulators or operators should annually assess performance. Stations with time and power utilization below thresholds for 12 consecutive months should be transformed into community slow-charging facilities, small-scale shared charging, or decommissioned, avoiding long-term idle resources.
(3) Improve Investment and Pricing Mechanisms for Sustainable Operation
- Reform Subsidy and Incentive Policies:
Shift subsidies from construction-focused to operation-focused, linking rewards to charger utilization, net profit per kilowatt, and idle rates. For underperforming stations (e.g., C2 and C3), penalties for idle chargers or withdrawal of subsidies can incentivize efficiency.
- 2.
- Introduce Flexible and Differentiated Pricing:
Time-of-use tariffs, charging power differentials, reservation discounts, and membership programs should reflect station-specific usage patterns, geographical characteristics, and vehicle types to better align costs with service value.
- 3.
- Promote Diverse Financing and Commercial Models:
Encourage integrated “charging, parking, commercial” development, and support operators in green bonds, lease financing, and other instruments to reduce financial burdens. For profitable stations (e.g., C1 and C5), explore franchising, revenue-sharing, and third-party services to increase asset returns.
(4) Strengthen Regulatory and Policy Environment
- Improve Construction Approval and Exit Mechanisms:
Introduce “demand validation, post-evaluation” systems. New stations underperforming over at least two years should undergo exit or transformation procedures.
- 2.
- Establish a National Unified Data Platform:
Create a comprehensive, standardized database of charging infrastructure for public, dedicated, and heavy-duty vehicle chargers to support investment, planning, and academic research.
- 3.
- Enhance Grid-Transport Regulatory Coordination:
Given the potential grid impact of ultra-fast charging stations, regulators across electricity, transportation, and energy sectors should coordinate on station access, power provision, and load response mechanisms to mitigate systemic risks.
Finally, it is important to acknowledge the limitations of this study. The analysis was based on a relatively small sample of six charging stations within a single city, which may constrain the generalizability of the findings to broader regional or national contexts. The results should therefore be interpreted as exploratory rather than conclusive, reflecting the methodological feasibility and empirical potential of applying a DEA-based framework under data-constrained conditions. In future research, the dataset will be expanded to include multiple cities and extended observation periods, enabling the construction of a panel DEA or dynamic efficiency model. Such an approach will allow for more robust testing of temporal and spatial variations in charging station performance, thereby enhancing the representativeness and external validity of the conclusions.
Author Contributions
Methodology, Y.H.; Validation, C.J.; Formal analysis, H.L.; Investigation, J.W.; Resources, J.Y.; Data curation, H.L.; Writing—original draft, Z.Z. and Z.Y.; Writing—review & editing, J.Y. and C.J.; Supervision, C.J.; Project administration, J.W.; Funding acquisition, J.Y. All authors have read and agreed to the published version of the manuscript.
Funding
This research was supported by the project “Research and Application of Intelligent Pricing Strategy and Quantitative Evaluation Technology for Charging Stations Based on Big Data” (Project No. 523500250005), funded by State Grid Smart Internet of Vehicles Technology Co., Ltd.
Data Availability Statement
The data presented in this study are available on request from State Grid Smart Vehicle Internet Technology Co., Ltd. These data are not publicly available due to the fact that they are the company’s proprietary data.
Conflicts of Interest
The authors declare that this study received funding from State Grid Intelligent Vehicle-Grid Integration Technology Co., Ltd. The funder had the following involvement in the study: Research design stage: The funding party participated in the discussions and the framework design of the research plan, and provided references related to industry practice requirements and technical application scenarios. However, they did not interfere with the formulation of specific research hypotheses; Data support: The funding party provided public datasets and industry case materials to assist in verifying the practical application value of the model. The analysis and interpretation of the data were independently conducted by the research team; Communication on results application: The funding party communicated with the research team regarding potential implementation scenarios of the results. However, the academic independence of the research and the presentation of the conclusions were not affected.
References
- Yu, Q.; Que, T.; Cushing Lara, J.; Pierce, G.; Shen, K.; Kejriwal, M.; Yao, Y.; Zhu, Y. Equity and Reliability of Public Electric Vehicle Charging Stations in China. Nat. Commun. 2025, 16, 5291. [Google Scholar] [CrossRef]
- Sun, Y.; Wen, J.; Hou, Z.; Deng, X.; Chen, S. Research on Construction Evaluation System of Electric Vehicle Charging Service Projects. Mod. Manag. 2020, 10, 1115–1122. [Google Scholar] [CrossRef]
- Liu, H.; Li, J.; Tang, Z.; Lai, Z. Site Planning Method for Electric Vehicle Charging Stations Based on Big Data. China New Technol. New Prod. 2021, 23, 30–32. [Google Scholar]
- Gao, Z.; Li, X.; Jia, D.; Wang, Y. Research on the location of electric vehicle charging stations based on the adjustment of existing charging stations. Smart Power 2022, 50, 79–84+91. [Google Scholar]
- Li, Z.; Liu, L.; Ding, L.; Wang, J.; Zhang, S.; Chen, X.; Song, W. Scenario charging infrastructure planning based on Tyson multilateral map. Power Grid Clean Energy 2023, 39, 131–135+142. [Google Scholar]
- Cai, J.; Xiao, Y.; Wang, Y.; Cai, R. A six-stage evaluation model for optimizing urban EV charging and swapping station locations. Sustain. Cities Soc. 2025, 125, 106342. [Google Scholar] [CrossRef]
- Ecer, F.; Pamucar, D.; Demir, G. Decision-analytics-based electric vehicle charging station location selection: A cutting-edge fuzzy rough framework. Energy Rep. 2025, 14, 711–735. [Google Scholar] [CrossRef]
- Zhao, H.; Hao, X. Location decision of electric vehicle charging station based on a novel grey correlation comprehensive evaluation multi-criteria decision method. Energy 2024, 299, 131356. [Google Scholar] [CrossRef]
- Zhang, Y.; Huang, C.; Xu, M. Research on the operation efficiency and service effect of urban public transportation in China. Highw. Transp. Sci. Technol. 2017, 34, 154–158. [Google Scholar]
- Ren, Q.; Sun, M. Using AHP-Entropy method to explore the influencing factors of spatial demand of EVs public charging stations: A case study of Jinan, China. J. Clean. Prod. 2025, 491, 144779. [Google Scholar] [CrossRef]
- Huang, Y.; Kockelman, K.M. Electric vehicle charging station locations: Elastic demand, station congestion, and network equilibrium. Transp. Res. Part D Transp. Environ. 2020, 78, 102179. [Google Scholar] [CrossRef]
- Upchurch, C.; Kuby, M.; Lim, S. A model for location of capacitated alternative-fuel stations. Geogr. Anal. 2009, 41, 85–106. [Google Scholar] [CrossRef]
- Wang, G.; Xu, Z.; Wen, F.; Wong, K.P. Traffic constrained multi objective planning of electric-vehicle charging stations. IEEE Trans. Power Deliv. 2013, 28, 2363–2372. [Google Scholar] [CrossRef]
- Huang, X.; Chen, J.; Yang, H.; Cao, Y.; Guan, W.; Huang, B. Economic planning approach for electric vehicle charging stations integrating traffic and power grid constraints. IET Gener. Transm. Distrib. 2018, 12, 3925–3934. [Google Scholar] [CrossRef]
- Yang, B.; Dai, J. Research on Charging Demand of Electric Vehicles and Optimal Configuration of Charging Facilities. Hubei Electr. Power 2018, 42, 62–69+74. [Google Scholar]
- Cao, F.; Li, S.; Zhang, Y. Spatiotemporal Distribution Simulation of EV Charging Load Considering the Attractiveness of Charging Stations. Power Grid Technol. 2021, 45, 75–87. [Google Scholar]
- Liu, J.; Yang, Y.; Li, Z. Site selection of electric vehicle charging station based on the principle of user charging accessibility. J. Comput. Appl. 2018, 38, 236–239. [Google Scholar]
- Wang, J.M.; Liu, Y.; Yang, Y.F.; Cai, W. The Location of Electric Vehicle Charging Stations based on FRLM with Robust Optimization. Int. J. Pattern Recognit. Artif. Intell. 2018, 33, 24–29. [Google Scholar] [CrossRef]
- Yang, L.; Hao, C.; Tang, R. Site Selection Model of Charging and Battery Swapping Facilities Based on Electric Logistics Vehicles. Syst. Eng. Theory Pract. 2019, 39, 1781–1795. [Google Scholar]
- Gan, W.; Shahidehpour, M.; Yan, M.; Guo, J.; Yao, W.; Passo, A.; Zhang, L.; Wen, J. Coordinated planning of transportation andelectric power networks with the proliferation of electric vehicles. IEEE Trans. Smart Grid 2020, 11, 4005–4016. [Google Scholar] [CrossRef]
- Lin, Y.; Zhang, K.; Shen, Z.-J.M.; Ye, B.; Miao, L. Multistage large-scale charging station planning for electric buses considering transportation network and power grid. Transp. Res. Part C Emerg. Technol. 2019, 107, 423–443. [Google Scholar] [CrossRef]
- Wang, Z.P.; Liu, P.; Han, H.B.; Lu, C.; Xin, T. A Distribution Model of Electric Vehicle Charging Station. Appl. Mech. Mater. 2010, 44, 1543. [Google Scholar] [CrossRef]
- Zhao, S.; Li, Z. Optimal Planning of Urban Electric Vehicle Charging Stations Based on Differential Evolutionary Particle Swarm Algorithm. J. North China Electr. Power Univ. (Nat. Sci. Ed.) 2015, 42, 1–7. [Google Scholar]
- Xie, F.; Liu, C.; Li, S.; Lin, Z.; Huang, Y. Long-term strategic planning of inter-city fast charging infrastructure for battery electric vehicles. Transp. Res. Part E Logist. Transp. Rev. 2018, 109, 261–276. [Google Scholar] [CrossRef]
- Tan, Y.; Yang, H.; Xu, F. Optimal configuration of electric vehicle charging stations based on coupling decision between investment income and user utility. Trans. CSEE 2017, 37, 5951–5960. [Google Scholar]
- Güler, S.I.; Aydin, N. Suitable location selection for electric vehicle fast charging stations using GIS and MCDM approaches. Int. J. Intell. Transp. Syst. Res. 2020, 18, 645–661. [Google Scholar]
- Iwafune, Y.; Ogimoto, K.; Azuma, H. Integration of Electric Vehicles into the Electric Power System Based on Results of Road Traffic Census. Energies 2019, 12, 1849. [Google Scholar] [CrossRef]
- Peyrache, A.; Silva, M.C.A. Efficiency decomposition for multi-level multi-components production technologies. J. Product. Anal. 2023, 60, 273–294. [Google Scholar] [CrossRef]
- Andersen, P.; Petersen, N.C. A procedure for ranking efficient units in Data Envelopment Analysis. Manag. Sci. 1993, 39, 1261–1264. [Google Scholar] [CrossRef]
- Hecht, C.; Figgener, J.; Sauer, D.U. Analysis of electric vehicle charging station usage and profitability in Germany based on empirical data. iScience 2022, 25, 105634. [Google Scholar] [CrossRef]
Disclaimer/Publisher’s Note: The statements, opinions and data contained in all publications are solely those of the individual author(s) and contributor(s) and not of MDPI and/or the editor(s). MDPI and/or the editor(s) disclaim responsibility for any injury to people or property resulting from any ideas, methods, instructions or products referred to in the content. |
© 2025 by the authors. Published by MDPI on behalf of the World Electric Vehicle Association. Licensee MDPI, Basel, Switzerland. This article is an open access article distributed under the terms and conditions of the Creative Commons Attribution (CC BY) license (https://creativecommons.org/licenses/by/4.0/).