Abstract
In response to China’s “Dual Carbon” goals, this paper proposes a Transmission Network Expansion Planning (TNEP) model that explicitly incorporates the operational flexibility of Virtual Power Plants (VPPs). Unlike conventional approaches that focus mainly on transmission investment, the proposed method accounts for the aggregated dispatchable capability of VPPs, providing a more accurate representation of distributed resources. The VPP aggregation model is characterized by the inclusion of electric vehicles, which act not only as load-side demand but also as flexible energy storage units through vehicle-to-grid interaction. By coordinating EV charging/discharging with photovoltaics, wind generation, and other distributed resources, the VPP significantly enhances system flexibility and provides essential support for grid operation. The vertex search method is employed to delineate the boundary of the VPP’s dispatchable feasible region, from which an equivalent model is established to capture its charging, discharging, and energy storage characteristics. This model is then integrated into the TNEP framework, which minimizes the comprehensive cost, including annualized line investment and the operational costs of both the VPP and the power grid. The resulting non-convex optimization problem is solved using the Quantum Particle Swarm Optimization (QPSO) algorithm. A case study based on the Garver-6 bus and Garver-18 bus systems demonstrates the effectiveness of the approach. The results show that, compared with traditional planning methods, strategically located VPPs can save up to 6.65% in investment costs. This VPP-integrated TNEP scheme enhances system flexibility, improves economic efficiency, and strengthens operational security by smoothing load profiles and optimizing power flows, thereby offering a more reliable and sustainable planning solution.
1. Introduction
Against the background of China’s “Dual Carbon” goals, the national energy structure is accelerating its transition toward a low-carbon, clean, and efficient system. The rapid development of renewable energy has become a critical driver of this transformation [1]. However, the intermittency and volatility of renewable energy pose significant challenges to the stable operation of power systems [2,3]. China ranks first in the world in terms of new energy vehicle (NEV) sales, with a remarkable increase from 4.92 million units in 2020 to 31.40 million units in 2024. Among them, the stock of pure battery electric vehicles (BEVs) has reached 22.09 million. China has thus become the country with the largest electric vehicle (EV) fleet globally, maintaining its position as the world’s largest EV market. EVs are a key user-side resource for promoting the transformation of new-type power systems and driving the energy transition. They not only serve as electricity loads but, through vehicle-to-grid (V2G) technology, can also feed stored energy from their batteries back to the grid, thereby achieving bidirectional coordination between “energy consumption” and “energy supply” [4]. V2G interaction refers to the bidirectional flow of electricity between EVs and the power system. It addresses grid compatibility challenges and plays a crucial role in facilitating the widespread adoption of EVs [5]. As an emerging paradigm, the Virtual Power Plant (VPP) integrates and optimizes the coordinated operation of distributed resources. It not only facilitates renewable energy integration but also provides ancillary services to the grid, making it an important technological support for achieving “Dual Carbon” goals [6]. Incorporating VPPs into Transmission Network Expansion Planning (TNEP) is therefore of great significance for improving the economy and reliability of power system operation.
Traditionally, the TNEP problem seeks to determine the optimal locations and number of new transmission lines under given planning objectives in order to meet the growing demand for electricity [7,8]. Existing optimization approaches for TNEP include Mixed-Integer Nonlinear Programming (MINLP) [9], robust optimization [10,11], and metaheuristic methods [12,13,14]. For instance, [15] proposed a novel dynamic TNEP approach that allows for a cross-year budget accumulation. By formulating the problem as an MILP model, the method enables more flexible and economical long-term investment decisions, significantly reducing load curtailment and total costs while enhancing feasibility and reliability. In [16], the available transfer capability of the transmission system was quantified and employed as the objective function of a lower-level model, which, combined with an upper-level TNEP model aiming for economic optimality, yielded a planning framework that considers wind power investment and improves transmission efficiency. In [17], the strategic behaviors of market participants were incorporated, and a forecast–correction iterative algorithm was proposed to mitigate market power in market-oriented TNEP. In [18], the unpredictable impacts of climate change were taken into account, leading to a robust TNEP model with climate-adaptive uncertainty sets. The model was solved via column-and-constraint generation, and the results demonstrated its capability to reduce investment costs while enhancing operational security under climate variability. In [19], a two-stage robust TNEP model was proposed that considers both long- and short-term uncertainties as well as nonconvex operating characteristics of generating units. A nested column-and-constraint generation algorithm was used to guarantee global optimality, and the results indicated that neglecting nonconvexities leads to suboptimal planning decisions.
With the large-scale integration of renewable energy and the increasing load of EVs, system power flows have undergone significant changes, which in turn impose considerable impacts on both system operation and planning [20]. Therefore, it is essential to explicitly account for the integration of renewable energy and EVs. Reference [21] proposed a VPP-coordinated microgrid optimization deployment framework based on the Black Widow Optimization algorithm, which deeply integrates EVs with V2G capability as flexible and dispatchable energy storage resources. By coordinating with photovoltaics, wind power, and energy storage systems, the framework significantly improves the economic efficiency and resilience of distribution networks under extreme weather conditions, highlighting the critical role of V2G in enhancing system flexibility and emergency response capability. Reference [22] constructed a bi-level Mixed-Integer Quadratically Constrained Programming (MIQCP) model combined with a Temporal Convolutional Network (TCN) to forecast residential load uncertainty. By embedding the V2G mechanism into the VPP architecture, the approach substantially improves the synergy between EV user benefits and distribution network power quality, thus establishing a new win–win paradigm of resilient operation for both grid operators and EV owners. Reference [23] introduced a two-stage robust game-theoretic method for EV-friendly VPP participation, which considers EV user satisfaction levels and battery degradation costs when providing ancillary services. This approach flexibly accommodates diverse market demands, mitigates voltage violations, regulates peak-to-valley differences (PVD), and ensures a fair allocation of user participation costs. In [24], it was noted that most TNEP studies focused only on renewable generation uncertainty, while overlooking the enhancement of system flexibility to cope with renewable variability. To address this gap, a flexibility-oriented robust transmission expansion planning method was proposed, which simultaneously considered long-term planning and short-term flexibility requirements while maintaining high robustness to renewable uncertainties. In [25], a robust planning model for hybrid AC/DC transmission networks with energy storage was proposed, which incorporated renewable energy uncertainty. The problem was convexified using SOCP techniques, and a C&CG-based algorithm was applied for decomposition. The results showed that this approach outperformed conventional methods by reducing investment redundancy and improving renewable energy accommodation. Previous research has been limited to either VPP operation optimization at the distribution network level or Transmission Network Expansion Planning considering system flexibility, but has not delineated the VPP dispatchable feasible region or considered its impact on transmission network expansion decisions.
The main contributions of this study are summarized as follows:
- (1)
- This paper employed the vertex search method to delineate the VPP dispatchable feasible region and constructed the VPP equivalent dispatch model, which explicitly characterizes the maximum charging/discharging power and capacity boundaries of the VPP.
- (2)
- Based on the VPP equivalent dispatch model, this paper proposed a TNEP method that explicitly incorporates the VPP feasible region.
- (3)
- Case study results on the Garver-6 bus and Garver-18 bus systems demonstrate that the rational placement of VPPs can reduce line expansion investment costs, lead to a more reasonable system power flow allocation, and ultimately help improve the economy and security of grid operation.
2. Equivalent Dispatch Model of the Virtual Power Plant
2.1. Equivalent Model of the VPP-Aggregated Feasible Region
In this paper, the dispatch feasible region of the VPP is defined as a virtual battery model jointly determined by charging/discharging power and energy [26]. The reduction (increase) in the overall load of the VPP is regarded as the discharging (charging) power of the equivalent model, while the cumulative adjustment relative to the original operating power is defined as the energy of the equivalent dispatch model. The specific formulation is given in (1).
where denotes the adjustment of the VPP at time period t; if > 0, the virtual storage is discharging; if < 0, the virtual storage is charging; denotes the cumulative adjustment relative to the original operating power, i.e., the virtual storage energy; represents the dispatch feasible region of the VPP; and denote the lower and upper bounds of the VPP adjustment at time t, i.e., the charging and discharging limits of the virtual storage; denotes the original operating power of the VPP at time t; and and denote the lower and upper bounds of the virtual storage energy.
2.2. Parameter Extraction Method of the Model
At present, the main approaches for characterizing the feasible region of a VPP include the Minkowski sum method and the vertex search method. Given the heterogeneity of massive distributed resources aggregated within a VPP, and the need to impose distribution network power flow constraints when equivalently connected to the 220 kV bus in this study, the Minkowski sum method is unable to accurately characterize the VPP’s equivalent feasible region at the 220 kV bus. Therefore, this paper adopts the vertex search method to delineate the boundary of the VPP’s equivalent feasible region, as expressed in (2). The principle of the vertex search method is illustrated in Figure 1.
where is the unit direction vector for searching new vertices; is the feasible region variable for the overall VPP output, which is a point within ; , , are the decision variable vectors for the distributed resources within the VPP; and , , , , and are the parameter vectors for the distributed resources within the VPP. The optimal solution for each different corresponds to one vertex of the feasible region.
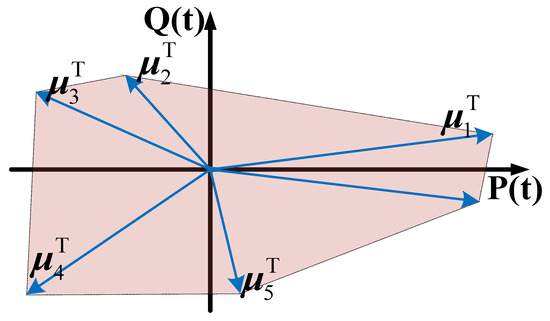
Figure 1.
The principle of vertex search method.
As the VPP’s simple output power feasible region cannot accurately describe its time-varying ramp parameters, this paper uses an equation to characterize the VPP’s time-varying electricity feasible region boundary.
where represents the upper and lower bounds of the feasible region for the VPP’s virtual energy storage model at time t, and .
This paper adopts the vertex search method to transform the VPP feasible region construction problem into an optimization problem for the VPP’s external power output. This allows for the iterative solution of the VPP’s output boundaries using the GUROBI solver [27]. The flowchart for solving the VPP feasible region based on the vertex search method is shown in Figure 2.
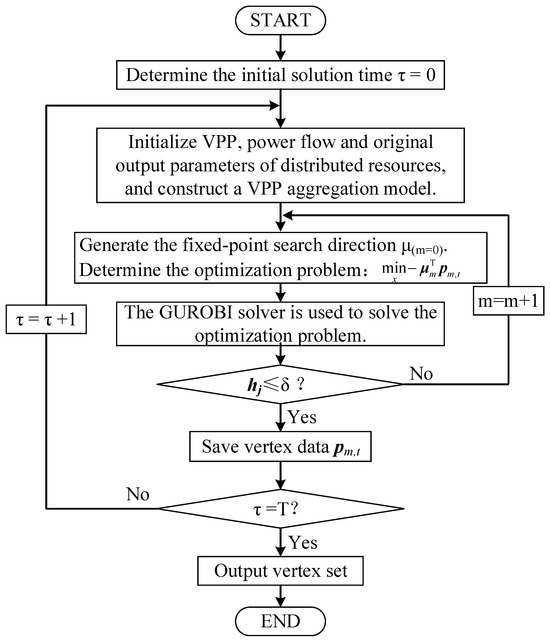
Figure 2.
Flowchart for solving the VPP feasible region based on the vertex search method.
3. Transmission Line Expansion Planning Model Considering Virtual Power Plants
3.1. Objective Function
With the goal of minimizing total cost, the objective function f can be expressed as follows:
where is the annualized investment cost of newly built transmission lines in the power grid planning; is the annual operation cost of the power grid; and is the annual operation cost of the virtual power plant.
- Annualized investment cost of newly built transmission lineswhere is the planning period; r is the annual discount rate [28]; is the 0–1 decision variable for the construction investment of expansion line l; is the 0–1 decision variable for the construction investment of expansion line l; is the number of expansion lines l to be built; is the investment cost per unit power length of the expansion line; is the maximum transmission power of expansion line l; is the length of expansion line l; and is the set of planned expansion lines for the transmission network.
- Annual operating cost of the power gridwhere is the number of operating days per year; T is the day-ahead dispatch period, with a value of 24; is the operating cost of generator i at time t; and is the power of generator i at time t.
- Generator operating costwhere is the power generation of generator i at time t; and , , and are the cost coefficients of generator i.
- Annual operating cost of the virtual power plantwhere is the cost paid by the power grid to the virtual power plant; and is the active power of the virtual power plant at time t.
3.2. Constraints
- Power flow constraintswhere and are the active and reactive power of the generator at node i, respectively; and are the active and reactive power of the virtual power plant at node i, respectively; and are the active and reactive power of the load at node i, respectively; U is the voltage magnitude; is the set of nodes adjacent to node i; and are the real and imaginary parts of the admittance between nodes i and j, respectively; and is the voltage phase angle difference between nodes i and j.
- Generator operating constraintswhere and are the maximum active and reactive power of generator i, respectively; and is the maximum ramp rate of generator i.
- Line power flow and nodal voltage constraintswhere is the transmission power of line l at time t; and and are the minimum and maximum voltage magnitudes at node i, respectively.
- The virtual power plant operating constraints are as shown in Formula (1) and will not be repeated here.
- Transmission line expansion constraintswhere is the maximum number of expandable circuits for line l; and is the upper limit of expandable lines for the power grid.
4. Solution Process of the QPSO Algorithm Considering the VPP Feasible Region
The TNEP model proposed in this paper, which considers the VPP dispatchable feasible region, includes both discrete decision variables (transmission line expansion decisions) and continuous decision variables (VPP and grid operation scheduling). This makes it a non-convex Mixed-Integer Nonlinear Programming (MINLP) problem. The Quantum Particle Swarm Optimization (QPSO) algorithm introduces a global probabilistic search mechanism based on the quantum behavior model. Compared to the Genetic Algorithm (GA) and standard Particle Swarm Optimization (PSO), QPSO exhibits significantly enhanced performance in terms of convergence and global search capability. Furthermore, compared to exact solvers like MILP/MINLP, QPSO avoids the need for complex linearization, allowing it to obtain an approximate global optimum while preserving the original nonlinear characteristics of the model.
Therefore, this paper utilizes the QPSO algorithm for the global optimization of the TNEP model based on the VPP feasible region characterization [29]. The solution process is as follows:
Step 1: Construct the equivalent VPP dispatch model. Input the fundamental parameters of the power grid and the VPP, including algorithm parameters, grid topology, basic generator parameters, and load data.
Step 2: Initialize the position and velocity of the QPSO particle swarm to generate the initial line expansion and construction plan.
Step 3: The upper-level line expansion planning model receives the expansion plan, calculates the investment cost of the new lines, and updates the grid topology parameters. These new grid parameters are then passed down to the lower-level grid optimal dispatch model.
Step 4: The lower-level optimal dispatch model receives the updated information from the upper level. Based on the new grid topology, it calculates the fitness and the total operating cost of the lower-level model. The information of the best population in the current generation is saved, and the global optimal solution is updated synchronously.
Step 5: Update the position and velocity of each particle, then repeat steps 3 and 4 until the maximum number of iterations is reached. The algorithm then outputs the optimal transmission line expansion plan.
The flowchart for the proposed model’s solution process is shown in Figure 3.
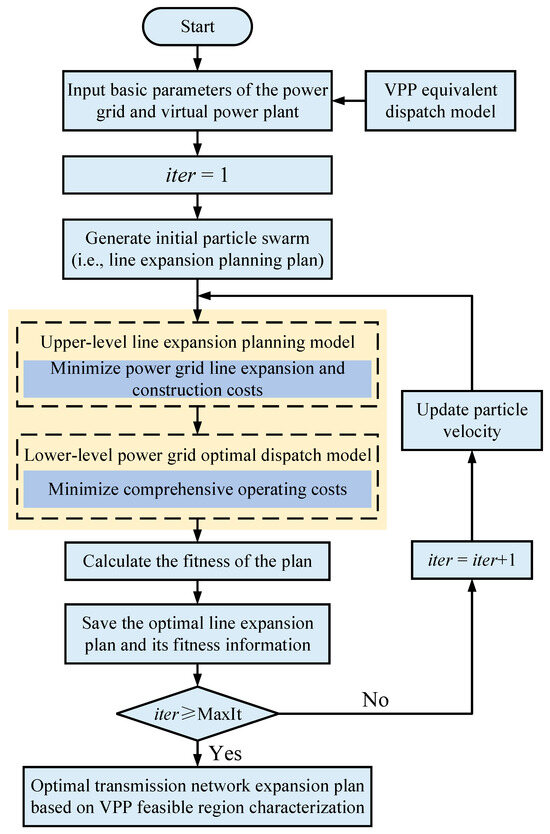
Figure 3.
Solution process for the Transmission Network Expansion Planning model.
5. Results
To validate the effectiveness of the method proposed in this paper, a case study analysis is performed on the Garver-6 system, which is illustrated in Figure 4. The original network of the Garver-6 bus system is a 5-bus system. Bus 1 and Bus 3 currently host generators with capacities of 150 MW and 360 MW, respectively. An additional 600 MW generator will be added to Bus 6 in the future. The system load and generator parameters are provided in Table 1, and the system line parameters are detailed in Table 2.
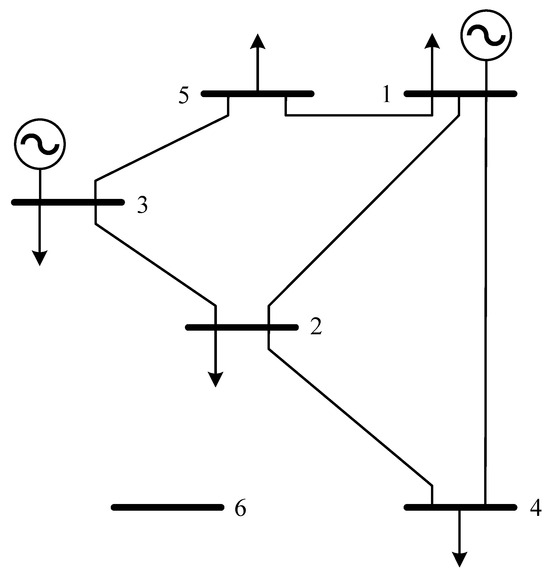
Figure 4.
Garver-6 system network topology diagram. Buses 1, 3, and 6 are generation buses equipped with generators that supply power to the network. Each pair of buses can accommodate up to four transmission lines, which are treated as candidate corridors in the TNEP model.

Table 1.
Garver-6 system load and generator parameters.

Table 2.
Line parameters of Garver-6 system.
Three scenarios are set up for comparative analysis:
Garver6-S1: TNEP scheme without considering the VPP feasible region.
Garver6-S2: TNEP scheme considering the VPP feasible region at Bus 2.
Garver6-S3: TNEP scheme considering the VPP feasible region at Bus 5.
5.1. VPP Parameter Settings
The VPP aggregation model developed in this paper includes distributed resources such as distributed photovoltaics (PV), distributed gas turbines, energy storage, electric vehicle (EV) charging stations, and controllable loads. The connection points for these resources are shown in Figure 5. The related parameters of distributed energy storage and gas turbines are shown in Table 3.
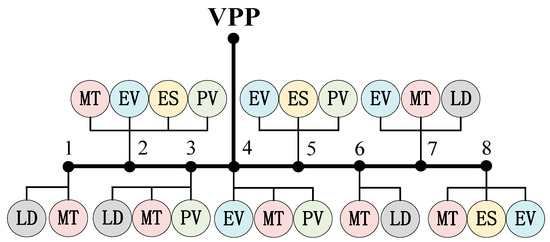
Figure 5.
VPP aggregation of distributed resources.

Table 3.
Parameters related to distributed energy storage and gas turbines.
The forecasted output of the distributed PV and the loads from EV charging stations are shown in Figure 6 and Figure 7.
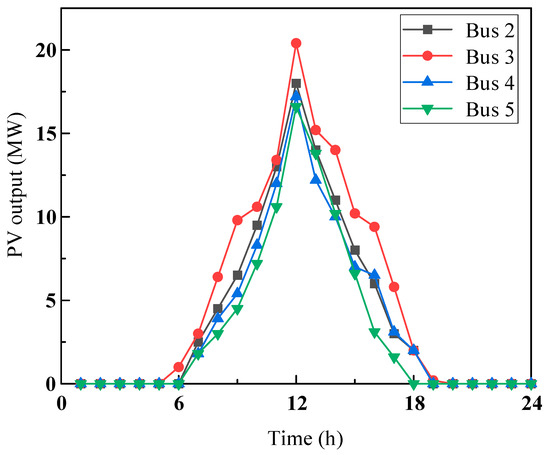
Figure 6.
PV output curves at each bus.
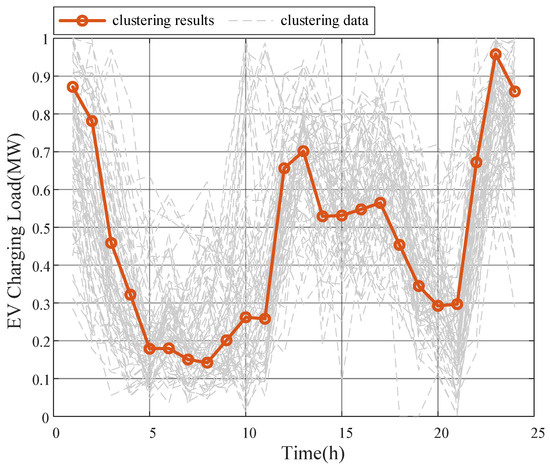
Figure 7.
EV charging load.
5.2. Comparison of TNEP for VPPs Connected to Different Nodes
Using the proposed method that considers the VPP feasible region for Transmission Network Expansion Planning, we solved the problem for the modified Garver-6 bus system. The comparison of the line expansion plans for the different scenarios is shown in Figure 8. The dashed lines in the figure represent the newly planned lines.
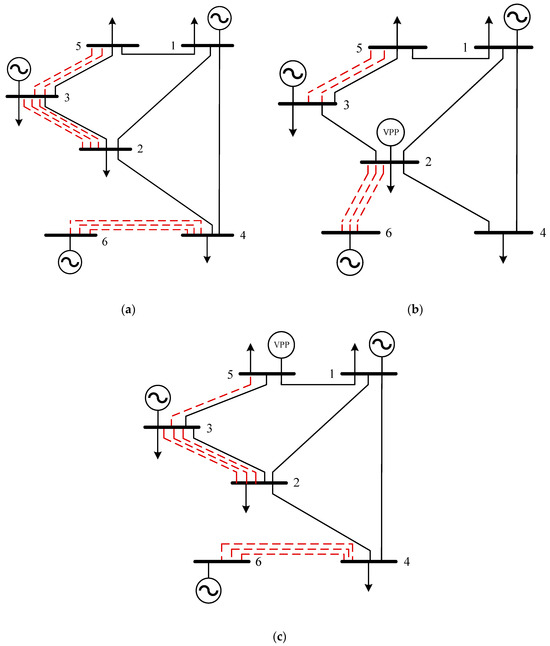
Figure 8.
Comparison of TNEP schemes under different scenarios for the Garver-6 system. (a) TNEP scheme without considering VPP feasible region; (b) TNEP scheme considering the VPP feasible region at Bus 2; (c) TNEP scheme considering the VPP feasible region at Bus 5.
As can be seen from Figure 8, the consideration of the VPP feasible region has a significant impact on the transmission line expansion plan. Garver6-S2 only plans for three lines between Bus 2 and Bus 6 and two lines between Bus 3 and Bus 5, resulting in a total of five lines. Garver6-S3 plans for three lines between Bus 4 and Bus 6, one line between Bus 3 and Bus 5, and three lines between Bus 2 and Bus 3, totaling seven lines. In contrast, Garver6-S1, which does not consider the VPP feasible region, plans for three lines between Bus 4 and Bus 6, two lines between Bus 3 and Bus 5, and three lines between Bus 2 and Bus 3, for a total of eight lines.
It is thus evident that, when the VPP feasible region is not considered, the system requires a large number of new lines to satisfy power supply demand. When the VPP is connected to Bus 2 or Bus 5, its capability for peak shaving and valley filling partially substitutes for the transmission capacity of certain lines. This action changes the system’s power flow distribution, consequently reducing the number of required transmission line expansions and avoiding the resource waste caused by traditional planning schemes.
5.3. Load Changes at Nodes in the TNEP Scheme Considering VPP External Characteristics
The 24 h dispatchable feasible region of the VPP, characterized by the vertex search method, is shown in Figure 9. The comparison of the loads at Bus 2 and Bus 5 before and after considering the VPP dispatchable feasible region is shown in Figure 10.
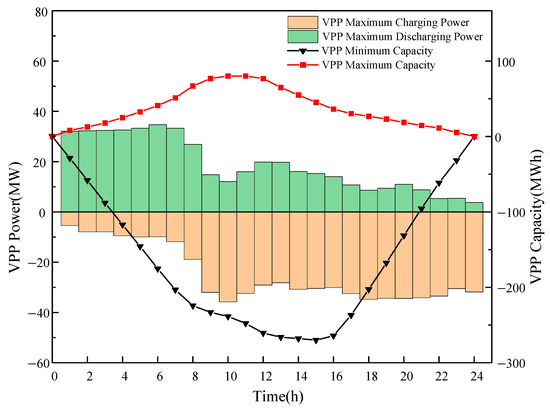
Figure 9.
VPP scheduling feasible region.
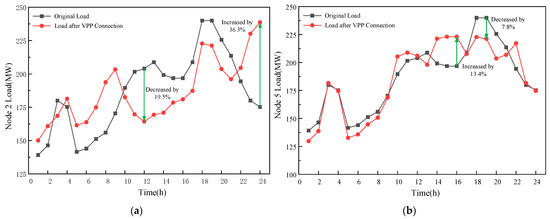
Figure 10.
Load comparison before and after considering the VPP feasible region at different nodes: (a) load at node 2 before and after considering the VPP feasible region; (b) load at node 5 before and after considering the VPP feasible region.
As observed in Figure 10, after the distributed resources at Bus 2 are aggregated by the VPP, the bus’s load profile is significantly impacted. During the peak hours (Time Slots 17 to 20), the load is curtailed by approximately 20 MW. Conversely, during off-peak hours (Time Slots 4 to 8), the load level is moderately increased. This successfully smooths the load curve, which originally exhibited pronounced peak–valley fluctuations.
In contrast, after the distributed resources at Bus 5 are aggregated by the VPP, the overall trend of the load curve change is similar to Garver6-S2, but the adjustment range is relatively smaller. This difference arises because Bus 5 is farther from the main power source (Bus 6), meaning its load changes have a less significant effect on the system’s power flow compared to the load center, Bus 2.
Therefore, the location of the VPP not only influences the TNEP scheme but also significantly affects its peak shaving and valley filling capability.
5.4. Comparison of TNEP Scheme Economics Considering VPP Feasible Region
To analyze the impact of considering the VPP feasible region on the economics of the TNEP scheme, the investment costs of the line expansion plans for different scenarios are shown in Table 4.

Table 4.
The investment cost of TNEP scheme in different scenarios.
As shown in Table 3, the planning scheme in Garver6-S2 requires three fewer transmission lines than Garver6-S1, resulting in savings of 270 million CNY in line investment costs. Garver6-S3 requires one fewer line than Garver6-S1, saving 100 million CNY in line investment costs.
Due to the integration of the VPP into the grid, the annual grid operation cost in Garver6-S2 is 24 million CNY higher than in Garver6-S1, but the total cost remains lower than that of Garver6-S1. In contrast, Garver6-S3 has lower annual grid operation costs than Garver6-S2, but the different VPP location leads to a greater number of required line expansions, which increases the line investment cost and ultimately results in the highest total cost among the scenarios.
Therefore, the proper placement of the VPP within the power grid can reduce the extreme values of power transfer between buses, thereby decreasing line expansion costs. Conversely, an unreasonable VPP location can result in an irrational system power flow distribution, which in turn increases both the line investment cost and the overall cost of the planning scheme.
5.5. Analysis of the Garver-18 System Example
To further validate the general applicability of the proposed planning model, a simulation analysis is conducted on the Garver-18 system. The buses and lines designated for expansion in this system are shown in Figure 11.
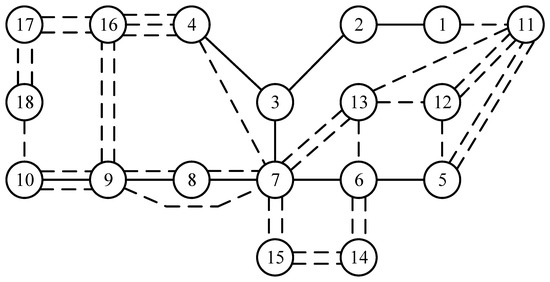
Figure 11.
Garver-18 system and expandable transmission lines.
The following scenarios are set up:
Garver18-S1: TNEP without considering the VPP feasible region;
Garver18-S2: TNEP scheme considering the VPP feasible region at Bus 10;
Garver18-S3: TNEP scheme considering the VPP feasible region at Bus 14;
Garver18-S4: TNEP scheme considering the VPP feasible region at Bus 16.
The TNEP schemes obtained for the different scenarios are illustrated in Figure 12, and a comparison of the costs for these different schemes is provided in Table 5.
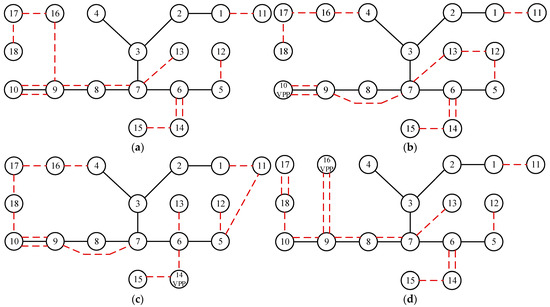
Figure 12.
Comparison of TNEP schemes under different scenarios for the Garver-18 system. (a) TNEP scheme without considering VPP feasible region; (b) TNEP scheme considering the VPP feasible region at Bus 10; (c) TNEP scheme considering the VPP feasible region at Bus 14; (d) TNEP scheme considering the VPP feasible region at Bus 16.

Table 5.
Cost comparison of different schemes for the Garver-18 system.
As shown in Table 5, the schemes that consider the VPP feasible region resulted in a cost reduction of up to 389 million CNY, corresponding to savings of 6.65%, compared to the scheme that does not consider the VPP feasible region. Considering the VPP feasible region at different buses also leads to varied TNEP schemes. For Garver18-S3 and Garver18-S4, the annual grid operation costs remained the same, but the annual line investment cost was reduced, leading to a total cost reduction of 229 million CNY, saving 4.03%. Therefore, the proper placement of VPPs can not only reduce line investment costs but also optimize the system power flow distribution, decrease annual grid operation costs, and ultimately help improve the economy and security of grid operation.
6. Conclusions and Future Work
This paper employed the vertex search method to delineate the dispatchable feasible region of the VPP, constructing an equivalent VPP dispatch model that aggregates resources such as distributed photovoltaics, energy storage, and electric vehicles. We then proposed a TNEP method that incorporates the VPP feasible region and validated its effectiveness through a case study analysis of the Garver-6 and Garver-18 systems. The key conclusions are as follows:
- Considering the VPP dispatchable feasible region in TNEP effectively reduces line expansion investment costs. Furthermore, the VPP can effectively smooth the load curve, contributing to enhanced economy and security of the grid operation.
- Rational VPP placement significantly reduces line expansion investment costs, leading to a more reasonable system power flow distribution and effectively alleviating transmission line congestion.
The method used in this paper to characterize the VPP feasible region has certain limitations, as it did not deeply quantify the uncertainties arising from electric vehicle charging demand, renewable energy output volatility, and forecasting errors. Consequently, the impact of source-load uncertainties on the VPP feasible region was neglected.
In future research, we plan to enhance the VPP equivalent dispatch model by including the battery swap technology scenario. Unlike conventional EV charging, the battery swap mode is characterized by centralized energy management, rapid vehicle turnaround, and site capacity dispatch. Incorporating these features into the VPP modeling will further enrich the planning framework, ultimately boosting the application value of the proposed TNEP method—which considers the VPP dispatchable feasible region—in power system planning, and more closely serving the grid security and economic needs under China’s “Dual Carbon” goals.
Author Contributions
Conceptualization, L.G., G.X. and X.D.; methodology, L.G. and G.X.; software, C.W.; validation, Z.X. and J.L.; formal analysis, W.N.; investigation, X.D.; resources, L.G.; data curation, Z.X.; writing—original draft preparation, C.W.; writing—review and editing, H.L.; visualization, J.L.; supervision, L.G., G.X.s and X.D.; project administration, L.G. and G.X.; funding acquisition, L.G. All authors have read and agreed to the published version of the manuscript.
Funding
This work was funded by Science and Technique Project Funds of State Grid Jiangsu Electric Power (Contract number: J2024094).
Data Availability Statement
The data in this study are available upon request from the corresponding author.
Conflicts of Interest
Li Guo, Guiyuan Xue, Zheng Xu, and Wenjuan Niu are employees of State Grid Jiangsu Economic Research Institute. The remaining authors declare that the research was conducted in the absence of any commercial or financial relationships that could be construed as a potential conflict of interest.
Abbreviations
The following abbreviations are used in this manuscript:
| TNEP | Transmission Network Expansion Planning |
| VPP | Virtual Power Plant |
| QPSO | Quantum Particle Swarm Optimization |
| MINLP | Mixed-Integer Nonlinear Programming |
| PV | Distributed Photovoltaics |
| EV | Electric Vehicle |
References
- Li, J.; Huang, Y.; Dou, X.; Wang, S.; Chu, T. Optimal Energy Storage Configuration for Primary Frequency Regulation Performance Considering State of Charge Partitioning. IEEE Trans. Sustain. Energy 2025, 16, 1659–2668. [Google Scholar] [CrossRef]
- Zhou, Y.; Wang, L.; Fan, H.; Wang, Y.; Sun, Y. Research on Interaction between HEMS-VPP and Power System with High Renewable Energy Penetration under Net Zero Emissions: Operation Strategy and Economy Viability Boundary. Appl. Energy 2025, 390, 125773. [Google Scholar] [CrossRef]
- Kong, X.; Lu, W.; Wu, J.; Wang, C.; Zhao, X.; Hu, W.; Shen, Y. Real-Time Pricing Method for VPP Demand Response Based on PER-DDPG Algorithm. Energy 2023, 271, 127036. [Google Scholar] [CrossRef]
- Li, Q.; Yu, X.; Li, H. Batteries: From China’s 13th to 14th Five-Year Plan. eTransportation 2022, 14, 100201. [Google Scholar] [CrossRef]
- Qin, Y.; Rao, Y.; Xu, Z.; Lin, X.; Cui, K.; Du, J.; Ouyang, M. Toward Flexibility of User Side in China: Virtual Power Plant (VPP) and Vehicle-to-Grid (V2G) Interaction. eTransportation 2023, 18, 100291. [Google Scholar] [CrossRef]
- Li, Q.; Wei, F.; Zhou, Y.; Li, J.; Zhou, G.; Wang, Z.; Liu, J.; Yan, P.; Yu, D. A Scheduling Framework for VPP Considering Multiple Uncertainties and Flexible Resources. Energy 2023, 282, 128385. [Google Scholar] [CrossRef]
- Ndlela, N.W.; Moloi, K.; Kabeya, M. Comprehensive Analysis of Approaches for Transmission Network Expansion Planning. IEEE Access 2024, 12, 195778–195815. [Google Scholar] [CrossRef]
- Meneses, M.; Zamora, H.; Macedo, L.H.; Romero, R. Optimizing Transmission Network Expansion Planning Using Search Space Reduction. IEEE Access 2025, 13, 68773–68784. [Google Scholar] [CrossRef]
- Pezzati, N.; Innocenti, E.; Berzi, L.; Delogu, M. Scalable Energy Management Model for Integrating V2G Capabilities into Renewable Energy Communities. World Electr. Veh. J. 2025, 16, 450. [Google Scholar] [CrossRef]
- García-Cerezo, Á.; Baringo, L.; García-Bertrand, R. Expansion Planning of the Transmission Network with High Penetration of Renewable Generation: A Multi-Year Two-Stage Adaptive Robust Optimization Approach. Appl. Energy 2023, 349, 121653. [Google Scholar] [CrossRef]
- García-Cerezo, Á.; García-Bertrand, R.; Baringo, L. Acceleration Techniques for Adaptive Robust Optimization Transmission Network Expansion Planning Problems. Int. J. Electr. Power Energy Syst. 2023, 148, 108985. [Google Scholar] [CrossRef]
- García-Mercado, J.I.; Gutiérrez-Alcaraz, G.; Gonzalez-Cabrera, N.; Hinojosa, V.H. AC Security-Constrained Transmission Network Expansion Planning Problem Using an Improved Binary Particle Swarm Optimization. Electr. Power Syst. Res. 2025, 241, 111297. [Google Scholar] [CrossRef]
- Hong, L.; Wang, G.; Bai, R. A Particle Swarm Optimization-Based Ensemble Metaheuristic for Long-Term Transmission Network Expansion Planning. Appl. Soft Comput. 2025, 179, 113282. [Google Scholar] [CrossRef]
- García-Mercado, J.I.; Gutiérrez-Alcaraz, G.; Gonzalez-Cabrera, N. Improved Binary Particle Swarm Optimization for the Deterministic Security-Constrained Transmission Network Expansion Planning Problem. Int. J. Electr. Power Energy Syst. 2023, 150, 109110. [Google Scholar] [CrossRef]
- Habib, S. A Cumulative Capital Approach for Dynamic Transmission Expansion Planning: Enhancing Cost Efficiency and Grid Development. Expert Syst. Appl. 2025, 292, 128665. [Google Scholar] [CrossRef]
- Alshamrani, A.M.; El-Meligy, M.A.; Sharaf, M.A.F.; Mohammed Saif, W.A.; Awwad, E.M. Transmission Expansion Planning Considering a High Share of Wind Power to Maximize Available Transfer Capability. IEEE Access 2023, 11, 23136–23145. [Google Scholar] [CrossRef]
- Aguado, J.A.; Martin, S.; Pérez-Molina, C.A.; Rosehart, W.D. Market Power Mitigation in Transmission Expansion Planning Problems. Policy Regul. IEEE Trans. Energy Mark. 2023, 1, 73–84. [Google Scholar] [CrossRef]
- Chen, Y.; Song, Z.; Hou, Y. Climate-Adaptive Transmission Network Expansion Planning Considering Evolutions of Resources. IEEE Trans. Ind. Inform. 2024, 20, 2063–2078. [Google Scholar] [CrossRef]
- García-Cerezo, Á.; Baringo, L.; García-Bertrand, R. Robust Transmission Network Expansion Planning Considering Non-Convex Operational Constraints. Energy Econ. 2021, 98, 105246. [Google Scholar] [CrossRef]
- Sasi Bhushan, M.A.; Sudhakaran, M.; Dasarathan, S.; Sowmya Sree, V. Reliability Enhancement of Puducherry Smart Grid System Through Optimal Integration of Electric Vehicle Charging Station–Photovoltaic System. World Electr. Veh. J. 2025, 16, 443. [Google Scholar] [CrossRef]
- Suresh, T.D.; Thirumalai, M.; Hemalatha, R.; Bajaj, M.; Blazek, V.; Prokop, L. Resilient VPP Cost Optimization in DER-Driven Microgrids for Large Distribution Systems Considering Uncertainty during Extreme Events. Energy Convers. Manag. X 2025, 27, 101176. [Google Scholar] [CrossRef]
- Türkoğlu, A.S.; Güldorum, H.C.; Sengor, I.; Çiçek, A.; Erdinç, O.; Hayes, B.P. Maximizing EV Profit and Grid Stability through Virtual Power Plant Considering V2G. Energy Rep. 2024, 11, 3509–3520. [Google Scholar] [CrossRef]
- Wang, Y.; Tong, X.; Xie, Y.; Chen, B.; Tong, N.; Wu, X. A Two-Stage Robust Optimization for EV User-Friendly VPP Participation in Ancillary Service Markets. Int. J. Electr. Power Energy Syst. 2025, 171, 111004. [Google Scholar] [CrossRef]
- Yin, X.; Chen, H.; Liang, Z.; Zhu, Y. A Flexibility-Oriented Robust Transmission Expansion Planning Approach under High Renewable Energy Resource Penetration. Appl. Energy 2023, 351, 121786. [Google Scholar] [CrossRef]
- Wu, Y.; Fang, J.; Ai, X.; Xue, X.; Cui, S.; Chen, X.; Wen, J. Robust Co-Planning of AC/DC Transmission Network and Energy Storage Considering Uncertainty of Renewable Energy. Appl. Energy 2023, 339, 120933. [Google Scholar] [CrossRef]
- Raman, N.S.; Barooah, P. On the Round-Trip Efficiency of an HVAC-Based Virtual Battery. IEEE Trans. Smart Grid 2020, 11, 403–410. [Google Scholar] [CrossRef]
- Guo, L.; Xue, G.; Xu, Z.; Li, H.; Li, J.; Dou, X. Multi-Objective Time-Domain Coupled Feasible Region Construction Method for Virtual Power Plant Considering Global Stability. Energies 2025, 18, 2974. [Google Scholar] [CrossRef]
- Bagheri, A.; Mobayen, S. Optimal Integration of Dynamic Line Rating and Transmission Expansion for Sustainable Grids: A Mixed-Integer Linear Programming Approach with Voltage Stability Constraints. Sustain. Energy Grids Netw. 2025, 44, 101932. [Google Scholar] [CrossRef]
- Zhang, L.; Yin, Q.; Zhang, Z.; Zhu, Z.; Lyu, L.; Hai, K.L.; Cai, G. A Wind Power Curtailment Reduction Strategy Using Electric Vehicles Based on Individual Differential Evolution Quantum Particle Swarm Optimization Algorithm. Energy Rep. 2022, 8, 14578–14594. [Google Scholar] [CrossRef]
Disclaimer/Publisher’s Note: The statements, opinions and data contained in all publications are solely those of the individual author(s) and contributor(s) and not of MDPI and/or the editor(s). MDPI and/or the editor(s) disclaim responsibility for any injury to people or property resulting from any ideas, methods, instructions or products referred to in the content. |
© 2025 by the authors. Published by MDPI on behalf of the World Electric Vehicle Association. Licensee MDPI, Basel, Switzerland. This article is an open access article distributed under the terms and conditions of the Creative Commons Attribution (CC BY) license (https://creativecommons.org/licenses/by/4.0/).