Article

Optimized Charging Strategy for Lithium-Ion Battery Based on Improved MFO Algorithm and Multi-State Coupling Model

The Key Laboratory of Modern Power System Simulation and Control & Renewable Energy Technology, Ministry of Education, Northeast Electric Power University, Jilin 132012, China
*
Author to whom correspondence should be addressed.
World Electr. Veh. J. 2025, 16(10), 565; https://doi.org/10.3390/wevj16100565
Submission received: 13 August 2025 / Revised: 14 September 2025 / Accepted: 17 September 2025 / Published: 2 October 2025
(This article belongs to the Section Charging Infrastructure and Grid Integration)

Abstract

In lithium-ion battery charging, balancing charging speed with efficiency and state of health (SOH) is paramount. First, a multi-state electric-thermal-aging coupling model was developed to accurately reflect battery operating conditions. Second, a voltage-based multi-stage constant current-constant voltage (VMCC-CV) strategy was implemented, incorporating an innovative V-SOC-Rint conversion mechanism—integrating voltage, state of charge (SOC), and internal resistance—to effectively mitigate thermal buildup during transitions. To optimize the VMCC-CV currents, an innovative enhancement was applied to the moth-flame optimization (MFO) algorithm, demonstrating superior performance over its traditional counterpart across diverse charging scenarios. Finally, three practical strategies were devised: rapid charging, multi-objective balanced charging, and enhanced safety performance charging. Relative to the manufacturer’s 0.75 C-CCCV protocol, the balanced strategy significantly accelerates charging, reducing time by 34.11%, while sustaining 93.54% efficiency and limiting SOH degradation to 0.006856%. Compared to conventional CCCV methods, the proposed approach offers greater versatility and applicability in varied real-world scenarios.

1. Introduction

As a superior electrochemical energy storage device, lithium-ion batteries offer high energy density, extended service life, and no memory effect [1]. They are widely utilized as a primary energy source in renewable energy applications and as power solutions for electric vehicles (EVs) [2]. Effective charging strategies are critical for optimizing lithium-ion battery performance across diverse applications. To enhance charging speed, prolong battery lifespan, and ensure safety, future research must focus on developing advanced charging processes [3]. Consequently, a multi-objective optimized charging strategy that integrates multiple factors is imperative to address these requirements effectively.
The conventional CC-CV charging protocol [4,5] is widely adopted due to its straightforward implementation. This protocol involves applying a constant current (CC) initially, followed by maintaining a constant voltage (CV) once the battery reaches a predetermined voltage threshold, typically the maximum safe voltage. However, the CC-CV method has limitations in enhancing charging speed and ensuring battery longevity. Specifically, increasing the charging current to accelerate the process can lead to overheating and lithium plating in lithium-ion batteries, while the prolonged constant voltage phase exacerbates capacity degradation [6]. Consequently, the CC-CV protocol is insufficient to meet the demands of rapid charging, extended service life, and operational safety required for modern applications.
To address the limitations of the conventional CC-CV charging method and enhance the overall performance of lithium batteries during charging. Ref. [7] introduced a gray prediction (GP) model that substitutes the constant voltage (CV) stage with a GP stage to accelerate the lithium battery charging trajectory. Comparable effects are observed in other charging methods. For instance, adding constant voltage charging after multi-stage constant current (MCC-CV) [8], connecting negative pulse after constant current and constant voltage stage (CC-CV-NP) [9]. The researchers demonstrated that multi-stage constant current (MCC) charging reduces charging time, enhances charging efficiency, prolongs Li-ion battery lifespan, and improves battery safety [10,11,12,13,14,15]. Ref. [16] utilized the Taguchi method, based on SOC-split current, to design orthogonal experiments for identifying the optimal 5-stage constant current sequence, yielding a charging curve that significantly enhances charging speed while maintaining a temperature comparable to the CC-CV method. Some computer-programmable controllers can be used to obtain an optimal charging profile through a feedback regulation mechanism, such as model predictive control (MPC) [17,18,19], linear quadratic regulator (LQR) [20,21], and proportional-integral-derivative (PID) control [22]. Ref. [23], which examines battery surface modification, establishes a valuable framework for situating resistance and charging optimization. Furthermore, certain studies have integrated models with metaheuristic optimization algorithms to optimize the currents at each stage of the MCC process. Ref. [24] used an electro-thermal aging model with a PSO algorithm to design a multi-stage constant current and constant voltage charging strategy that can accelerate the charging speed and reduce the battery degradation. Ref. [25] achieved a substantial reduction in charging time while maintaining a slight balance in battery aging by employing a physically based side reaction model and a genetic algorithm. Ref. [26] searching for fast charging patterns using ant colony algorithm.
The charging strategies derived from the aforementioned meta-heuristic optimization methods typically necessitate intricate parameter configurations or complex controller implementations. Furthermore, most optimization objectives are limited to dual-objective optimization, focusing exclusively on charging time and battery state of health (SOH) or temperature. Additionally, for multi-stage constant-current derivative charging strategies, existing approaches primarily rely on state of charge (SOC) or voltage as the criteria for transitioning between constant-current modes, without accounting for variations in internal resistance during the charging process. To address these limitations, this study proposes a multi-objective optimization charging strategy for multi-stage constant-current to constant-voltage (MCC-CV) charging, based on a voltage-SOC-internal resistance (V-SOC-Rint) switching mechanism. A high-fidelity multi-state coupled model is developed, incorporating experimental parameters such as battery voltage, current, and internal resistance to accurately capture the battery’s electrical, thermal, and aging characteristics. The enhanced Moth-Flame Optimization (MFO) algorithm integrates a Particle Swarm Optimization (PSO) hybrid acceleration factor and refines the spiral search mechanism, significantly improving the diversity, uniformity, and convergence of the solution set. Analysis of the Pareto frontier coefficient reveals that this charging strategy effectively adapts to the charging requirements of electric vehicles across diverse application scenarios. The IMFO charging strategy proposed in this study effectively adapts to the charging demands of electric vehicles across diverse application scenarios, demonstrating superior performance compared to prior research [27]. This strategy enhances charging rates during the initial phase, accelerates battery temperature reduction in the later stage, and mitigates battery lifespan degradation, thereby achieving superior multi-objective optimization outcomes throughout the charging process.
The remaining sections of this paper are organized as follows. Section 2 develops and validates a multi-state coupling model on the experimental platform. Section 3 describes the optimized charging method and the principles of the improved MFO algorithm. Section 4 presents the relevant charging results and discusses them. Section 5 provides the conclusions.

2. Multi-State Coupling Model of Lithium-Ion Battery

2.1. Second-Order RC Circuit Model

As shown in Figure 1, a second-order RC model is employed to characterize the electrical behavior of the lithium-ion battery (LIB). This model consists of a voltage source, an ohmic resistor, and two parallel resistor-capacitor (RC) pairs. Based on Kirchhoff’s laws, the following equations describe the model’s state variables:
V k = V o c v + V 0 + V 1 + V 2
d V 1 d t = V 1 R 1 C 1 + I C 1
d V 2 d t = V 2 R 2 C 2 + I C 2
R i n t = R 0 + R 1 + R 2
Vk represents the voltage at the output of the LIB, Vocv denotes the open circuit voltage, V0 denotes the voltage of the ohmic internal resistance, and V1 and V2 indicate the port voltages of the two RC networks, respectively. I represent the charging current. R0 indicates the ohmic internal resistance. R1 and R2 denote the polarization resistors. C1 and C2 indicate the polarization capacitance. Rint is the total of the ohmic internal resistance and polarized internal resistance.
Experiments have demonstrated a nonlinear link between Vocv and SOC(t) [28], which is represented by the following equations for the correlation and SOC calculation, respectively:
V o c v ( t ) = i = 0 n p i · S O C ( t ) i
S O C ( t ) = S O C t 0 + t 0 t f I ( t ) d t C n
where Pi is the coefficient. Cn represents the rated capacity, t0 indicates the charging start time, and tf indicates the charging end time. SOC(t0) denotes the battery’s charging state at the charging start moment.
Energy loss (unit: Joule J) is important in evaluating lithium battery charging. Batteries experience energy loss during charging and discharging mainly due to ohmic resistance, which converts energy into heat once the current stabilizes. After charging, significant charge accumulation stops, and the current across the polarization capacitance becomes negligible. Thus, energy loss (Eloss) can be expressed as follows:
E l o s s = t 0 t f I 2 R i n t d t
Battery charging efficiency, denoted as η, as the ratio of the ideal energy input to the actual energy input over the charging cycle.
η = 0 t V o c v ( t ) · I ( t ) d t 0 t V k ( t ) · I ( t ) d t
wherein the numerator, based on the open-circuit voltage Vocv(t), represents the ideal energy input; the denominator, based on the terminal voltage Vk(t), represents the actual energy input, with the measurement window encompassing the entire charging cycle (SOC from 10% to 90%).
It is noteworthy that Vocv, Rint, C1, and C2 are the basic parameters of a Li-ion battery. During the charging process, the above parameters will change with the change in temperature and SOC. Therefore, these parameters need to be obtained before the experiment. The ECM parameters of second-order RC are usually obtained by a Hybrid Pulse Power Characterization (HPPC) test. By applying different multiplicity of pulse currents, the Li-ion battery parameters are dynamically updated, and the above parameters are determined from the output voltage profile.

2.2. Thermal Model

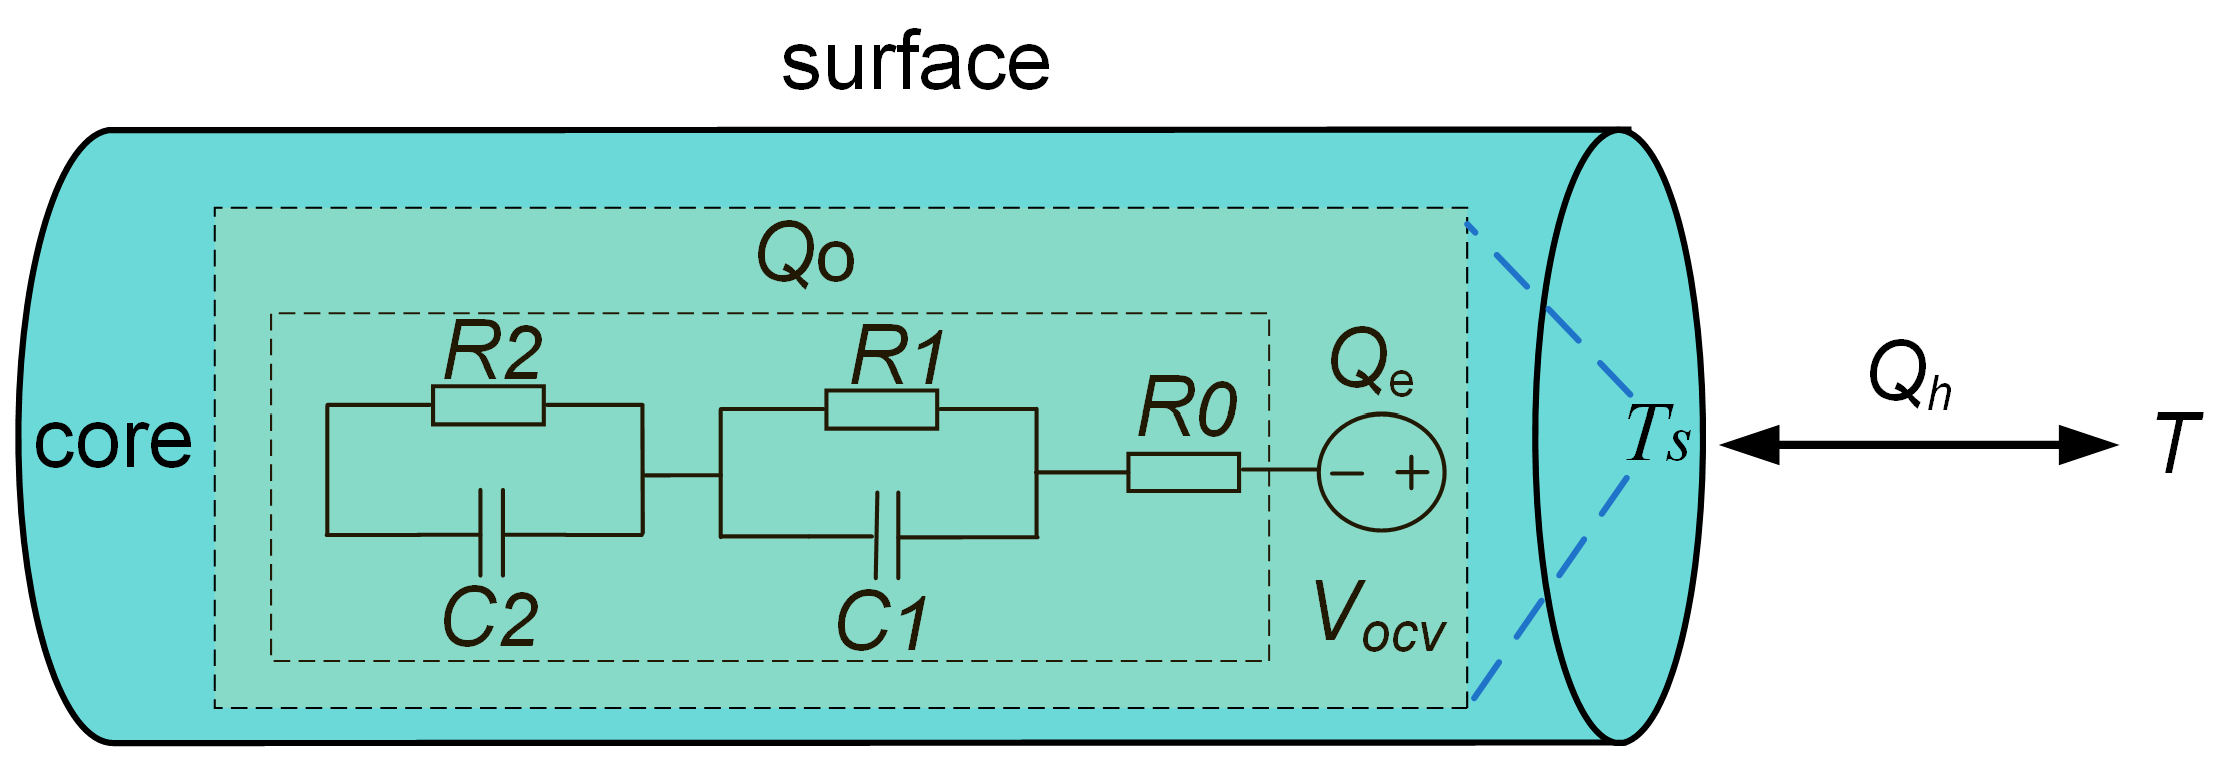
As shown in Figure 2 battery in the charging process, due to the existence of resistance, heat generation, and internal chemical reaction, the battery emits heat (unit: Watt W), causing the battery surface temperature (unit: Kalvin K) to rise. There is a heat transfer between the heat generated by the battery itself and the external environment. The following equations represent the battery thermal model established:
Q = Q o + Q e Q h
Q = m c d T d t
Q o = I ( V k V o c v )
Q e = I T s U o c v T
Q h = h A T s T
where Q is the total heat generation under the joint action of battery internal and ambient temperatures. Q0, Qe, and Qh are the heat generated by the internal resistance of the battery, the entropic heat of the internal chemical reaction, and the conduction heat between the battery and the environment. The total heat generation of a lithium battery can be composed of the above three parts. Where m is the mass of the battery, and c is the specific heat capacity of the battery. Ts is the surface temperature of the battery, T is the ambient temperature, ∂Uocv/∂T is the partial derivative of the open circuit voltage to the ambient temperature, h is the coefficient of conduction heat between the battery and the environment, and A is the surface area of the battery.
After analyzing the charging principle of the second-order RC circuit, we find that once the current stabilizes, the battery’s energy mainly dissipates through R0, and the voltage drops across R1 and R2, while the current through the capacitor is negligible. Therefore, Qo can be represented by the following equation:
Q 0 = I 2 R i n t
By organizing (8)–(13), an expression for the change in surface temperature of the battery is derived:
m c d T s d t = I 2 R i n t + I T s U o c v T h A ( T s T )

2.3. Aging Model

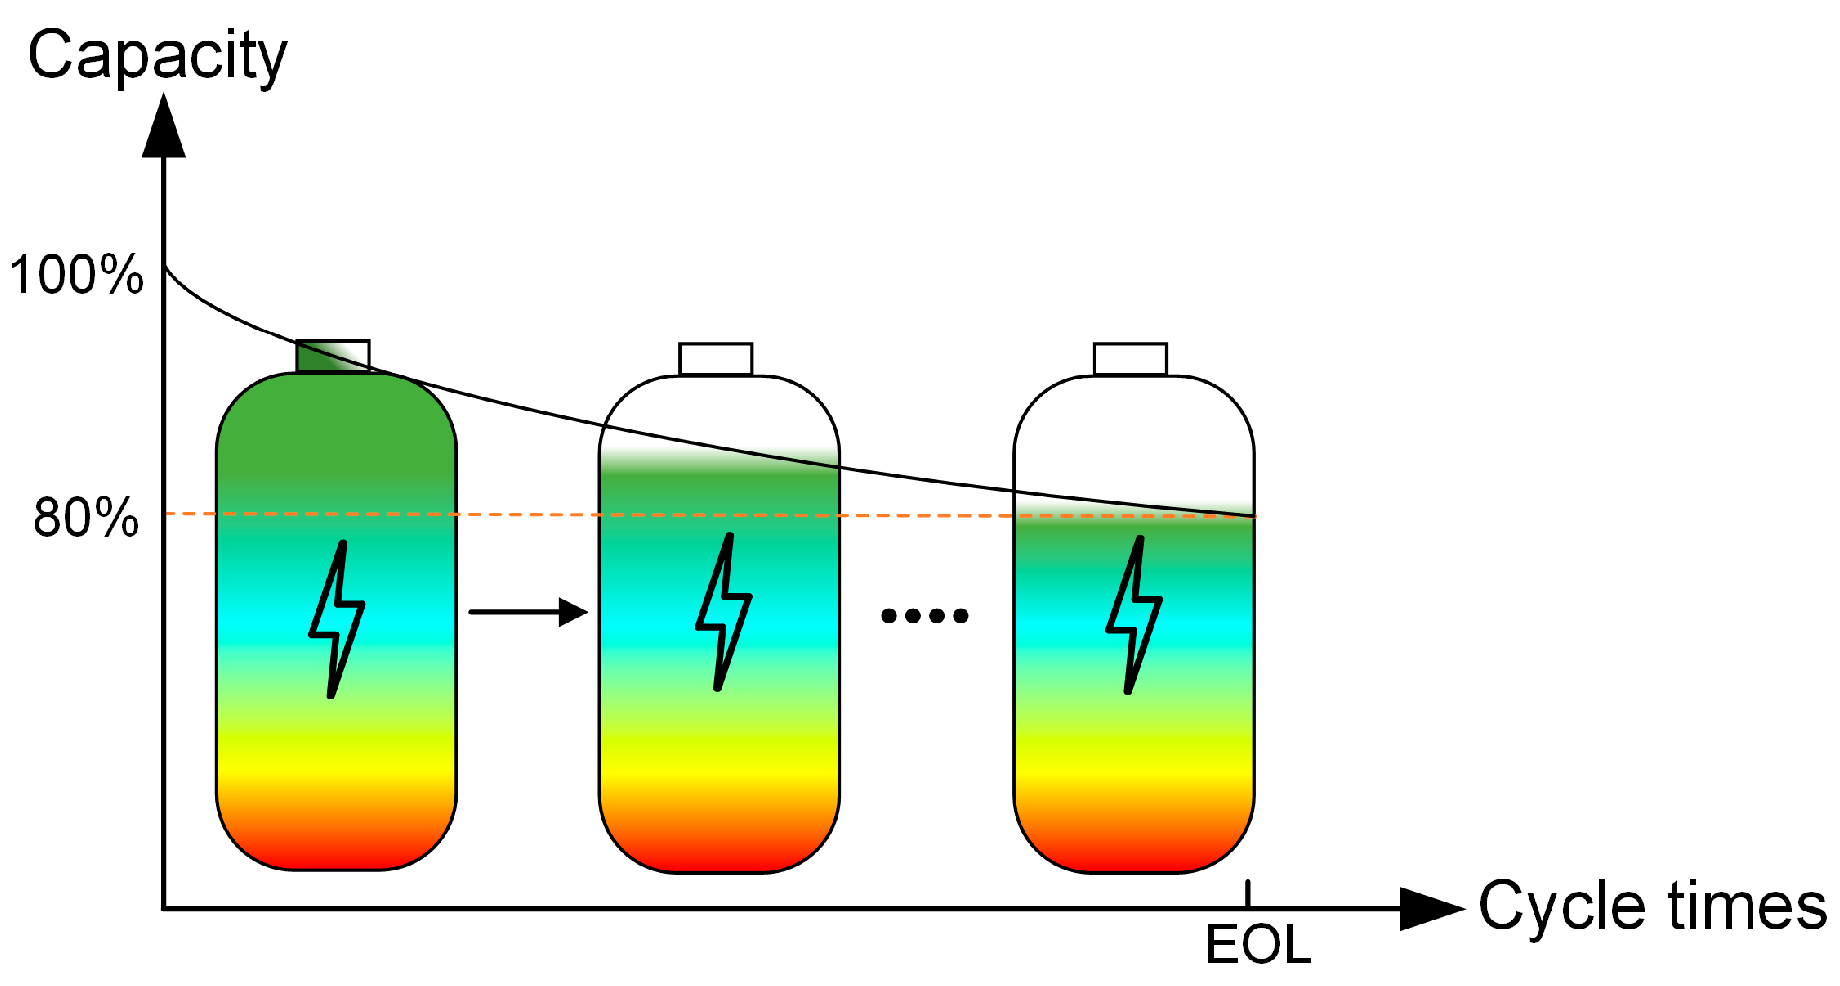
For the charging process of lithium-ion batteries, greater emphasis is placed on the impact of cyclic aging rather than calendar aging. In this study, a semi-empirical aging model [29] that has undergone extensive experimental validation is adopted. The aging model was developed via extensive orthogonal experiments across temperatures of −30 to 60 °C, discharge depths of 10–90%, and rates of 0.5 C–10 C. As shown in Figure 3, the model reflects the cyclic aging behavior of lithium batteries in the form of throughput Ah, and the specific capacity degradation empirical model is shown below:
Q l o s s = B ( C ) exp E a ( C ) + α | I | R T s ( A h ) z
where Qloss is the capacity degradation percentage (unit: %), α represents the current influence on aging, which takes the value of 32 best, and R = 8.314 J mol−1 K−1 indicates the ideal gas constant. Power law factor z = 0.55. B(C) denotes the finger forward factor, which exhibits a nonlinear relationship with the current multiplicity and is used to quantify the impact of current on battery aging. Its equation is derived by fitting data from reference [29]:
B ( C ) = 47.84 C 3 + 1215 C 2 9419 C + 36 , 040
Ea(C) is the activation energy of the cell and is expressed as follows.
E a ( C ) = 31 , 700 370.3 C
Studies have shown that a battery cannot continue to be used when its capacity has degradation to 20% of itself, implying that the end-of-life (EOL) period has been reached. According to (16), when Qloss = 20%, the battery throughput Ah at this point is deduced to be:
A ( C , T s ) = 20 / B ( C ) e x p E a ( C ) + α I R T s 1 z
where N indicates the number of cycles during the battery’s service life, the maximum value at the end of life, often used as an index to evaluate the battery’s performance. N is related to the rated capacity. Its expression is as follows:
N ( C , T s ) = 3600 A ( C , T ) C n
In practical engineering applications, lithium batteries have charge storage and release during the charging and discharging process, equivalent to 2 times Cn. Therefore, in the service life cycle of lithium batteries, the SOH loss at each sampling time Δt can be expressed by the following formula:
S O H l o s s = I k Δ t 2 N k c , T s C n
The health state of the battery during charging can be defined as in (19) and (20):
S O H ( t f ) = S O H ( t 0 ) t 0 t f I ( t ) d t 3600 × 2 A ( C , T s )
It should be noted that our research utilizes an aging model based on Lithium Iron Phosphate (LFP)/carbon batteries, where a chemical mismatch may arise due to differences in battery material properties. However, the applicability of the aging model is supported by shared electrochemical aging mechanisms across lithium-ion chemistries, such as capacity fade caused by the solid electrolyte interphase (SEI) and resistance increase, which are fundamental processes applicable to both NCM and LFP systems.

2.4. Multi-State Coupling Model and Model Validation

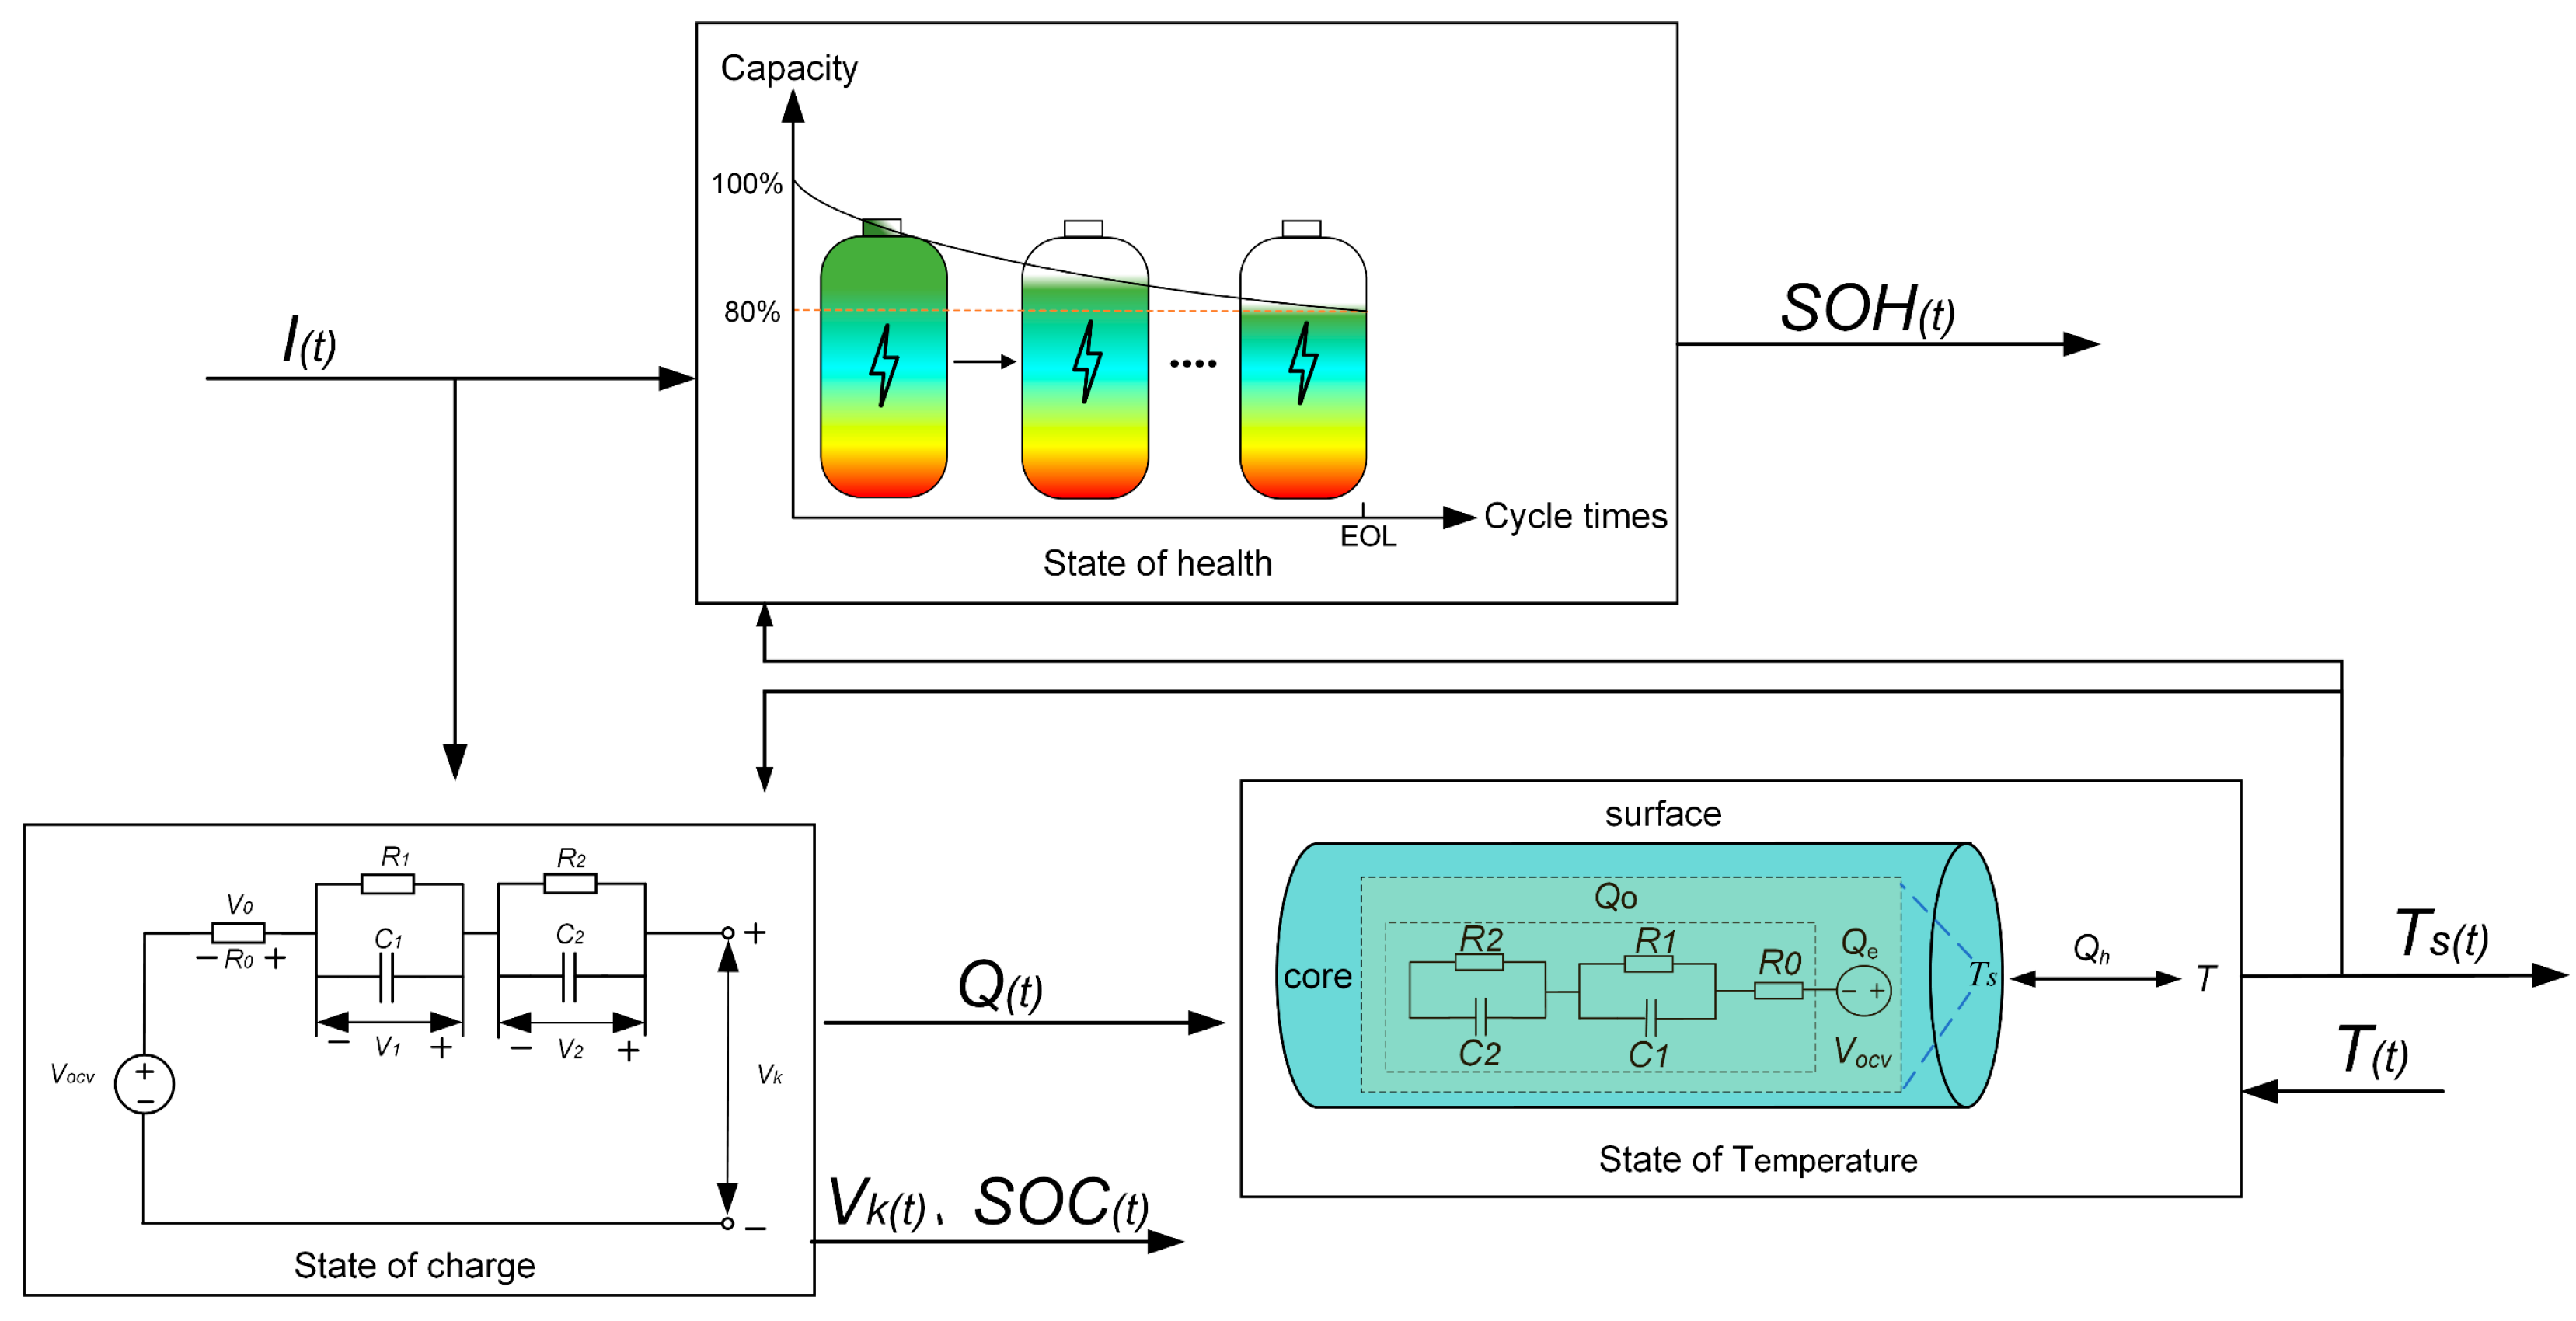
As illustrated in Figure 4, the developed multi-state coupling model integrates the states of charge, thermal dynamics, and aging. The operational principle of this model is as follows: at the onset of charging, current is applied to the second-order RC circuit, leading to an increase in voltage, SOC, and temperature due to the combined effects of internal battery resistance, chemical reactions, and ambient temperature. Heat generation elevates the battery’s surface temperature, which, in turn, influences the internal battery environment and dynamically updates its parameters. Concurrently, the SOH degrades under the influence of current and surface temperature.
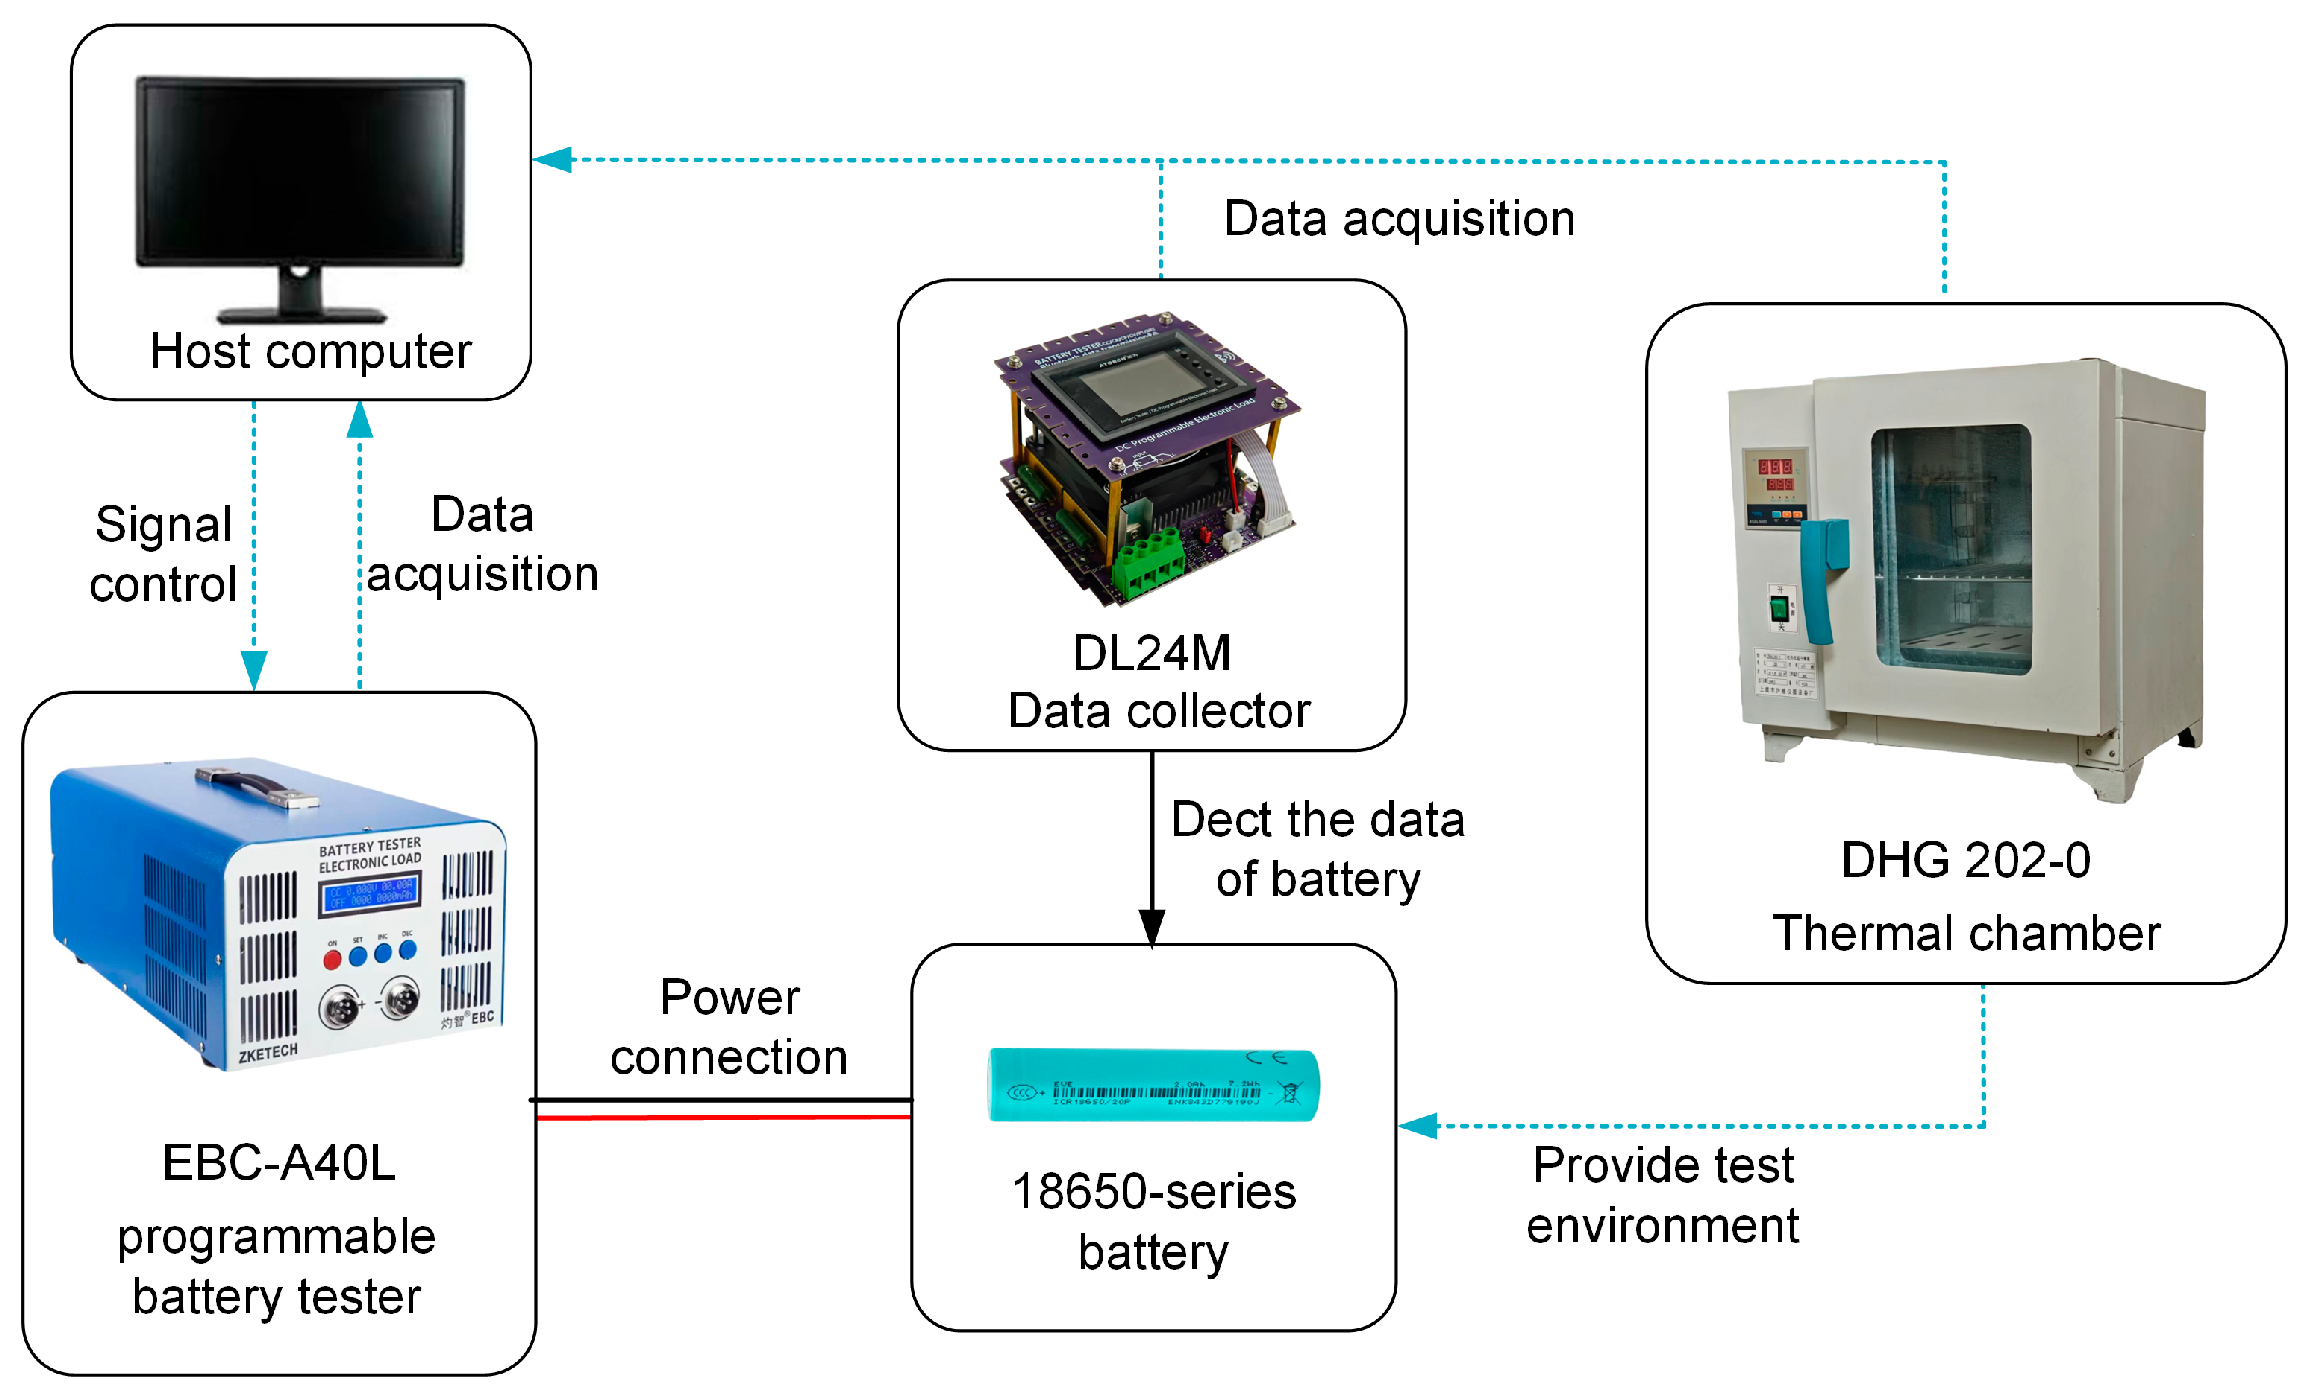
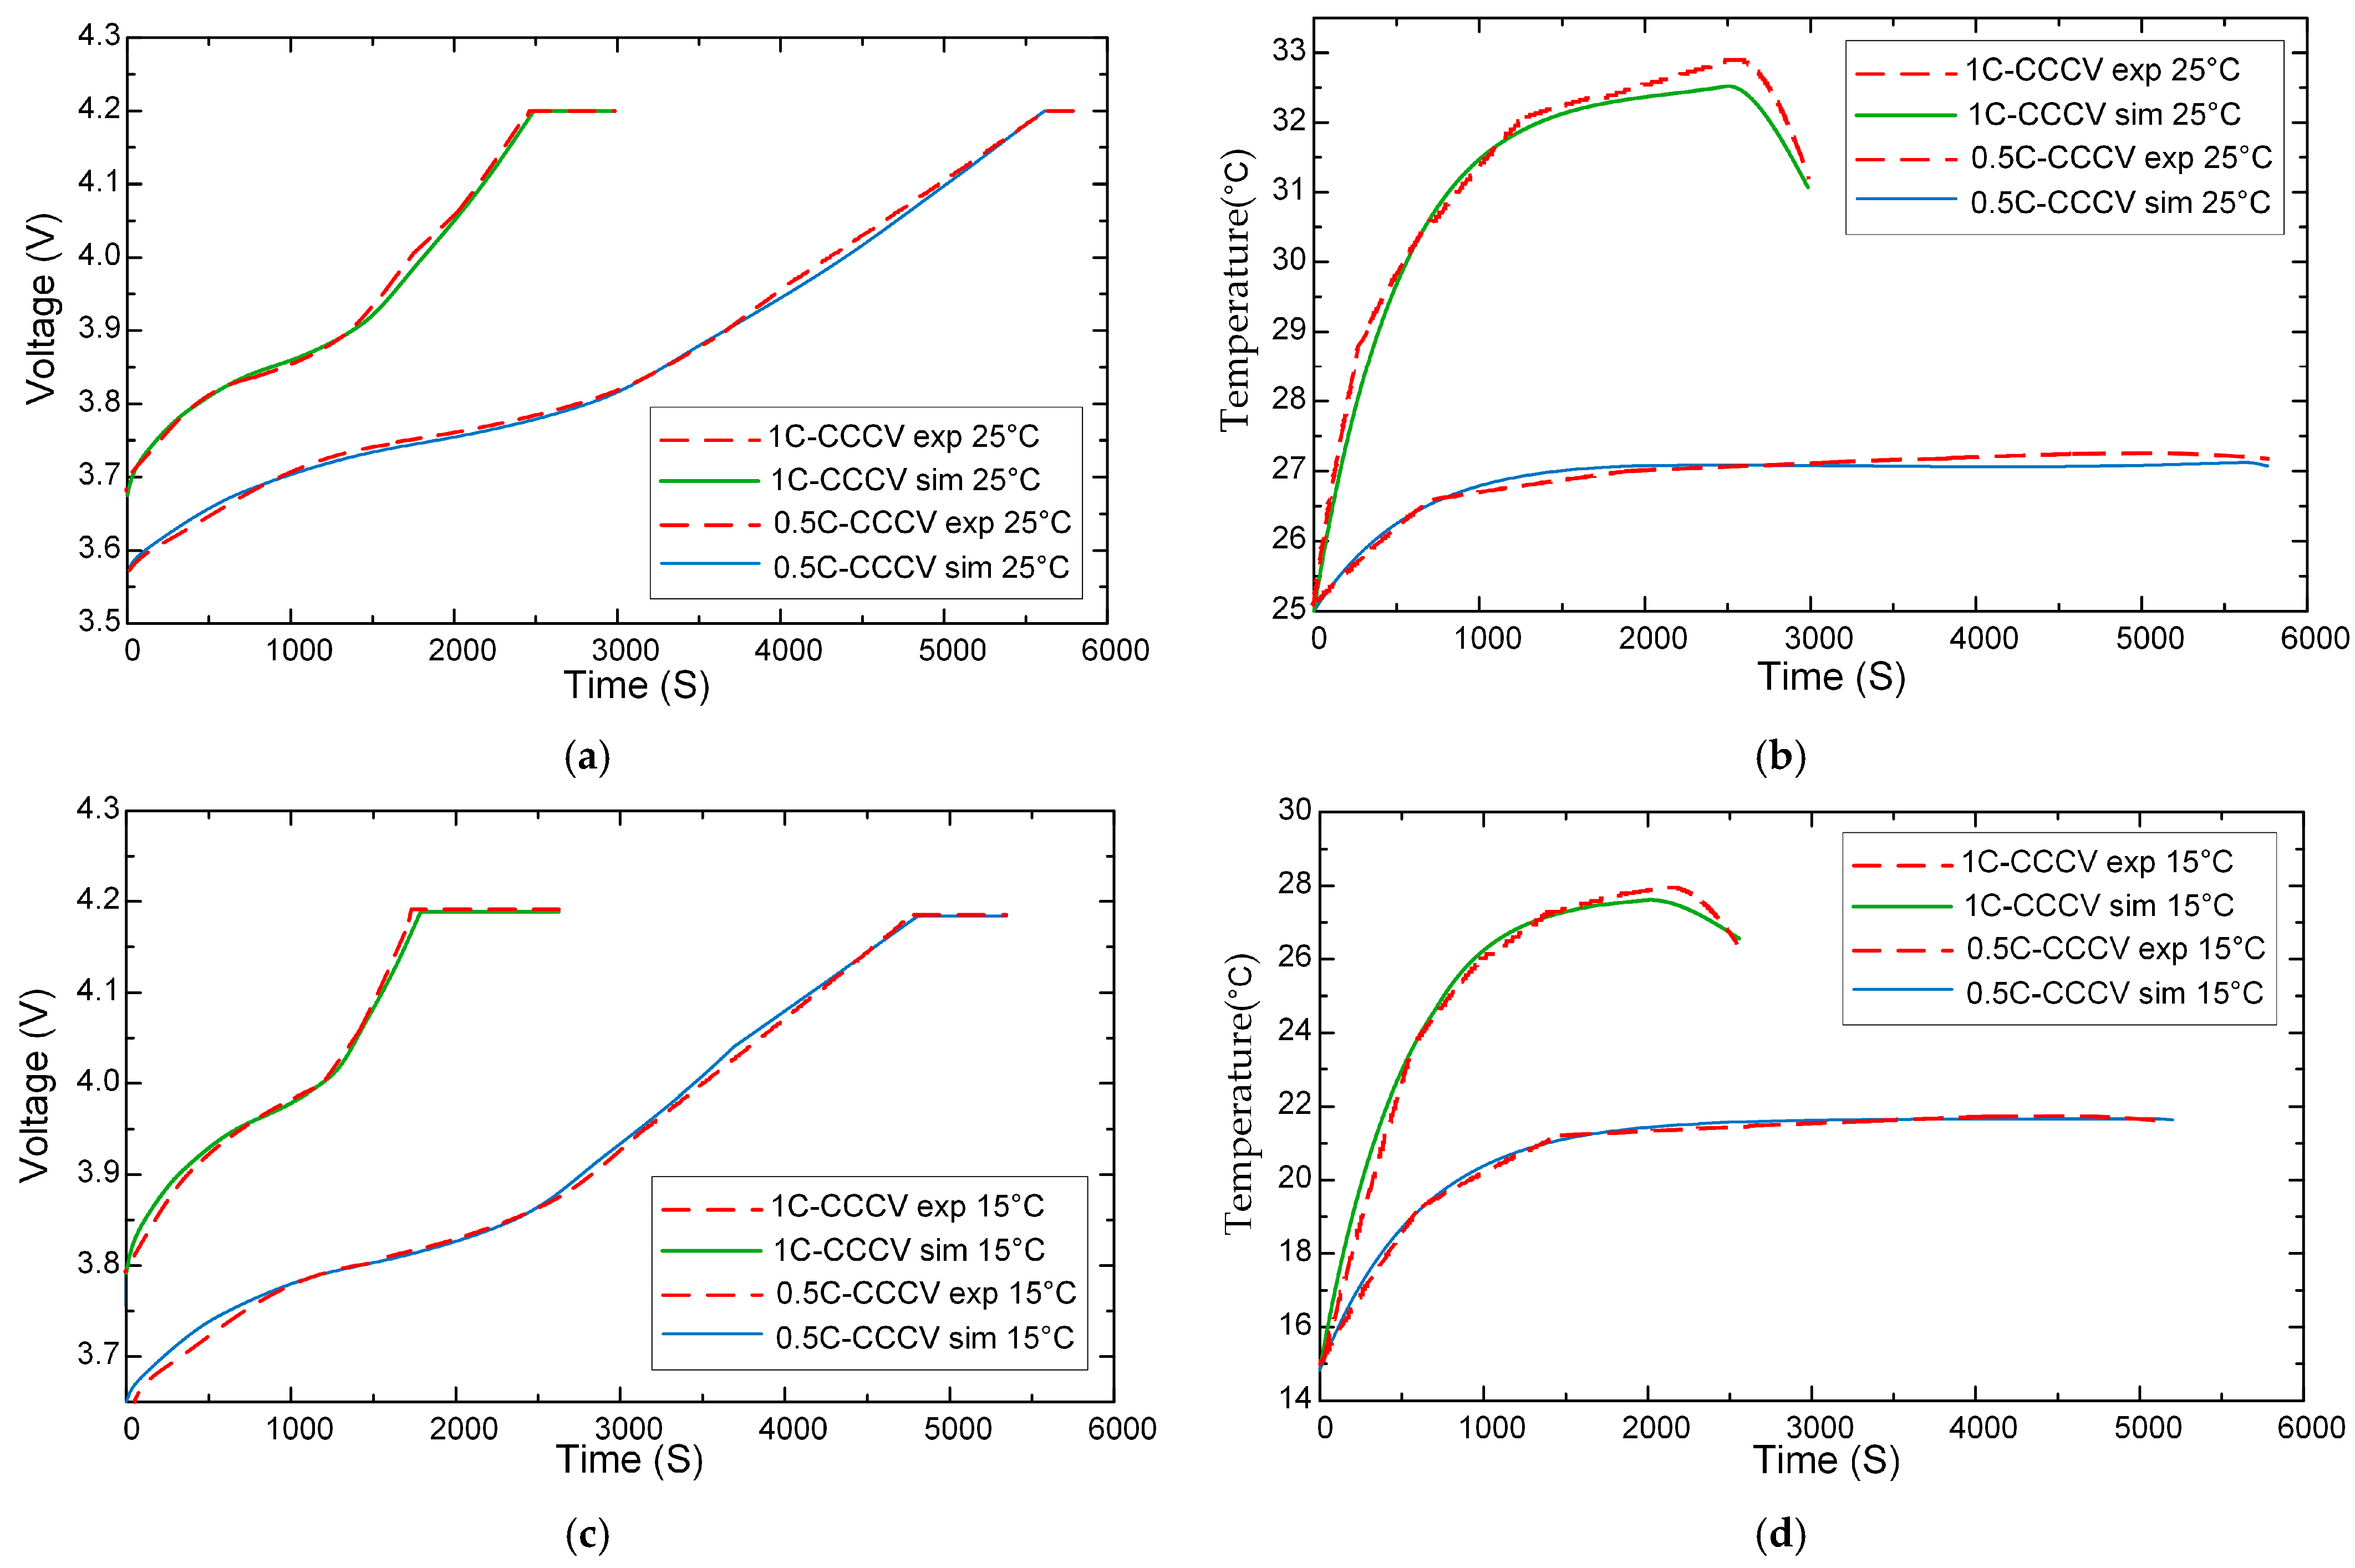
To verify the reliability of the built model, this paper builds the experimental platform as shown in Figure 5, and the battery parameters are shown in Table 1. Under ambient conditions of 25 °C and 15 °C, charging experiments were conducted on 18650-series lithium-ion battery using 1C-CCCV and 0.5C-CCCV protocols, with results illustrated in Figure 6. Both simulation and experimental data demonstrate that, at 25 °C, the maximum deviations between simulated and experimental voltage and temperature for 1C-CCCV are 0.0198 V and 0.56 °C, respectively, while for 0.5C-CCCV, they are 0.016 V and 0.18 °C, respectively. At 15 °C, the lower temperature increases the battery’s internal resistance, resulting in a shorter charging completion time compared to 25 °C. At this temperature, the maximum deviations for 1C-CCCV are 0.018 V and 0.32 °C, and for 0.5C-CCCV, they are 0.022 V and 0.12 °C, respectively. These findings confirm the accuracy and reliability of the developed multi-state coupling model.

3. Optimization of Charging Method

3.1. VMCC-CV Charging Strategy Based on V-SOC-Rint

This study employs a V-SOC-Rint-based VMCC-CV charging strategy, which integrates a voltage-switching-based multi-stage constant current (VMCC) approach with considerations of state of charge (SOC) and internal resistance (Rint) variations, followed by a constant voltage (CV) phase. The strategy is designed based on key principles. In the initial SOC phase, a high current density shortens the early charging time by utilizing ample lithium intercalation sites and avoiding mass transport bottlenecks. However, lithium plating risks must be addressed, as uneven current distribution in the negative electrode can cause concentrated current density, increasing overpotential and leading to lithium crystallization. As SOC and temperature rise, internal chemical reactions intensify, increasing internal resistance; continuing high currents would raise energy consumption and heat, reducing battery lifespan. To mitigate lithium plating and optimize performance, this study sets the manufacturer-specified maximum charging current as the “safe current upper limit” and employs the VMCCCV method, using stepwise current reduction to alleviate localized overpotential in the low SOC phase, thus enhancing charging performance. According to reference [30], when the SOC approaches approximately 90%, incorporating a CV phase after the VMCC stage gradually reduces the current, thereby accelerating charging while mitigating significant battery life degradation and extending cycle life. In this study, the variations in SOC and Rint are further analyzed to provide theoretical support for optimizing the proposed charging strategy.
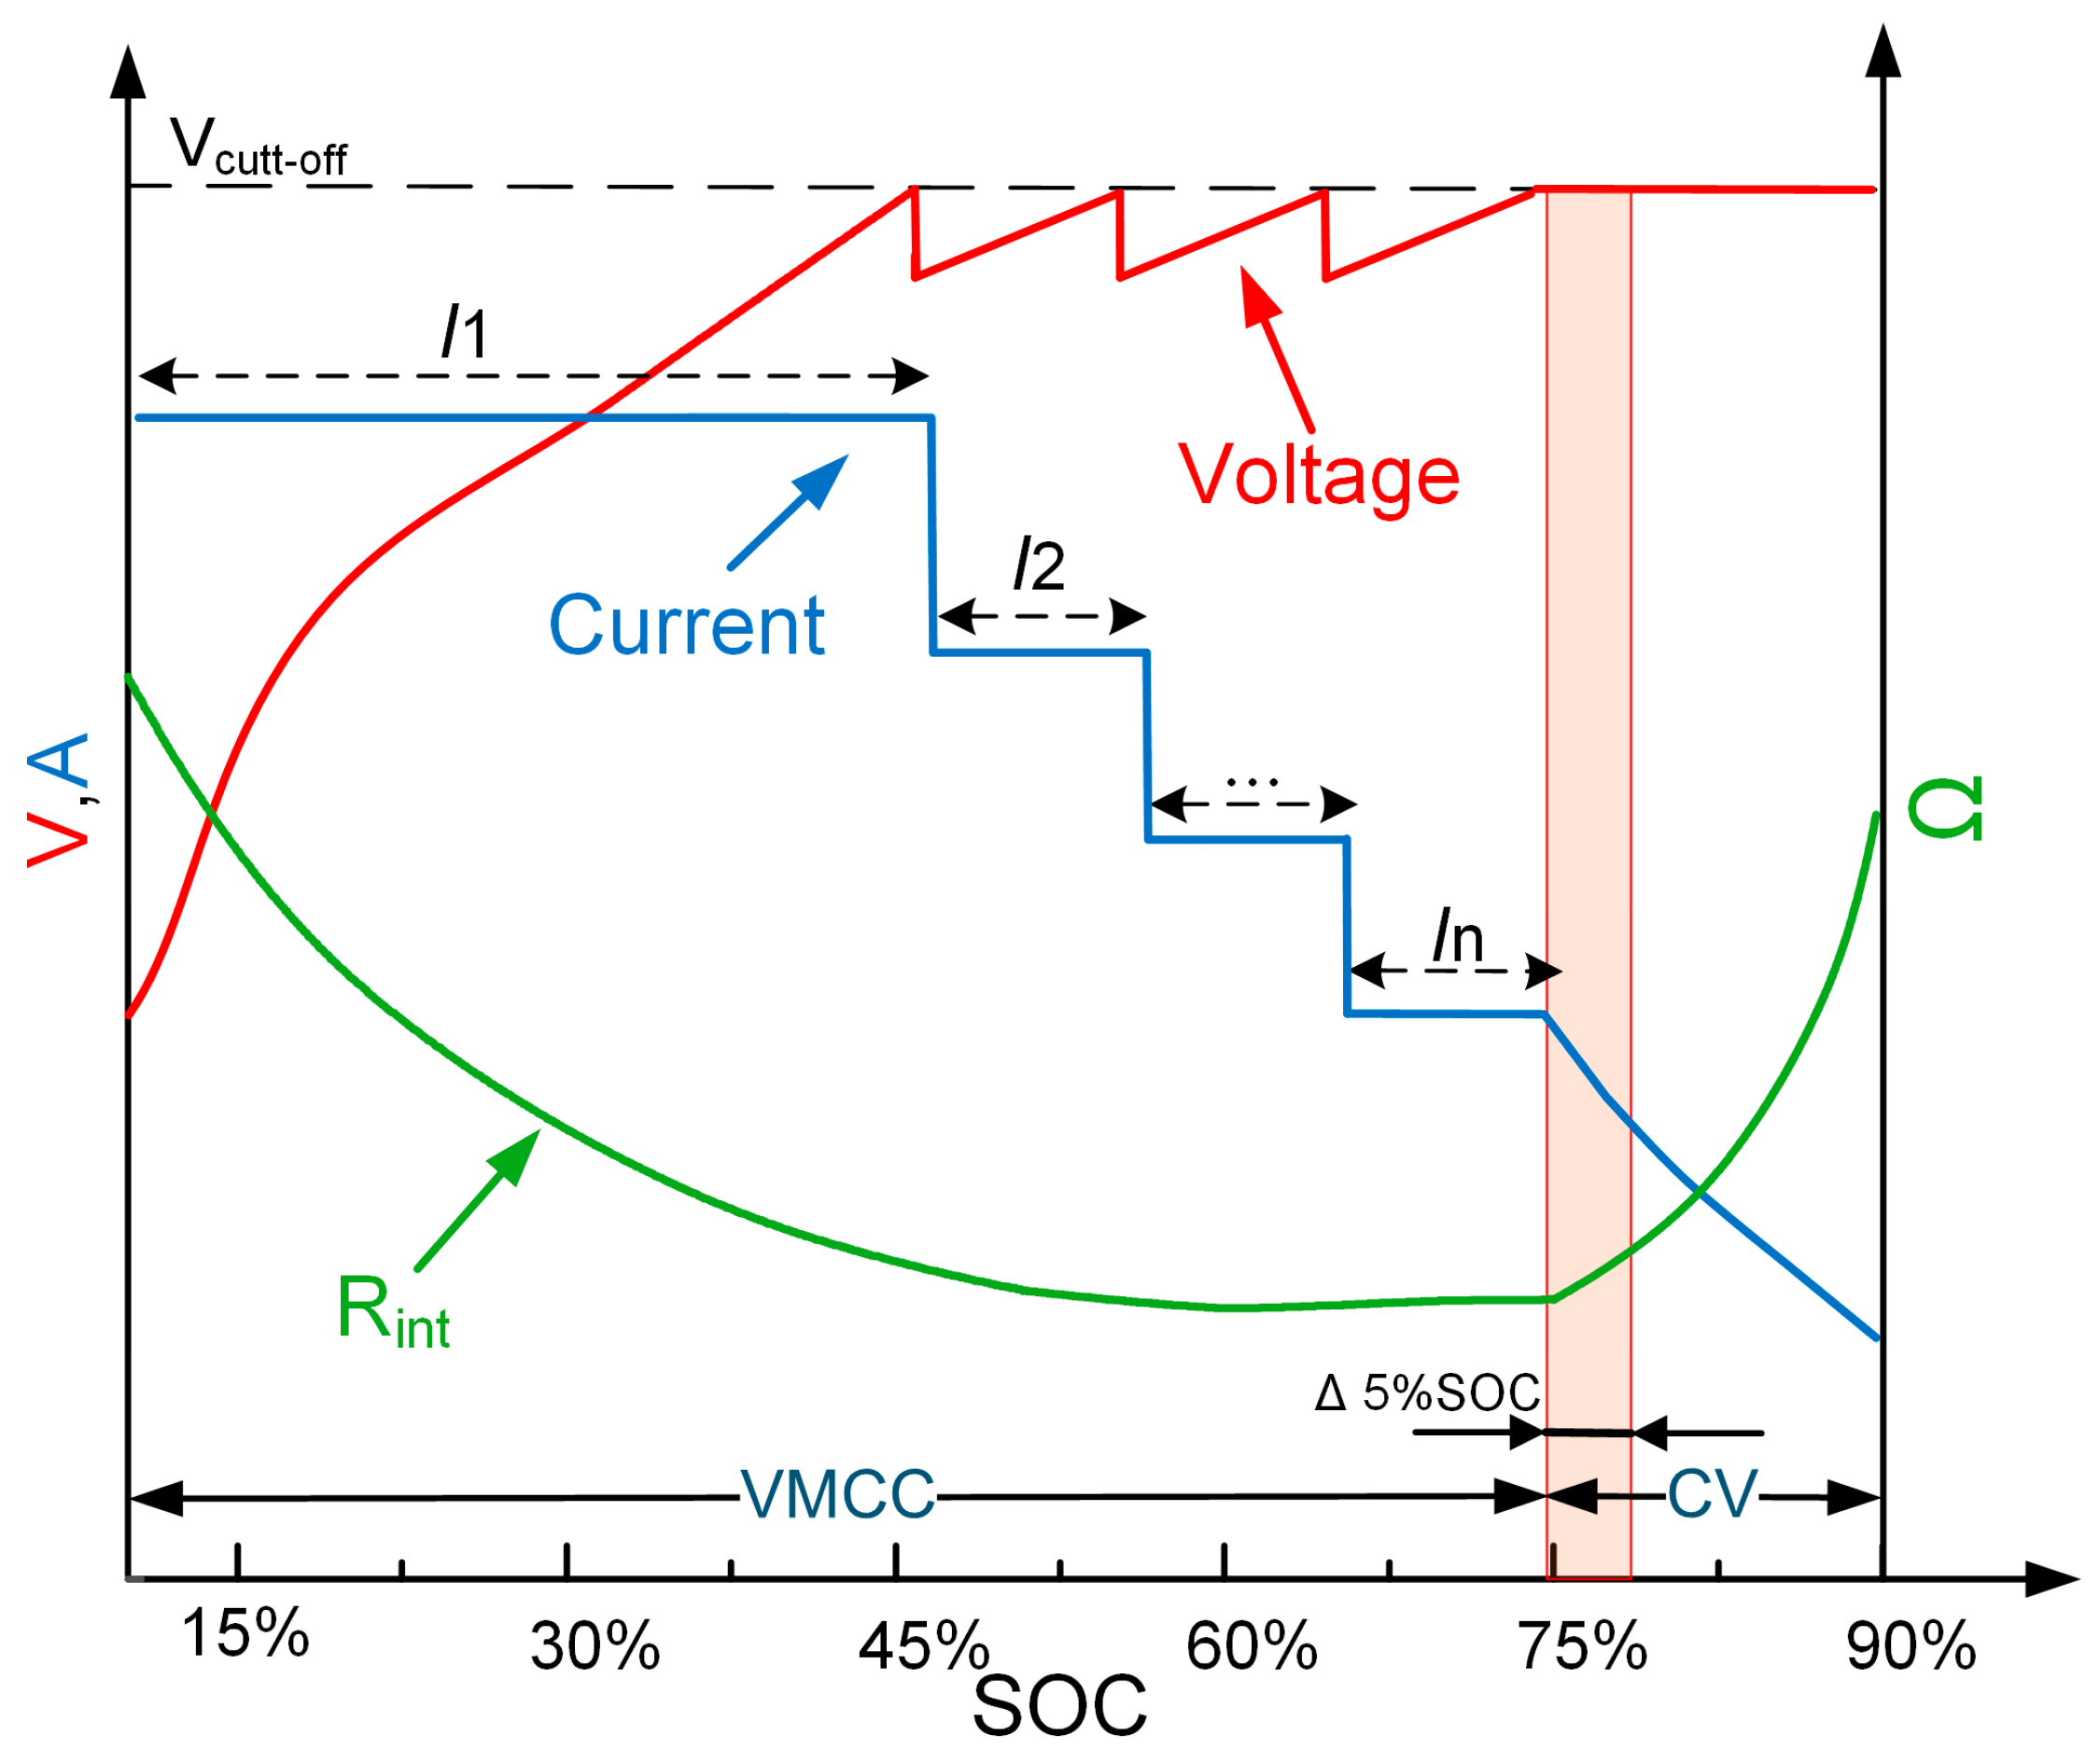
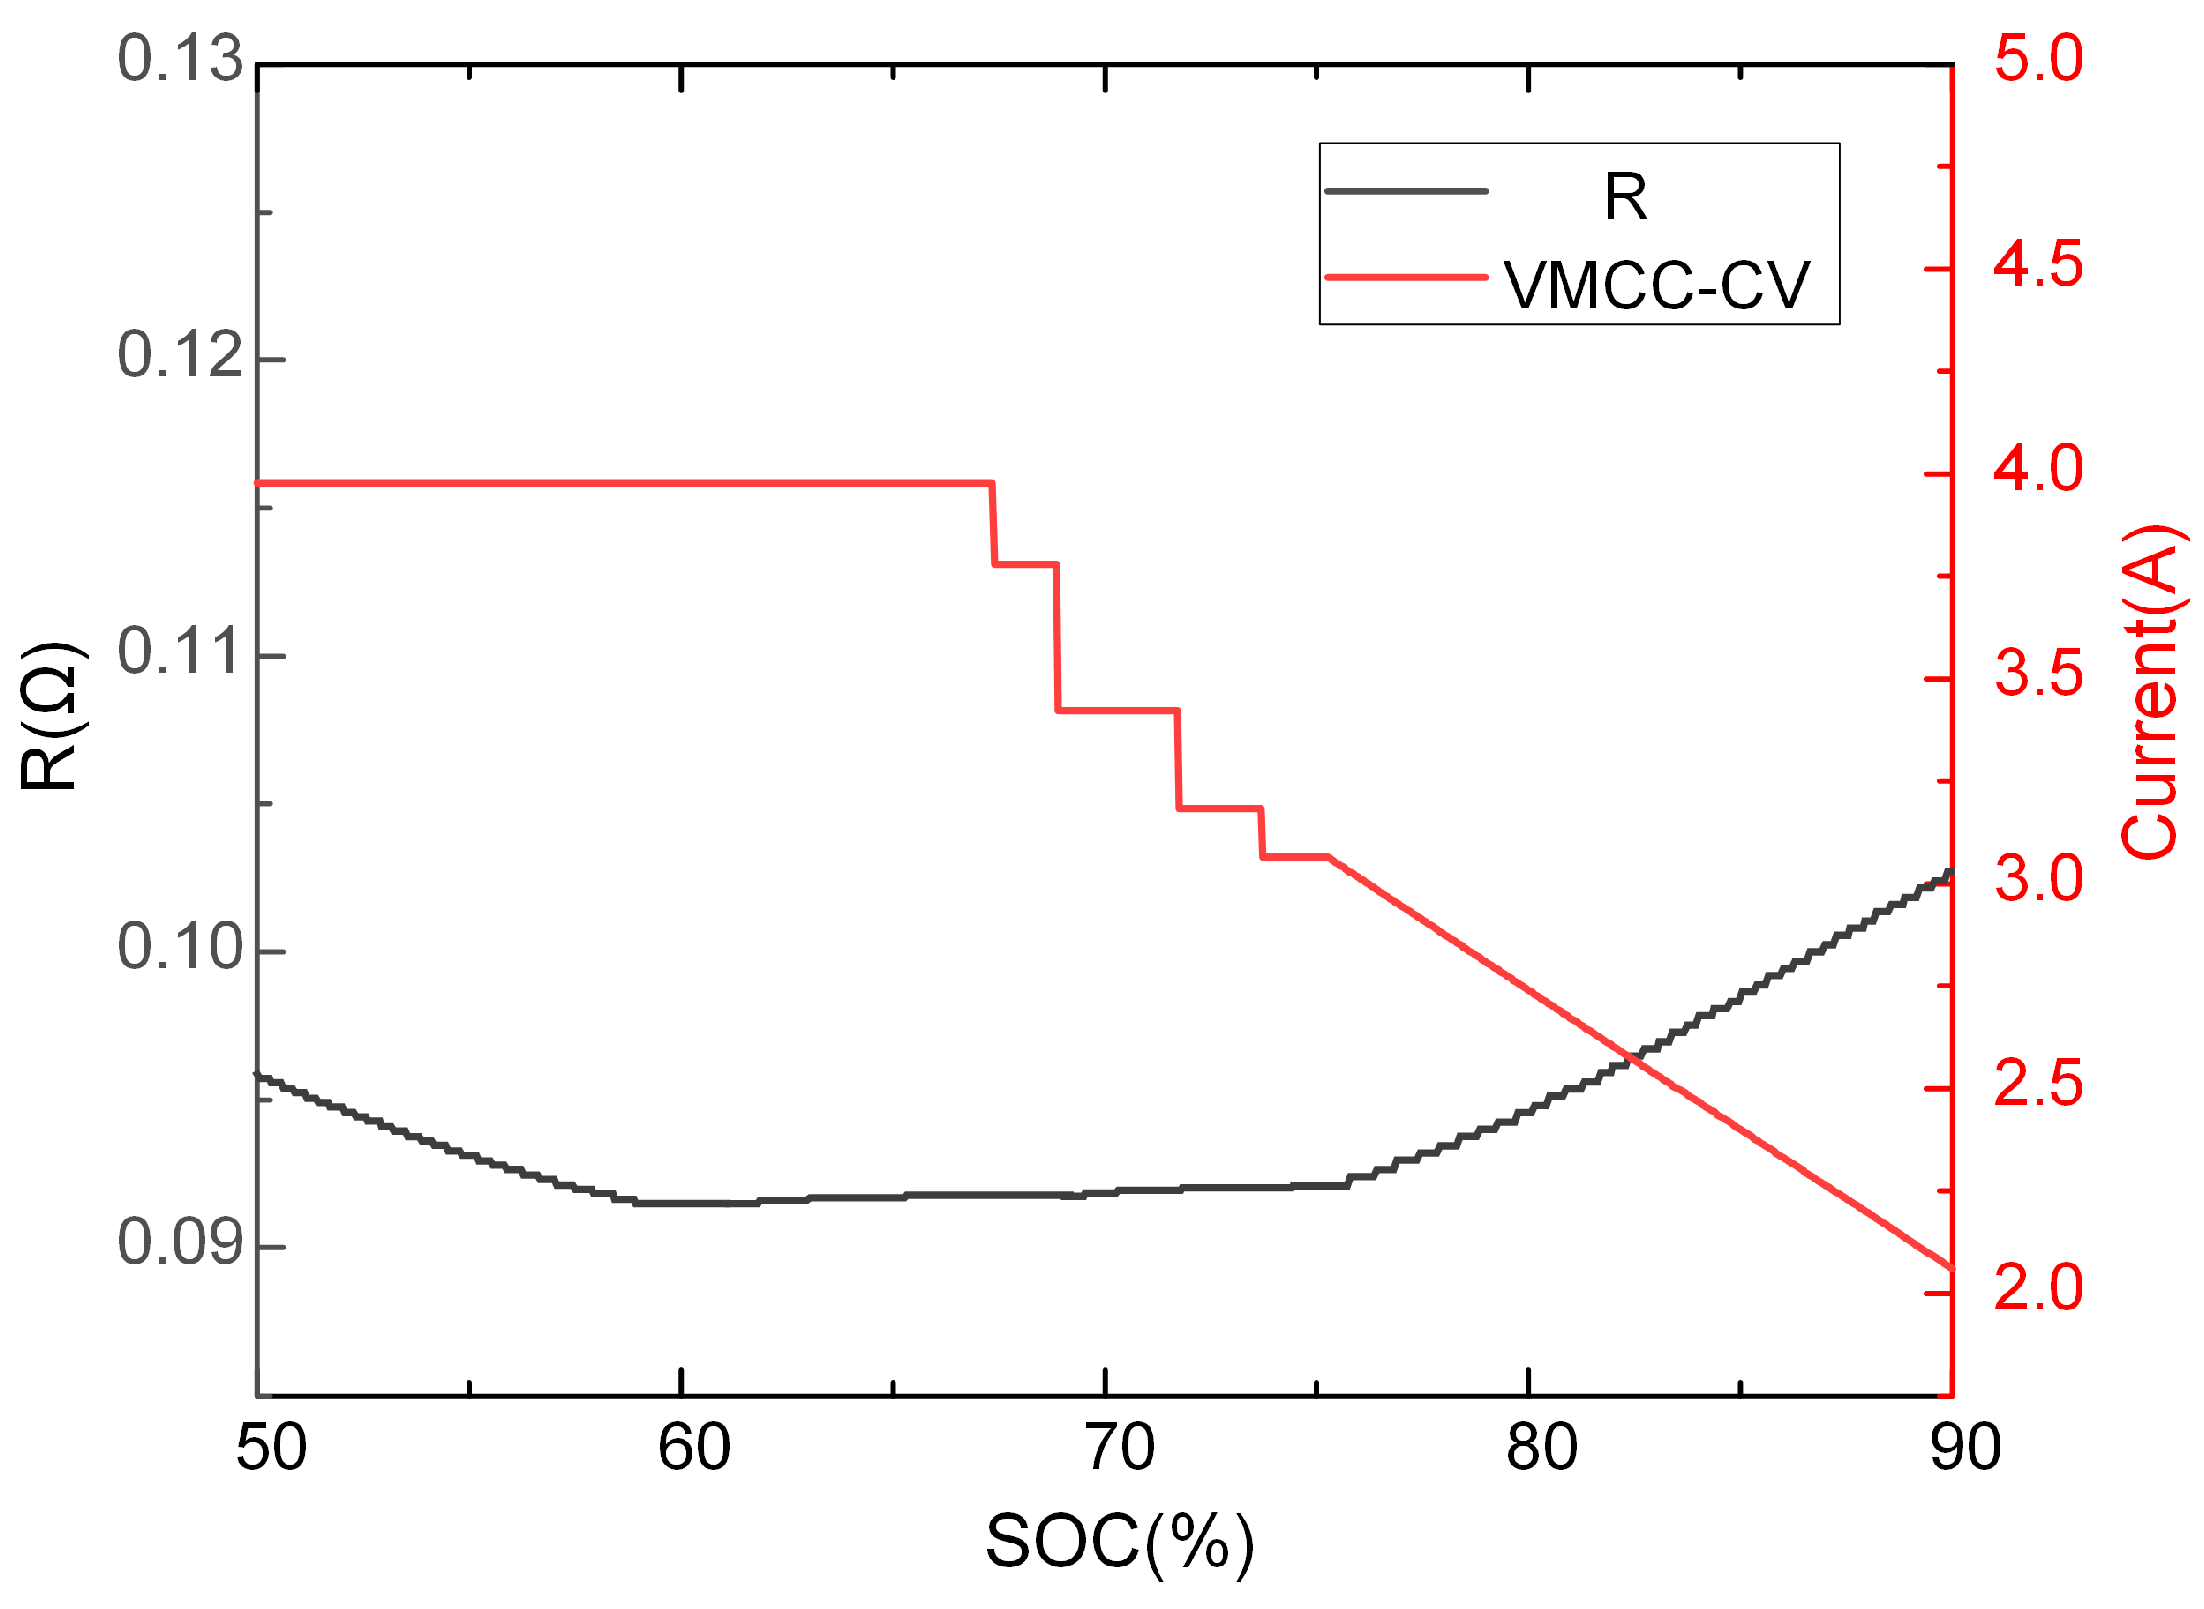
In this study, the estimation of Rint (SOC) is conducted using the Hybrid Pulse Power Characterization (HPPC) window method, which involves measuring the battery’s voltage response by applying specific pulse currents [30]. Data fitting is employed to reduce noise and generate a smooth Rint-SOC curve, with a sampling step size set to ΔSOC = 5% to assess monotonicity (dRint (SOC)/dSOC > 0). Based on this, a constraint is established: when SOC exceeds 75% and the monotonicity condition is met, the Rint-SOC switch is activated, transitioning the VMCC phase to the constant voltage (CV) phase. The voltage-based multi-stage constant current and voltage switching method established above is referred to as the V-SOC-Rint mechanism; if its conditions are not satisfied, the VMCC charging method continues to be applied. The specific VMCC-CV curve is illustrated in Figure 6.
As depicted in Figure 7, the charging strategy curve employed is presented. At the onset of charging, a high charging current is applied using the VMCC method. When the SOC reaches approximately 75% and the Rint exhibits a consistent increase under the Δ5% SOC margin condition, the charging method transitions to CV mode, with the current gradually decreasing until the target SOC is achieved. Notably, the proposed VMCC-to-CV switching criterion is not restricted to a specific SOC percentage but comprehensively accounts for the variation ranges of SOC and Rint values, enhancing the flexibility of the charging strategy.
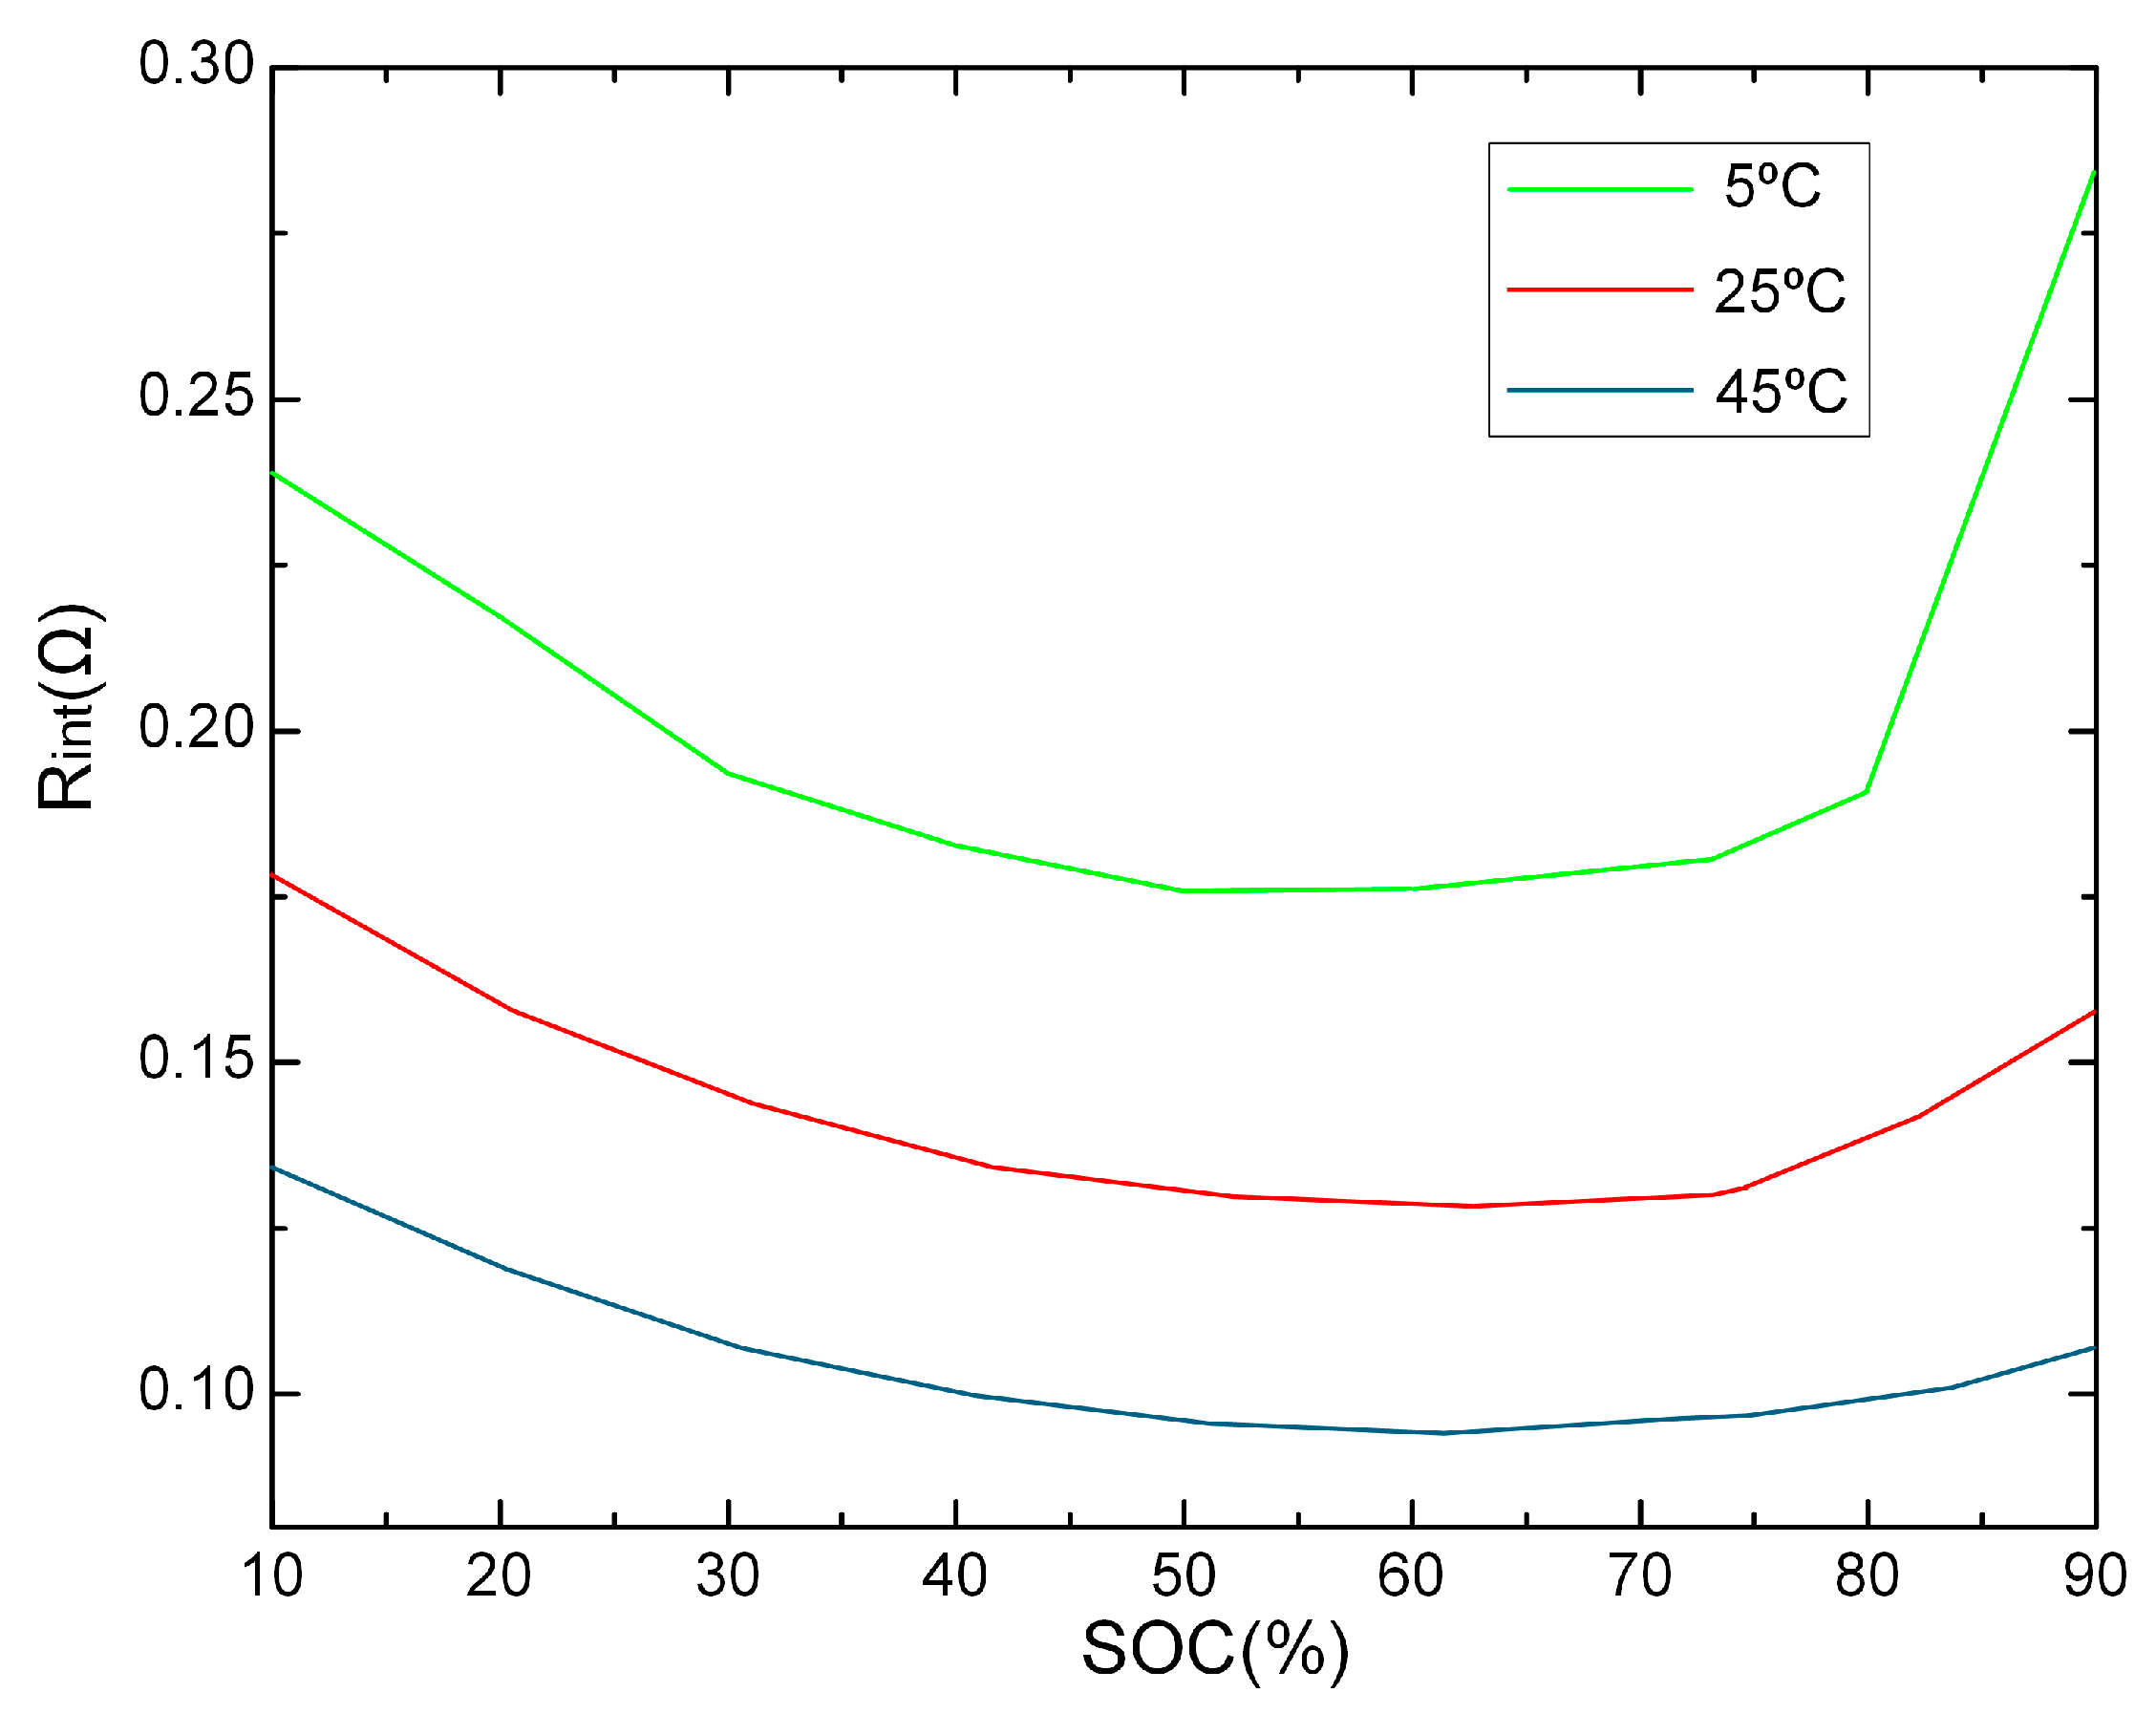
To reflect the Rint-SOC characteristics under different temperatures, the Rint-SOC curves at various temperatures are fitted and presented in Figure 8. As depicted in Figure 8, the battery’s internal resistance (Rint) varies with temperature. At approximately 75% SOC, Rint begins to increase rapidly, and above 75% SOC, the rate of increase in internal resistance varies slightly depending on temperature. Overall, the SOC- Rint curve exhibits a U-shaped pattern, characterized by an initial decrease followed by an increase.

3.2. Optimization Objective Function

This study considers charging time, state of health (SOH) degradation, and energy loss as the objectives to be optimized in the charging strategy. During the charging process, reducing charging time necessitates an increase in charging current, which, as indicated by (7) and (15), leads to higher energy loss and elevated battery temperatures. Within a specific temperature range, higher lithium-ion battery temperatures accelerate SOH degradation. The three objectives of minimizing charging time, state of health (SOH) degradation, and energy loss are inherently interdependent and present conflicting trade-offs.
To address this, the proposed multi-objective optimization approach aims to minimize charging time, SOH degradation, and energy loss concurrently. An objective function is formulated, integrating these objectives through weighted summation. The optimization process involves two steps: first, defining the objective function, where charging time is denoted as Jt, SOH as JSOH, and Energy loss as JE; second, normalizing the objective function for each objective. The following equation represents this process:
J t = t e n d t m i n t m a x t m i n
J S O H = S O H e n d S O H m i n S O H m a x S O H m i n
J E = E e n d E m i n E m a x E m i n
where tend denotes the time at the end of charging, tmin denotes the minimum charging time, and tmax denotes the maximum charging time. SOHend denotes the health state of the battery at the end of charging, SOHmin denotes the minimum battery health state, and SOHmax denotes the maximum battery health state. Eend denotes the total energy loss generated by the battery at the end of charging, Emin denotes the minimum energy loss, and Emax denotes the maximum energy loss.
Finally, the normalized objective function is expressed in terms of weight proportions, and the objective optimization function is described as:
J = w t J t + w S J S O H + w E J E
For the weight factors of charging time, SOH, and energy loss, wt, wS, and wE exhibit dependencies as described in the following analysis.
w t + w S + w E = 1
The constraints established in this paper are shown in Table 2. For the initial moment, the state of charge SOC(t0) is defined to be 10%, the state of health SOH(t0) to be 100%, and the ambient temperature T to be 25 °C. It means that the battery needs to be charged and in the healthiest state at the initial moment.

3.3. Traditional MFO Algorithm

The MFO algorithm was proposed by Mir Jalili in 2015, which is inspired by the phototropic behavior of moths in nature. In a certain space, the moths spiral around the flame in a specific direction, constantly updating their position to get closer to the flame and thus moving towards a more optimal solution. In the process of multiple iterations, the moths gradually gather near the flame and finally achieve the optimal solution to the problem [31].
The positions of the moths represent the initial potential solution to the optimization problem, and each moth flies around the position of its respective flame, and their positions are related as follows:
M i = S ( M i , F j )
where Mi is the i-th moth and Fj is the j-th flame, and S(Mi, Fj) refers to the logarithmic solenoidal relationship between moths and flames. Calculating the fitness values of the individual moths identifies the degree of superiority of the solutions represented by the moths, which represents the degree of importance of each optimization objective. During the iterative process, the position of each moth is updated based on the relative position of the moth to the flame and the logarithmic solenoidal equation. The updated moth and flame positions are related as follows:
S ( M i , F j ) = D i · e b x · cos ( 2 π x ) + F j
where Di denotes the distance between the j-th flame and the i-th moth, b is a constant defining the shape of the logarithmic spiral, and x is a random constant, x ∈ [−1, 1]. Di is expressed as follows:
D i = | F j M i |
As shown in Figure 9, the moth continuously searches in a certain one-dimensional space following a spiral trajectory and gradually updates its position. The MFO algorithm has a dynamic updating mechanism so that the number of flames in each round of iteration gradually decreases, making it eventually search for an optimal solution. Such a dynamic mechanism is expressed by the following equation:
F l a m e _ n o = r o u n d N t N 1 T m a x
where t is the current number of iterations, N is the maximum number of flames, and Tmax is the maximum number of iterations.

3.4. Improved MFO Algorithm

The Multi-Objective Moth-Flame Optimization (MFO) algorithm employs a distinctive spiral search mechanism to effectively explore the solution space. However, the modified algorithm exhibits notable limitations. Primarily, the MFO algorithm can become trapped in local optima due to its dependence on the spiral motion mechanism and a linearly decreasing number of flames. This may result in suboptimal solutions, as the algorithm struggles to escape local regions and explore more optimal solutions, particularly in later iterations. To address the issue of local convergence, this study proposes an Improved MFO (IMFO) algorithm, which integrates a hybrid acceleration factor from Particle Swarm Optimization (PSO) with a dynamically adjusted spiral search mechanism to enhance global search capabilities.
First, to address the local convergence problem of the MFO algorithm, the unique acceleration factor of the PSO algorithm is proposed to be incorporated into the MFO algorithm. The moth position Mpsoi updating method is obtained:
v i = w p s o · v i + c 1 · r 1 · ( p b e s t i M i ) + c 2 · r 2 · ( g b e s t m o t h M i )
M p s o i = M i + v i
where vi is the velocity vector of the ith moth, wpso is the inertia weight, c1, c2 are the social learning factors, pbesti is the historical optimal position of moth i, gbestmonth is the global optimal position, and r1, r2 are the random numbers of [0, 1]. After incorporating the PSO acceleration factor, the ability to jump out of the local optimum can be enhanced by randomly selecting some moths to move according to the PSO update rule every several iterations.
Second, to further improve the late convergence of the MFO algorithm, its spiral search parameter b is dynamically adjusted from a constant:
b = 1 + 0.5 · 1 t T m a x
a = 1 + t T max · ( 1 )
x = ( a 1 ) · rand + 1
where a is the dynamic adjustment factor of the iterative process, and x’ is the dynamically adjusted stochastic constant. The improved spiral updating mechanism enables the early iterations to have a larger exploration range and focus on local optimization in the later stages. According to (27)–(29), the position of the moth Mmfo relative to the flame after the dynamic adjustment of the spiral search parameter b is thus expressed:
M m f o = D i · e b · x · cos ( 2 π x ) + F
The updated formula for the IMFO algorithm that eventually incorporates the PSO acceleration factor is as follows:
M i = P p s o · M p s o + ( 1 P p s o ) · M m f o
For each moth Mi, a probability Ppso = 0.3 is employed to determine whether the particle swarm optimization (PSO) update rule is applied in a given iteration, as opposed to the original Multi-Objective Moth-Flame Optimization (MFO) update rule. This probability ensures that 70% of the updates maintain the dynamic spiral search characteristic of the MFO algorithm, while 30% incorporate PSO updates to enhance diversity and mitigate the risk of entrapment in local optima. The selection of Ppso = 0.3 is informed by empirical data, preliminary experiments, and recommendations in the literature regarding probabilistic parameters for hybrid heuristic algorithms [32].
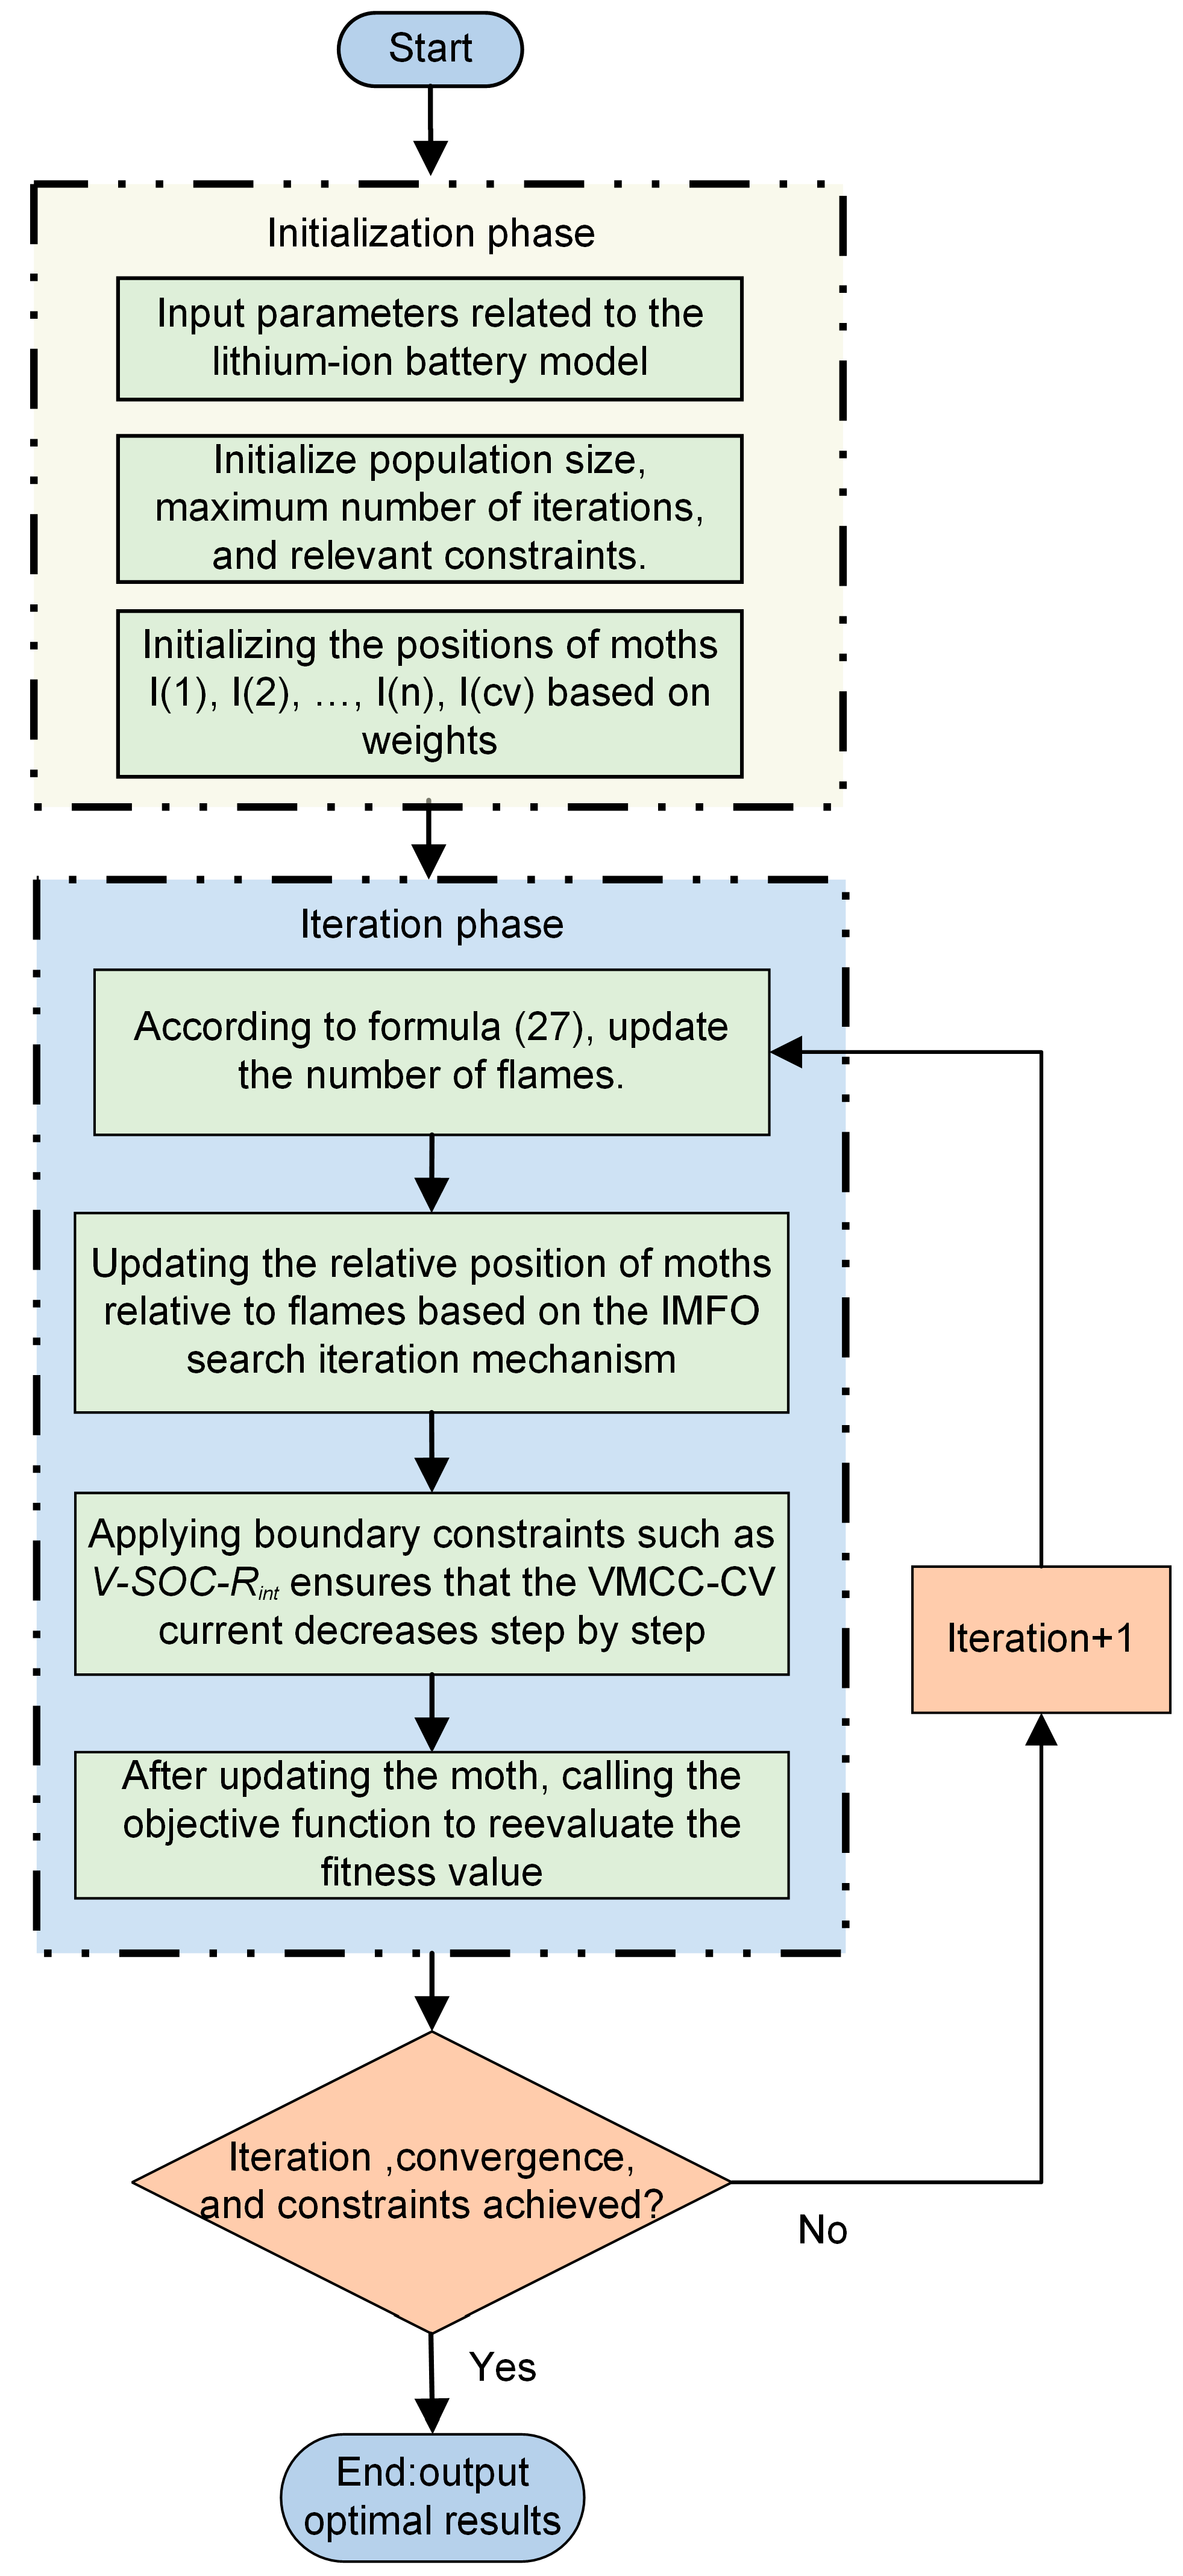
In this study, the Improved Moth-Flame Optimization (IMFO) algorithm is employed to implement the VMCC-CV charging current while optimizing the charging process for multiple objectives. By adjusting various combinations of weights corresponding to different charging scenarios, an optimal set of solutions is derived. The resulting output is a current sequence for the VMCC-CV charging strategy. The implementation steps of the algorithm are illustrated in Figure 10.

4. Results and Discussion

4.1. Improved MFO Algorithm Charging Strategy Validation

To validate the superiority of the IMFO algorithm, it was evaluated using three widely recognized multi-objective test functions: DTLZ1, DTLZ2, and DTLZ3. Detailed descriptions of these test functions and their reference Pareto frontiers can be found in reference [33]. These test functions are now integrated with the physical constraints outlined in Table 2 through mathematical mapping, enabling the simulation of linear trade-offs, non-convex optimization challenges, and multimodal complexities encountered during the charging optimization of lithium batteries. Particularly, the linear Pareto frontier of DTLZ1, characterized by the condition f1 + f2 + f3 = 0.5, is mapped as follows:
f 1 = 1 2 x 1 x 2 ( 1 + g ( x M ) )
f 2 = 1 2 x 1 ( 1 x 2 ) ( 1 + g ( x M ) )
f 3 = 1 2 ( 1 x 1 ) ( 1 + g ( x M ) )
In the equations, f1 is mapped to optimize the charging time Jt; f2 is mapped to optimize the state of health JSOH; f3 is mapped to optimize the energy loss JE. Regarding the number of decision variables n in the DTLZ test functions, the decision vector is defined as x = (x1, x2, …, xn). In both practical implementations and the literature, n is typically set as n = M + k − 1, where M represents the number of optimization objectives. In this study, the optimization objectives are charging time, SOH, and energy loss, thus M = 3. The parameter k is adjusted based on the characteristics of the respective test functions, reflecting the complexity of each. To simulate the linear voltage–current relationship in the low SOC range [10–50%], k is set to 5, representing an appropriate level of function complexity. The auxiliary function is defined as follows:
g ( x M ) = 100 k + x i x M ( x i 0.5 ) 2 cos ( 20 π ( x i 0.5 ) )
where g(xM) serves to introduce local complexity, facilitating the simulation of current step adjustments within the low SOC range, with xM comprising the final five decision variables. Meanwhile, x1 and x2 respectively denote the time weighting factor and the priority assigned to the SOC.
DTLZ2 presents a non-convex spherical Pareto frontier defined by the relationship f12 + f22 + f32 = 1, and its objective functions are mapped as follows:
f 1 ( x ) = ( 1 + g ( x M ) ) cos π 2 x 1 cos π 2 x 2
f 2 ( x ) = ( 1 + g ( x M ) ) cos π 2 x 1 sin π 2 x 2
f 3 ( x ) = ( 1 + g ( x M ) ) sin π 2 x 1
The mapping relationships for f1, f2 and f3 are consistent with those of the DTLZ1 test function, and the auxiliary function is defined as follows:
g ( x M ) = x i x M ( x i 0.5 ) 2
where g(xM) introduces non-convexity, and this mapping simulates the nonlinear trade-offs within the high SOC range [50–90%], with xM consisting of the final nine decision variables.
DTLZ3 adopts the target function structure as outlined in Formulas (41)–(43) from DTLZ2, while its auxiliary function is formulated based on the structure presented in Formula (40) from DTLZ1. Where g(xₘ) introduces an aperiodic disturbance, reflecting the multi-stage current adjustment when the V-SOC-Rintmechanism is triggered.
Based on the above test functions introduced into the battery optimal charging theory, this study verifies the superiority of the tested IMFO algorithm over MFO, Multi-objective particle swarm optimization (MOPSO) algorithm [34], Non-dominated Sorting Genetic Algorithm II (NSGA-II) [35], Genetic Algorithm (GA) [36], and Differential Evolution (DE) algorithm [37] in terms of algorithmic solution performance and battery charging performance. The design process is as follows: the number of objectives M = 3; the number of decision variables is n = 7, k = 5 (for DTLZ1), and n = 12, k = 10 (for DTLZ2 and DTLZ3); the population size is 100; the maximum number of iterations is 100; and the average value is calculated from 10 independent runs. The time weight wt is set to 0.9, corresponding to the algorithm’s charging strategy. Frontier points (FP), standard deviation of spacing (SP), and iteration convergence number (ICN) are used as evaluation criteria. These criteria can quantitatively assess the diversity, uniformity, and convergence of the Pareto solutions obtained by the algorithms, respectively. The Charging Time Improvement percentage (CTI), SOH Degradation Improvement percentage (SDI), and Energy Loss Improvement percentage (ELI) are adopted to evaluate the charging performance of different algorithms. Here, the “improvement” is defined relative to the algorithm with the worst performance (e.g., the GA).
As presented in Table 3, the IMFO algorithm outperforms the MFO, MOPSO, NSGA-II, GA, and DE in performance, as evaluated by the DTLZ1, DTLZ2, and DTLZ3 test functions. Owing to its integration of PSO acceleration factors and an improved dynamic spiral search, IMFO achieves superior solution diversity, distribution, and convergence across diverse optimization scenarios. Furthermore, in the evaluated battery charging scenarios, the IMFO strategy demonstrates enhanced performance in optimizing key objectives, including charging time, SOH degradation, and Energy loss.
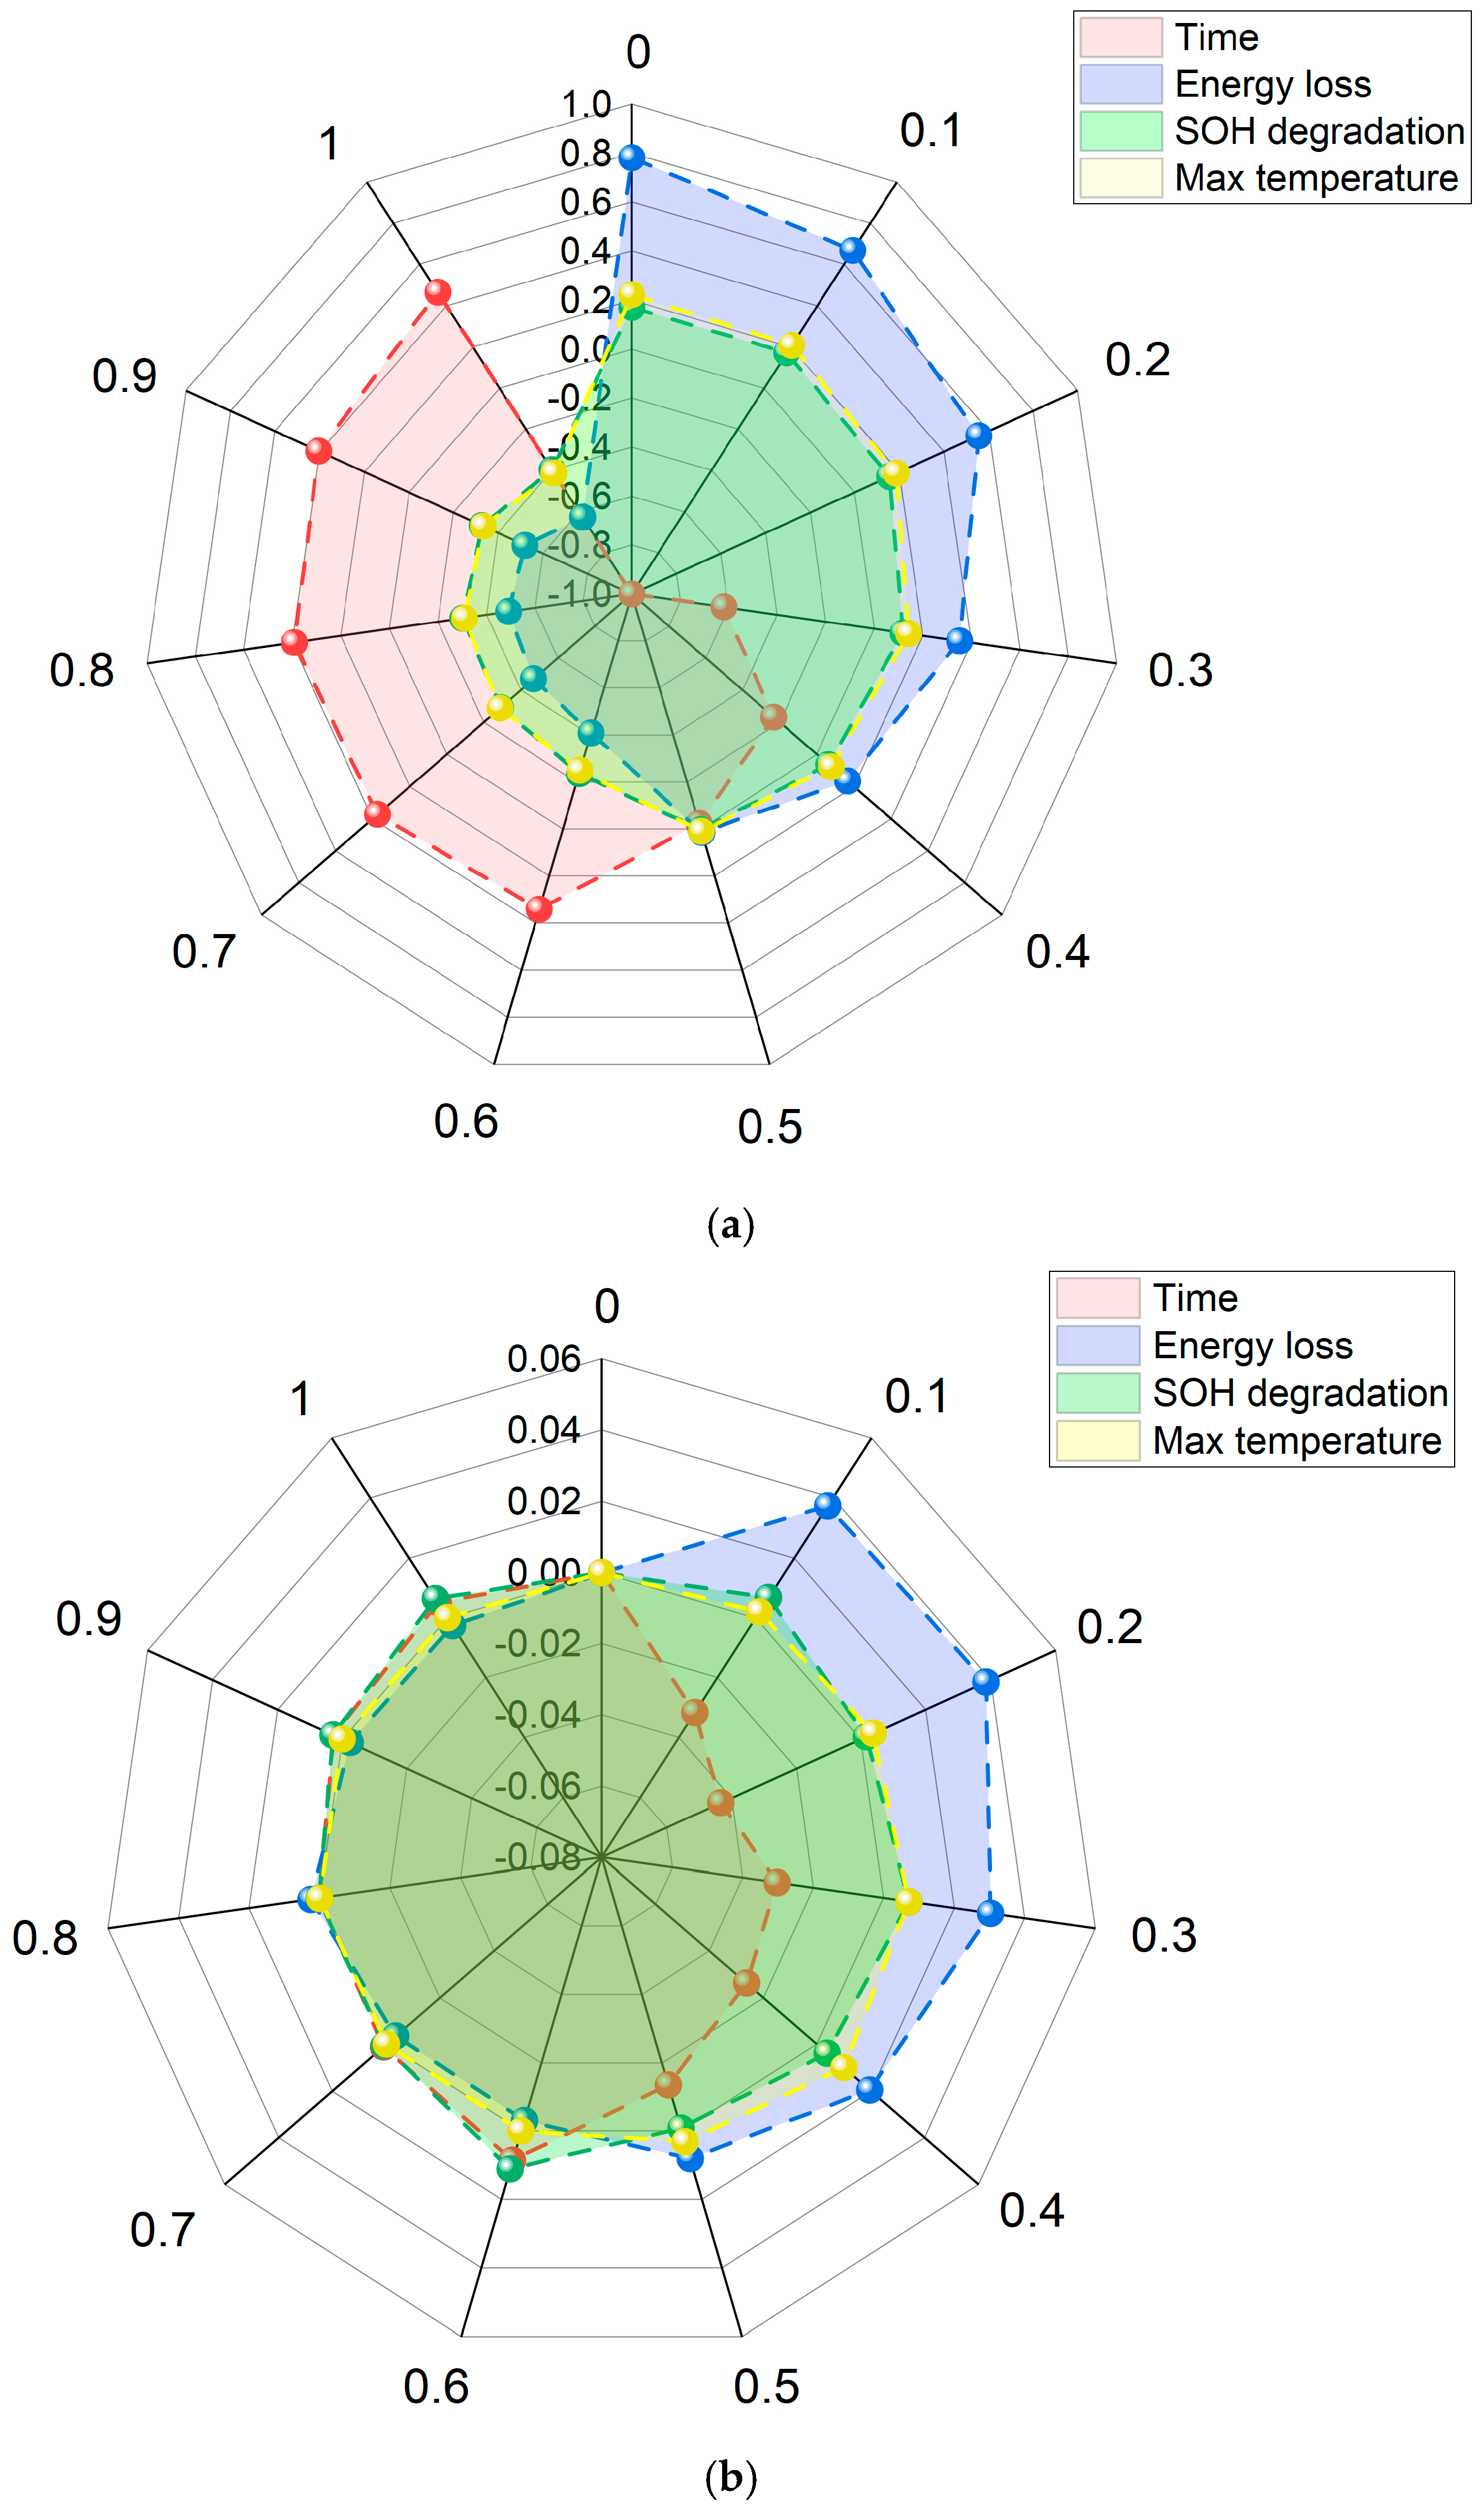
Ref. [27] applied the MFO algorithm to optimize multi-stage constant current charging but did not account for practical application scenarios. To validate the reliability of the Improved MFO (IMFO) charging strategy under various weightings corresponding to different application scenarios, it is compared with the conventional 1C-CCCV and MFO charging strategies. Table 4 and Figure 11 present their parameters and performance metrics, respectively. The evaluation criteria for the charging strategies are defined in the following equations:
β ( w t , t ) = t C C C V t w t t C C C V
β ( w t , E ) = E C C C V E w t E C C C V
β ( w t , S ) = S C C C V S w t S C C C V
β ( w t , T ) = T C C C V T w t T C C C V
where tCCCV, ECCCV, SCCCV, and TCCCV represent the charging time, energy loss, SOH degradation, and maximum temperature rise at the end of charging for the traditional 1C-CCCV charging method, respectively. twt, Ewt, Swt, and Twt represent the charging time, energy loss, SOH degradation, and maximum temperature rise for the improved MFO charging strategy under different time weights wt, respectively. Similarly, twt, Ewt, Swt, and Twt represent the charging time, energy loss, SOH degradation, and maximum temperature rise in the MFO charging optimization strategy corresponding to different wt values. When β > 0 or β′ > 0, it indicates that the IMFO charging strategy outperforms the traditional 1C-CCCV and the MFO charging strategy.
As depicted in Figure 11a, compared with the conventional 1C-CCCV charging strategy, the charging strategy derived from the IMFO algorithm, when the time weight wt ranges from 0 to 0.5, enhances battery safety and service life more effectively. Under this weighting scenario, the strategy reduces energy loss, SOH degradation, and the maximum surface temperature of the battery, albeit at the cost of extended charging time. Conversely, when wt ranges from 0.6 to 1, the strategy accelerates charging speed but exacerbates battery aging and thermal conditions. As shown in Figure 11b, compared with the MFO charging strategy, the IMFO algorithm achieves further improvements in scenarios where higher weights prioritize charging speed and lower weights ensure safe battery operation. These results demonstrate that the IMFO-based charging strategy adapts more flexibly to varying weight configurations than the MFO strategy and avoids premature convergence to suboptimal solutions due to prioritization issues in weight sorting. Based on this validation, this study adopts the IMFO algorithm as the preferred method for charging optimization, enabling the development of charging strategies tailored to diverse application scenarios.

4.2. Charging Optimization Strategies for Three Charging Scenarios

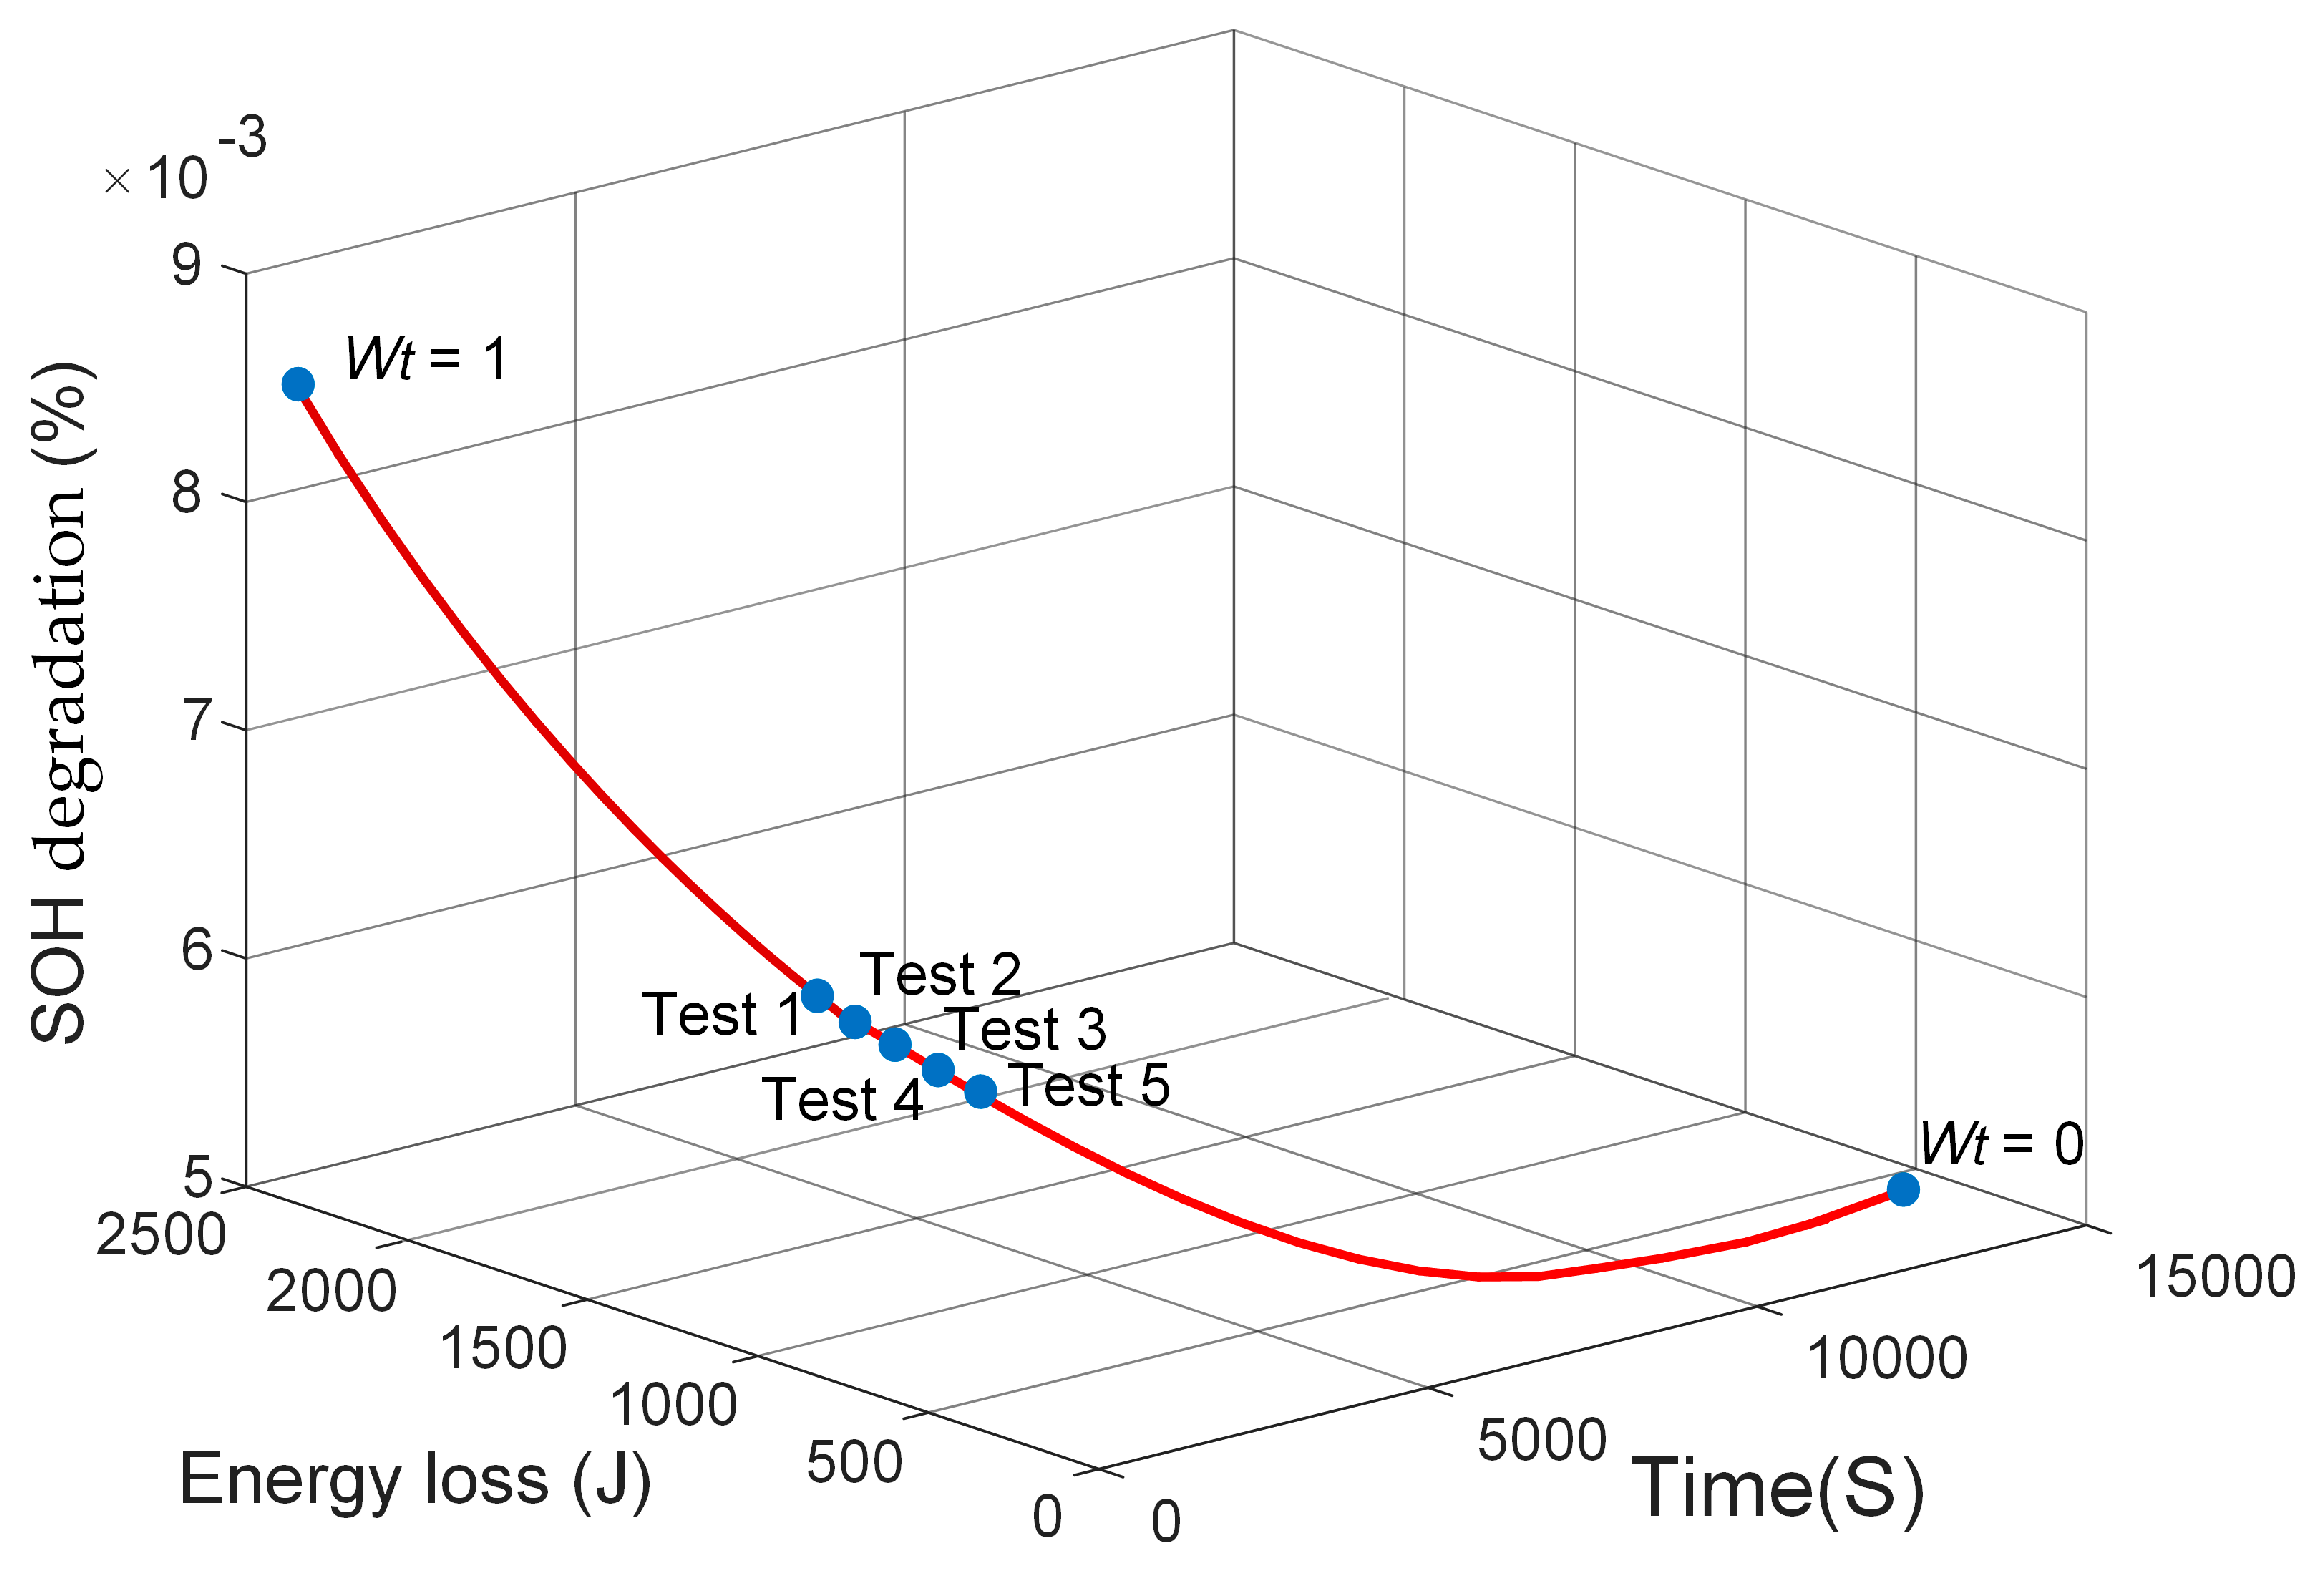
Based on the weighting coefficient combinations of the IMFO algorithm, the Pareto frontier for charging time, SOH degradation, and energy loss is presented in Figure 12. For three practical charging application scenarios, values derived from the Pareto frontier were used to formulate three corresponding charging strategies.

4.2.1. Rapid Charging Strategy

In emergency charging scenarios for electric vehicles or during periods of peak electricity demand, rapid charging is critical to meet urgent power requirements. In this study, the time weight wt is set to 1, indicating that the charging optimization process prioritizes minimizing charging time exclusively, without considering battery SOH or energy loss. Using the rapid charging strategy optimized by the IMFO algorithm, a charging time of 1602 s is achieved, accompanied by a maximum surface temperature rise of 45.9 °C.
As illustrated in Figure 13, the VMCC charging method is employed within the initial battery SOC range to accelerate charging speed. When the SOC begins to increase more slowly from 71%, and the Rint rises sharply at approximately 76% SOC, the charging strategy transitions to CV mode until the target SOC is attained. This charging process adheres to the V-SOC-Rint conversion mechanism.
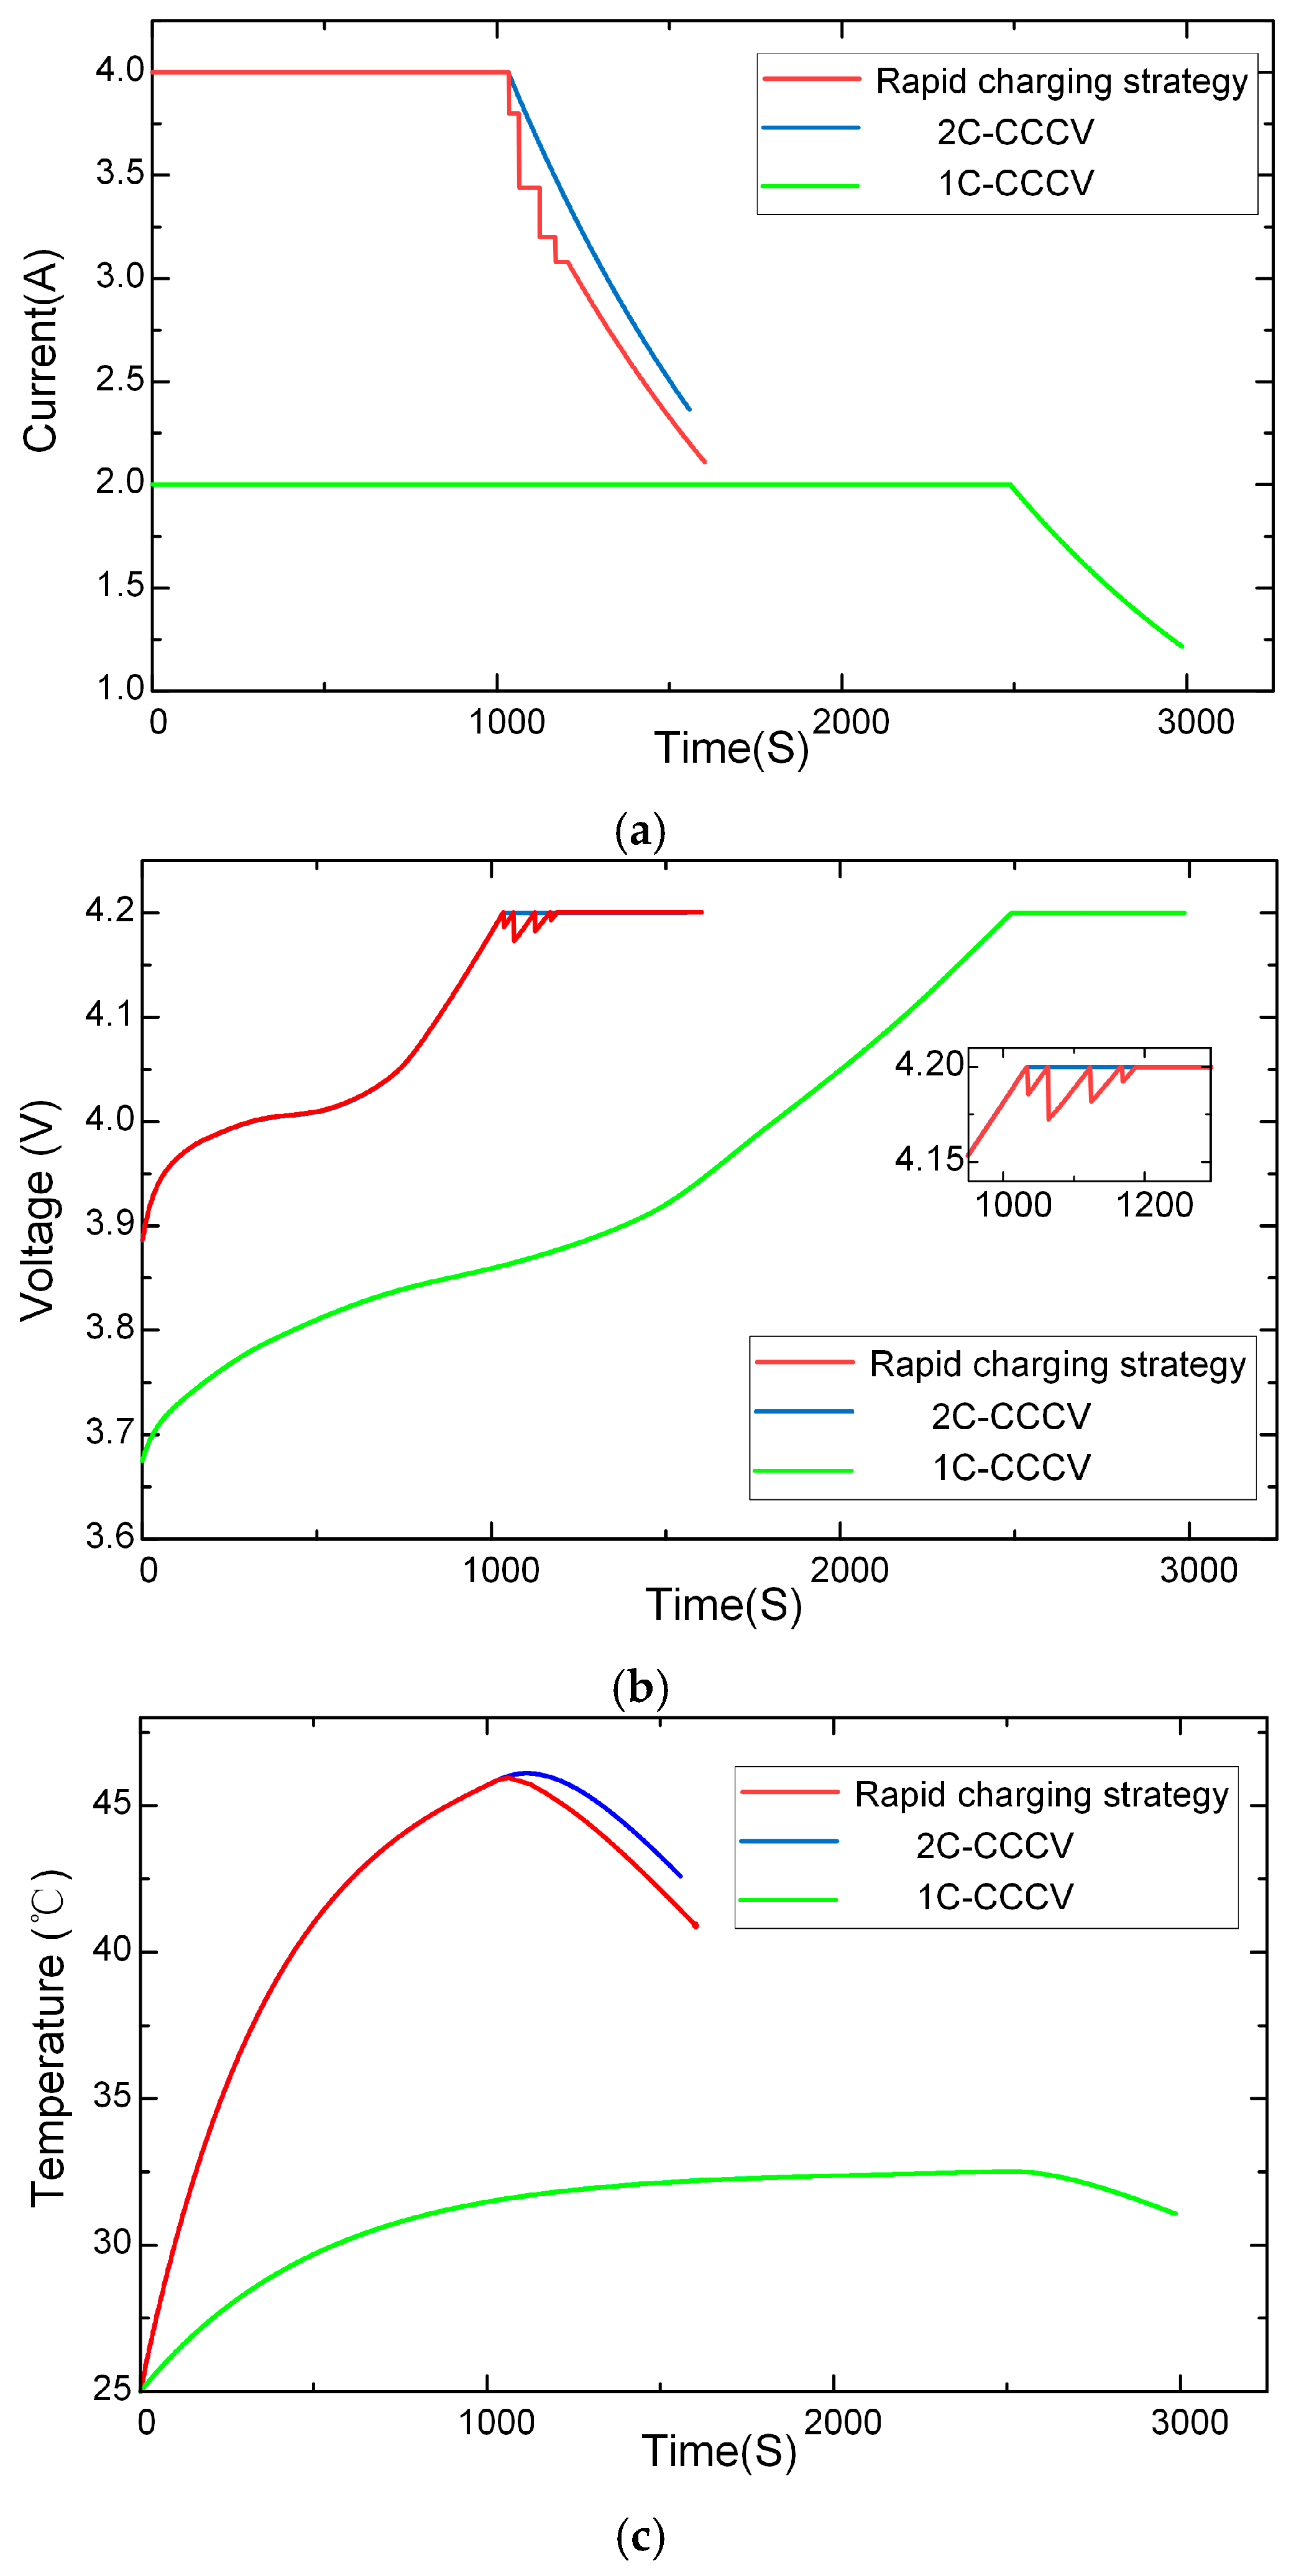
To evaluate the feasibility of the proposed rapid charging strategy, it was compared with the conventional 2C-CCCV and 1C-CCCV charging methods. As illustrated in Figure 14, the rapid charging strategy is marginally slower than the 2C-CCCV method, with a charging time difference of less than one minute, indicating comparable charging speeds. This similarity arises because both methods employ a maximum current of 2 C at the onset of charging to accelerate the process. However, after reaching the cutoff voltage, the proposed strategy transitions to lower current levels multiple times, resulting in a reduced average current. This gradual current reduction slightly extends the charging time, though the impact is minimal. In the later stages of charging, the V-SOC-Rint current-switching mechanism introduced in this study reduces the current when the Rint approaches a rapid increase, and the subsequent CV mode further mitigates battery heating, lowering the final temperature by 2 °C. Additionally, compared with the 1C-CCCV method, the rapid charging strategy reduces charging time by 46.33%, significantly enhancing charging efficiency. Although higher currents increase battery heating, with a maximum temperature rise of approximately 14 °C, the strategy remains within the battery’s temperature constraints. In conclusion, the proposed rapid charging strategy offers a viable solution for accelerating charging speed in electric vehicle applications.

4.2.2. Multi-Objective Balanced Charging Strategy

In routine scenarios, such as electric vehicle charging at highway service areas, shopping malls, and similar locations, the objective is to accelerate charging speed while minimizing adverse effects on battery lifespan and energy loss. This necessitates balancing charging speed with SOH degradation and energy utilization efficiency. Theoretically, setting the time weight wt within the range of 0.5 to 0.6 can effectively balance these three charging objectives. Consequently, this study selected five sets of weight coefficients from the Pareto frontier generated by the IMFO algorithm for comparative experiments. The weight coefficients for these five test charging strategies are presented in Table 5.
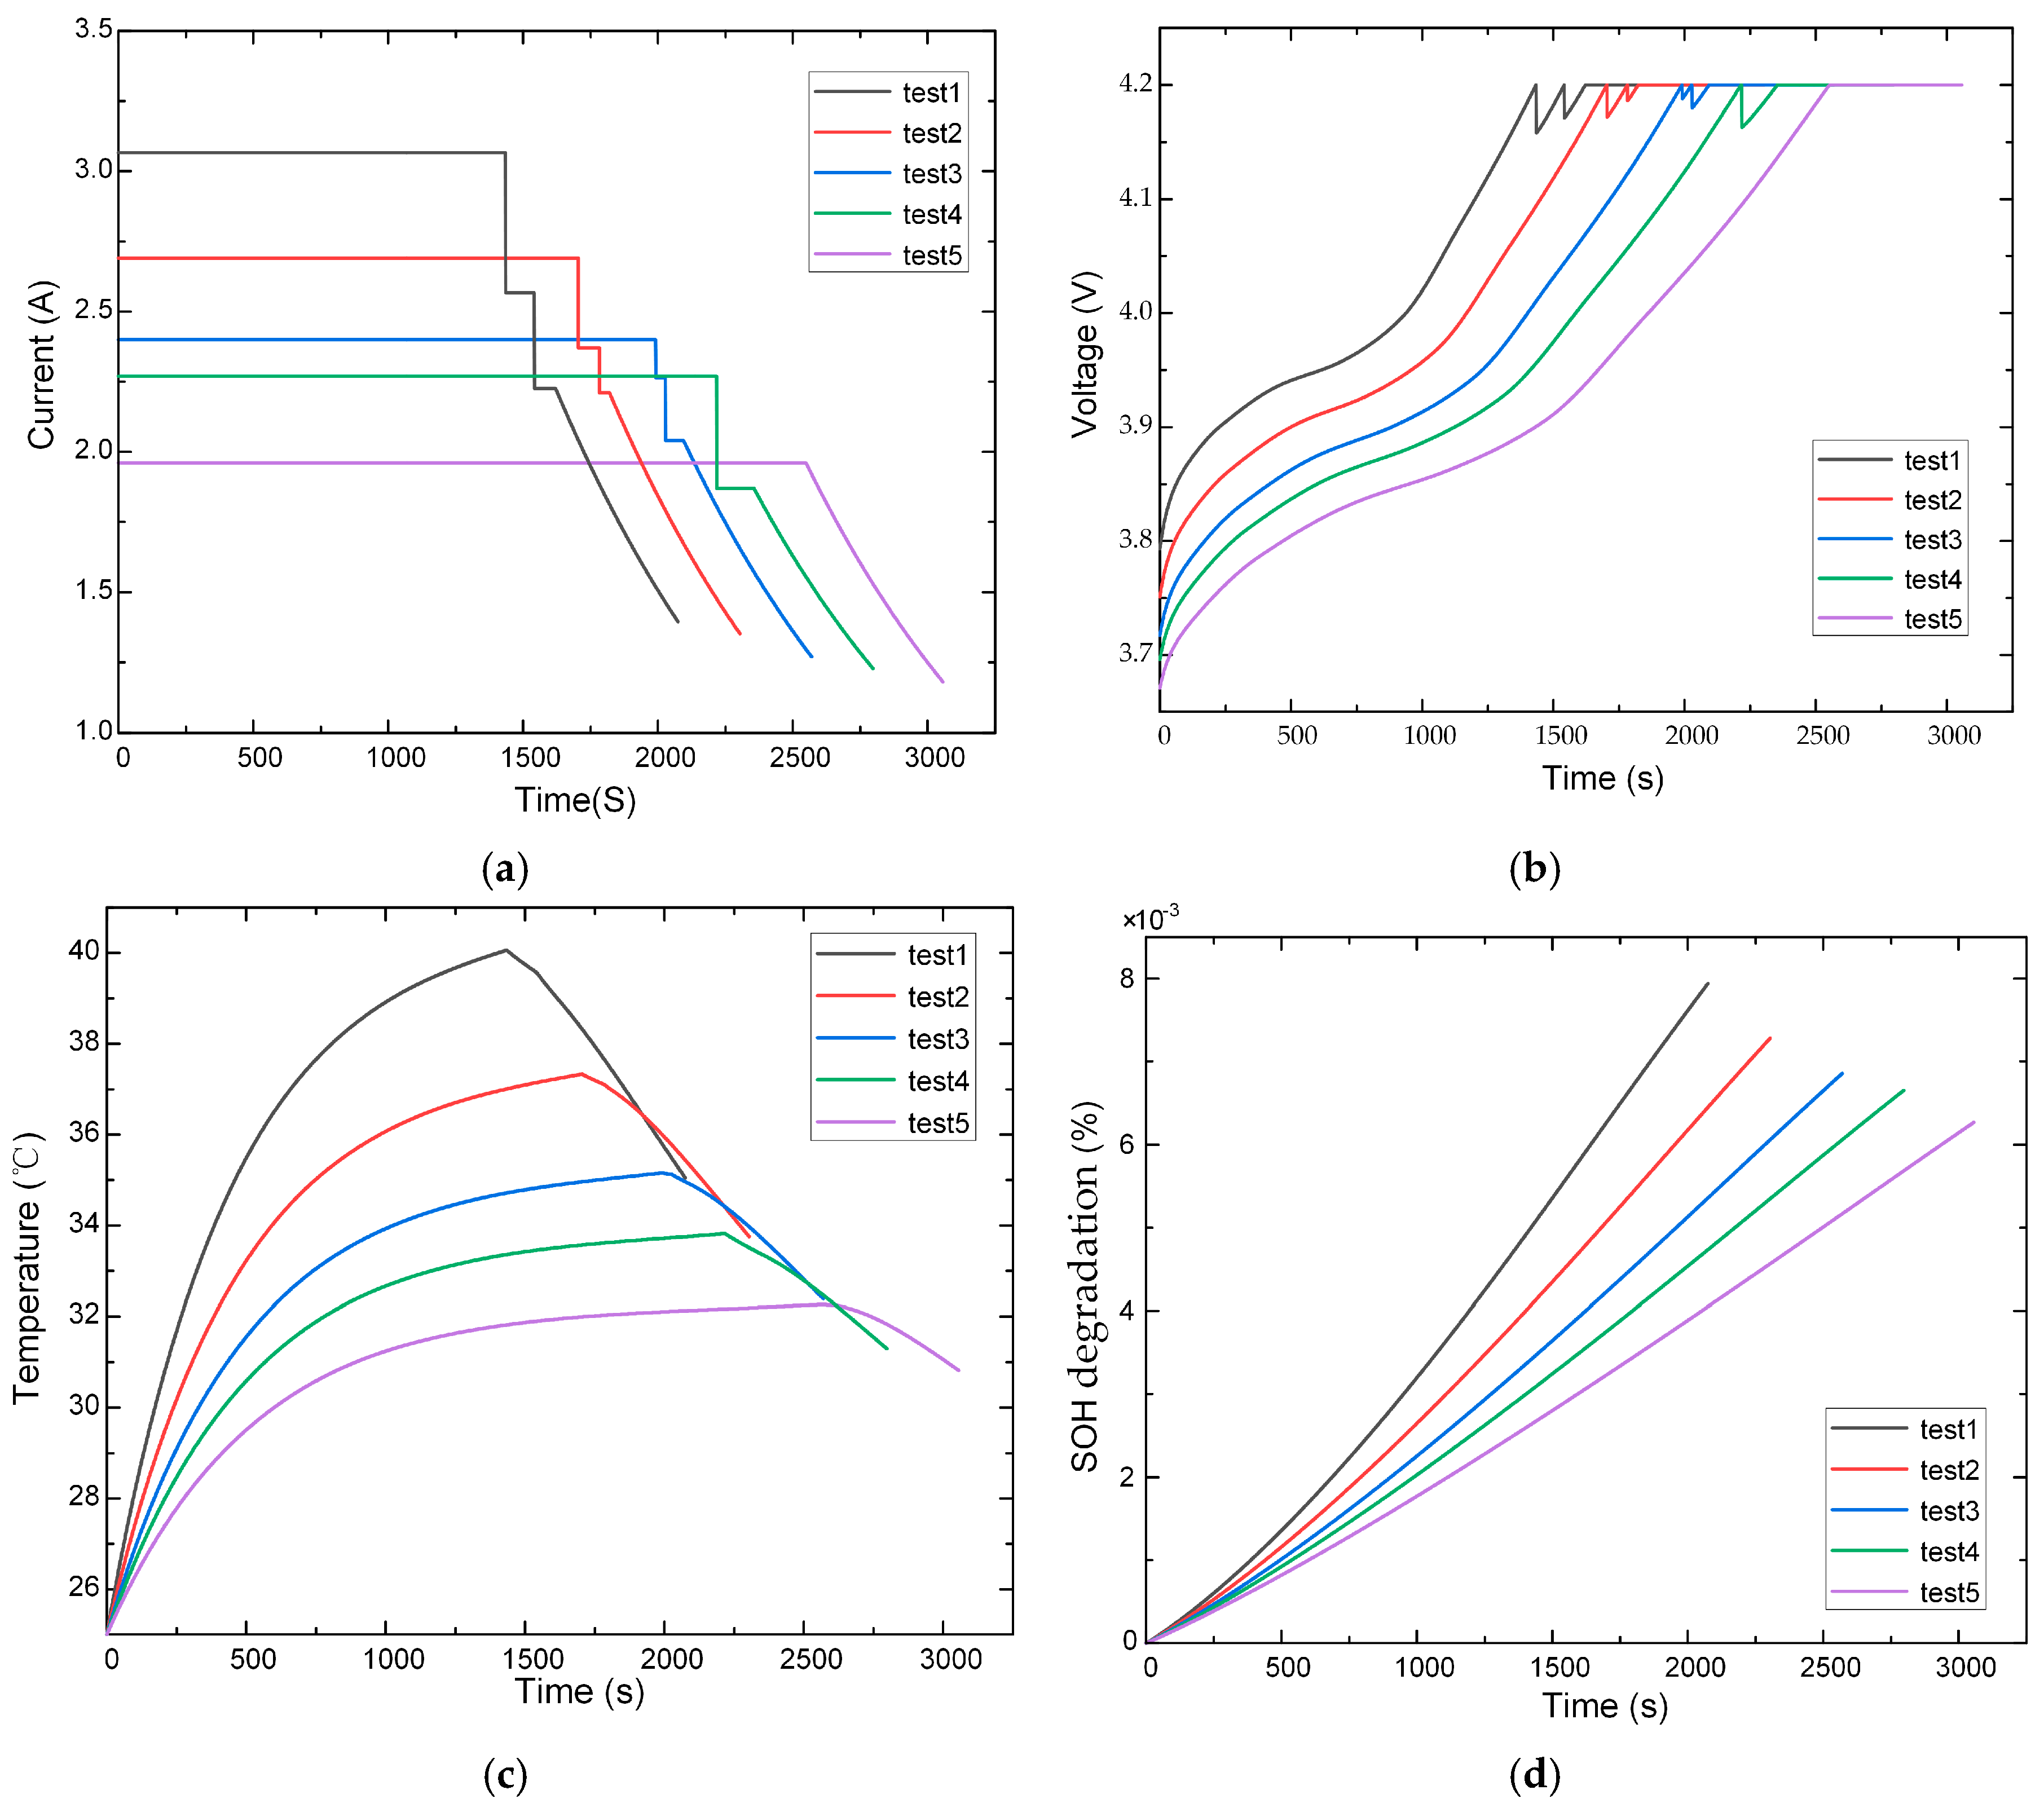
The performance comparison of the IMFO -optimized charging strategy across five test groups is presented in Figure 15. Among these, Test 1, with the highest time weighting, employs the highest charging current, achieving the shortest charging time of 2074 s. However, this results in significant SOH degradation and energy loss, at 0.007942% and 1882 J, respectively. Conversely, Test 5, with the lowest charging current, minimizes SOH degradation and energy loss, at 0.006269% and 1357 J, respectively, thereby enhancing battery cycle life and operational efficiency. However, Test 5 exhibits the slowest charging speed, with a charging time of 3056 s. Based on this analysis, this study selects Test 3 as the multi-objective balanced charging strategy, as it effectively accelerates charging speed while mitigating adverse effects on SOH degradation and energy loss, achieving an optimal balance and aligning with the balanced charging concept proposed in this study. Notably, as illustrated in Figure 15a, the number of constant current stages decreases from Test 1 to Test 5, with Test 5 employing only one constant current stage, equivalent to the CC-CV charging mode. This behavior is attributed to the V-SOC-Rint mechanism and weight theory discussed in Section 3. As the time weight wt decreases, the charging current is reduced, extending the time required to reach the cutoff voltage and resulting in higher SOC and Rint values. This facilitates compliance with the V-SOC- Rint mechanism’s requirements. Consequently, under the algorithm’s control, the number of constant current stages is reduced, demonstrating the flexibility of the charging strategy.
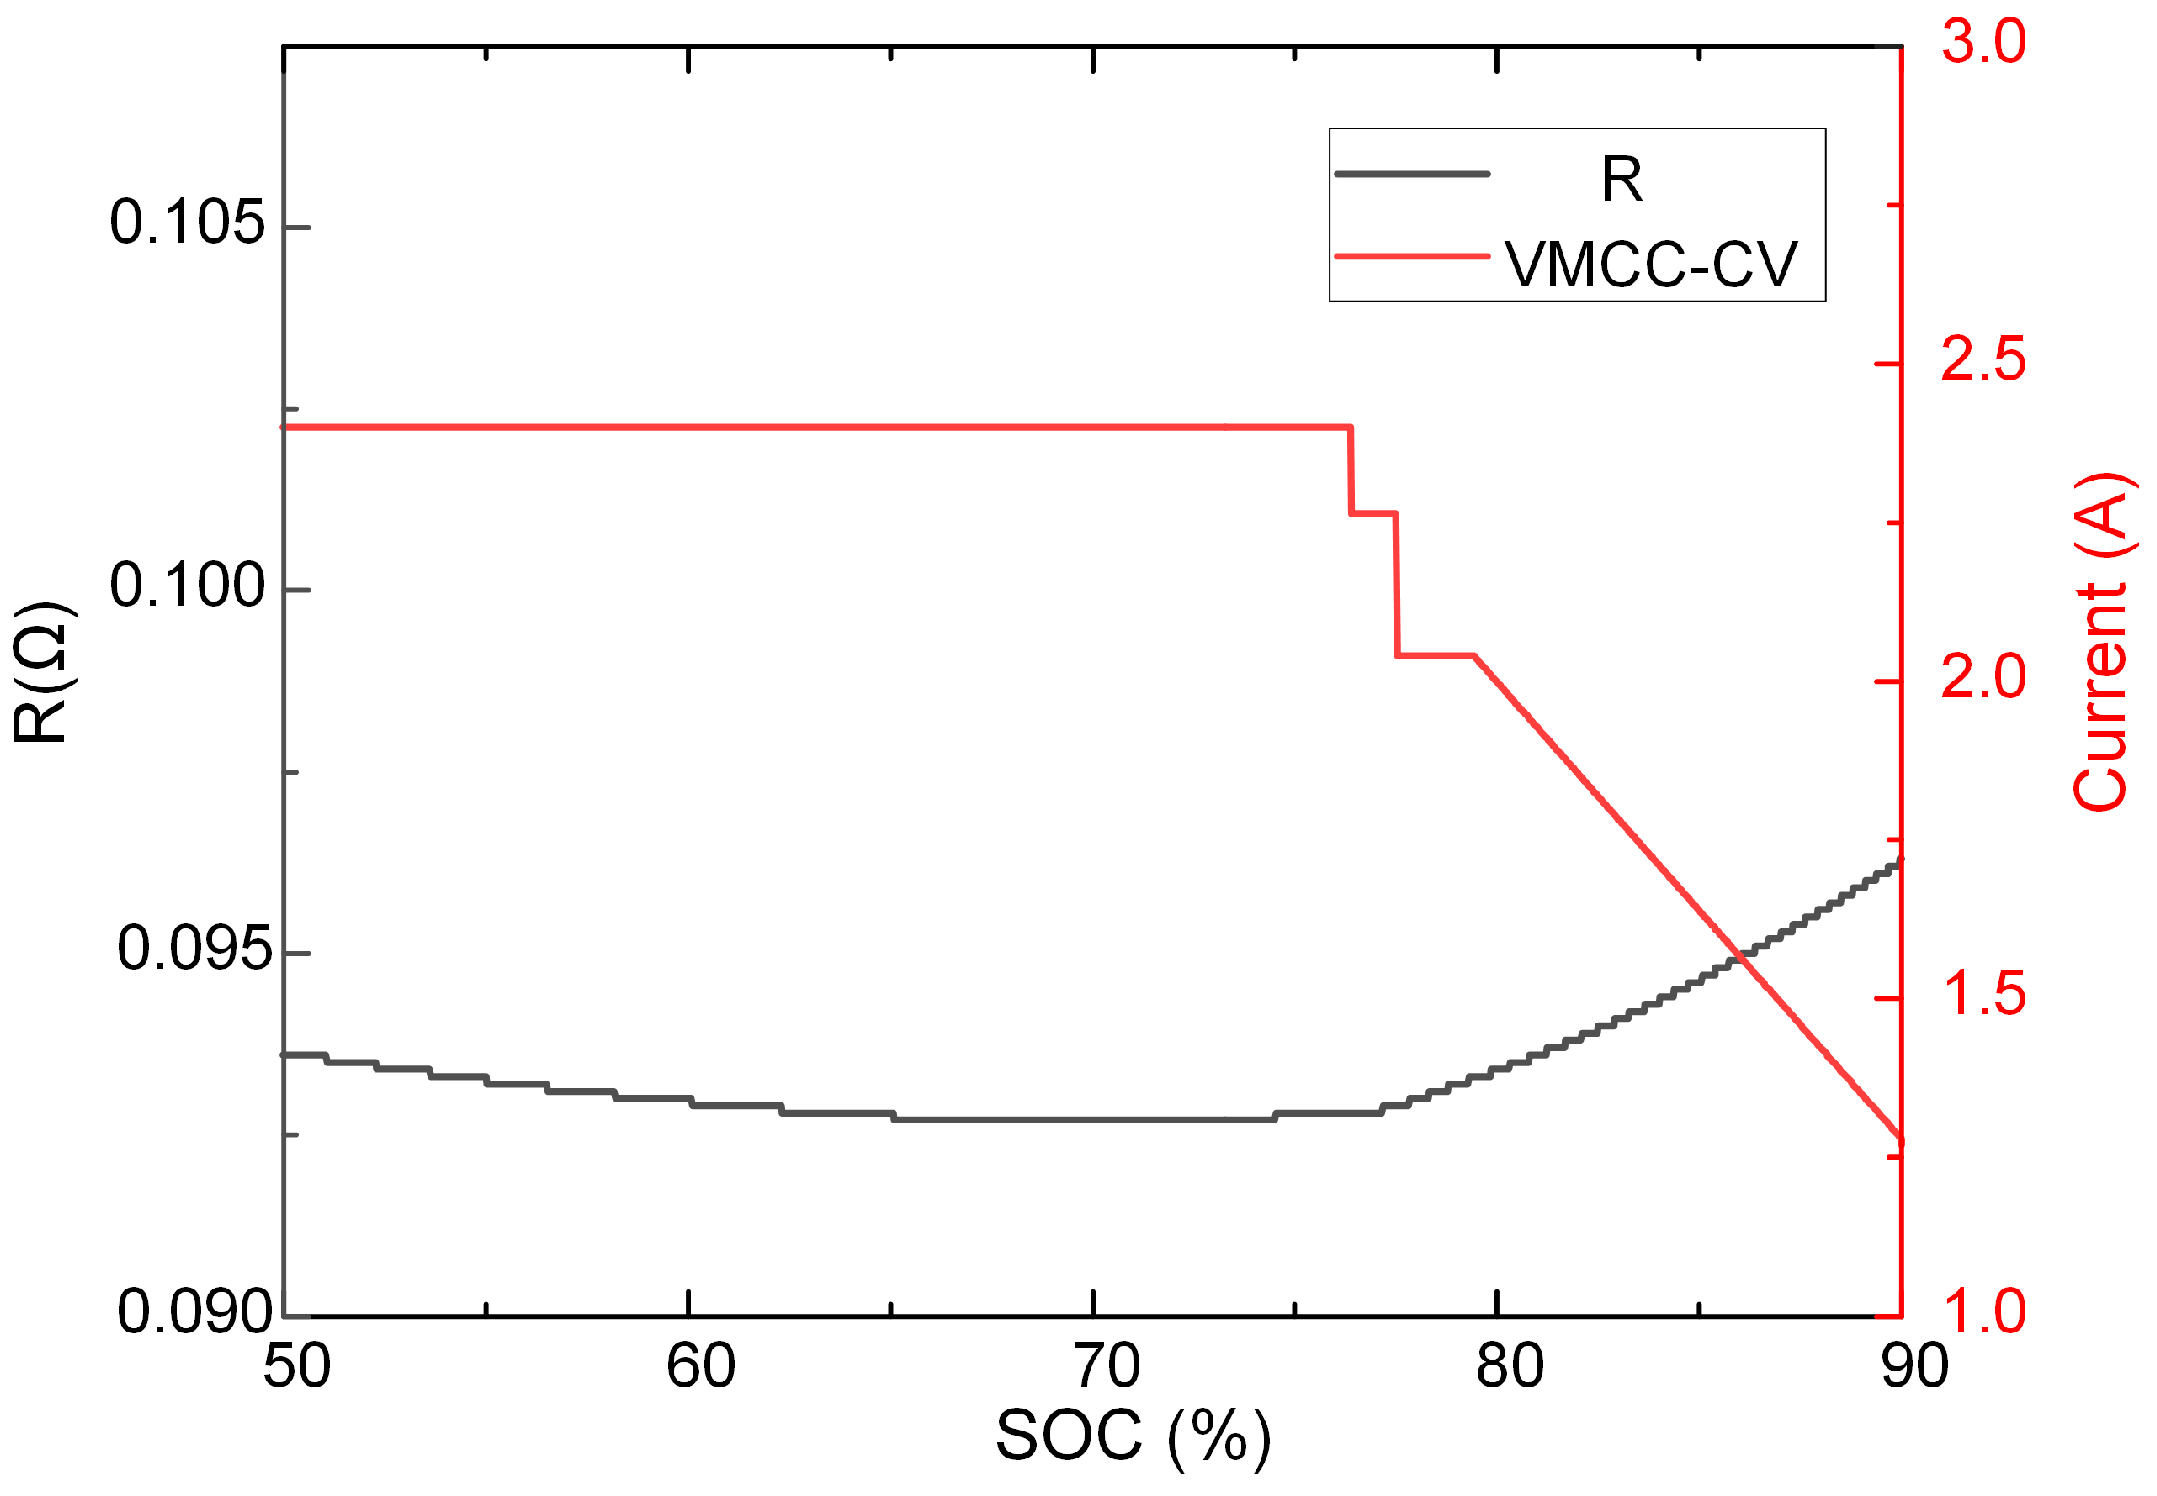
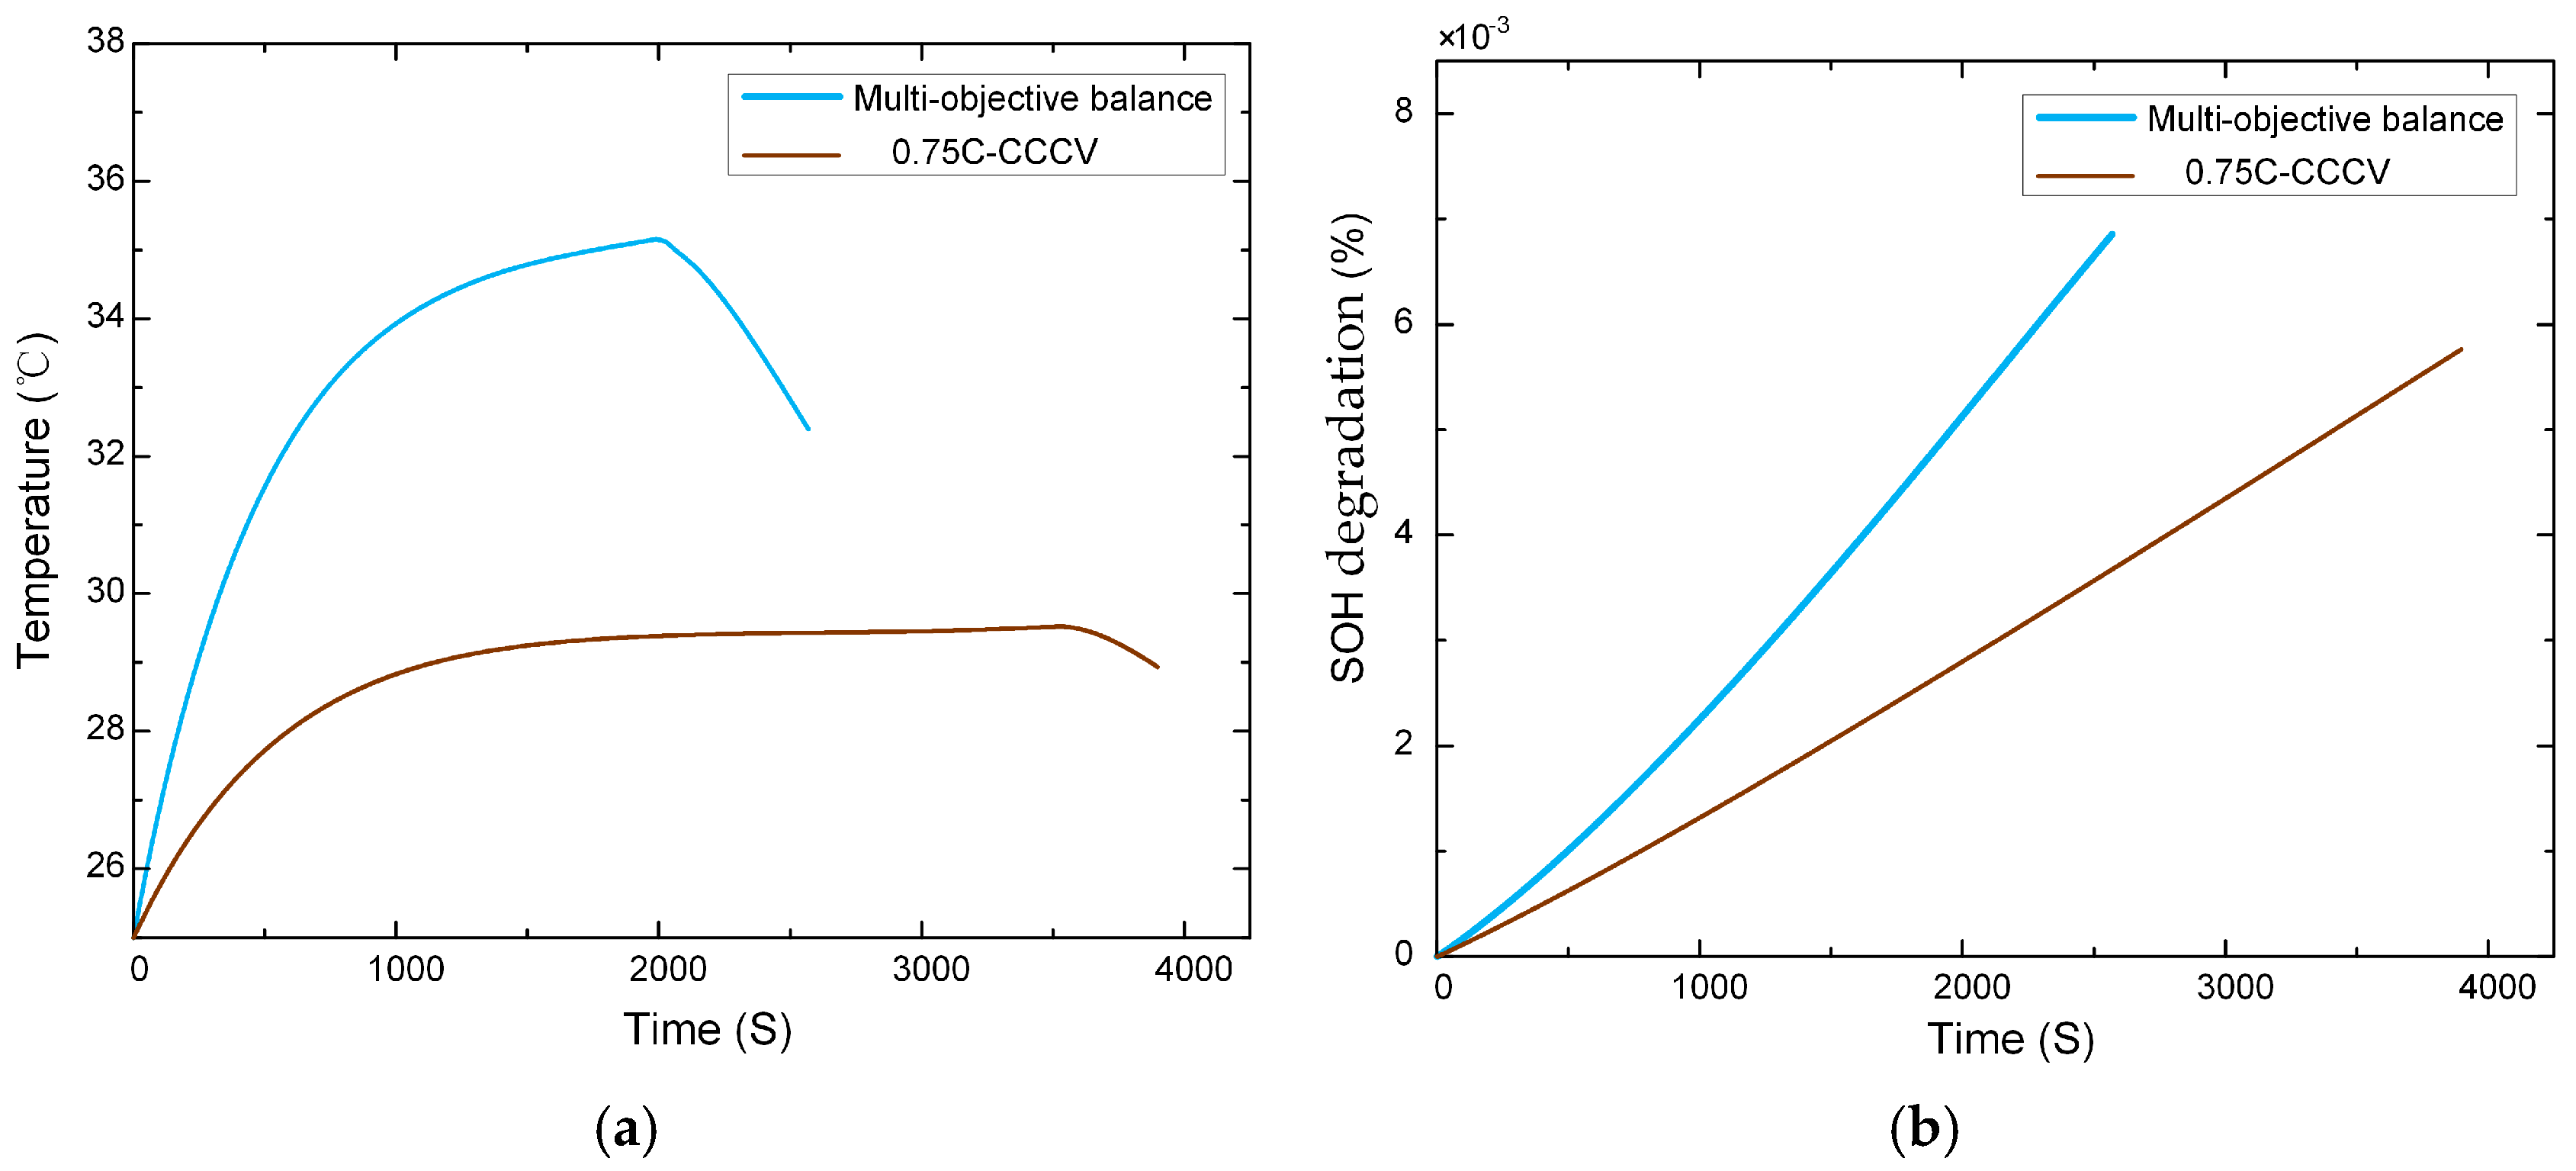
As depicted in Figure 16, the multi-objective balanced charging strategy transitions from VMCC to CV charging mode when the SOC reaches approximately 79%, consistent with the V-SOC-Rint mechanism. To evaluate the applicability of the proposed balanced charging strategy, it was compared with the 0.75C-CCCV charging method recommended by the battery manufacturer. The comparison results are presented in Figure 17. As the charging current of the balanced charging strategy exceeds that of the 0.75C-CCCV method for most of the charging duration, it achieves a shorter charging time of 2569 s, representing a 34.11% reduction compared with the 0.75C-CCCV method, thus significantly enhancing charging efficiency. The balanced charging strategy incurs an energy loss of 1575 J, with an energy utilization efficiency of 93.54%, which is only 1.95% lower than that of the 0.75C-CCCV method. Consequently, the temperature rise due to energy loss is minimal, increasing by only 5.6 °C. Furthermore, the balanced charging strategy results in a battery SOH degradation of 0.006856%, slightly higher than that of the 0.75C-CCCV method, but with negligible impact on cycle life. In conclusion, the proposed multi-objective balanced charging strategy significantly improves charging speed, preserves battery lifespan with minimal temperature rise, and achieves a total charging time of approximately 43 min, making it well-suited for routine charging scenarios.

4.2.3. Enhanced Safety Performance Charging Strategy

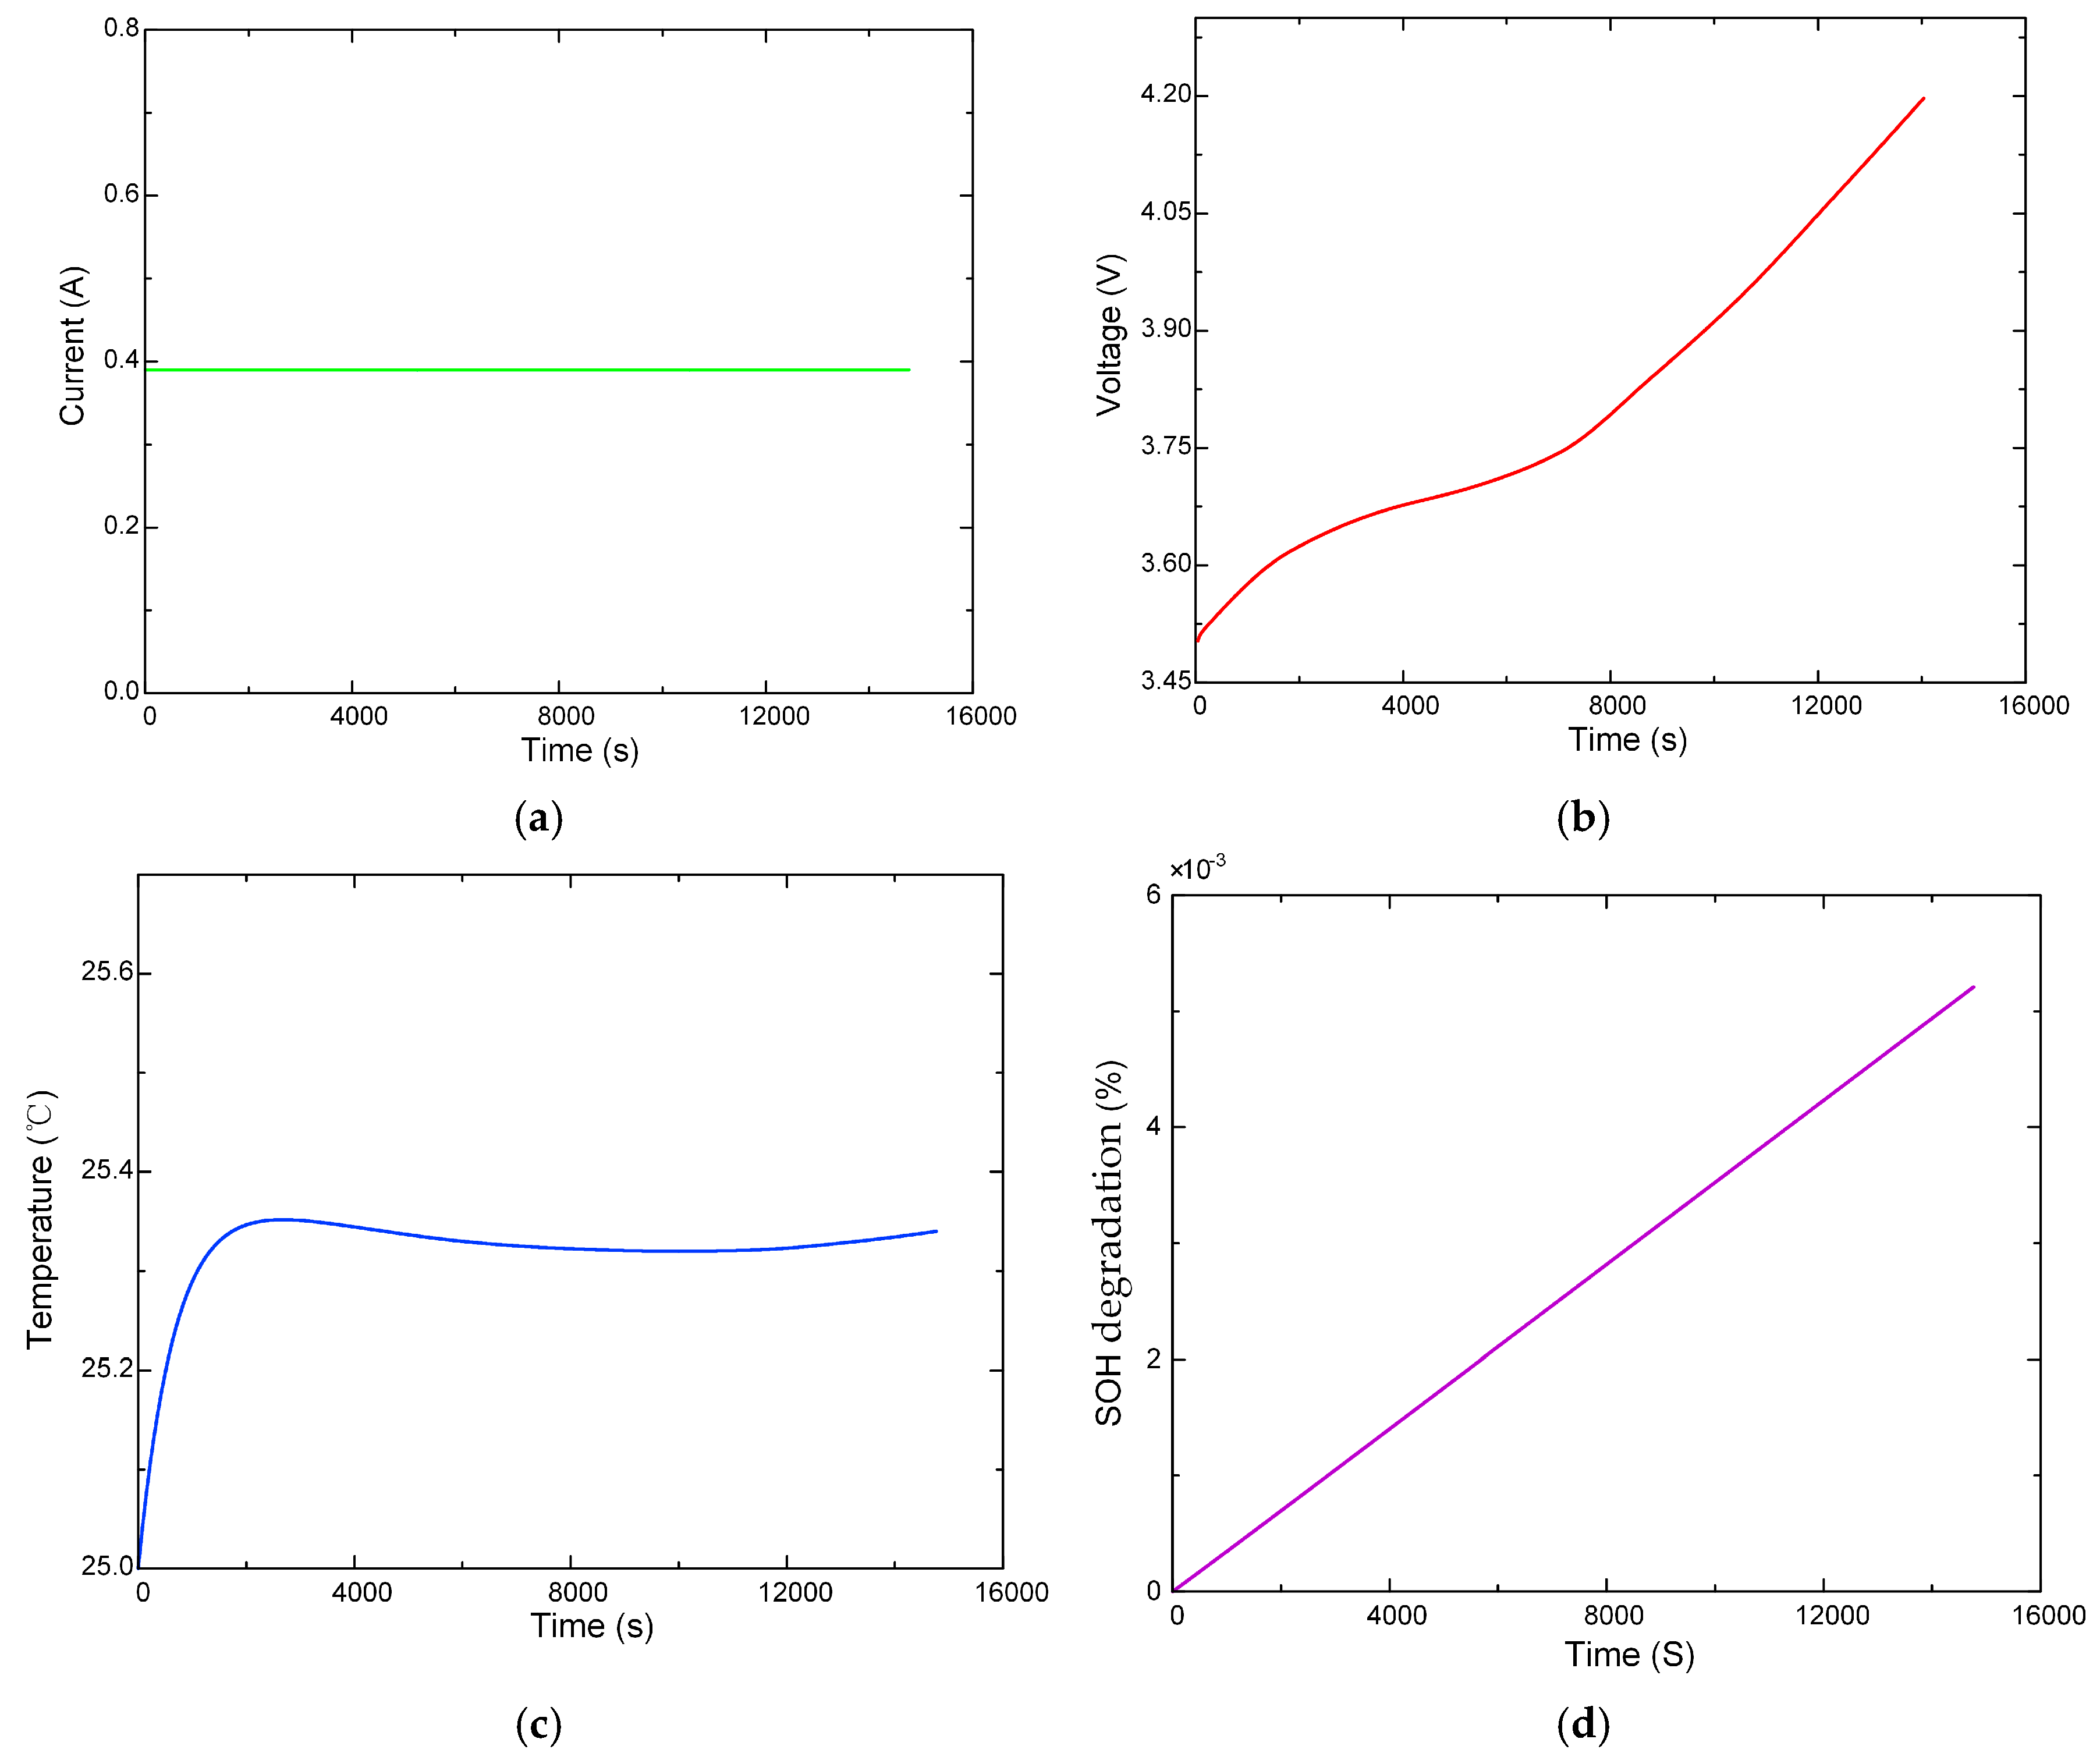
In nighttime charging scenarios, where immediate resumption of device operation is not required, the primary objective is to minimize battery energy loss and SOH degradation to enhance battery safety performance. In such scenarios, high current is unnecessary for accelerating charging speed. Theoretically, the time weight wt can be set within the range of 0 to 0.1, prioritizing SOH degradation and energy loss minimization over charging speed. In this study, with wt set to 0 and both ws and wE set to 0.5, the charging strategy optimizes safety performance. Based on the V-SOC-Rint mechanism and the requirements of the application scenario, the resulting charging current is minimal, reaching the cutoff voltage only when the battery is fully charged, thus eliminating the need for current grading or mode switching. Consequently, the optimized current derived from the IMFO algorithm is a constant current maintained at a relatively low level.
The charging performance of the proposed strategy is presented in Figure 18. By employing a low charging current, the strategy results in minimal energy loss of 301 J, representing an 86.88% improvement compared with the 2C-CCCV strategy. Consequently, the heat generated from energy loss is negligible, with a temperature rise of only 0.3 °C, closely approximating ambient temperature. Furthermore, the strategy’s impact on battery SOH degradation is minimal, at 0.005221%. In conclusion, the proposed charging strategy significantly enhances the safe and long-term operation of the battery, demonstrating substantial potential for low-energy-consumption charging scenarios during nighttime.

4.2.4. Limitations and Discussion

The aging model employed in this study considers only the factors of current and temperature, which is suitable for early cycles. In the later stages of cycle life, as battery performance degrades, relevant parameters may undergo changes, leading to error accumulation—a factor not accounted for in this study. Due to the extended duration (1.5 to 2 years) required to test batteries from a healthy state to failure, full life-cycle testing was not conducted. Future research directions may include developing a full-cycle aging model for batteries that dynamically updates parameters based on the degree of degradation. Additionally, while this study assumes uniform temperature distribution in individual cells, battery packs may exhibit thermal gradient non-uniformities (local hotspots), leading to pack damage. Future work will consider refining the thermal model, such as incorporating finite element analysis to simulate battery pack-level effects, and optimizing the V-SOC-Rint mechanism to accommodate non-uniform conditions.

5. Conclusions

This study employs an improved moth-flame optimization (IMFO) algorithm to optimize charging currents in the VMCC-CV system, guided by voltage, state of charge (SOC), and internal resistance (Rint), achieving multi-objective optimization of charging time, lifespan degradation, and energy loss in lithium-ion battery charging. A multi-state coupling model delivers comprehensive battery state data for charging strategies, with its accuracy validated through experiments. To address MFO algorithm limitations, the IMFO enhances the spiral search mechanism and integrates particle swarm optimization diversity to improve global iterative search and avoid local optima. Experimental results confirm that the IMFO-based charging strategy outperforms the standard MFO algorithm across diverse charging conditions, demonstrating superior optimization performance.
The V-SOC-Rint constant current-constant voltage conversion mechanism proposed in this study significantly enhances charging speed while reducing battery heating. Utilizing the Pareto frontier generated by the IMFO algorithm, charging strategies for diverse scenarios are developed via frontier weighting. Results indicate that the proposed fast charging strategy matches the 2C-CCCV method in speed, with both substantially improving charging rates. However, the former mitigates battery heating, achieving faster temperature decline in later stages and a 2 °C reduction at the end of charging. The multi-objective balanced charging strategy optimizes charging time, energy loss, and SOH degradation, enabling rapid charging while minimizing efficiency loss and lifespan degradation. Compared to the 0.75C-CCCV mode recommended by battery manufacturers, it reduces charging time by 34.11%, limits temperature rise to 5.6 °C, and requires approximately 43 min, rendering it suitable for daily applications. For safety-oriented strategies, this approach markedly enhances battery health and curtails energy loss, maintaining temperatures near ambient levels. Relative to the 2C-CCCV mode, the safety-enhanced strategy diminishes energy loss by 86.88%, improves efficiency by 8.26%, and lowers temperature rise by 20.8 °C. Overall, the proposed strategy demonstrates superior performance across various application scenarios.
Due to the iterative population-based search mechanism of IMFO, its computational complexity is relatively high, posing challenges for real-time charging optimization on automotive-grade hardware. To address this, we propose using IMFO offline to precompute VMCC-CV charging current distributions for various temperatures, SOC levels, and resistance values, storing them in the BMS for real-time retrieval based on current conditions. In series/parallel battery packs, non-uniform thermal gradients and voltage imbalances may exacerbate lithium plating and uneven SOH degradation. In future research, we will incorporate adaptive current adjustment and active balancing into the VMCC-CV strategy to ensure safety and consistency. Furthermore, in practical battery applications, battery parameters change over time and cycles due to degradation. Therefore, we will investigate aging models that account for the full life cycle of batteries, simulating parameter variations at different degradation stages to optimize BMS charging control.

Author Contributions

Conceptualization, L.C.; methodology, L.C.; software, L.C.; validation, L.C. and S.D., formal analysis, L.C.; investigation, L.C.; resources, L.C. and S.D.; data curation, L.C. and S.D.; writing—original draft preparation, L.C.; writing—review and editing, L.C. and S.D.; visualization, L.C.; supervision, S.D.; project administration, L.C.; funding acquisition, S.D. All authors have read and agreed to the published version of the manuscript.

Funding

This research was funded by the Xinjiang Uygur Autonomous Region Key Research and Development Tasks Special Project (2022B01019-5).

Data Availability Statement

The original contributions presented in this study are included in the article. Further inquiries can be directed to the corresponding author.

Acknowledgments

This study is supported by TBEA SunOasis Co., Ltd., a company located in Ürümqi, China.

Conflicts of Interest

The authors declare no conflicts of interest. The paper reflects the views of the scientists, and not the company.

References

  1. Tahir, M.U.; Anees, M.; Khan, H.A.; Khan, I.; Zaffar, N.; Moaz, T. Modeling and evaluation of nickel manganese cobalt based Li-ion storage for stationary applications. J. Energy Storage 2021, 36, 102346. [Google Scholar] [CrossRef]
  2. Zhao, Y.; Wang, Z.; Sun, Z.; Liu, P.; Cui, D.; Deng, J. Data-Driven Lithium-Ion Battery Degradation Evaluation Under Overcharge Cycling Conditions. IEEE Trans. Power Electron. 2023, 38, 10138–10150. [Google Scholar] [CrossRef]
  3. Xiong, R.; Yang, R.; Chen, Z.; Shen, W.; Sun, F. Online Fault Diagnosis of External Short Circuit for Lithium-Ion Battery Pack. IEEE Trans. Ind. Electron. 2019, 67, 1081–1091. [Google Scholar] [CrossRef]
  4. Liu, K.; Li, K.; Peng, Q.; Zhang, C. A brief review on key technologies in the battery management system of electric vehicles. Front. Mech. Eng. 2018, 14, 47–64. [Google Scholar] [CrossRef]
  5. Zhang, S.; Xu, K.; Jow, T. Study of the charging process of a LiCoO2-based Li-ion battery. J. Power Sources 2006, 160, 1349–1354. [Google Scholar] [CrossRef]
  6. Liu, K.; Li, K.; Yang, Z.; Zhang, C.; Deng, J. An advanced Lithium-ion battery optimal charging strategy based on a coupled thermoelectric model. Electrochim. Acta 2017, 225, 330–344. [Google Scholar] [CrossRef]
  7. Chen, L.-R.; Hsu, R.C.; Liu, C.-S. A Design of a Grey-Predicted Li-Ion Battery Charge System. IEEE Trans. Ind. Electron. 2008, 55, 3692–3701. [Google Scholar] [CrossRef]
  8. Liu, J.; Duan, Q.; Chen, H.; Sun, J.; Wang, Q. An optimal multistage charge strategy for commercial lithium ion batteries. Sustain. Energy Fuels 2018, 2, 1726–1736. [Google Scholar] [CrossRef]
  9. Monem, M.A.; Trad, K.; Omar, N.; Hegazy, O.; Mantels, B.; Mulder, G.; Van den Bossche, P.; Van Mierlo, J. Lithium-ion batteries: Evaluation study of different charging methodologies based on aging process. Appl. Energy 2015, 152, 143–155. [Google Scholar] [CrossRef]
  10. Li, Y.; Guo, J.; Pedersen, K.; Gurevich, L.; Stroe, D.-I. Investigation of multi-step fast charging protocol and aging mechanism for commercial NMC/graphite lithium-ion batteries. J. Energy Chem. 2023, 80, 237–246. [Google Scholar] [CrossRef]
  11. Huang, J.-W.; Liu, Y.-H.; Wang, S.-C.; Yang, Z.-Z. Fuzzy-control-based five-step Li-ion battery charger. In Proceedings of the 2009 International Conference on Power Electronics and Drive Systems (PEDS 2009), Taipei, Taiwan, 2–5 November 2009; pp. 1547–1551. [Google Scholar]
  12. Khan, A.B.; Choi, W. Optimal Charge Pattern for the High-Performance Multistage Constant Current Charge Method for the Li-Ion Batteries. IEEE Trans. Energy Convers. 2018, 33, 1132–1140. [Google Scholar] [CrossRef]
  13. Lee, C.-H.; Chen, M.-Y.; Hsu, S.-H.; Jiang, J.-A. Implementation of an SOC-based four-stage constant current charger for Li-ion batteries. J. Energy Storage 2018, 18, 528–537. [Google Scholar] [CrossRef]
  14. Wang, S.-L.; Fernandez, C.; Cao, W.; Zou, C.-Y.; Yu, C.-M.; Li, X.-X. An adaptive working state iterative calculation method of the power battery by using the improved Kalman filtering algorithm and considering the relaxation effect. J. Power Sources 2019, 428, 67–75. [Google Scholar] [CrossRef]
  15. Wang, S.-C.; Zhang, Z.-Y. Research on Optimum Charging Current Profile with Multi-Stage Constant Current Based on Bio-Inspired Optimization Algorithms for Lithium-Ion Batteries. Energies 2023, 16, 7641. [Google Scholar] [CrossRef]
  16. Tahir, M.U.; Sangwongwanich, A.; Stroe, D.-I.; Blaabjerg, F. Multi-objective optimization for multi-stage constant current charging for Li-ion batteries. J. Energy Storage 2024, 86, 111313. [Google Scholar] [CrossRef]
  17. Zou, C.; Hu, X.; Wei, Z.; Wik, T.; Egardt, B. Electrochemical Estimation and Control for Lithium-Ion Battery Health-Aware Fast Charging. IEEE Trans. Ind. Electron. 2017, 65, 6635–6645. [Google Scholar] [CrossRef]
  18. Klein, R.; Chaturvedi, N.A.; Christensen, J.; Ahmed, J.; Findeisen, R.; Kojic, A. Optimal charging strategies in lithium-ion battery. In Proceedings of the 2011 American Control Conference, San Francisco, CA, USA, 29 June–1 July 2011; pp. 382–387. [Google Scholar]
  19. Li, X.; Chen, L.; Hua, W.; Yang, X.; Tian, Y.; Tian, J.; Xiong, R. Optimal charging for lithium-ion batteries to avoid lithium plating based on ultrasound-assisted diagnosis and model predictive control. Appl. Energ 2024, 367, 123396. [Google Scholar] [CrossRef]
  20. Dafeng, S.; Chuqi, S.; Xiaohua, Z.; Nannan, Y. LQR Based Battery Charge Sustaining Strategy for Hybrid Electric Vehicle. IFAC-PapersOnLine 2018, 51, 601–605. [Google Scholar] [CrossRef]
  21. Fang, H.; Wang, Y.; Chen, J. Health-Aware and User-Involved Battery Charging Management for Electric Vehicles: Linear Quadratic Strategies. IEEE Trans. Control. Syst. Technol. 2016, 25, 911–923. [Google Scholar] [CrossRef]
  22. Patnaik, L.; Praneeth, A.V.J.S.; Williamson, S.S. A Closed-Loop Constant-Temperature Constant-Voltage Charging Technique to Reduce Charge Time of Lithium-Ion Batteries. IEEE Trans. Ind. Electron. 2018, 66, 1059–1067. [Google Scholar] [CrossRef]
  23. Mohamed, M.M.; Hardianto, Y.P.; Hussain, A.; Ganiyu, S.A.; Gondal, M.; Aziz, A. Laser modified MnO2 cathode for augmented performance aqueous zinc ion batteries. Appl. Surf. Sci. 2024, 669, 160472. [Google Scholar] [CrossRef]
  24. Wang, S.-C.; Liu, Y.-H. A PSO-Based Fuzzy-Controlled Searching for the Optimal Charge Pattern of Li-Ion Batteries. IEEE Trans. Ind. Electron. 2014, 62, 2983–2993. [Google Scholar] [CrossRef]
  25. Liu, C.; Liu, L. Optimizing Battery Design for Fast Charge through a Genetic Algorithm Based Multi-Objective Optimization Framework. ECS Trans. 2017, 77, 257–271. [Google Scholar] [CrossRef]
  26. Liu, Y.-H.; Teng, J.-H.; Lin, Y.-C. Search for an Optimal Rapid Charging Pattern for Lithium–Ion Batteries Using Ant Colony System Algorithm. IEEE Trans. Ind. Electron. 2005, 52, 1328–1336. [Google Scholar] [CrossRef]
  27. Wang, Y.; Zhao, G.; Zhou, C.; Li, M.; Chen, Z. Lithium-Ion Battery Optimal Charging Using Moth-Flame Optimization Algorithm and Fractional-Order Model. IEEE Trans. Transp. Electrif. 2022, 9, 4981–4989. [Google Scholar] [CrossRef]
  28. Hu, X.; Li, S.; Peng, H.; Sun, F. Charging time and loss optimization for LiNMC and LiFePO4 batteries based on equivalent circuit models. J. Power Sources 2013, 239, 449–457. [Google Scholar] [CrossRef]
  29. Wang, J.; Liu, P.; Hicks-Garner, J.; Sherman, E.; Soukiazian, S.; Verbrugge, M.; Tataria, H.; Musser, J.; Finamore, P. Cycle-life model for graphite-LiFePO4 cells. J. Power Sources 2011, 196, 3942–3948. [Google Scholar] [CrossRef]
  30. Li, Y.; Li, K.; Xie, Y.; Liu, J.; Fu, C.; Liu, B. Optimized charging of lithium-ion battery for electric vehicles: Adaptive multistage constant current–constant voltage charging strategy. Renew. Energy 2020, 146, 2688–2699. [Google Scholar] [CrossRef]
  31. Mirjalili, S. Moth-flame optimization algorithm: A novel nature-inspired heuristic paradigm. Knowl. Based Syst. 2015, 89, 228–249. [Google Scholar] [CrossRef]
  32. Shami, T.M.; El-Saleh, A.A.; Alswaitti, M.; Al-Tashi, Q.; Summakieh, M.A.; Mirjalili, S. Particle Swarm Optimization: A Comprehensive Survey. IEEE Access 2022, 10, 10031–10061. [Google Scholar] [CrossRef]
  33. Deb, K.; Thiele, L.; Laumanns, M.; Zitzler, E. Scalable Multi-Objective Optimization Test Problems. In Proceedings of the 2002 Congress on Evolutionary, Honolulu, HI, USA, 12–17 May 2002; pp. 825–830. [Google Scholar]
  34. Coello, C.A.C.; Toscano-Pulido, G.T.; Lechuga, M.S. Handling multiple objectives with particle swarm optimization. IEEE Trans. Evol. Comput. 2004, 8, 256–279. [Google Scholar] [CrossRef]
  35. Deb, K.; Pratap, A.; Agarwal, S.; Meyarivan, T. A fast and elitist multiobjective genetic algorithm: NSGA-II. IEEE Trans. Evol. Comput. 2002, 6, 182–197. [Google Scholar] [CrossRef]
  36. Goldberg, D.E. The Design of Innovation: Lessons from Genetic Algorithms, Lessons for the Real World. Technol. Forecast. Soc. Chang. 2000, 64, 7–12. [Google Scholar] [CrossRef]
  37. Das, S.; Suganthan, P.N. Differential Evolution: A Survey of the State-of-the-Art. IEEE Trans. Evol. Comput. 2011, 15, 4–31. [Google Scholar] [CrossRef]
Figure 1. Second-order RC circuit model.
Wevj 16 00565 g001
Figure 2. Thermal model.
Wevj 16 00565 g002
Figure 3. Aging model.
Wevj 16 00565 g003
Figure 4. Multi-state coupling model.
Wevj 16 00565 g004
Figure 5. Experimental platform.
Wevj 16 00565 g005
Figure 6. Comparison of simulation and experimental results for 1C-CCCV and 0.5C-CCCV charging tests under 25 °C and 15 °C environmental conditions: (a) Voltage variation at 25 °C; (b) Temperature variation at 25 °C; (c) Voltage variation at 15 °C; (d) Temperature variation at 15 °C.
Wevj 16 00565 g006
Figure 7. VMCC-CV charging curve based on V-SOC-Rint.
Wevj 16 00565 g007
Figure 8. SOC-Rint curve at different temperatures.
Wevj 16 00565 g008
Figure 9. Search tracks of the moth diagram.
Wevj 16 00565 g009
Figure 10. IMFO algorithm flowchart.
Wevj 16 00565 g010
Figure 11. Charging strategy comparison: (a) IMFO and 1C-CCCV charging strategy, (b) IMFO and MFO charging strategy.
Wevj 16 00565 g011
Figure 12. Multi-objective Pareto frontier diagram.
Wevj 16 00565 g012
Figure 13. Rapid charging current curve based on the V-SOC-Rint mechanism.
Wevj 16 00565 g013
Figure 14. Comparison of the Rapid charging strategy with 2C-CCCV and 1C-CCCV charging method battery performance parameters: (a) current, (b) voltage, (c) surface temperature rise of battery.
Wevj 16 00565 g014
Figure 15. Comparison of battery performance parameters between 5 groups of test charging strategies: (a) current, (b) voltage, (c) Surface temperature rise of battery, (d) SOH degradation.
Wevj 16 00565 g015
Figure 16. Multi-objective balanced charging current curve based on the V-SOC-Rint mechanism.
Wevj 16 00565 g016
Figure 17. Multi-objective balanced charging strategy and comparison with 0.75C-CCCV: (a) surface temperature rise of battery; (b) SOH degradation.
Wevj 16 00565 g017
Figure 18. Battery performance with enhanced safety charging strategy: (a) current; (b) voltage; (c) surface temperature rise of battery; (d) SOH degradation.
Wevj 16 00565 g018
Table 1. Battery parameters.
ParametersSpecification
Model nameICR18650-20P
Nominal capacity2000 mAh
Mass43 g
MaterialLiNixCoyMn1-x-yO2//Graphite
cut-off voltage4.2 V
Maximum charging current2C(4 A)
Working temperature5–50 °C
Table 2. Variable constraints.
ParametersValueUnit
I[0, 4]A
Vk[2.5, 4.2]V
SOC[10, 90]%
SOH[80, 100]%
Ts[5, 50]°C
t[0, 15,000]s
Table 3. Comparison of algorithms’ test results.
Baseline FunctionsAlgorithmsFPSPICNCT (S)SD (×10−3)EL (J)CTI (%)SDI (%)ELI (%)
DTLZ1IMFO78 ± 40.008 ± 0.00135 ± 41650 ± 408.0 ± 0.11950 ± 1518.80%15.05%6.75%
MFO65 ± 50.012 ± 0.00245 ± 51800 ± 508.5 ± 0.22000 ± 2010.00%10.75%4.58%
MOPSO70 ± 40.010 ± 0.00240 ± 51750 ± 458.2 ± 0.21975 ± 1812.50%13.98%5.69%
NSGA-II68 ± 50.011 ± 0.00242 ± 51770 ± 508.3 ± 0.21980 ± 2011.30%12.90%5.54%
GA50 ± 60.018 ± 0.00360 ± 62030 ± 609.0 ± 0.32050 ± 250.00%0.00%0.00%
DE55 ± 50.015 ± 0.00250 ± 51900 ± 558.8 ± 0.22025 ± 226.40%7.53%3.47%
DTLZ2IMFO75 ± 50.009 ± 0.00138 ± 51700 ± 458.1 ± 0.11960 ± 1816.30%14.89%6.18%
MFO60 ± 60.014 ± 0.00250 ± 61850 ± 558.7 ± 0.22010 ± 228.60%9.57%3.96%
MOPSO65 ± 50.012 ± 0.00245 ± 51800 ± 508.4 ± 0.21985 ± 2011.30%12.77%5.07%
NSGA-II63 ± 60.013 ± 0.00247 ± 61820 ± 508.5 ± 0.21990 ± 2110.30%11.70%4.89%
GA45 ± 70.020 ± 0.00365 ± 72030 ± 659.0 ± 0.42050 ± 200.00%0.00%0.00%
DE52 ± 60.016 ± 0.00255 ± 61950 ± 608.9 ± 0.22030 ± 233.90%7.45%3.04%
DTLZ3IMFO72 ± 50.010 ± 0.00140 ± 51750 ± 508.2 ± 0.11970 ± 2013.80%14.74%6.16%
MFO58 ± 70.015 ± 0.00255 ± 61900 ± 608.8 ± 0.22020 ± 236.50%9.47%3.90%
MOPSO72 ± 50.013 ± 0.00248 ± 61850 ± 558.5 ± 0.21995 ± 228.90%14.46%5.05%
NSGA-II62 ± 60.014 ± 0.00250 ± 61870 ± 558.6 ± 0.22000 ± 227.90%12.63%4.81%
GA60 ± 60.022 ± 0.00370 ± 72030 ± 709.0 ± 0.52050 ± 280.00%0.00%0.00%
DE40 ± 80.017 ± 0.00260 ± 61980 ± 658.9 ± 0.22035 ± 242.50%9.20%2.07%
Table 4. Battery performance under different weighted charging strategies.
Charging Strategies Time (S)Energy Loss (J)SOH Degradation (%)Max Temperature (°C)
wt -related charging strategieswtIMFOMFOIMFOMFOIMFOMFOIMFOMFO
014,76914,7693013010.0052110.00521125.325.3
0.195999305458.6476.40.0052130.00524825.825.85
0.272166917611635.50.0053050.00531426.426.5
0.348384696892.19200.0055290.00556927.928.1
0.436833589114811710.0058820.0059043030.3
0.530563015135713680.0062690.00626332.232.3
0.619621979193819320.007760.00784740.640.6
0.718721874202420170.0081040.0081141.941.9
0.818161816205520600.0081870.00818842.642.6
0.917751780209320880.008340.00836543.343.3
116021610224222360.008770.00882645.945.9
1C-CCCV 2985 1377 0.00628 32.5
Table 5. Weighting coefficients for the five charging strategies.
Charging StrategiesWeights
wtwSwE
Test 10.580.210.21
Test 20.560.220.22
Test 30.540.230.23
Test 40.520.240.24
Test 50.500.250.25
Disclaimer/Publisher’s Note: The statements, opinions and data contained in all publications are solely those of the individual author(s) and contributor(s) and not of MDPI and/or the editor(s). MDPI and/or the editor(s) disclaim responsibility for any injury to people or property resulting from any ideas, methods, instructions or products referred to in the content.