
Development of Deep Learning-Based Algorithm for Extracting Abnormal Deceleration Patterns †


Abstract
1. Introduction
2. Background
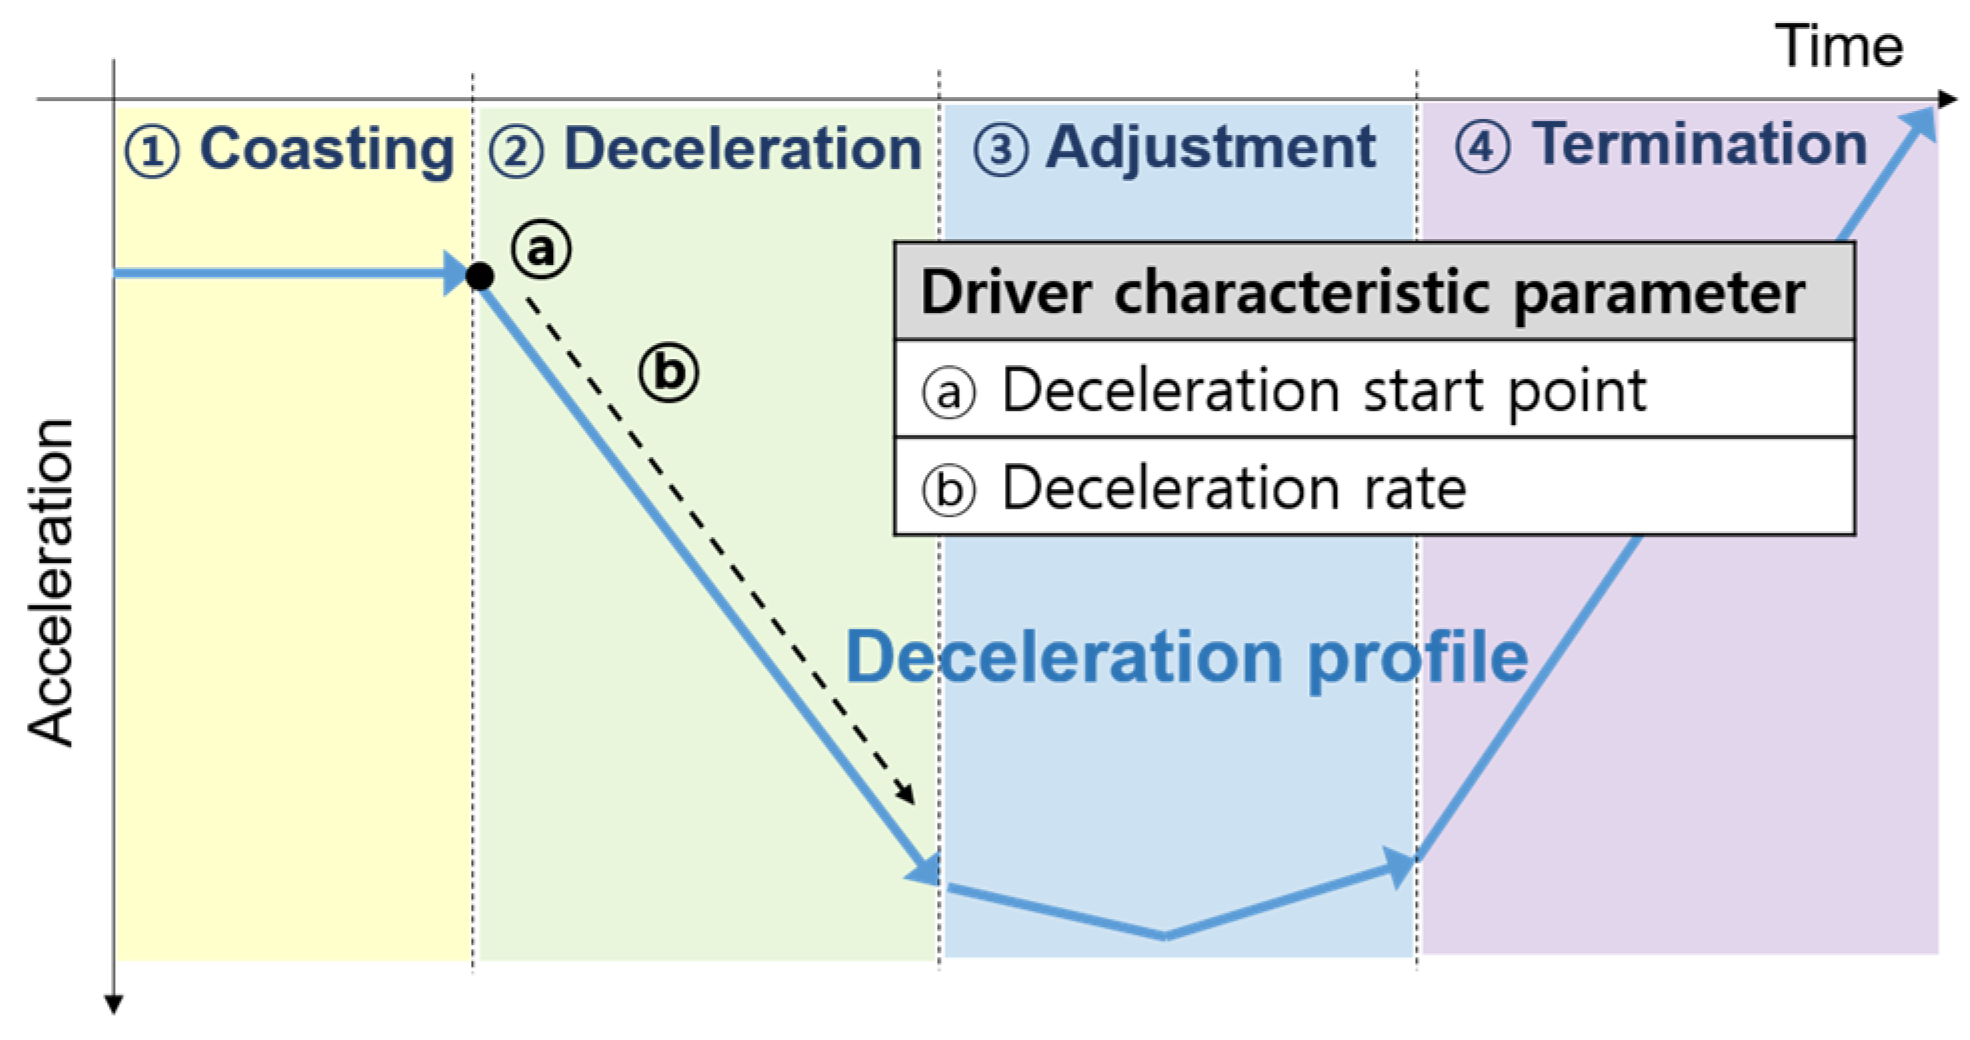
2.1. Smart Regenerative Braking System
2.2. Dataset Description
3. Unsupervised Anomaly Detection
3.1. Motivations
3.2. Anomaly Detection Algorithms
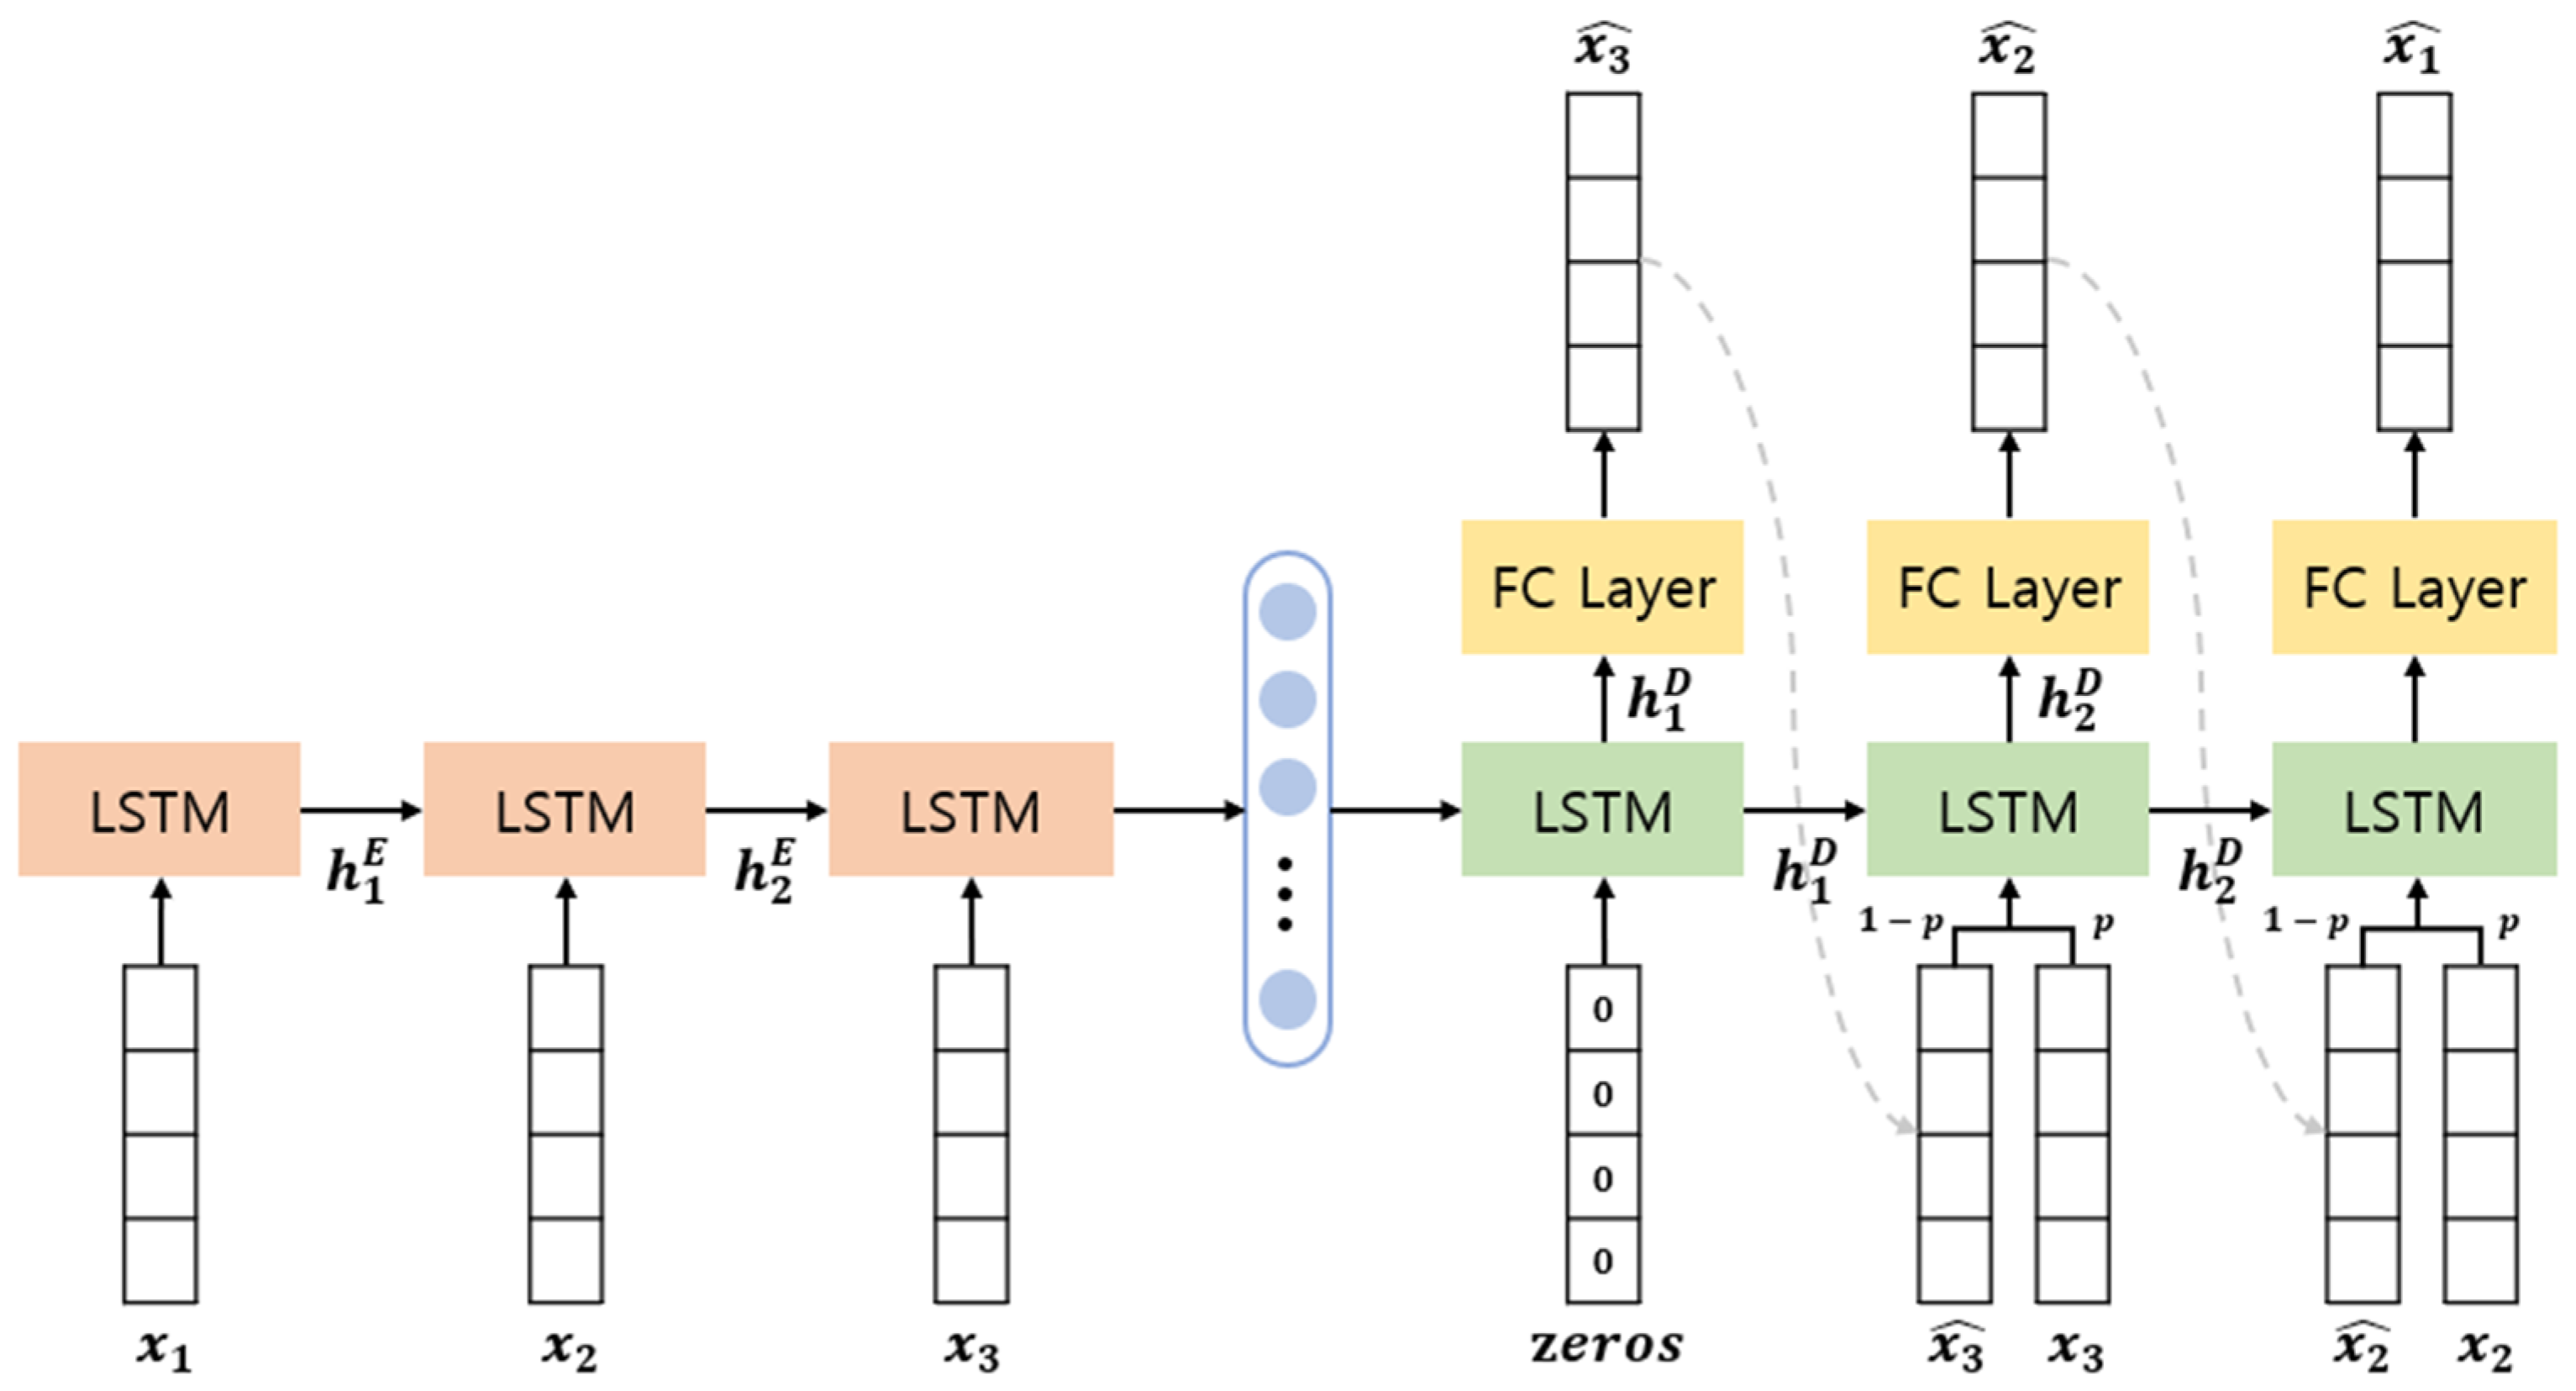
3.2.1. EncDec-AD
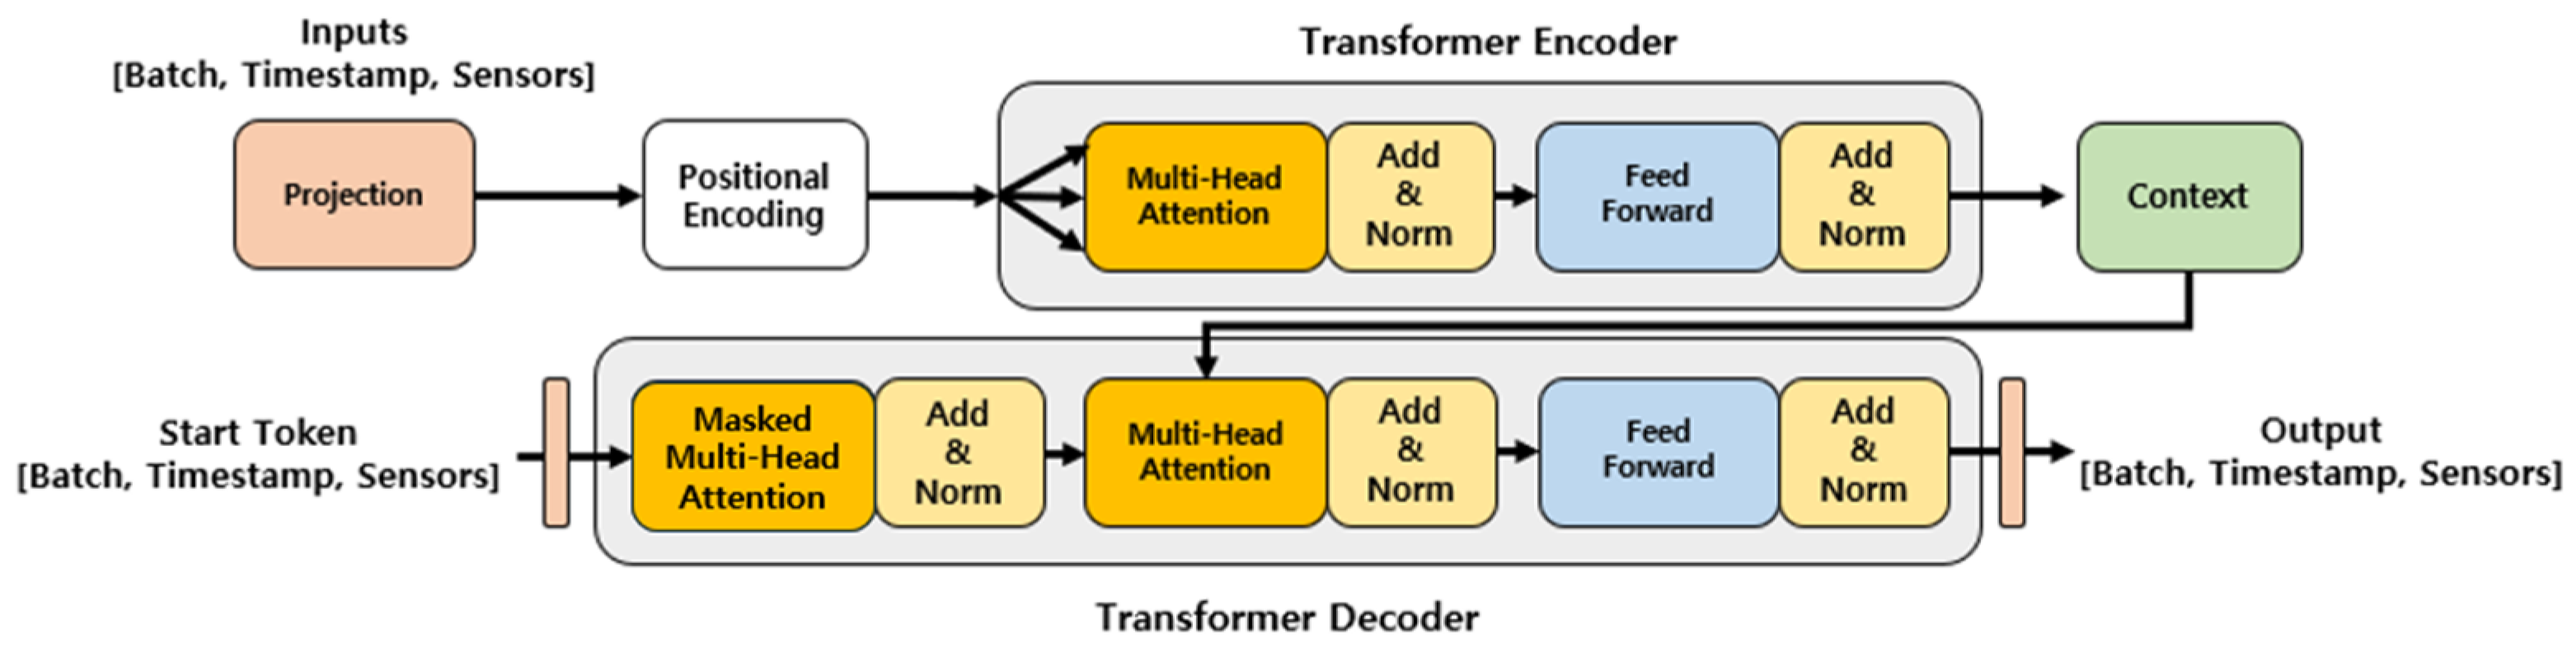
3.2.2. Transformer
3.3. Experimental Results
3.4. Generalizability Analysis
3.4.1. Experiment Settings
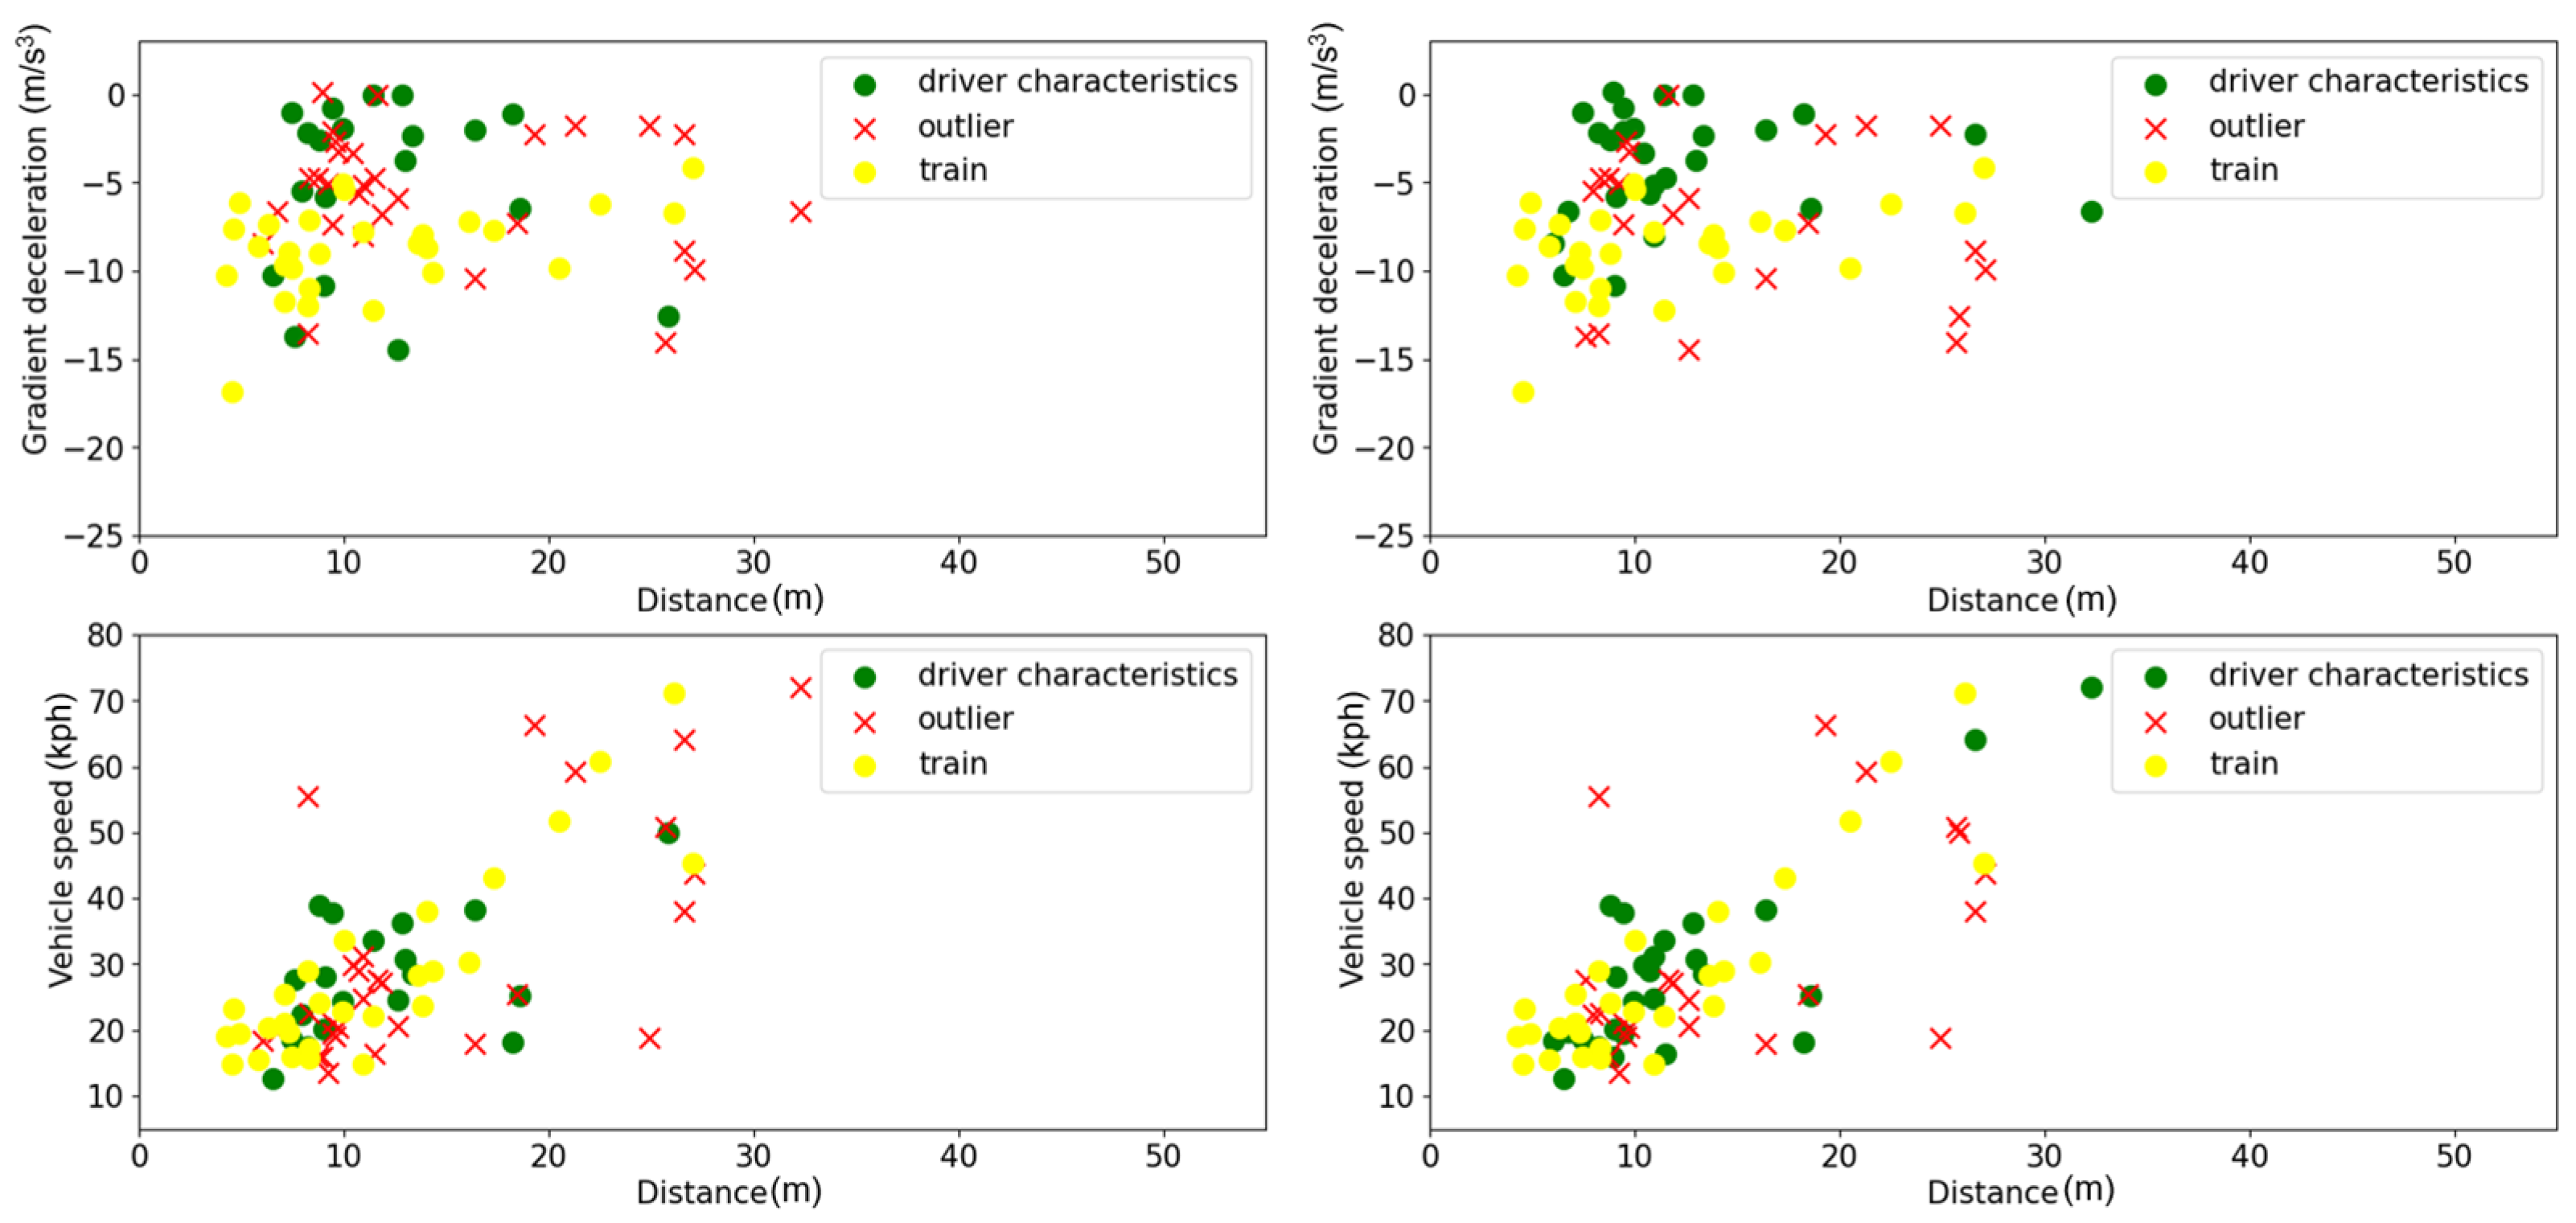
3.4.2. Analysis for Scenario 1 and Scenario 2
3.4.3. Analysis for Scenario 3
4. Vehicle Testing and Assessment
4.1. Vehicle Testing Environments
4.2. Assessment of Testing Results
5. Conclusions
Author Contributions
Funding
Data Availability Statement
Conflicts of Interest
References
- Hasenjager, M.; Wersing, H. Personalization in advanced driver assistance systems and autonomous vehicles: A review. In Proceedings of the 2017 IEEE 20th International Conference on Intelligent Transportation Systems (ITSC), Yokohama, Japan, 16–19 October 2017; pp. 1–7. [Google Scholar]
- Gu, Y.; Hashimoto, Y.; Hsu, L.-T.; Iryo-Asano, M.; Kamijo, S. Human-like motion planning model for driving in signalized intersections. IATSS Res. 2017, 41, 129–139. [Google Scholar] [CrossRef]
- Bifulco, G.N.; Simonelli, F.; Di Pace, R. Experiments toward an human-like Adaptive Cruise Control. In Proceedings of the 2008 IEEE Intelligent Vehicles Symposium, Eindhoven, The Netherlands, 4–6 June 2008; pp. 919–924. [Google Scholar]
- Kim, M.H.; Lee, K.J.; Jun, Y.H.; Woo, S.S. Development of Deep Learning-Based Algorithm for Extracting Abnormal Deceleration Patterns. In Proceedings of the 37th International Electric Vehicle Symposium & Exhibition, Seoul, Republic of Korea, 23–26 April 2024. [Google Scholar]
- Jun, Y.H.; Ko, I.M.; Kim, T.H. Development of Smart Regenerative Braking System Customized with Driving Pattern Using Machine Learning. In Proceedings of the KSAE 2022 Conference, Topeka, KS, USA, 7 December 2022; pp. 1980–1987. [Google Scholar]
- McClamroch, N.H. Space vehicle dynamics and control. Automatica 2001, 37, 2077–2078. [Google Scholar] [CrossRef]
- Ploeg, J.; Serrarens, A.F.A.; Heijenk, G.J. Connect & Drive: Design and evaluation of cooperative adaptive cruise control for congestion reduction. J. Mod. Transp. 2011, 19, 207–213. [Google Scholar]
- Milanes, V.; Shladover, S.E.; Spring, J.; Nowakowski, C.; Kawazoe, H.; Nakamura, M. Cooperative adaptive cruise control in real traffic situations. IEEE Trans. Intell. Transp. Syst. 2014, 15, 296–305. [Google Scholar] [CrossRef]
- Rajamani, R.; Zhu, C. Semi-autonomous adaptive cruise control systems. IEEE Trans. Veh. Technol. 2002, 51, 1186–1192. [Google Scholar] [CrossRef]
- Milanés, V.; Shladover, S.E. Modeling cooperative and autonomous adaptive cruise control dynamic responses using experimental data. Transp. Res. Part C Emerg. Technol. 2014, 48, 285–300. [Google Scholar] [CrossRef]
- Malhotra, P.; Ramakrishnan, A.; Anand, G.; Vig, L.; Agarwal, P.; Shroff, G. LSTM-based Encoder-Decoder for Multi-sensor Anomaly Detection. arXiv 2016, arXiv:1607.00148. [Google Scholar]
- Vaswani, A.; Shazeer, N.; Parmar, N.; Uszkoreit, J.; Jones, L.; Gomez, A.N.; Kaiser, L.; Polosukhin, I. Attention is all you need. In Advances in Neural Information Processing Systems; MIT Press: Cambridge, MA, USA, 2017; Volume 30. [Google Scholar]


| Vehicle Types | Drivers | Dataset Size | Anomaly Ratio |
|---|---|---|---|
| IONIQ5 | Driver 1 | 55 | 0.67 |
| IONIQ5 | Driver 2 | 35 | 0.60 |
| G80EV | Driver 2 | 29 | 0.63 |
| G80EV | Driver 3 | 23 | 0.56 |
| Dataset | IONIQ5 | G80EV | ||
|---|---|---|---|---|
| Model | EncDec-AD | Transformer | EncDec-AD | Transformer |
| Precision | 0.9686 | 0.9336 | 1.0000 | 0.9767 |
| Recall | 0.7708 | 0.8792 | 1.0000 | 1.0000 |
| F1-score | 0.8585 | 0.9056 | 1.0000 | 0.9882 |
| Fβ-score | 0.8037 | 0.8896 | 1.0000 | 0.9952 |
| Scenario | Train Dataset | Test Dataset |
|---|---|---|
| Scenario 1 | IONIQ5 + G80EV normal dataset | IONIQ5—Driver 1 |
| IONIQ5—Driver 2 | ||
| Scenario 2 | IONIQ5 + G80EV normal dataset | G80EV—Driver 2 |
| G80EV—Driver 3 | ||
| Scenario 3 | IONIQ5 + G80EV normal dataset | IONIQ5—Driver 2 |
| G80EV—Driver 2 |
Disclaimer/Publisher’s Note: The statements, opinions and data contained in all publications are solely those of the individual author(s) and contributor(s) and not of MDPI and/or the editor(s). MDPI and/or the editor(s) disclaim responsibility for any injury to people or property resulting from any ideas, methods, instructions or products referred to in the content. |
© 2025 by the authors. Published by MDPI on behalf of the World Electric Vehicle Association. Licensee MDPI, Basel, Switzerland. This article is an open access article distributed under the terms and conditions of the Creative Commons Attribution (CC BY) license (https://creativecommons.org/licenses/by/4.0/).
Share and Cite
Jun, Y.; Kim, M.; Lee, K.; Woo, S.S. Development of Deep Learning-Based Algorithm for Extracting Abnormal Deceleration Patterns. World Electr. Veh. J. 2025, 16, 37. https://doi.org/10.3390/wevj16010037
Jun Y, Kim M, Lee K, Woo SS. Development of Deep Learning-Based Algorithm for Extracting Abnormal Deceleration Patterns. World Electric Vehicle Journal. 2025; 16(1):37. https://doi.org/10.3390/wevj16010037
Chicago/Turabian StyleJun, Youngho, Minha Kim, Kangjun Lee, and Simon S. Woo. 2025. "Development of Deep Learning-Based Algorithm for Extracting Abnormal Deceleration Patterns" World Electric Vehicle Journal 16, no. 1: 37. https://doi.org/10.3390/wevj16010037
APA StyleJun, Y., Kim, M., Lee, K., & Woo, S. S. (2025). Development of Deep Learning-Based Algorithm for Extracting Abnormal Deceleration Patterns. World Electric Vehicle Journal, 16(1), 37. https://doi.org/10.3390/wevj16010037