1. Introduction
The Adaptive Cruise Control (ACC) system is considered to be one of the most advanced driving assistant systems available in new intelligent vehicles that have been introduced to our modern societies. This system has been designed to boost the safety performance of the vehicle [
1,
2,
3], as well as increase the driver’s comfort [
4,
5,
6]. This could be obtained by mitigating the driver’s need to continually adjust on-board vehicle speed to coincide with the preceding vehicle speed [
7]. Automakers and their suppliers installed the first generation of ACC systems in selected premium vehicles with the aim of improving driving comfort and convenience as well as increasing safety and stability. However, although considering ACC systems as a luxury in many vehicles in the past [
8], the current car development innovation allows for the system to spread more easily, with a propensity to spread this technology from high-end models to mid-range and low-end models [
9]. In this regard, the major automobile manufacturers and technology companies have made crucial progress in various types of driving aids including ACC systems to improve traffic safety. Some of the studies have demonstrated that human errors are the main reason behind 90% of traffic accidents [
10]. Therefore, to avoid this, researchers in their investigations have focused on the part of safety problems that is related to rear-end collisions and discovered that ACC systems have the potential to reduce this category of accidents [
11]. Furthermore, several standards and frameworks have been introduced to assess the safety advantages of ACC systems. Especially, highlighting the important role of longitudinal behavior by ACC where the system features could remarkably reduce or even replace human drivers. It is also believed that a great advantage of ACC comes from a greater degree of homogeneity during the transition phase from conventional driving to automated driving [
12]. In addition, situational awareness can be improved by increasing the sensing capacity and adding excessive sensors to supplement the operation of the existing sensors. However, notwithstanding the fact that ACC systems are designed to ameliorate traffic flow capacity and safety problems, it is also important to realize that some potential negative impacts of the system should not be overlooked [
13,
14,
15,
16]. The negative behavioral of ACC could be represented by the drivers’ awareness mitigation, which resulted from slowing down the reaction times, as well as the careless overreliance on ACC systems. For this reason, the researchers suggested a continuous education strategy to the drivers about the capabilities and limitations of ACC systems to avoid the blind overreliance on this technology, eventually preventing possible collisions.
1.1. Background
A large body of literature has demonstrated the benefits of adaptive cruise control systems to achieve improvements in safety and efficiency. Most of these research endeavors utilize simulation techniques, which require specifying the detailed actions of autonomous vehicles, contingent upon the control algorithms governing their operations [
17,
18,
19,
20,
21,
22,
23], whereas fewer research works have experimentally demonstrated the advantages and disadvantages of the ACC system through empirical analysis. For example, Ploeg et al. [
24] implemented the empirical test with a fleet of six passenger cars and indicated the possibility of theoretical analyzing for shorter distances between vehicles as the practical results of the study matched the theoretical analysis. Milanés et al. [
25] have tested four commercial vehicles equipped with an ACC system to investigate the system effects on highway capacity and traffic flow dynamics. Gunter et al. [
26], on the other hand, conducted extensive testing on an eight-vehicle fleet. During this testing, seven different vehicles with unique models from two different manufacturers utilized their ACC systems. The results of the study revealed that all of the ACC systems in the seven vehicle models tested were string unstable. Raju et al. [
27] have conducted field tests using two commercial vehicles equipped with ACC, in which the following vehicle tracked the leading vehicle’s pace when the ACC system was activated to assess its real-world functionality. The results suggest that different system speed and gap settings have an impact on the indicators for car-following, and the system’s response times were observed to be on par with human response times. Naus et al. [
28] conducted experiments involving two Citroen C4s cars and demonstrated that their cooperative adaptive cruise control (CACC) controller is capable of achieving string stability across a broader parameter domain compared to the original factory-installed ACC. Su et al. [
29] examined a 2013 Cadillac SRX fitted with ACC on highways, gathering data on speeds and gaps using the vehicle’s onboard sensors. They devised a three-phase car-following model that encompasses leading, transitioning, and following modes. They observed that minor inaccuracies in speed led to significant discrepancies in gap measurements over time.
Several other car-following behavior characteristics of ACC vehicles have been recently studied through empirical experiments. Li et al. [
30] have found that the response time of ACC vehicles is comparable to human drivers but larger than the ACC controller time gap. Goodall and Lan demonstrated that ACC response can amplify or dampen oscillations, and the stabilization process can exhibit overshooting or undershooting [
31]. These behaviors depend on the ACC headway setting, speed level, and leader stimulus as reported by Shi and Li [
32]. In a three-vehicle platoon, the change from one ACC vehicle to the next is progressive for oscillation growth and regressive for deceleration, acceleration, and overshooting as studied by Ye et al. [
33]. Li et al. [
34] demonstrated that ACC systems exhibit a linear equilibrium relationship between spacing and speed. However, they emphasized that the essential parameters defining these relationships may vary considerably from those observed in traffic driven by humans, contingent upon the input settings utilized. This research is considered as a continuation of the approaches that are presented in previous studies about the effectiveness of ACC systems by applying relative methods, gathering real life measurements, and conducting comparative analyses between different brands of commercial vehicles.
1.2. Study Objectives and Overview
The study’s objectives are centered around conducting a detailed analysis, real-world testing, and focusing on specific performance aspects of ACC systems, all aimed at understanding the longitudinal movement behavior of future Autonomous Vehicles (AVs). By examining three different types of ACC and assessing their performance across three distinct car brands, the study aims to gain comprehensive insights into how these systems operate across a wide range of steady speeds. This comprehensive approach enables a thorough investigation of the capabilities and limitations of ACC systems in diverse real-world driving scenarios, thereby providing valuable information for future developments in AV technology and enhancing the overall understanding of vehicle automation.
The remainder of this paper is organized as follows:
Section 2 describes the operation and types of ACC systems.
Section 3 discusses early and recent commercial car brands equipped with ACC systems.
Section 4 describes the methodology used to obtain field measurements.
Section 5 will present the achieved distance results after applying different speeds. In
Section 5, we will discuss the reported results and compare them to other relevant works. Finally,
Section 5 will draw some conclusions and discuss the future directions of this paper.
2. Operation and Types of ACC System
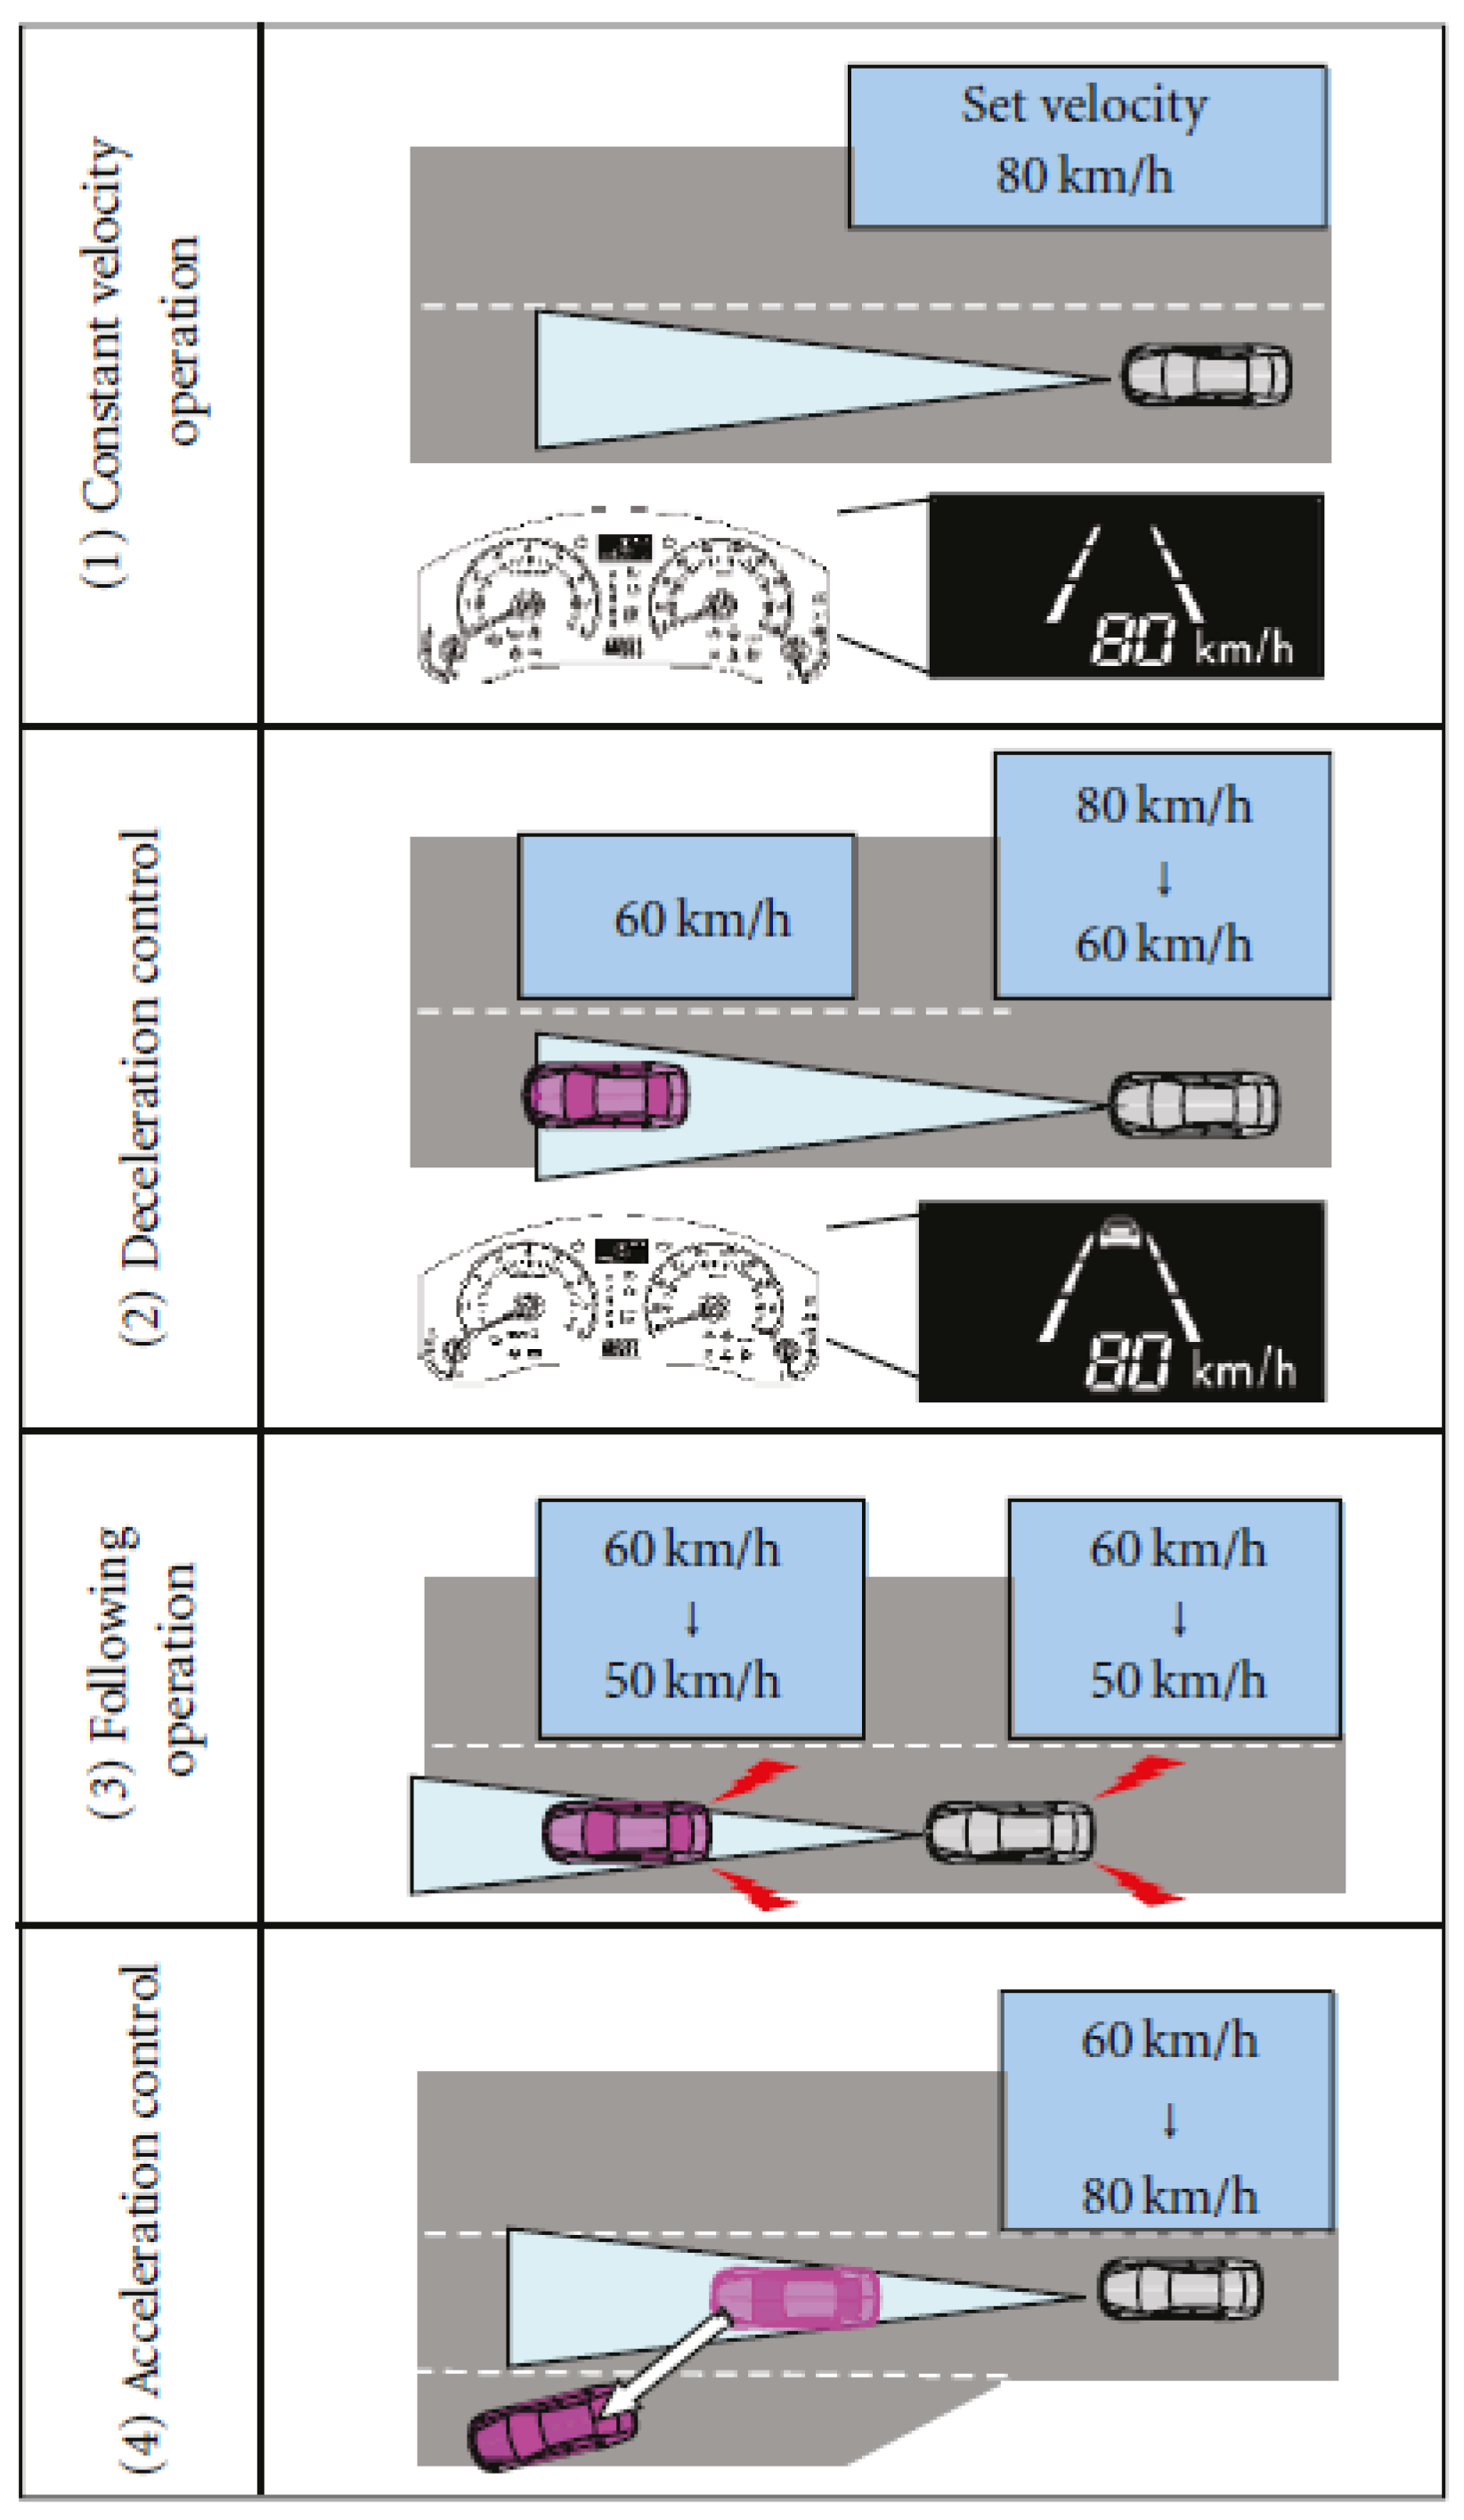
The operation process of the ACC system starts when the driver turns the switch control to ON during the driving process. By this step, both speed and time headway are being set by the driver and the range sensors existing in the on-board vehicle start to detect the preceding vehicle. If the preceding vehicle is absent or out of the sensors’ range and running fast, then the on-board vehicle will continue operating on the driver set speed. During this step, the speed module controls the engine as well as the transmission parts to maintain the same selected speed, while if the preceding vehicle exists in proximity or runs slowly, then the distance control module will be activated, which automatically engages with the driver-set time headway. Before reaching the minimum allowable time headway, the speed of the on-board vehicle will be adjusted to the preceding vehicle speed, see
Figure 1. When the detected time headway is less than the minimum allowable limit, then the ACC system will be deactivated by either using the OFF button or pressing the brake pedal. During the ACC operation process, the available indicator in the vehicle displays the operation (both speed control and spacing control state) for the driver.
At the end, if the deceleration capabilities are insufficient and exceed the limitations, then the warning alarms (either audible or visual alarm systems) will be activated to alert the driver to take over the driving control and press the brakes. Other warning systems can also use haptic feedback, via pedals, seats, or the steering wheel [
35], to avoid any rear-end collisions.
Automakers are trying to continuously develop the necessary technological steps to overcome the system operation impeding factors. These factors are usually represented by the robustness of the range sensors to weather conditions, in addition to the distraction and poor judgement by the driver in emergency situations due to over-reliance and a loss of vigilance. For this, three main types of ACC are introduced according to their sensor’s operation.
Figure 1.
ACC system operation steps [
36].
Figure 1.
ACC system operation steps [
36].
2.1. Radar-Based ACC
RADAR (Radio Detection and Ranging) was used in the early 1980s for commercial vehicles like ambulances, trucks, and buses as a warning application for collisions [
37]. Later it was used for ACC operation purposes as it has an advantage over other types like optical and infrared sensors. Radar sensors have the capability to perform well in the day, at night, and in most environmental conditions. However, the first generations of radar-type ACC system have been designed for driving equipped vehicles on highways only as the speeds are maintained at the same levels. For the next generations, the use of multiple radar sensors has emerged and allowed for extending driving the equipped vehicles to city streets where stop and go traffic is available. Regarding the requirements of the Radar-based ACC system, the studies showed that long-range radar must detect objects of different sizes, up to enough spaces ahead (200 m), with a minimum angle of detection ±8° [
38]. There is also a shorter range of radar considered: a (40 m) detection distance and an angle of ±16 [
39]. It is very important to perform a suitable alignment for radar sensors on the vehicles in such a way that ascertains successful object detection, even in curved roadways. Recently, Radar-based ACC has acquired more robustness in operation by using the Global Navigation Satellite System (GNSS) [
40]. Although this system might be impeded by driving the vehicle in long tunnels and through high-rise buildings areas, it remains an essential source of information needed to accomplish an ACC operation in serious situations.
2.2. Lidar-Based ACC
LIDAR (Light Detection and Ranging) sensors are being widely used for the purpose of measuring the distance required during the activation of an ACC system. They can be categorized in to two types: multi-beam, which consists of an array of transmitting and receiving sections, and scanning lidar, which uses one transmitter and receiver with a mechanically scanned lens system [
41]. The most important advantage of the laser beams is their ability in multi-tracking [
39]. Researchers demonstrated that Lidar sensors can provide a detection distance range up to 170 m and a horizontal detection angle of 170° with a clear resolution and identification to objects and obstacles [
42]. However, weather conditions like rain, snow, and fog heavily affect the lidar sensors and mitigate the proper operation of ACC systems. Moreover, dirt coverage, like mud, tar, smashed insects, and bugs, on vehicle fronts can easily limit the sensors capabilities and may even be detected by the sensors, which then signal the system application.
2.3. Vision-Based ACC
Both radar and lidar-based ACCs fall under the category of so-called “direct ranging” sensors. Vision-based sensors, on the other hand, depend on cameras and computers to indirectly control ranging distances during ACC operation [
43]. In this type of ACC, a number of techniques and methodologies are being used for the detection, recognition, and classification of regions of interest [
44]. One of the main advantages of using this system is that in addition to the velocity control of the on-board vehicle, vision-based technology performs lane-keeping driving assistance as another automated feature besides ACC. However, the lack of target segmentation remains a challenging point for using the visual system.
In general, each of the above types of sensors has its own features. Therefore, by combining data from these various sensors and technologies, an ACC system can continuously monitor and adapt to the driving environment, helping the driver maintain a safe and stress-free driving experience while also improving fuel efficiency and reducing the risk of accidents.
By fusing the data from the individual sensors, a more comprehensive and robust perception of the environment can be achieved. For example: Radar-Vision Fusion [
45], combining radar and vision data, can provide a more complete understanding of the environment, allowing for better object recognition and tracking in various conditions. Radar–Lidar Fusion [
46], integrating radar and Lidar data, can enhance object detection and tracking capabilities, especially in scenarios where accurate distance estimation is critical, while Vision–Lidar Fusion [
47], combining vision and Lidar data, can provide detailed information about the shape and characteristics of objects, improving the overall understanding of the scene. Therefore, implementing sensor fusion algorithms involves sophisticated data processing and fusion techniques, such as the Bayesian Neural Network, which combine camera, lidar, and radar sensors [
48], or deep learning approaches. These techniques aim to merge information from different sensors while considering their individual strengths and weaknesses, resulting in a more reliable and robust perception system for ACC and other ADAS applications.
Connected Automated Vehicles (CAVs) have the potential to improve the performance of ACC systems. The development of CAVs has led to the emergence of several studies in HYDRO-3D, which focuses on hybrid object detection and tracking for cooperative perception using 3D Lidar. The proposed HYDRO-3D method combines object detection features from V2X-ViT with historical information from the object tracking algorithm to enhance object detection performance [
49]. Another approach, PillarGrid, fuses information from multiple 3D Lidars to enhance situational awareness for CAVs, outperforming single-LiDAR-based methods in terms of accuracy and range [
50]. Additionally, a deep neural network-based 3D object detection model leverages a three-stage feature extractor and a novel LIDAR–Camera fusion scheme to achieve highly accurate object detection for CAVs [
51,
52]. These advancements in hybrid-3D technology contribute to improving ACC systems in CAVs by enhancing object detection and tracking capabilities.
3. ACC-Equipped Commercial Car Brands
The car brands that are equipped with the ACC system can be distributed into two-time intervals. The first generations of the ACC system appeared in Japan in 1995, Europe in 1999, and the United states in 2001 [
9]. As mentioned earlier, automakers have introduced the ACC in their vehicles as a luxury during this period. Later, both Nissan and Toyota introduced low-speed ACC in Japanese markets in 2004. Afterward, the extension of these automated features from high-end vehicles to mid end vehicles has been increasingly conducted and became a necessity during driving. The available ACC equipped vehicles from 1995–2008 are listed in
Table 1.
In recent years, a second period of producing ACC-equipped vehicles has clearly appeared. The advanced technology provided new properties for ACC systems that directly impacted car-following behavior and thus impacted the traffic safety and stability. Examples of recent ACC-equipped car brands, including the updated ACC different settings like speed range, distance range, and time headway range control, are listed in
Table 2.
The variation in ACC settings among different car brands shown in
Table 2 stems from a combination of factors. Firstly, it reflects manufacturer preferences, influenced by brand identity, target markets, and overall vehicle performance objectives. Secondly, it mirrors technological capabilities, with more advanced driver assistance systems offering a wider range of customization options. Thirdly, ACC settings may be tailored to accommodate diverse driving conditions and regulations, ensuring compliance and adaptability. Additionally, manufacturers consider driver preferences and comfort levels, offering a spectrum of options to cater to individual tastes. Lastly, vehicle design and performance characteristics play a role, as factors like weight, aerodynamics, and braking capabilities influence the optimal following distance and time required for safe and efficient ACC operation. This collective approach underscores the dynamic nature of automotive engineering, continually striving to enhance safety, comfort, and performance on the road.
4. Methodology
The following subsections provide an explanation of the research methodology. We first provide a brief explanation of the study area and test track and then provide a description of the test vehicles with the corresponding ACC system, the scenarios and procedures, and lastly the data gathering and the equipment used. Then, we provide a description of the test vehicles with the corresponding ACC system. The details of the vehicles and the reasons for their selection, as well as the used scenarios and procedures, are clarified. Lastly, the data gathering and the equipment used are illustrated.
4.1. Study Area and Site Description
Experimental work has been conducted on the ZalaZone testing track, which is considered a significant milestone in the field of automotive research and development. This state-of-the-art facility served as a proving ground for cutting-edge technologies and vehicles, allowing engineers and scientists to push the boundaries of automotive innovation. The facility is located on a 250-hectare plot near Zalaegerszeg in Western Hungary, adjacent to the Austrian border. It serves as a comprehensive solution hub for Original Equipment Manufacturers (OEMs) and TIER 1 suppliers within the automotive industry. The design of the facility stems from stringent industrial needs, strategically addressing gaps in the European proving ground market. The testing ground seamlessly integrates traditional dynamic test components with innovative modules, such as the specialized ADAS surface offering localized ADAS test services, and a forward-thinking smart city zone spanning 15 hectares. A diverse range of vehicles, including passenger cars, commercial vehicles, special fleet vehicles, and two-wheelers, can undergo an extensive array of tests.
The selected testing track was suitable for our empirical works as it has a sufficient length of 1.5 km to cover various driving speeds, and it has two lanes, each of a width of 3.6 m. All other elements like road marking lines and the pavement surface condition have been described as well-maintained to provide a safe and an accurate environment for testing as they are essential to obtain reliable results.
4.2. Test Vehicles and Applied Scenarios
Three different types of vehicles equipped with different ACC systems were used in the test: Subaru Levorg equipped with camera-based ACC, Volvo XC40 with combined camera-based and radar-based ACC, and VW E-Golf equipped with radar-based ACC. The meticulous selection of the three vehicles for our experiment was driven by a commitment to ensuring a comprehensive and exhaustive evaluation of ACC systems. The distinctiveness of each vehicle, coupled with the specific ACC sensor technologies they embody, creates a robust foundation for a thorough comparative analysis. Regarding the Subaru Levorg, we opted for a vehicle equipped with a camera-based ACC sensor, namely, “Eyesight”. The strategic placement of the sensor at the front provides an extensive field of vision, capturing a broad spectrum of visual information. This encompasses crucial elements such as traffic conditions, lane markings, and potential obstacles. The utilization of Eyesight empowers the ACC system to make real-time decisions based on a wealth of visual data, showcasing the prowess of camera-centric technology, while the inclusion of the Volvo XC40 adds a layer of complexity to our study as it boasts a combined ACC sensor system utilizing both camera and radar technologies. Cameras excel at interpreting visual cues such as lane markings and traffic signs, while radar stands out for precisely measuring the distance and speed of objects. By employing this dual-sensor setup, we aim to achieve a more nuanced and comprehensive understanding of ACC performance. This deliberate choice eliminates the need for additional field tests with other vehicle brands as the XC40 encapsulates a wider range of sensing abilities within a single vehicle. On the other hand, incorporating the VW e-Golf into our experiment further enriches the diversity of ACC-equipped vehicles under scrutiny. This electric vehicle relies solely on radar-based ACC sensor technology, emphasizing the adaptability of ACC to varying platforms. The unique dynamics presented by electric vehicles are taken into account, demonstrating the versatility of ACC systems across different vehicle types. Therefore, the representation of this distinct category within our study eliminates the need for testing a larger number of vehicle brands, in addition to maintaining the following distance from the vehicle ahead and adjusting the speed to keep a safe distance.
Table 3 shows the other main functions of the ACC sensors available in each tested vehicle.
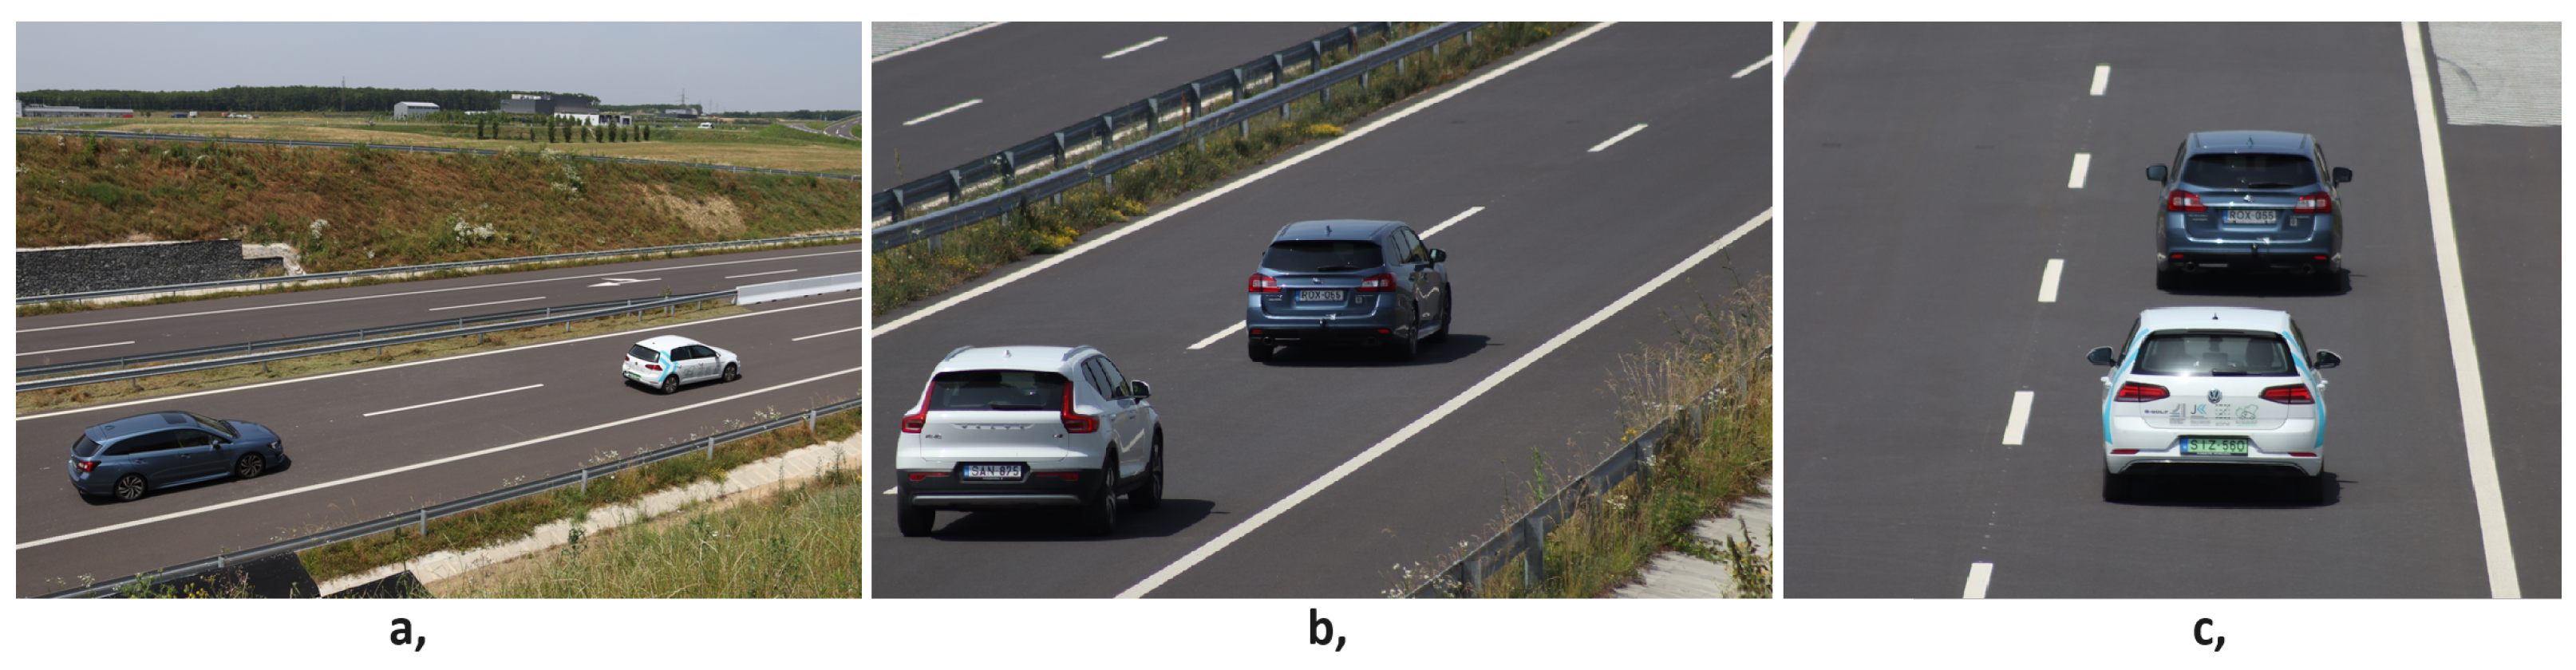
The test procedure included three car-following scenarios to study ACC operation for all vehicles: (a) Subaru is following, (b) Volvo is Following, and (c) VW is following, as shown in
Figure 2. In addition, ACC setting 1, which is the shortest setting in terms of time and distance, is applied for each one of the vehicles during the entire test duration.
During this phase, our three test vehicles equipped with ACC systems participated in the above-mentioned scenarios. Initially, the Subaru acted as the trailing vehicle, followed by the Volvo in the second scenario, and finally the WV in the third scenario. The test runs were conducted with only two out of the three vehicles being assessed present on the track, ensuring a precise evaluation of the ACC performance. The experiments were conducted under favorable weather conditions to prevent any interference with the ACC sensors. Notably, the driving duties during these experiments were carried out by three individuals of varying ages, accompanied by colleagues inside the vehicles to oversee and facilitate data collection. LiDAR devices were precisely utilized to gather car-following distance data, ensuring accuracy throughout the experiment. These devices were securely affixed to the rear bumper of the leading vehicle, consistently recording the distance to the front bumper of the following vehicle. The three vehicles equipped with ACC alternated roles as followers, offering a comprehensive assessment of their ACC systems on the ZalaZONE Motorway.
4.3. Data Collection
To ensure the precise gathering of real-world measurements during the experiment, specialized lidar sensor equipment is strategically placed at the rare bumper of each preceding vehicle in a specific scenario. Then, the equipment monitors and records the precise measurements of the distances (clearances) between the front bumper of the following vehicle and the rear bumper of the preceding vehicle as they travel at multiple speeds. The selected speeds for the test are divided into three ranges: low-speed range (30, 40, and 50) km/h, medium-speed range (60, 70, and 80) km/h, and high-speed range (90, 100, and 110) km/h. These ranges collectively represent a wide range of study speeds to better analyze the effectiveness of adaptive cruise control systems of all vehicles. In the conducted test, speeds ranging from 30 to 110 km/h were systematically employed, with a precise 10 km/h incremental interval. In this procedure, a leader vehicle maintained a specific speed while the following vehicle was set to travel at a slightly higher speed, for the test speeds (30–50 km/h) +10 km/h and for the test speeds (60–110 km/h) +20 km/h. However, depending on the unknown ACC implementation, the observed distance gaps and time gaps may change, with the speed differential either remaining constant or getting shorter with increasing desired speed, which would be a result on its own. Additionally, during the tests, the speeds of the ACC-equipped vehicles were closely monitored during the experiments, primarily relying on onboard observations. However, it is recognized that onboard information may introduce inaccuracies, particularly due to variations in tire pressure affecting the wheel revolution rate, leading to discrepancies between the displayed speed and the actual speed of the vehicle. Acknowledging this potential source of error, it is important to note that utilizing ACC vehicles as leaders in the experiments may introduce an unobservable systematic error of up to 5% in the observed distance and time gaps. The controlled approach, conducted along the constant speed profile, proves instrumental in conducting a comprehensive study of following distances. By increasing the speeds at the end of each run and observing the ACC’s performance under these conditions, the test allows for a deep investigation into ACC systems, shedding light on their operational performance and effectiveness across a range of speeds.
4.4. Measurement Design, Software, and Image Generation
The study task involved designing and implementing a measurement system capable of monitoring and recording the real-time distance between two cars. To accomplish this, the right sensor needed selection, along with designing the supporting structure and creating software for displaying and recording data. The purpose of the system is to compare adaptive cruise control in different vehicles. To measure vehicle distances, selecting a suitable sensor is crucial. Achieving an accuracy of ±100 mm is essential, with a requirement to detect vehicles at a distance of at least 20,000 mm. The sensor should be relatively compact and lightweight. Therefore, RPLIDAR S1 was selected for its technical parameters. A special mounting unit had to be made to position the sensor correctly and mount it easily on the vehicle. This involved designing and assembling custom components and using commercially available parts. The suction cup allows quick and easy mounting of the sensor on the back of the vehicle. The mounting system’s design ensures easy sensor positioning.
The measurement program provides an interface that allows users to limit the measurement range both laterally and longitudinally. Users can adjust the LiDAR’s angle of view, and depending on the sensor’s mounting orientation, its orientation can also be changed within the program. During recording, users have the option to specify the location and name of the file. Upon pressing the START button, the program automatically records the longitudinal and lateral distances of the nearest object within the set range to the generated file while simultaneously displaying the detected points in real-time. Pressing the STOP button halts the data recording process. The software interface is implemented in Python using tkinter. When a measurement is initiated, a C++ driver is launched in the background, responsible for processing the raw data from the LiDAR via serial communication. Data filtering is performed within this software during processing. The filtered data is then passed to the Python program, which displays all the data and saves the data of the nearest object to the specified file. The saved data include the time, longitudinal distance, and lateral distance.
The figures presented in this research were generated utilizing the R project [
46], a widely recognized tool known for its capacity to provide lucid explanations and precise visualizations. These figures encapsulate a significant volume of measurements obtained from the LiDAR device. Within them, the averages of these readings have been portrayed in illustrative formats, with the intention of fostering a comprehensive understanding of the mean and median values derived from the recorded data.
5. Results
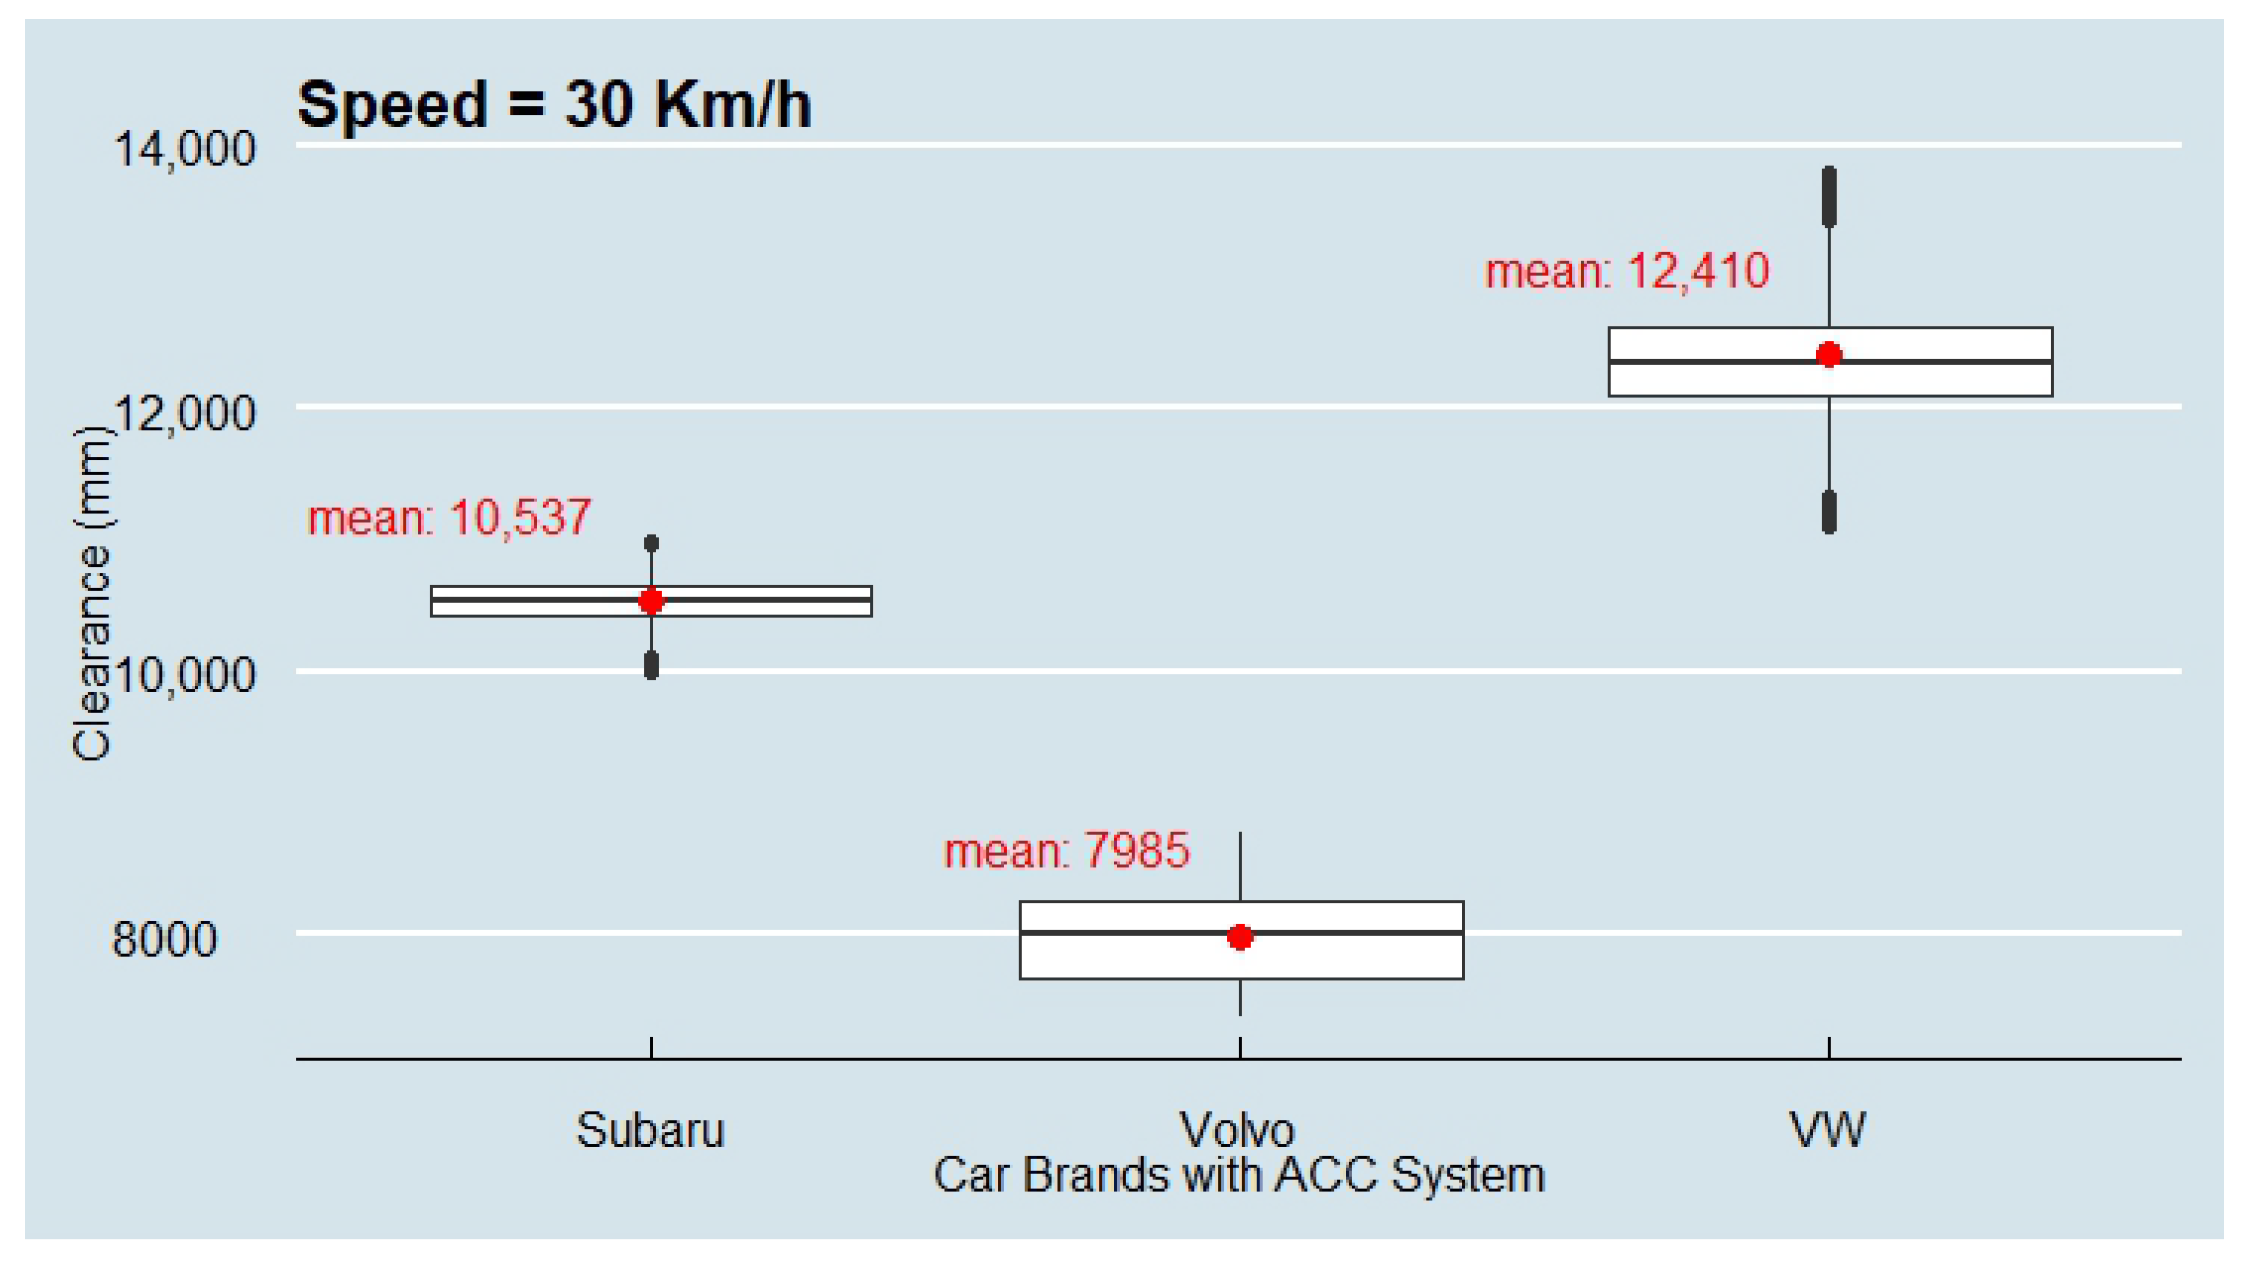
The collected data from the field test including clearances between every two following vehicles at different applied speed ranges have been analyzed and presented through box plot diagrams to better understand and indicate convergence, symmetry, and skewness of the data.
Figure 3 shows the results at low speeds in which the clearances are different from one car to another. Volvo, for example, obtained the shortest distance among the others at 30 km/h speed.
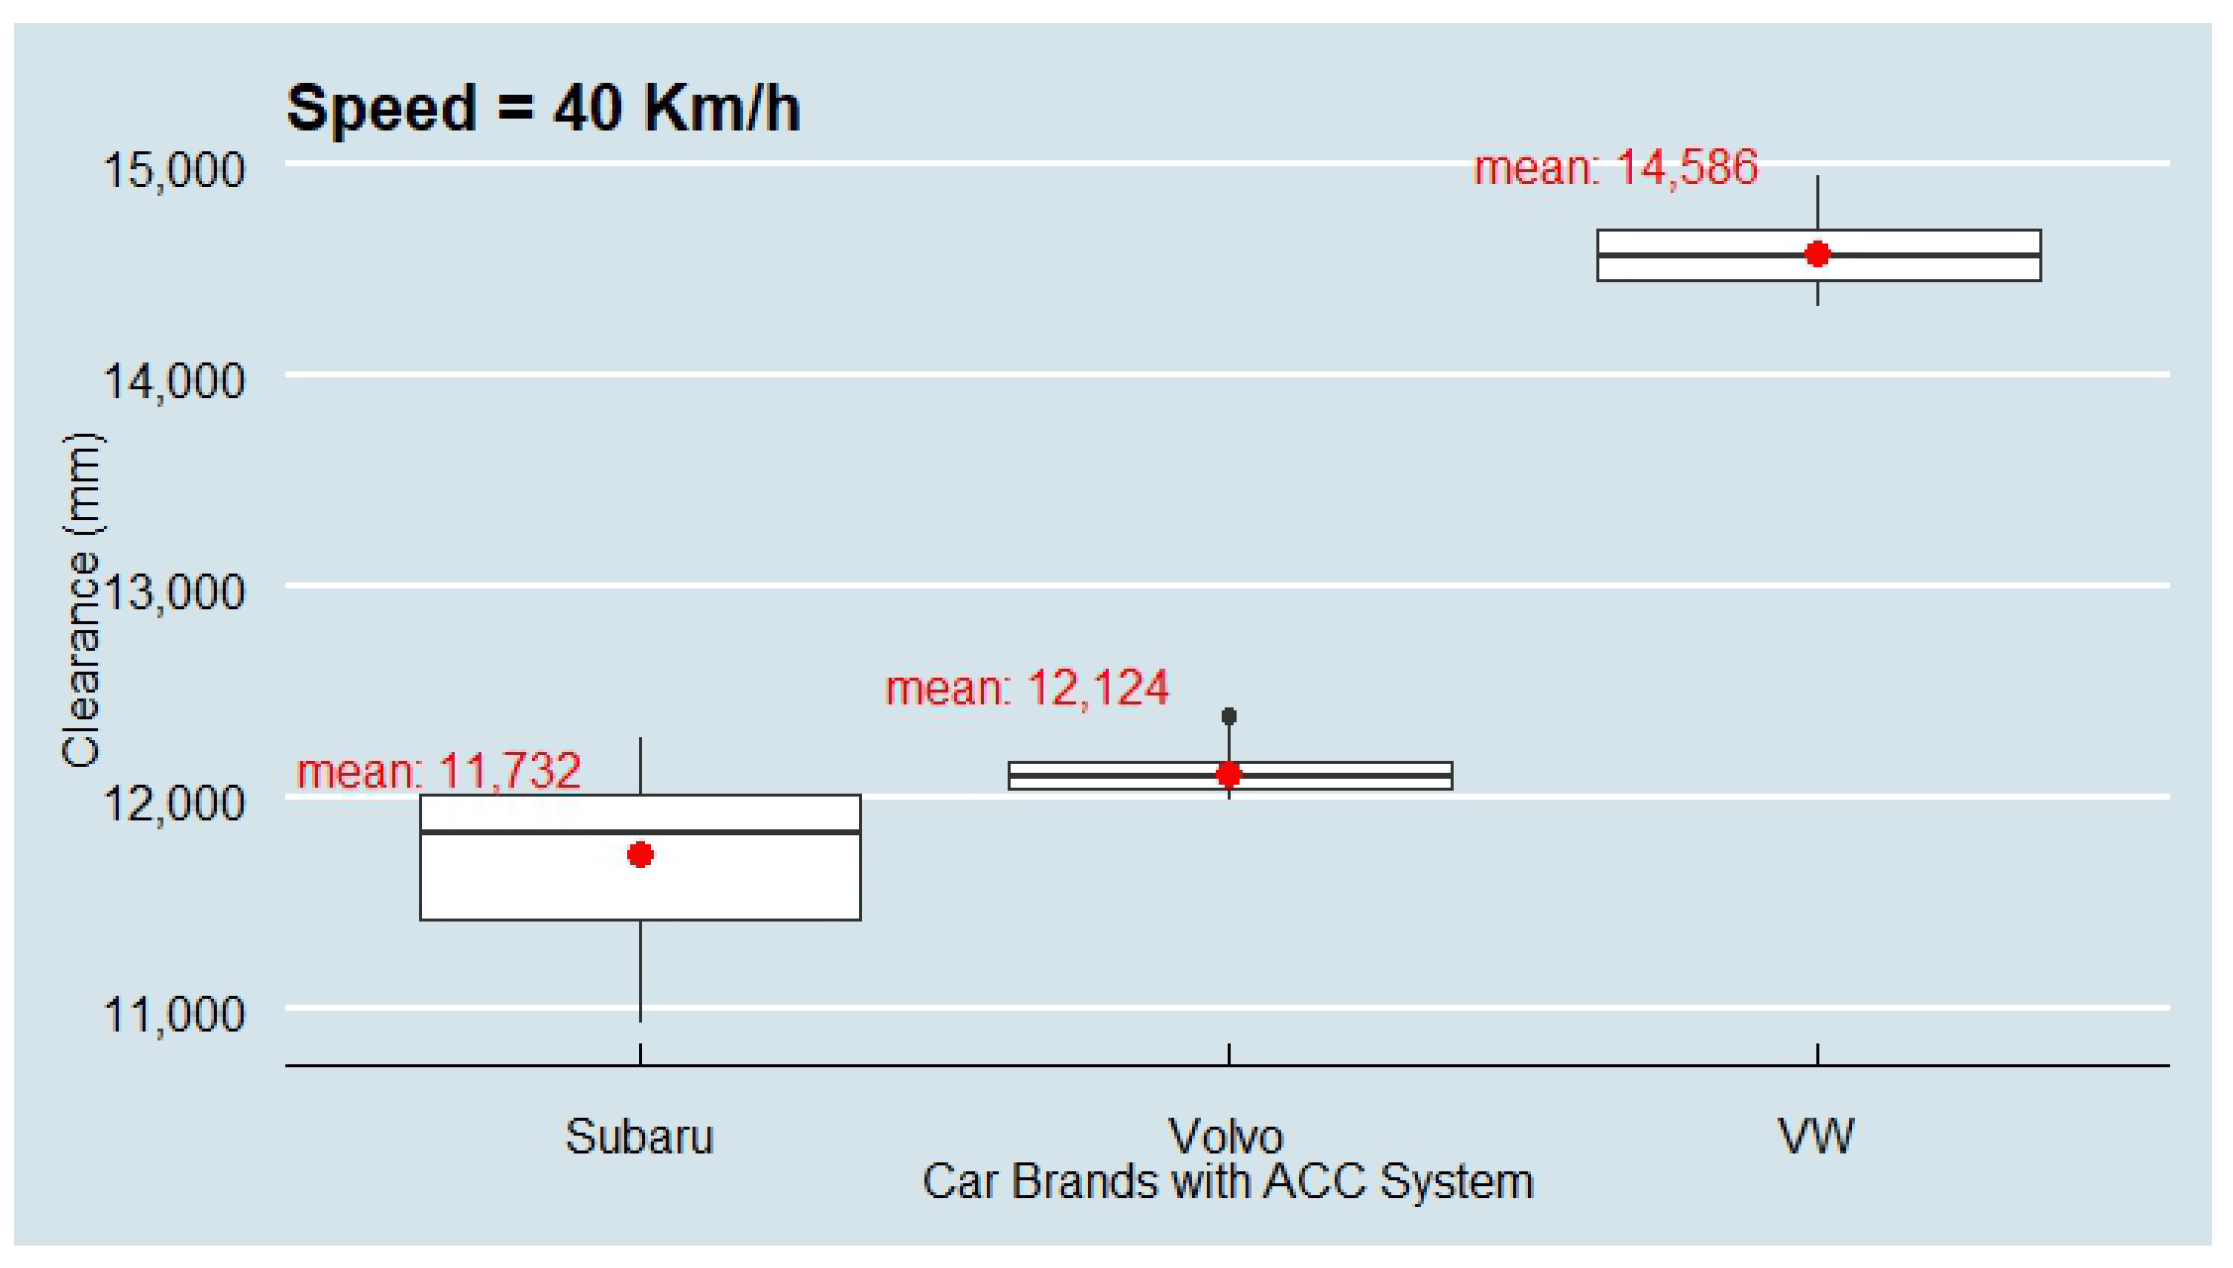
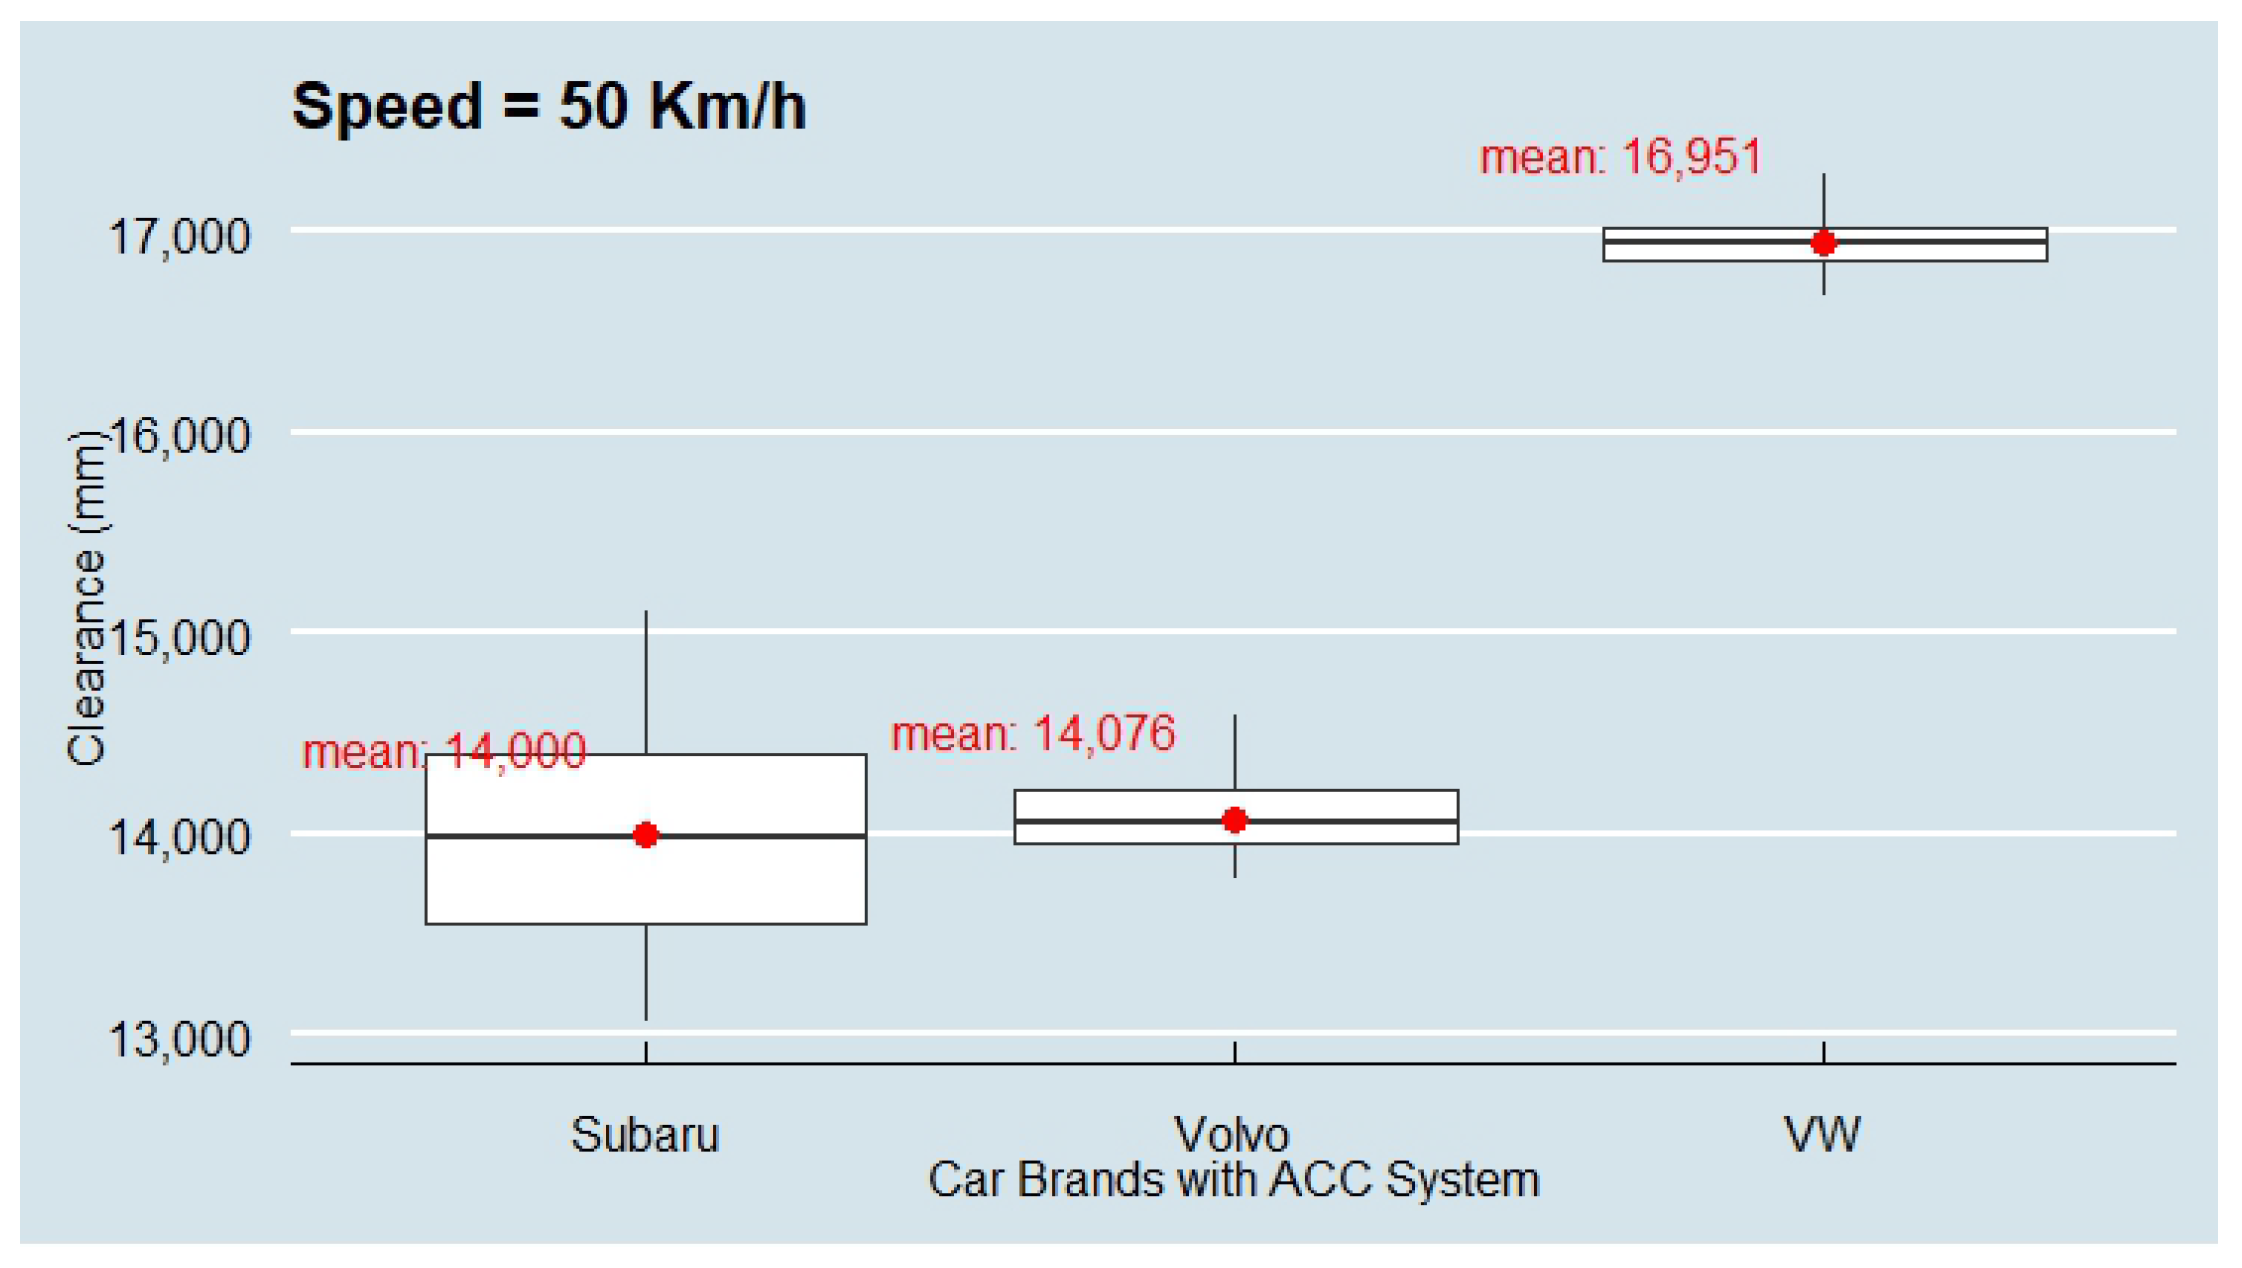
Figure 4 illustrates that Subaru achieved the shortest following distance, measuring 11,732 mm, at a driving speed of 40 km/h, while Volvo achieved the second shortest average clearance with 12,124 mm. By increasing the speed, the clearances generated by Subaru became very close to those of Volvo, at 50 km/h, where they showed an average clearance of 14,000 and 14,076 mm, respectively as shown in
Figure 5. VW, on the other hand, was at a safer distance during all low speeds in which the symmetry of the distribution increased and the three measures of central tendency converged on almost the same value.
Medium speed range analyses are shown in
Figure 6,
Figure 7 and
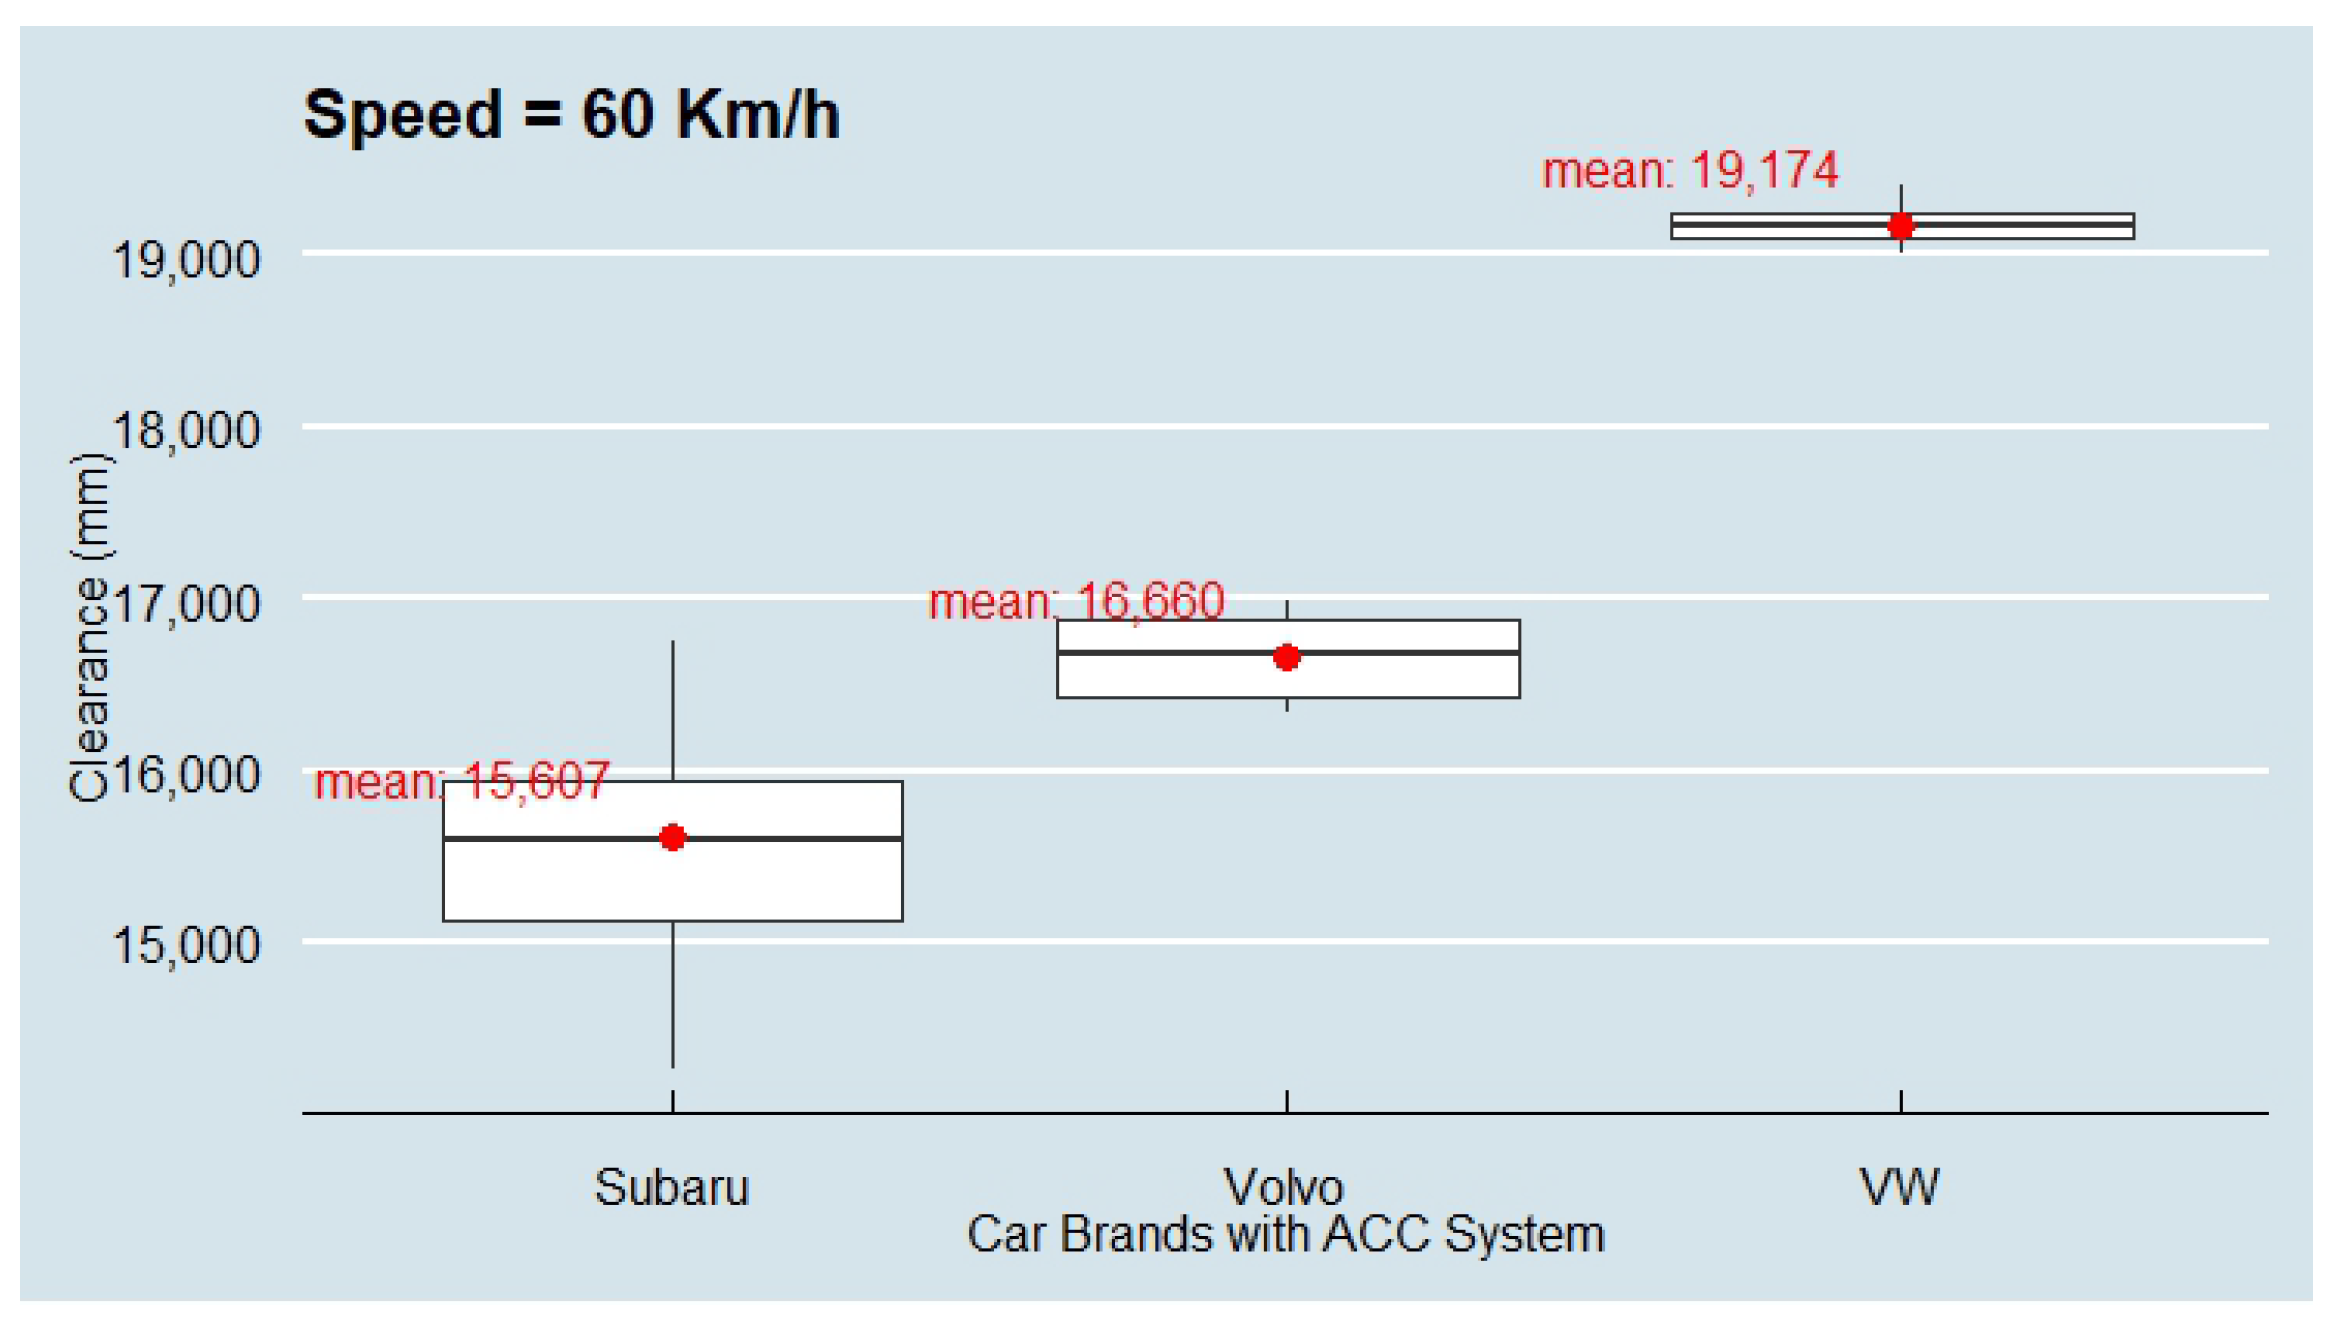
Figure 8, where the clearances for all vehicles are gradually increased in a steady state. At these speeds, Subaru seems to have more aggressive driving behavior than the others. The camera-based ACC for Subaru, which is referred to as “Eyesight”, has only left average clearances ahead of 15,607 mm at 60 km/h, as shown in
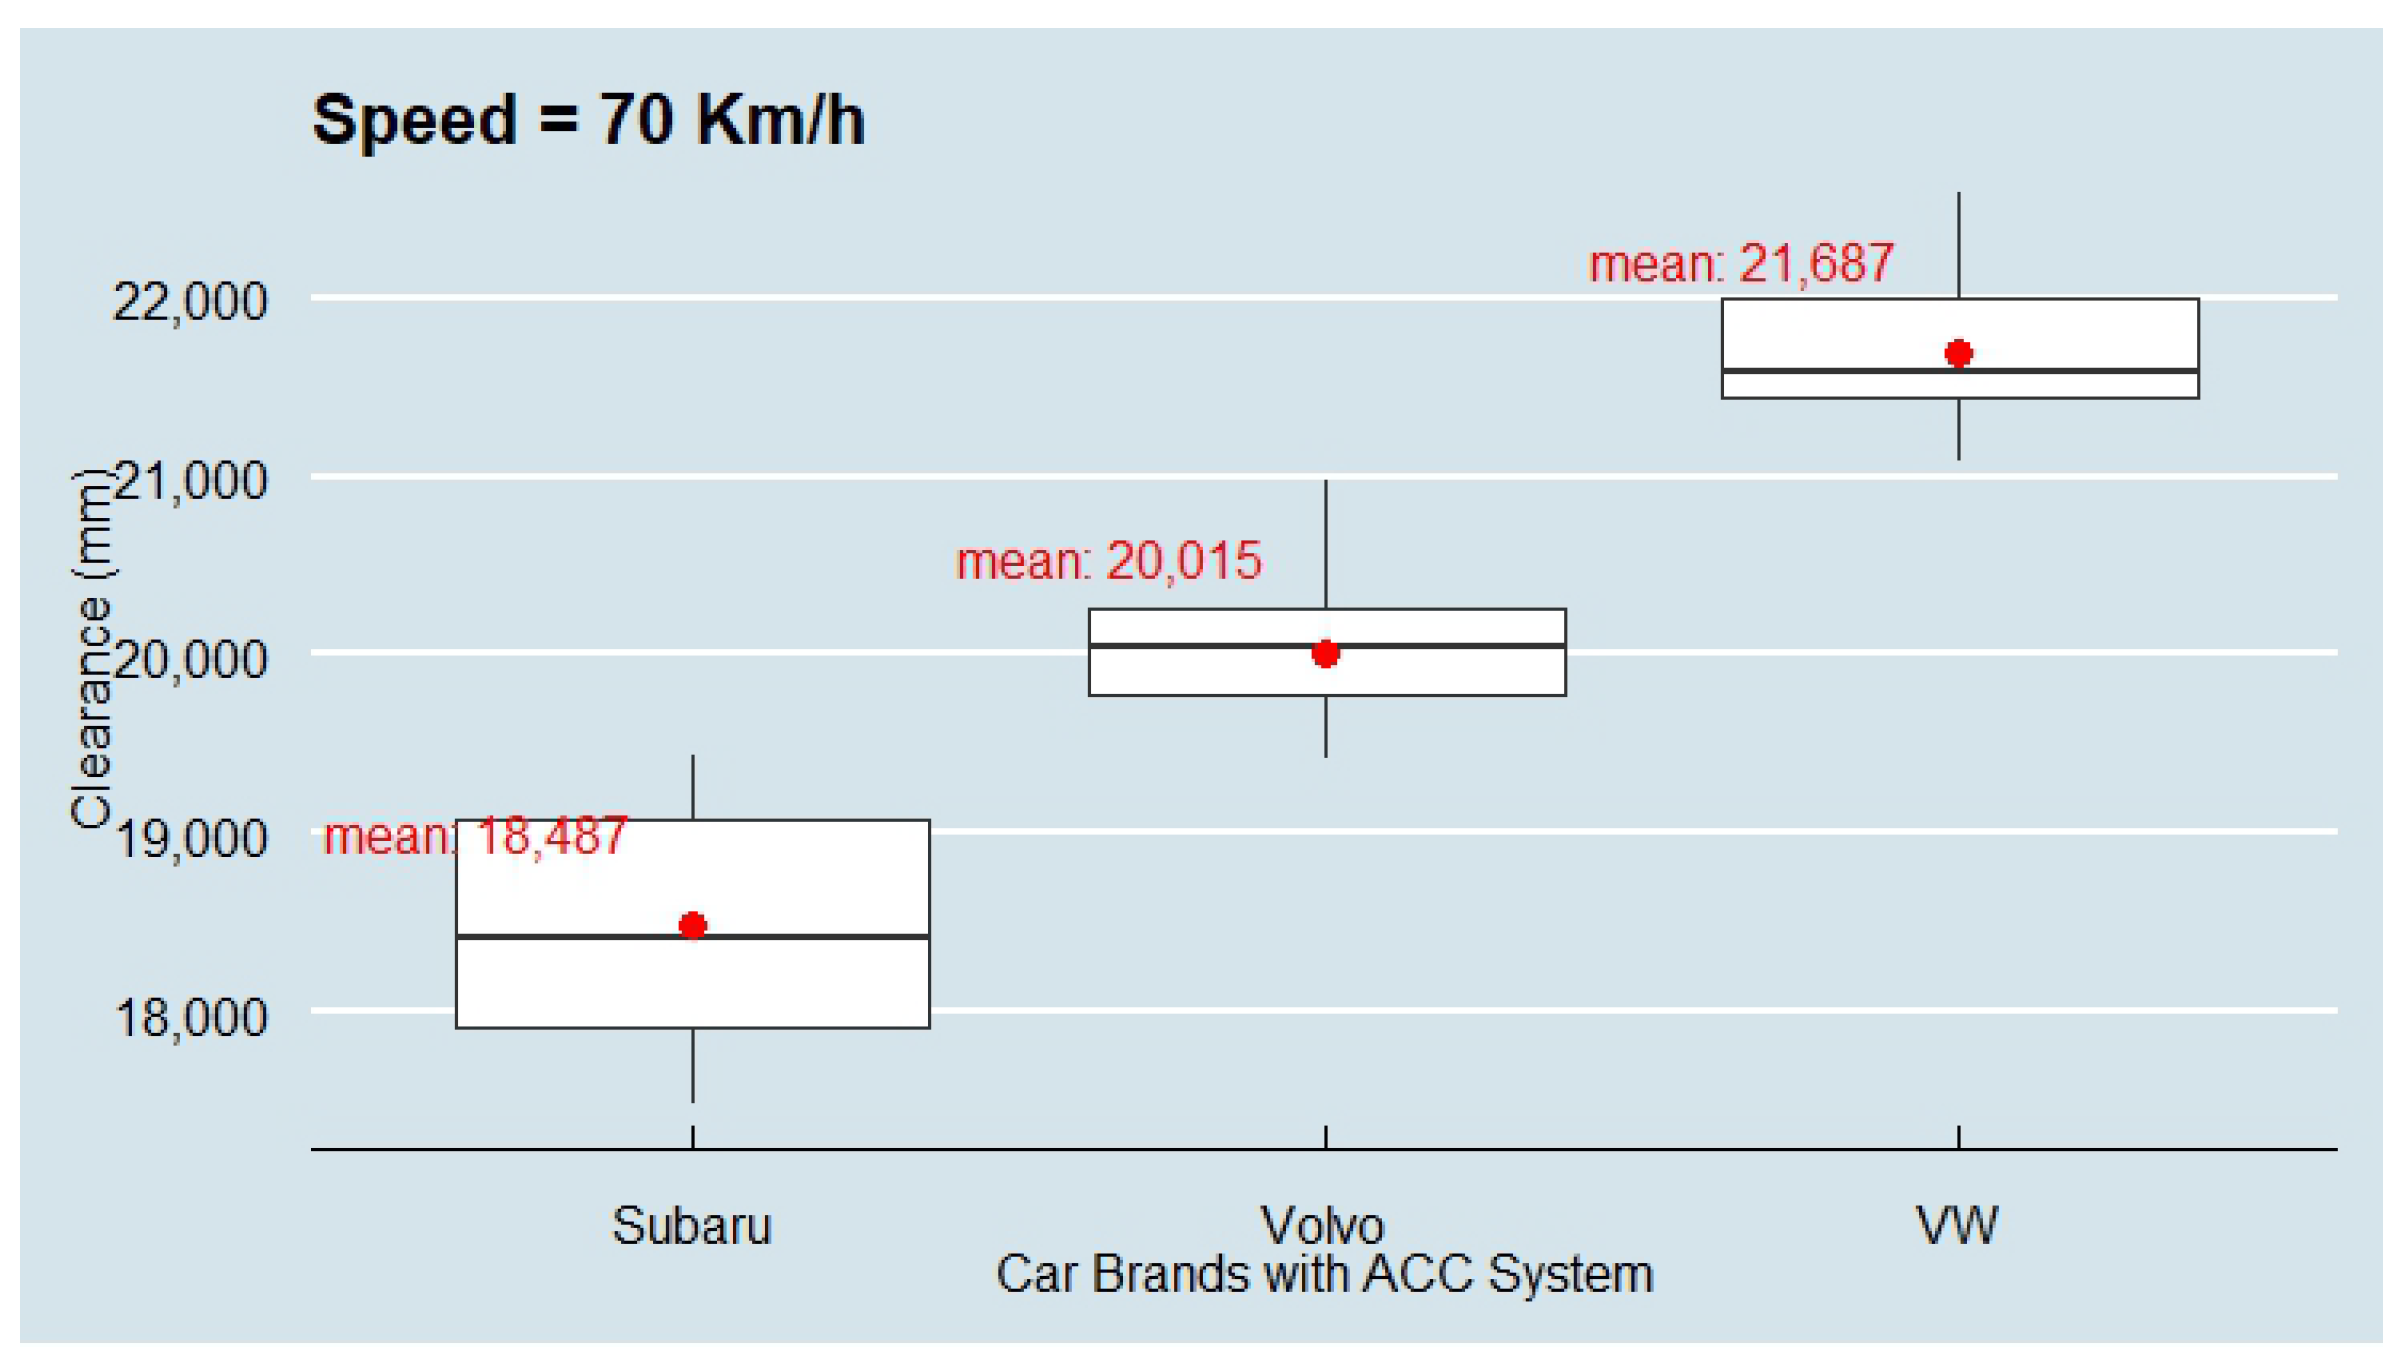
Figure 6. Similarly, Volvo maintained moderate average clearances and stayed in the second order for the three driving speeds at this level of the test, while VW still provides the higher distances for the test speeds so far. At 70 km/h,
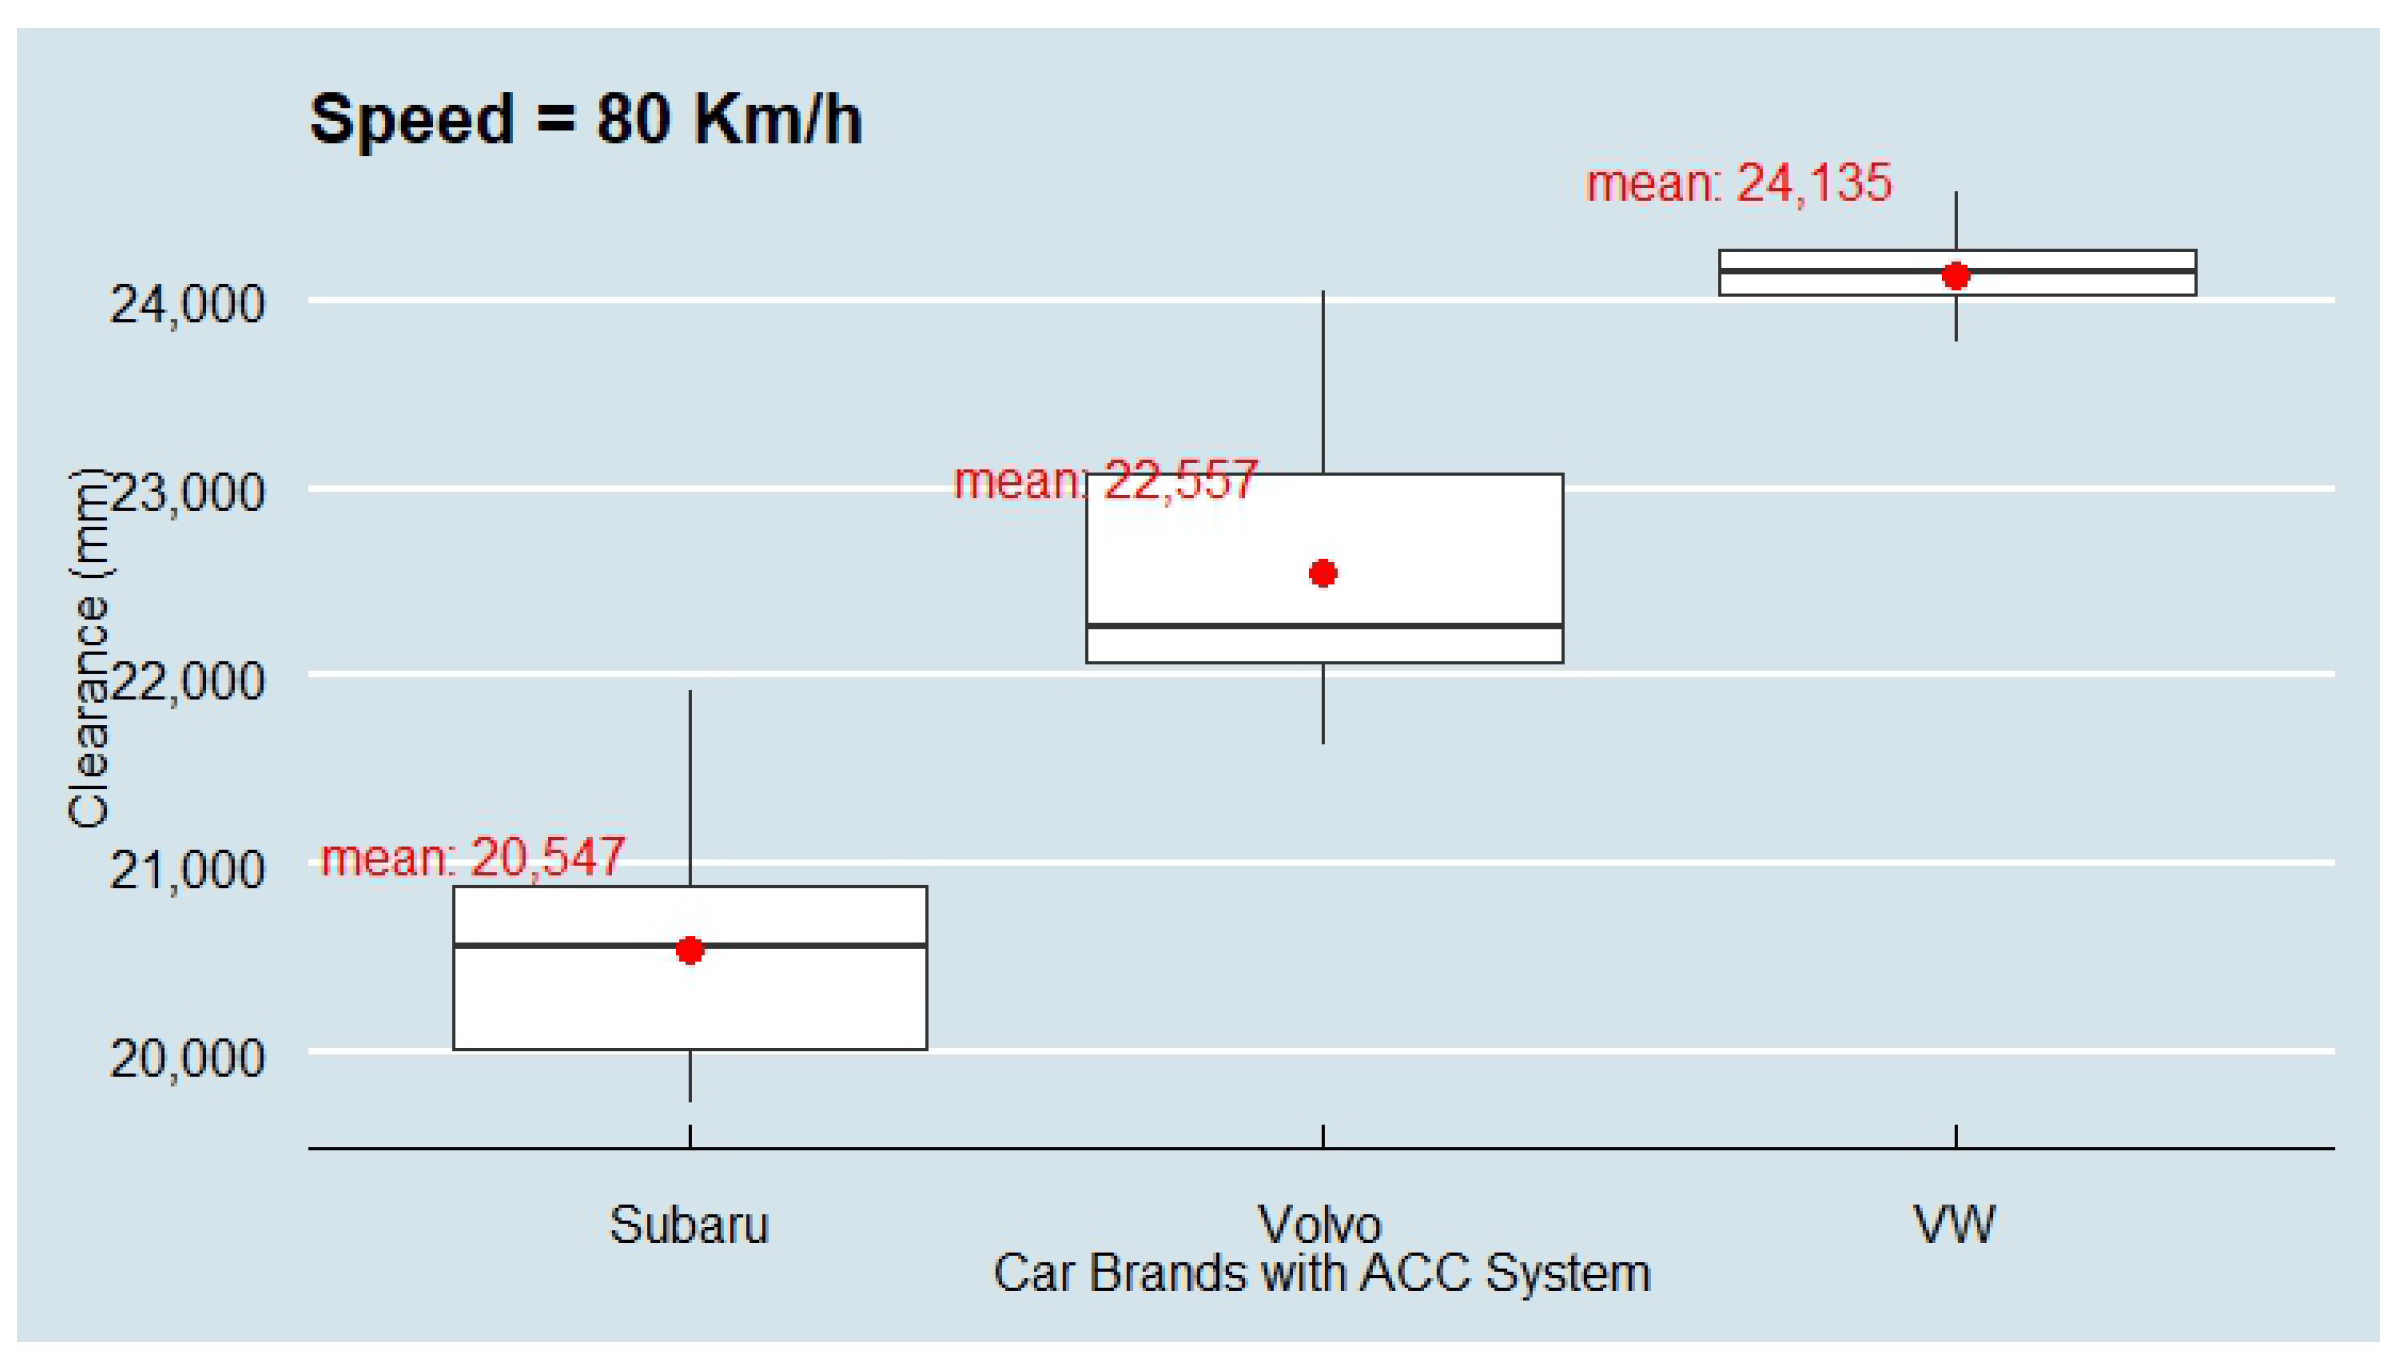
Figure 7 shows a consistent, steady increase in average following distances for Subaru, Volvo, and VW, with measurements of 18,487 mm, 20,015 mm, and 21,667 mm, respectively. The boxplot illustrates a higher dispersion level for Subaru compared to the other two vehicles at this speed. This dispersion increases further for Volvo at 80 km/h, while VW maintains a tight measurement around the mean, as depicted in
Figure 8.
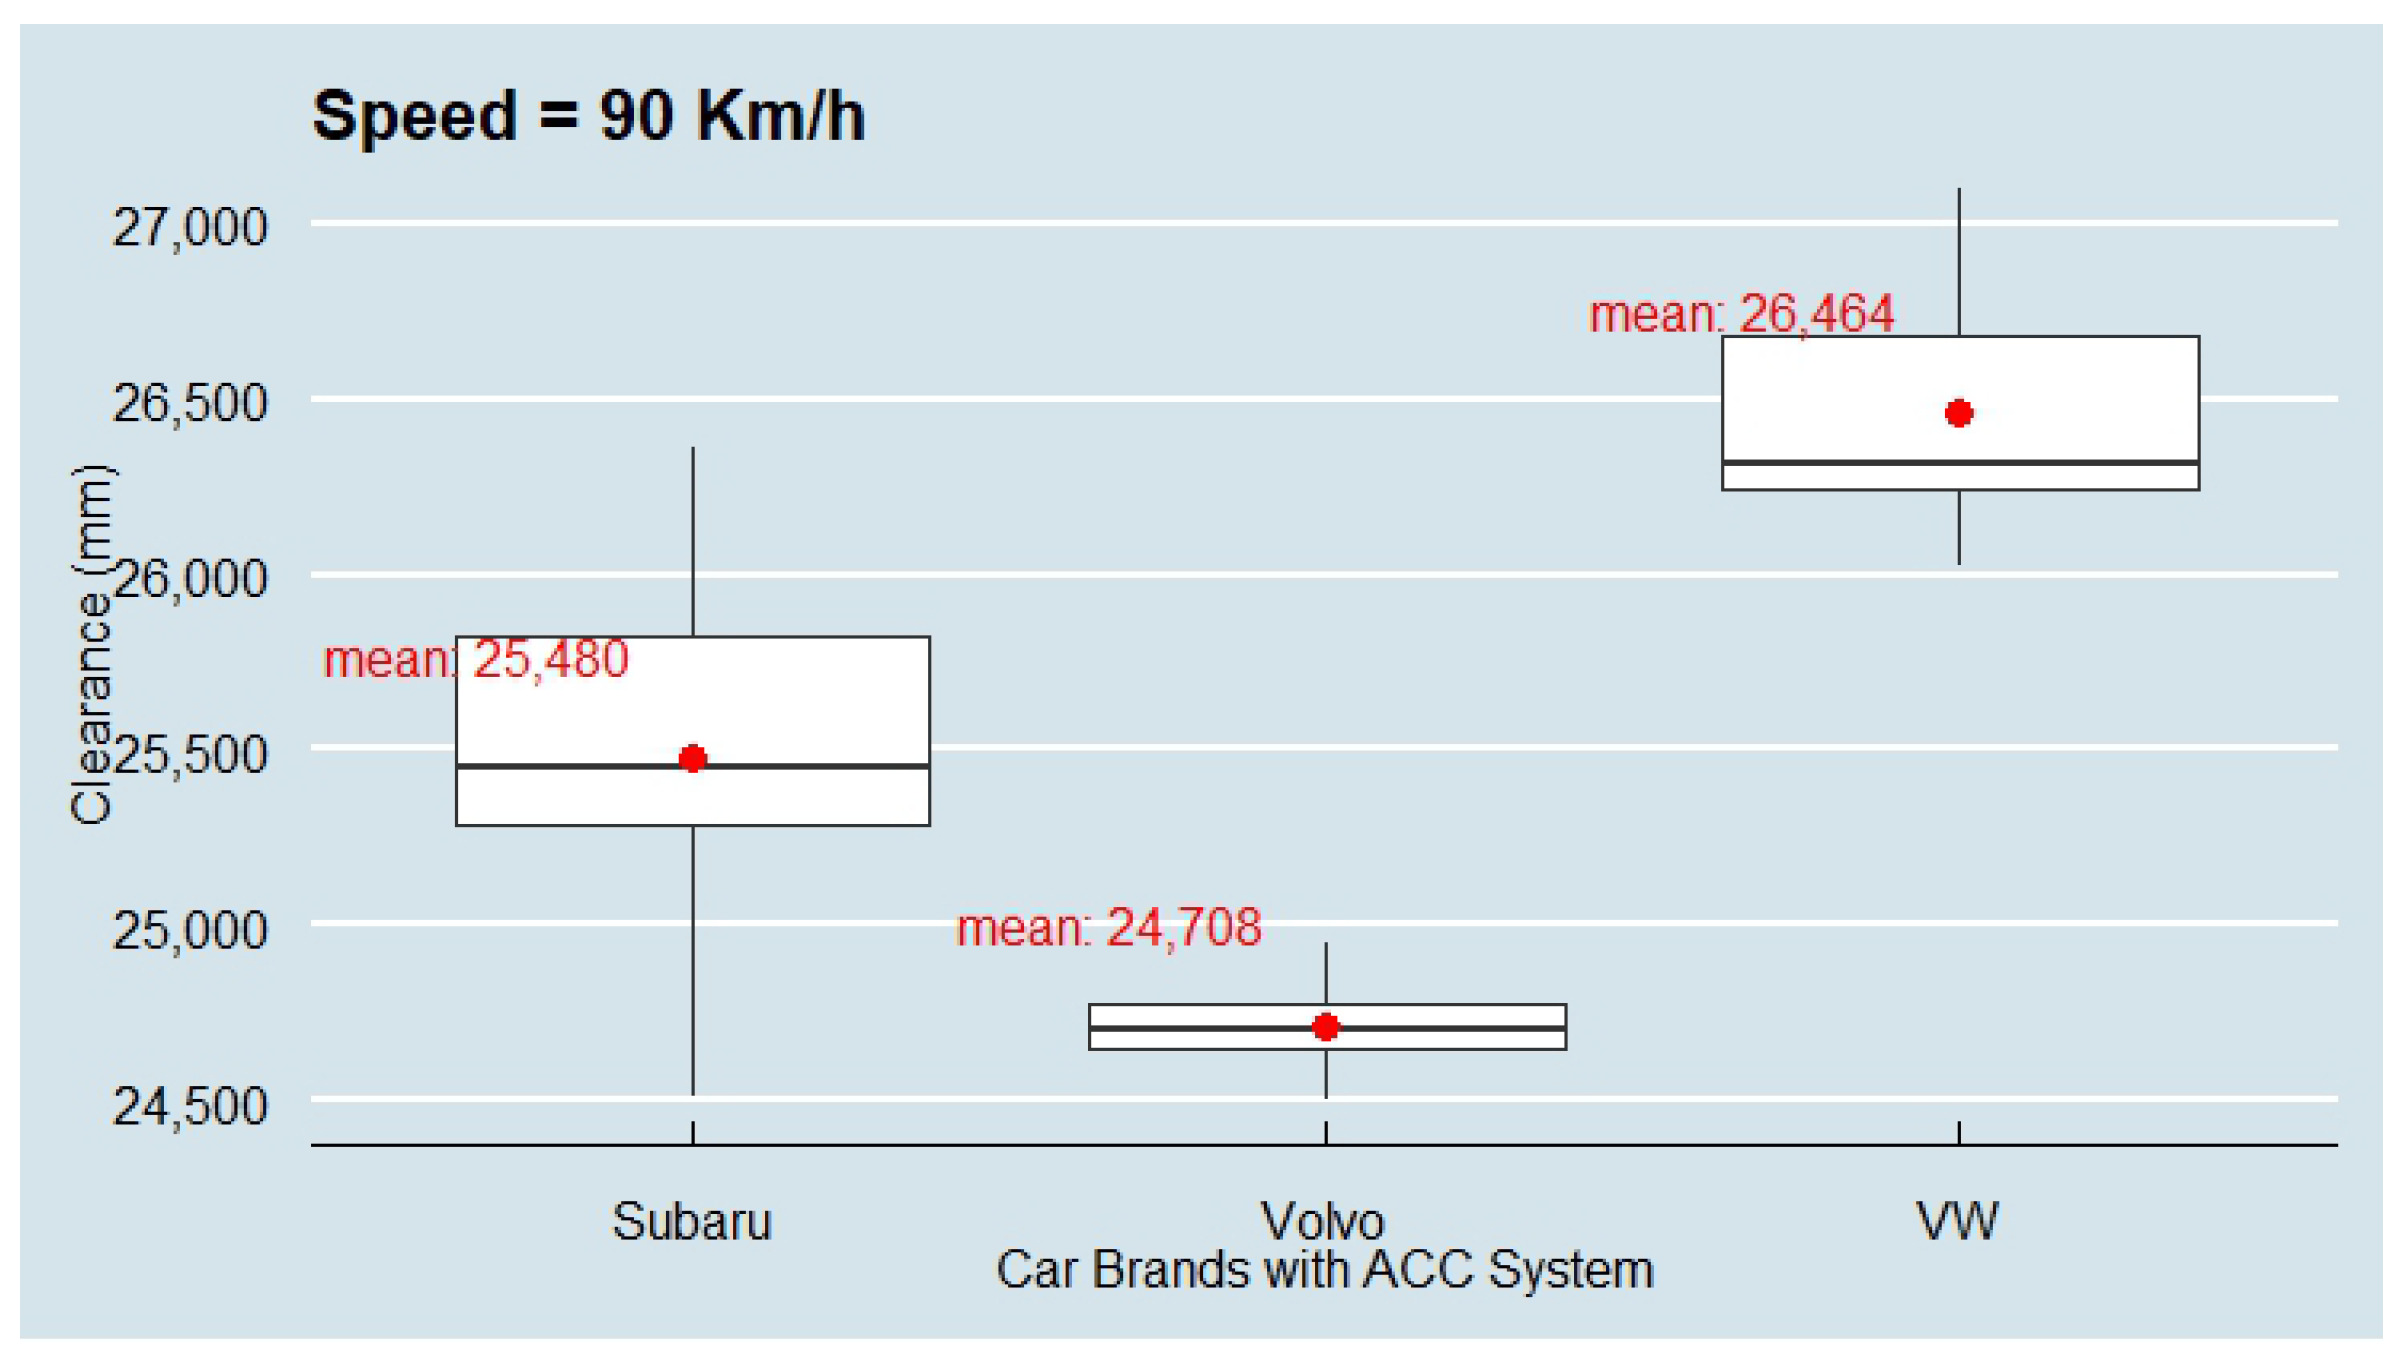
In
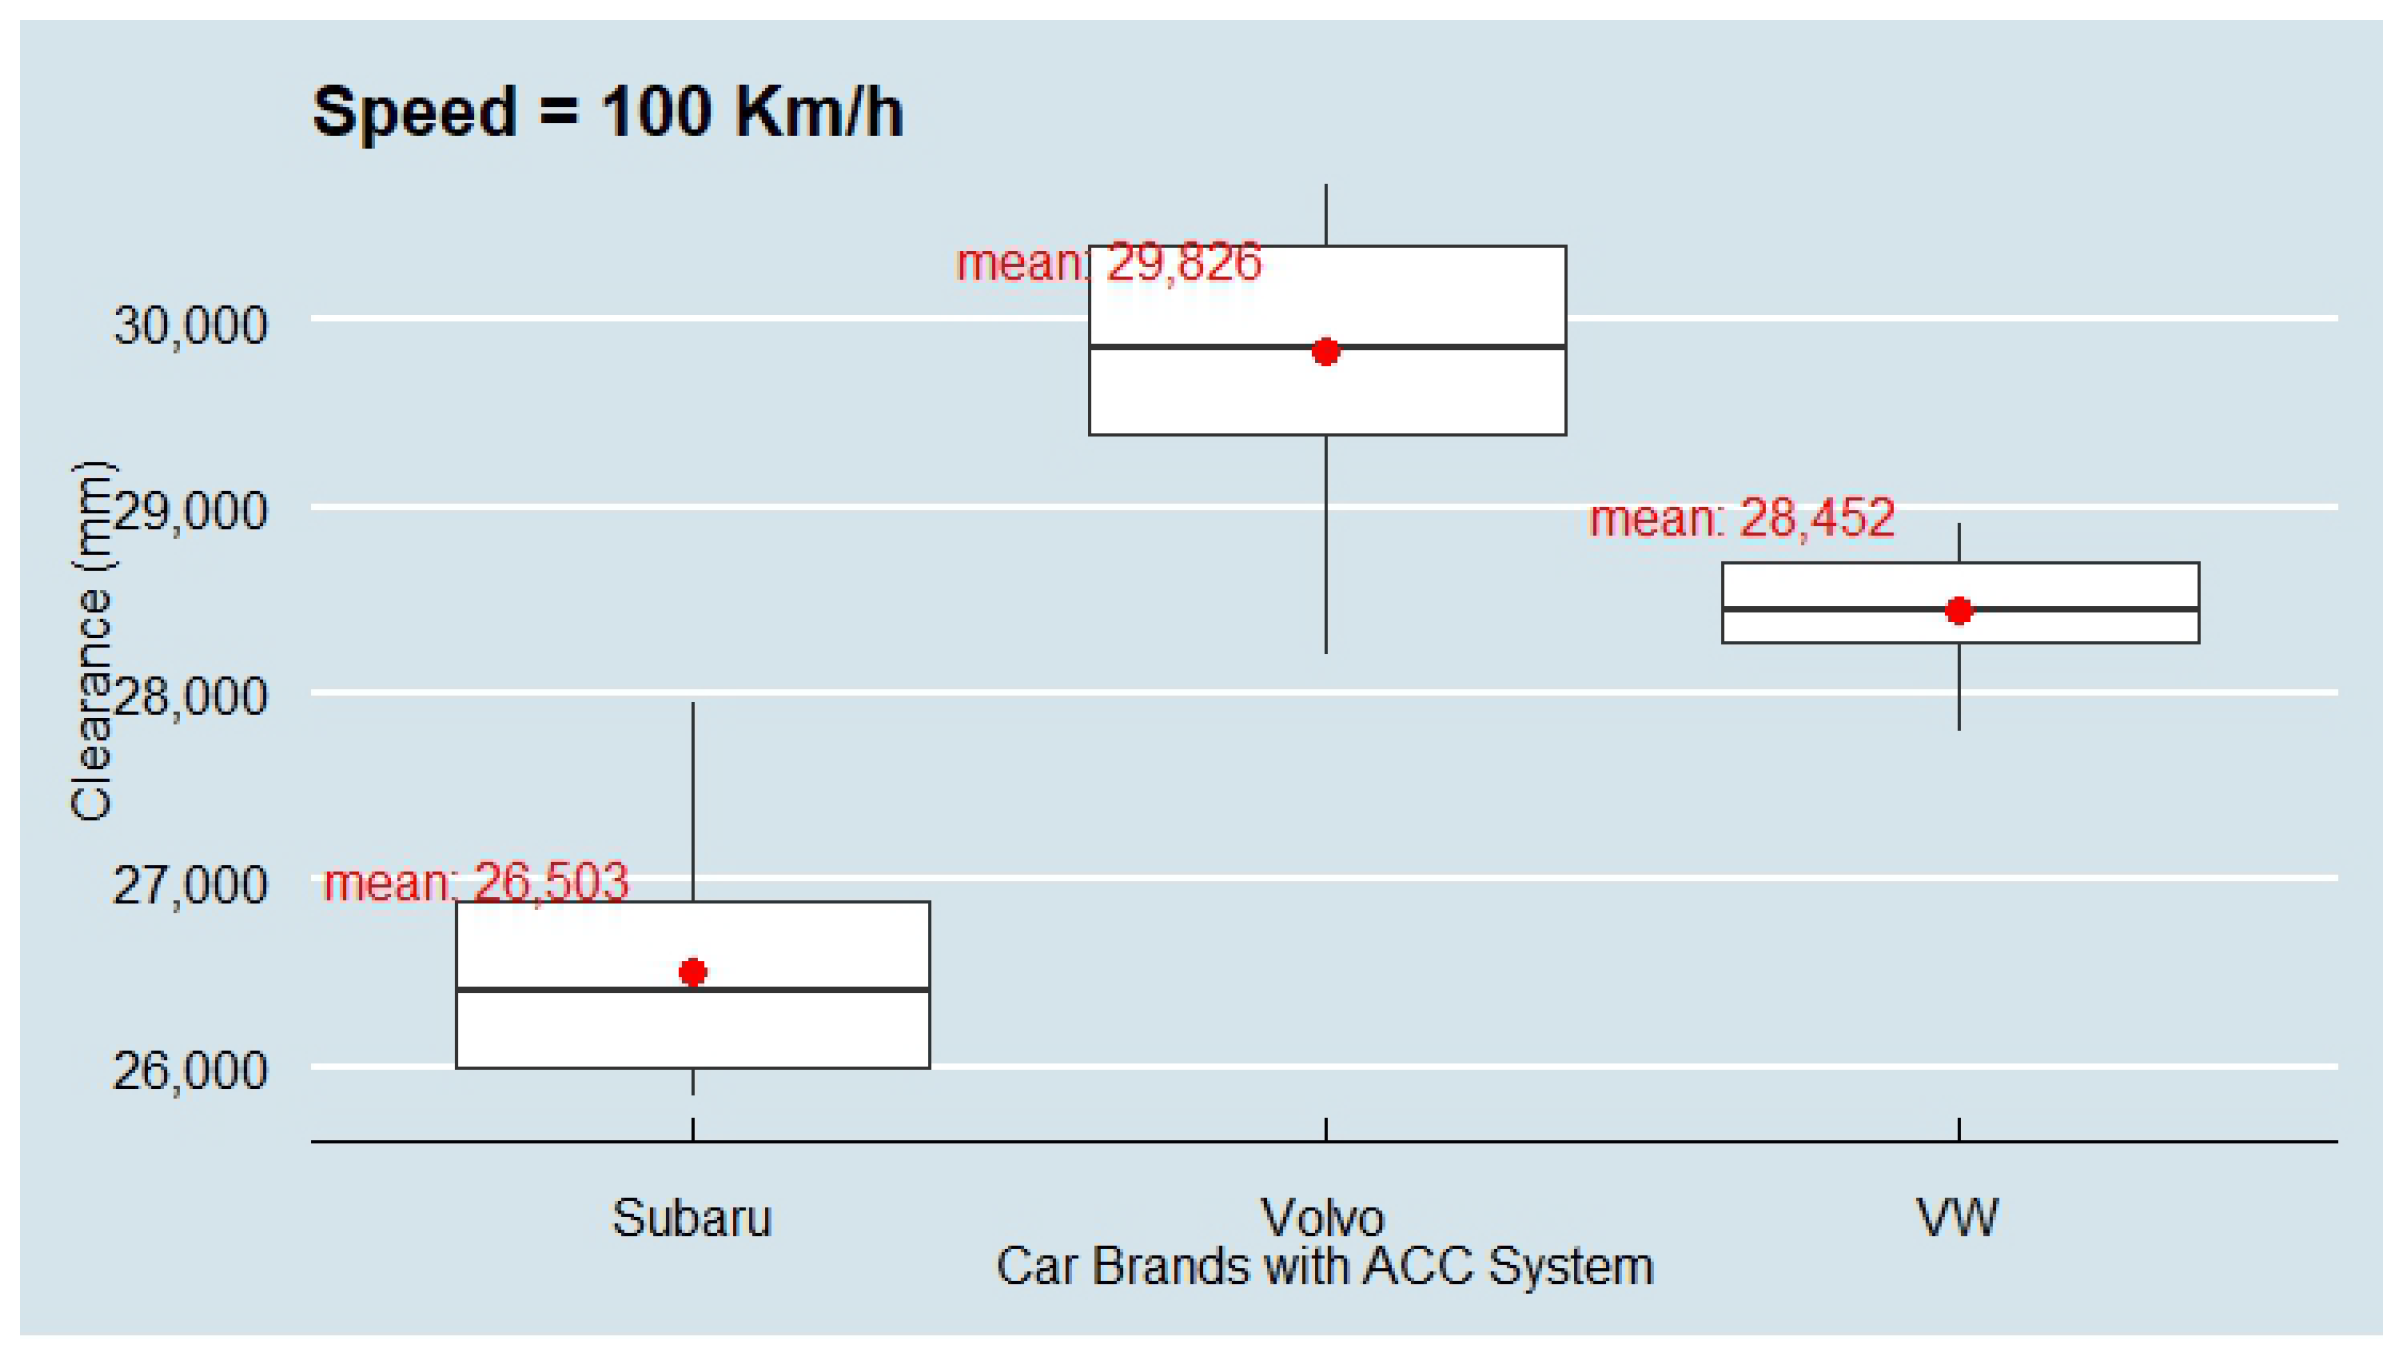
Figure 9 vehicles were driven at high-speed ranges in which a remarkable fluctuation for the clearances of the following vehicles occurred. At 90 km/h, Volvo was much closer to the preceding vehicle than others with only 24,708 mm. Later, by increasing the speed to 100 km/h, Subaru again took the lead as providing the minimum following distance by an average of 26,503 mm. VW provided the second shorter distance with 28,452 mm, followed by Volvo with 29,826 mm, as shown in
Figure 10.
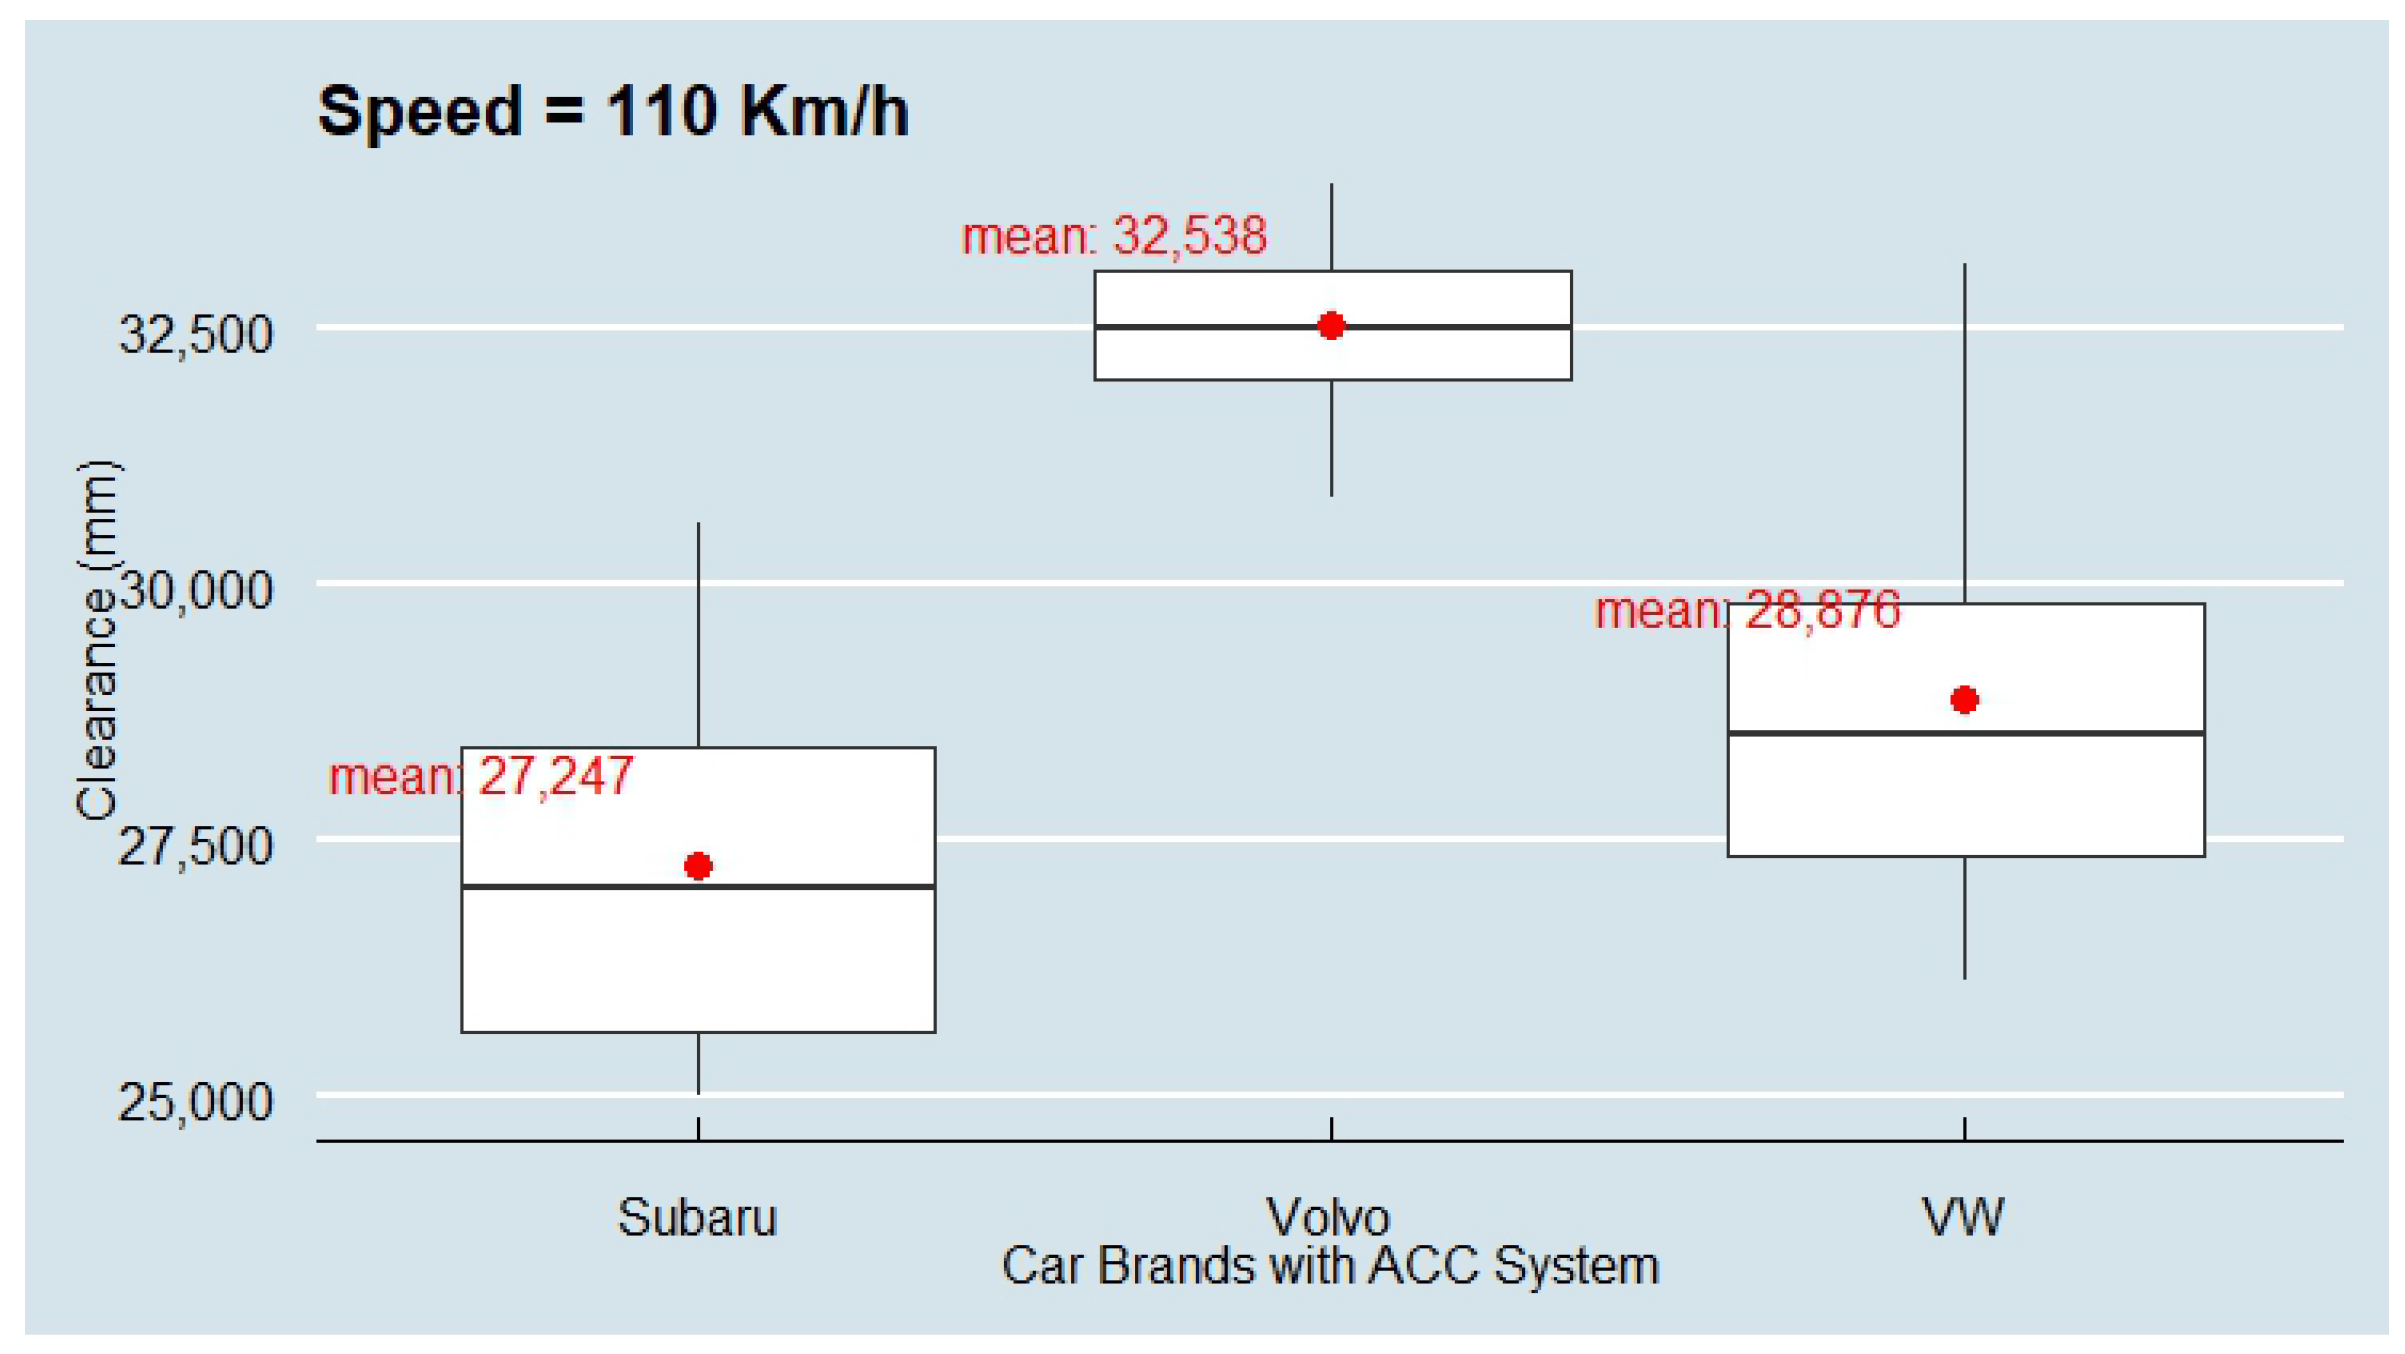
Figure 11 depicts a noticeable divergence of the center that appeared on VW and Subaru’s measurements at 110 km/h.
Regarding average clearances, Subaru emerged as the top performer, with the narrowest average clearance of 27,247 mm. Following closely behind Subaru, VW secured the second position with a slightly wider but still commendable average clearance of 28,876 mm. However, it was Volvo that achieved the highest average clearance of 32,538 mm, suggesting a less optimal performance in maintaining safe distances during the experiment. Overall, this reordering reflects the varying degrees of effectiveness and adherence to safety protocols among the tested vehicles, with Subaru demonstrating the most efficient performance in maintaining close yet safe following distances.
Finally, all of the observed measurements from the field test have been collected to make it easier to conduct a comparison between the data obtained from driving at the minimum test speed until reaching the maximum test speed.
Table 4 shows the mean and standard deviation of the measured distance clearances between the following vehicles for all scenarios. In addition, the time gaps between two successive vehicles have also been shown in the same table. These values were simply calculated by dividing the average clearance by the corresponding driving speed for each vehicle. However, this variable is considered to be very important to compare our study results with other research works.
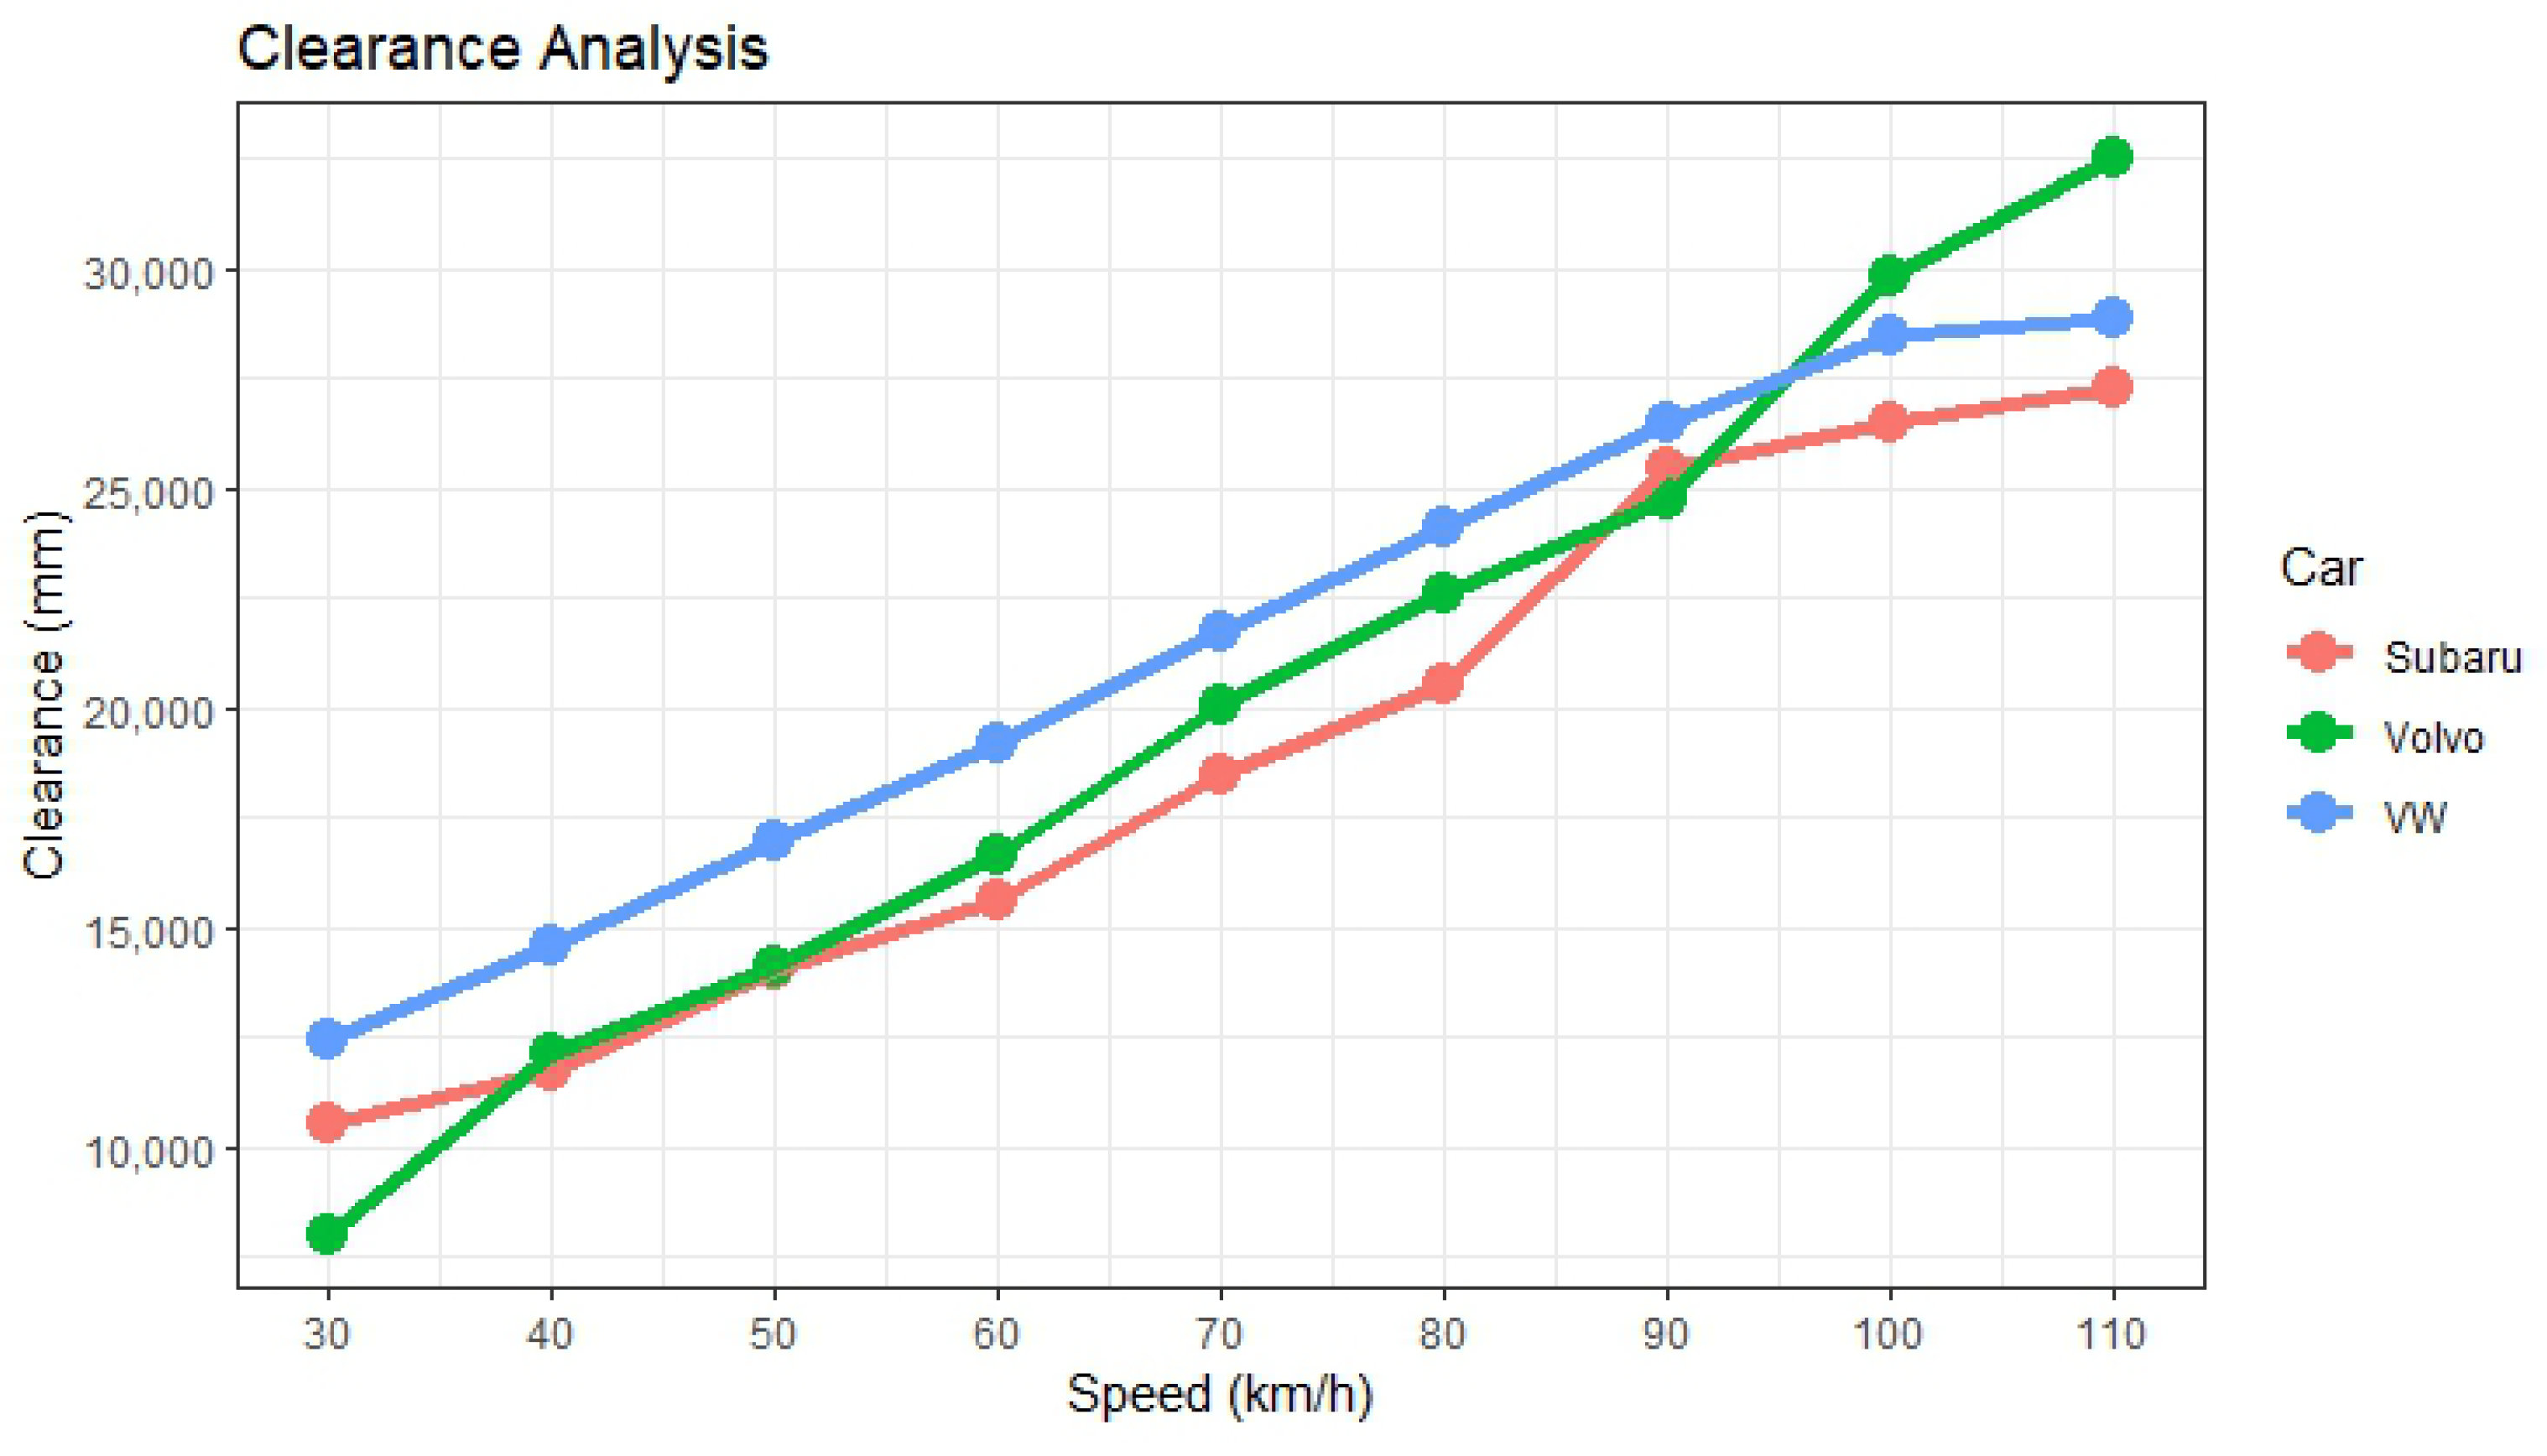
Figure 12 and
Figure 13 illustrate the impact of different speeds on ACC measurements.
Figure 12 shows the relationship between clearance and speeds across the Subaru Levorg, Volvo XC40, and VW E-Golf, revealing distinctive patterns in their adaptive cruise control behaviors. Firstly, as speed increases, all three models exhibit a corresponding rise in clearance with the preceding vehicle. The Subaru Levorg, although displaying a consistent increase in clearance, tends to maintain the lowest clearance values across the range of speeds, suggesting a more conservative approach to following distances. Meanwhile, the Volvo XC40 consistently maintains higher clearance values than the Subaru Levorg, indicating a more cautious approach to maintaining safe distances. Notably, the VW E-Golf consistently exhibits the largest clearances among the three models, suggesting a tendency towards maintaining relatively greater distances from the vehicle ahead, especially at higher speeds. This pattern suggests differing strategies employed by each car’s adaptive cruise control system, potentially reflecting manufacturer-specific safety priorities and driving styles.
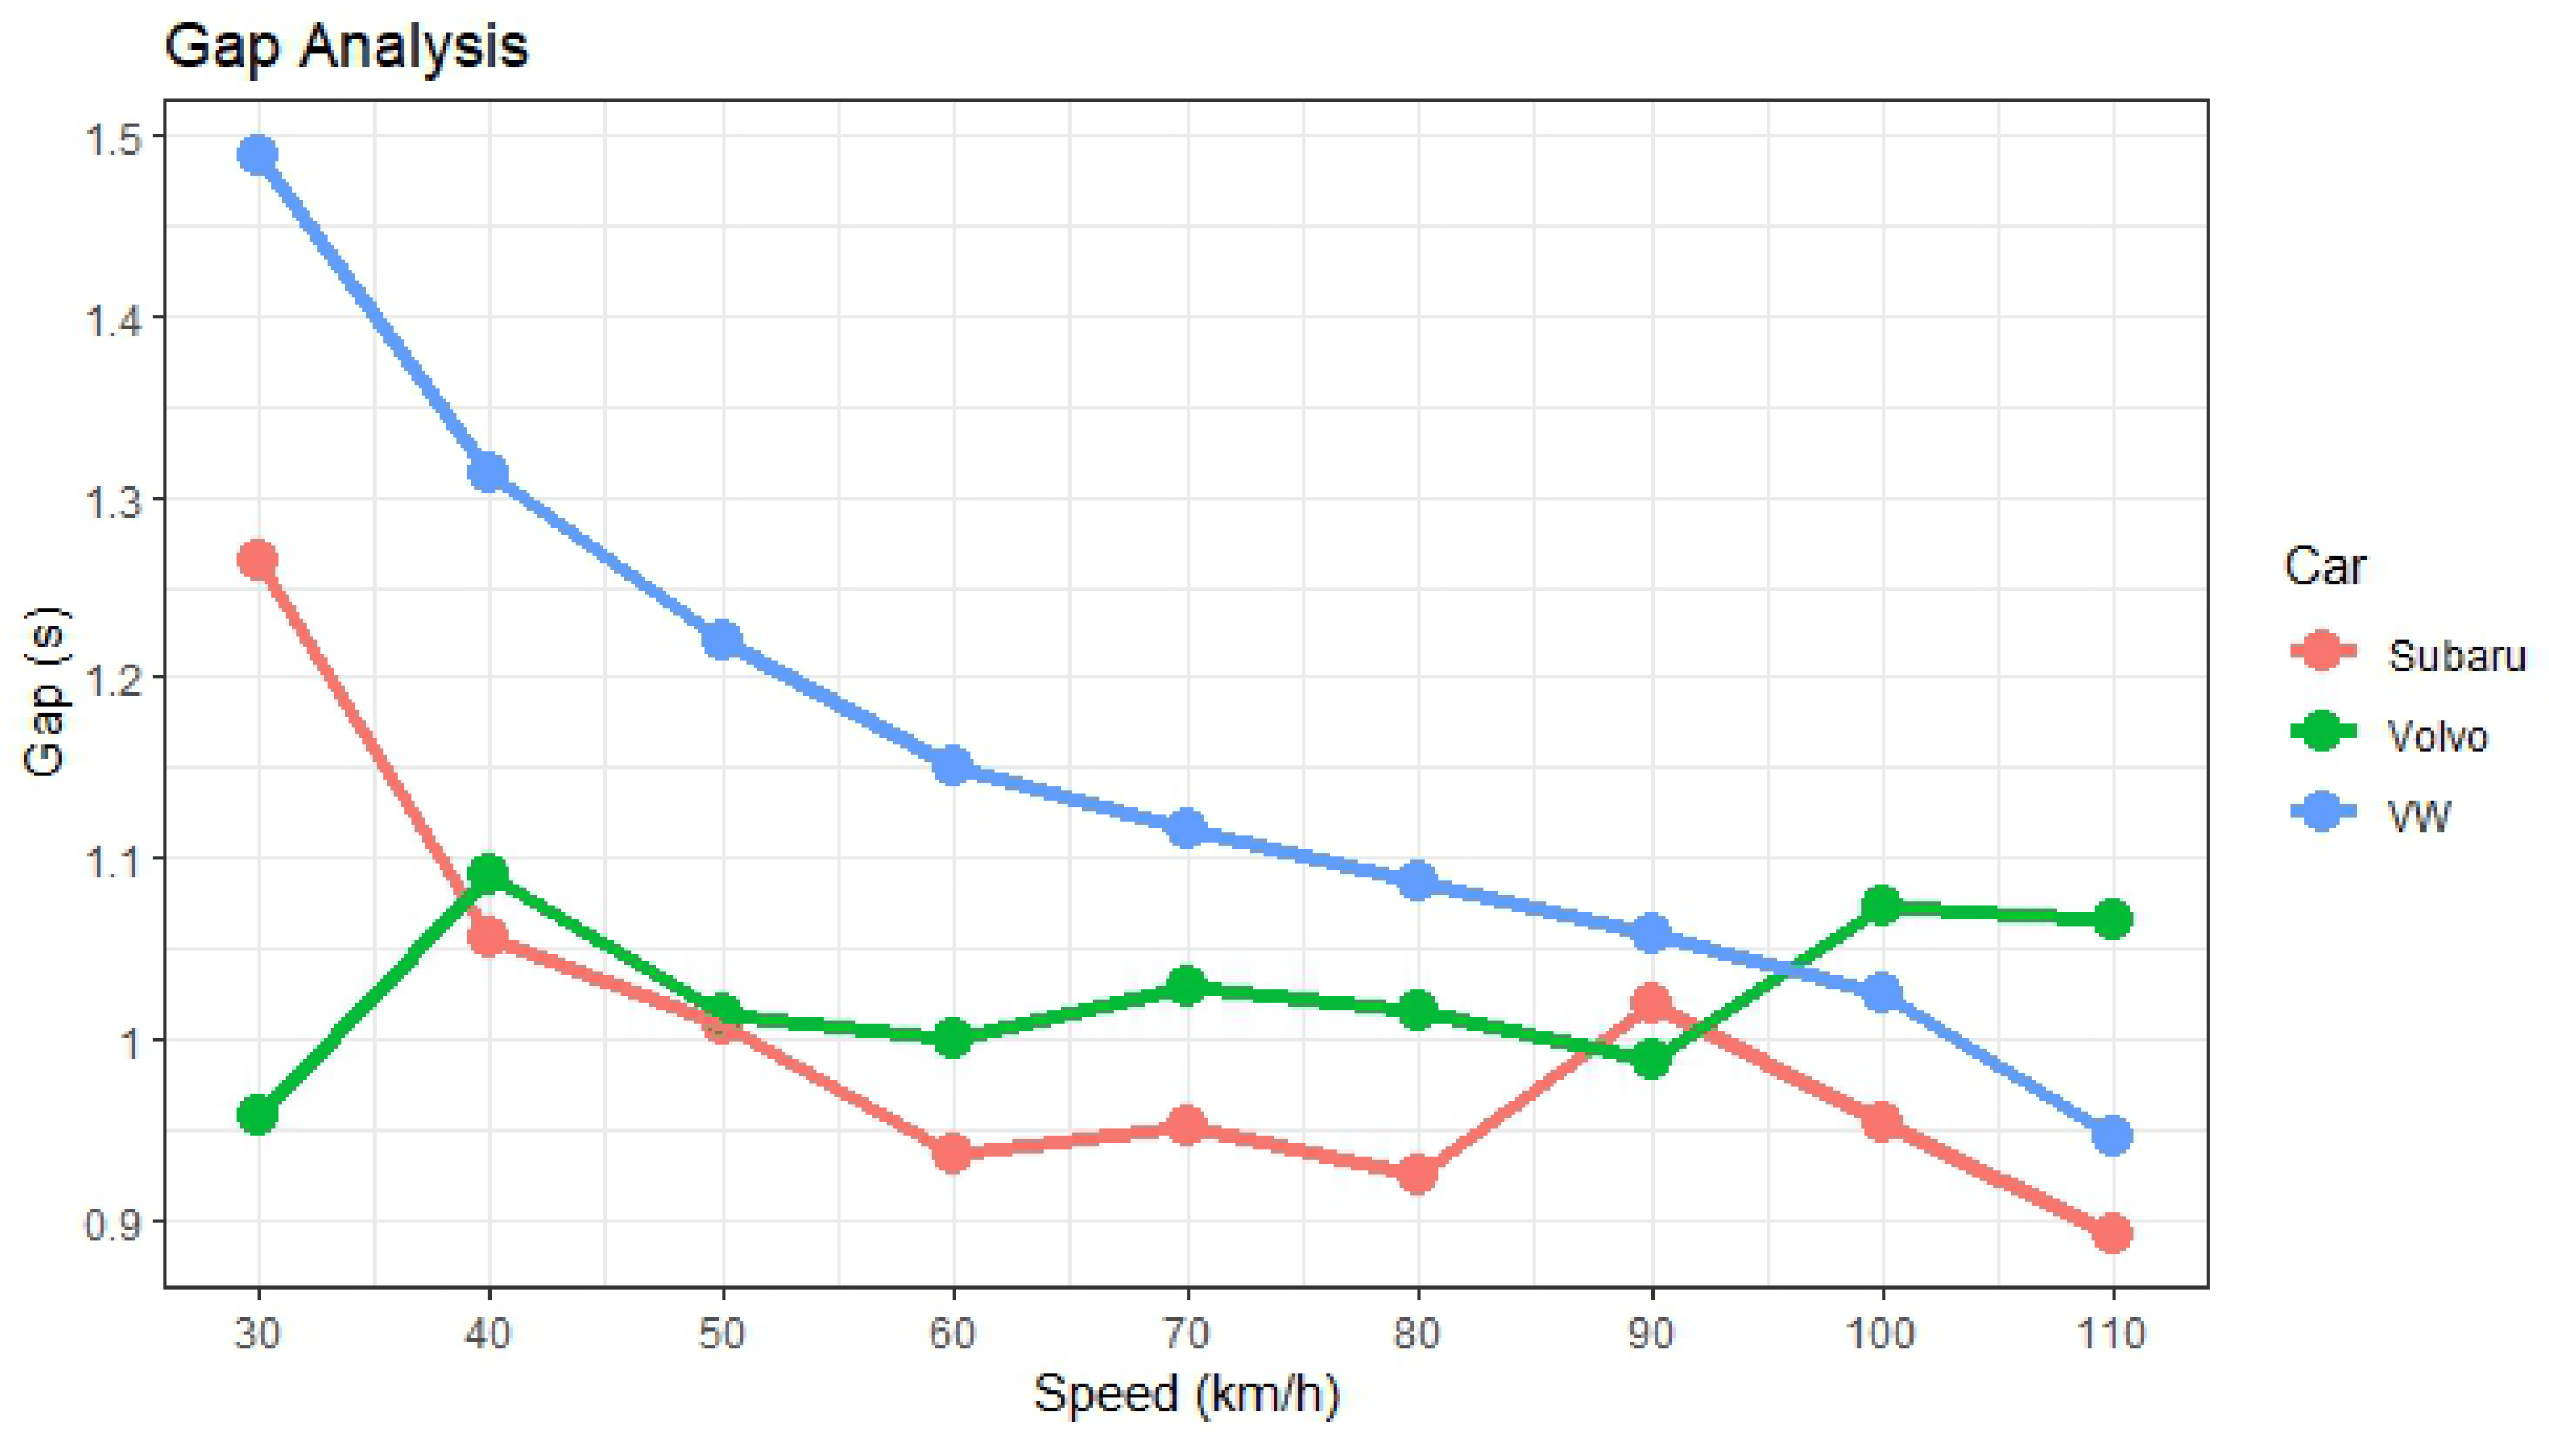
Similarly,
Figure 13 illustrates the relationship between gaps and speeds, in which notable trends emerge across the three car models. As speed increases, all three models exhibit a decrease in the time gap between vehicles. However, each model maintains distinct characteristics in gap management. The Subaru Levorg consistently displays shorter time gaps compared to the Volvo XC40, indicating a more proactive adjustment of following distances as speed increases. Conversely, the Volvo XC40 maintains larger time gaps across all speeds, suggesting a more conservative approach to maintaining distances between vehicles. Notably, the VW E-Golf tends to maintain intermediate time gaps between the Subaru Levorg and Volvo XC40, suggesting a balance between proactive distance management and maintaining a safety buffer. These findings underscore the nuanced differences in adaptive cruise control systems among the three car models, reflecting varying approaches to ensuring driver safety and comfort in different driving conditions.
In summary, during our experiment testing the performance of ACCs, it is important to consider key points regarding the precision of results at higher speeds.
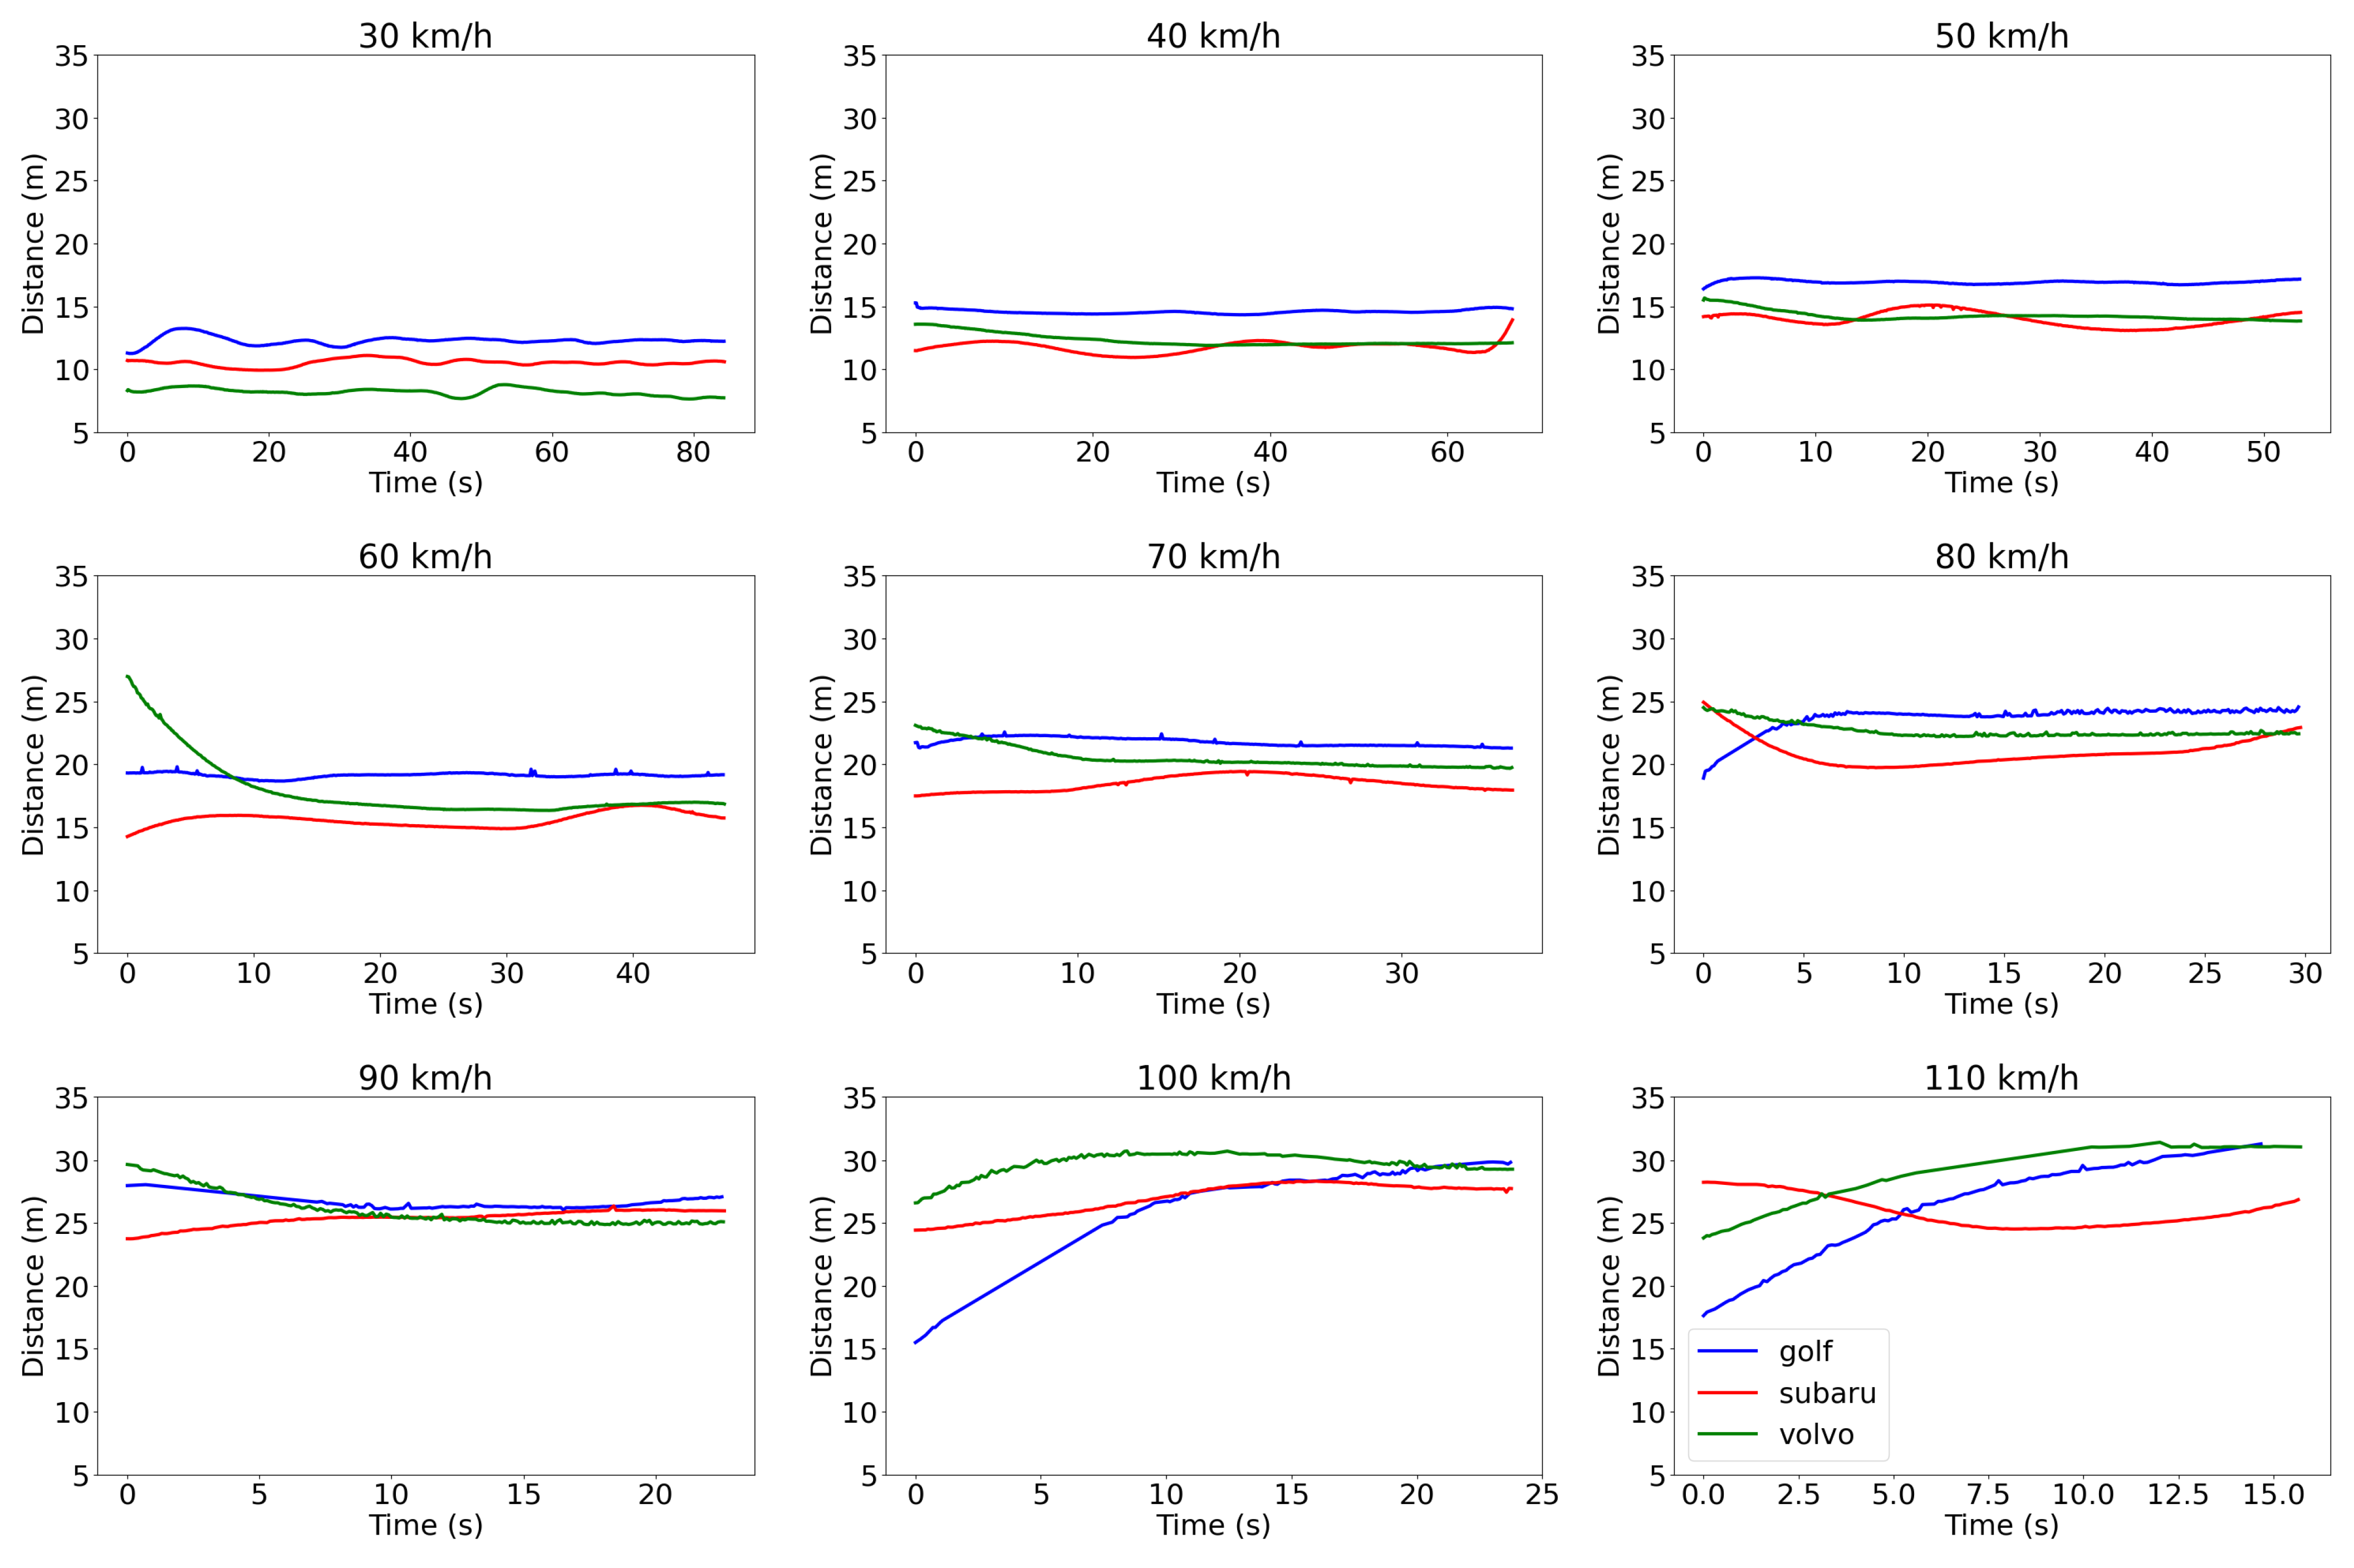
Figure 14 displays the duration of each test conducted at varying speeds. For low and medium speed tests, a reasonable duration was observed, allowing sufficient time to extract acceleration and deceleration data from the test vehicle. In contrast, at higher speeds of 100 and 110 km/h, it became apparent that the vehicles took some time to stabilize, with data collection durations of approximately 15 and 10 s, respectively, after subtracting the acceleration and deceleration phases. This delay was primarily due to the leading vehicle adjusting its speed before the following vehicle matched its pace. Additionally, the length of the test track may be a critical factor in calculating results at higher speeds. It is worth noting that acceleration behavior is present in some of the test runs because the recording starts when the vehicle begins accelerating to avoid missing measurements. However, deceleration behavior has not been included in the figure for any of the test speeds because the recording ends when the vehicle approaches the end of the track. Despite these challenges, measurements for all of the tested speeds were successfully obtained.
6. Discussion
In this study, controlled field tests were used to gather empirical data in order to examine an ACC system’s actual performance at various driving speeds. As mentioned earlier, the shortest gap setting (setting 1) for all vehicles’ ACCs has been applied to investigate driving safety marginal levels through analyzing distance gaps between each of the two following vehicles. This is also the procedure conducted by [
27,
34] as they indicated that long-distance gap settings leads to frequent cut-in situations by other vehicles. The first exploration of the empirical works revealed that at low and medium speed ranges, all ACC systems show plausible following distances that maintain sufficient pre-collision braking distance in case the preceding vehicle applied brakes suddenly. The study results demonstrated that at these ranges of speed, VW E-Golf following behavior appears to be safer during the test as it provides longer clearances and time gaps. This may return to the efficiency of electric vehicles, which are known for their precise control over acceleration and deceleration, due to the instant torque delivery of electric motors. This allows the ACC system to make very fine adjustments to maintain a consistent following distance. On the other hand, Subaru and Volvo showed more aggressiveness and generated fewer following distances than VW. The reason behind that may be Subaru’s Eyesight technology, which provides robust safety features through the stereo cameras mounted near the rearview mirror to better monitor the road ahead, thus obtaining the shortest clearances in the test. This is followed by Volvo, which combines radar and camera technology for a comprehensive view of the road and traffic, eventually providing moderate following measurements.
The study also revealed that the following distances undergo slight heterogeneity at high driving speeds, in which the obtained ACC measurements did not remain at the same level of increment as earlier measurements, especially for Subaru and VW, where the following distances have slightly increased when raising the speed from 100 km/h to 110 km/h. This is not the case for Volvo, which provided safer average clearance at 110 km/h, represented by 32,538 mm. However, the reason for this may be the increased aerodynamic resistance because a vehicle encounters greater air resistance or drag. This resistance increases requires more energy to overcome it and maintain a constant speed set by ACC; thus, it will lead to the deterioration of ACC system effectiveness.
Finally, it worth mentioning that compared to other relevant research, the current calculated time gaps in our study are considered to be greater than the aggressive short driving measurements recorded by Raju et al. [
27], who reported averages of 1.1, 0.8, and 0.9 s at driving speeds of 50, 70, and 90 km/h. But they are comparatively similar to the average time gaps obtained from short Eco short drive, represented by 1.0, 1.0, and 0.9 s at the same mentioned speeds, respectively. On the other hand, the higher mean of time gaps at short settings reported by Makridis et al. [
53] compared to the measurements resulted in our current study. As discussed earlier in this study, instability in ACC performance has been observed at high speeds. Li et al. [
34] noted that at the shortest setting for ACC headway, equilibrium capacities exceeding 3500 vehicles per hour were observed, along with an exceptionally rapid equilibrium wave speed of 100 km/h. These fast waves are unfamiliar and may pose a safety risk. Additionally, Su et al. [
29] recorded a gap headway of 1.1 s at a test speed close to 110 km/h. In contrast, the current study found gap headways of (0.89, 1.06, and 0.95) s at a driving speed of 110 km/h for the three test vehicles, indicating lower achieved results.
7. Conclusions
The testing of various Adaptive Cruise Control systems at the Zalazone testing track has provided valuable insights into the performance and capabilities of these advanced driver assistance technologies. The empirical tests are smoothly conducted due to the use of an accurate distance measurement process represented by a lidar sensor equipment, which provides highly accurate distance measurements, allowing the preceding vehicle to regularly record the exact distance between itself and the following vehicle. In this study, two essential outcomes have been achieved: First, at low to medium ranges of constant driving speeds, there was an approximate linear increase in the average clearances between the two following vehicles for all applied scenarios. During this phase, Vision-based ACC system, represented by Subaru Levorg, showed more aggressive car following behavior through obtaining the shortest average clearances. Following closely in terms of performance is the combined Camera-radar ACC system represented by Volvo XC40, while the Radar-based ACC system available in VW E-Golf was more conversative. Second, at high ranges of driving speed, ACC system operation appeared to fluctuate more and showed uncertainty for the obtained measurements. The average clearances at this range of speed were unstable and at a high level of dispersion. The results in this phase have caused concern about the use of ACC systems at high speeds as they might have limitations in terms of speed range, and sensor reliability. Overall, the average clearance that was achieved at the shortest ACC setting across all test speeds in this study was 18,904 mm for the Subaru Levorg, 20,054 mm for the Volvo XC40, and 21,415 mm for the VW E-Golf. Correspondingly, the average gaps for all speeds were 1.00 s, 1.03 s, and 1.16 s for the respective vehicles. However, the study considered only the above-mentioned behavior at constant driving speeds. To address the variability in speed changes exhibited by the preceding vehicle during actual driving scenarios, it is imperative for future studies to incorporate a comprehensive analysis of dynamic speed interactions. This will enhance our understanding of ACC systems under diverse driving conditions and contribute to a more holistic evaluation of their performance and effectiveness in real-world environments.
To enhance future research, it is imperative to expand the scope by incorporating a broader range of ACC-equipped car models currently available in the market. This expansion will facilitate a comprehensive analysis of similarities and differences across various systems, thereby aiding in extrapolating findings to the broader ACC user base. Furthermore, it is essential to investigate different car-following ACC settings to gain deeper insights into their functionalities and effectiveness. Additionally, there is a need to explore the concept of car platooning as it holds significant potential for optimizing traffic flow and enhancing overall road safety. By addressing these aspects, future research endeavours can contribute substantially to advancing our understanding and implementation of adaptive cruise control technology.


