1. Introduction
The focus on reducing carbon dioxide emissions and systemic problems in air quality [
1] has led in recent years to the development of new concepts and technologies within the field of electric vehicle engineering. The European Union (EU) and all its member states have signed and ratified the Paris Agreement [
2], which presents an action plan to limit global warming and stop the advance of climate change [
3], committing to be the first climate-neutral economy and society by 2050. In addition, in recent years, the price of petroleum-based fuels, such as gasoline and diesel vehicle fuels, has been increasing [
4] at a considerable rate. Consequently, there is much more interest from consumers and engineers [
5,
6] in the reduction in the fuel consumption of conventional vehicles, hybrid electric vehicles (HEVs) and electric vehicles (EVs).
One of the main challenges is to understand how EVs work and improve their efficiency. In this sense, authors such as [
7] have studied how to approach a fundamental problem, i.e., how to measure and estimate the energy consumption of electric vehicles, through an analysis of vehicle performance and performance data. In this sense, simulation models are increasingly gaining importance, both for design purposes and for their analysis and validation at different stages of the process. According to the state of the art, models have been described from various points of view, such as in [
7,
8], where predefined packages from a library were used. In the research presented in [
9], the consumption of light electric vehicles and motorcycles was analysed from the specific power point of view. In other published works, the performance of three and four-wheel vehicles has been addressed [
10]. However, there is no standard for the simulation of electric vehicles [
11], and much less for prototypes of light electric vehicles (LEVs) such as the one discussed in this paper.
In this context, numerous initiatives have been carried out in recent years to promote the reduction in fuel consumption and sustainable mobility. Among these initiatives, it is worth mentioning the organisation of many contests, challenges and competitions, in North America and Europe, whose objective is to achieve the lowest fuel consumption [
12,
13,
14]. At a European level, the most important one is the Shell Eco-marathon [
15], which is an annual competition held at various racing circuits in France—Ladoux and Nogaro—and the United Kingdom—Rockingham. In Spain, the Solar Race has been held for several years in the region of Murcia.
These competitions have a strong educational component since the participants are mainly universities, technical schools and other educational/scientific institutions. The School of Industrial Engineering at the University of Malaga has joined this type of initiative by forming a team of students who have developed several prototypes of experimental LEVs to participate in the different competitions held both in Spain and abroad.
Around this project, different lines of work have emerged [
16,
17,
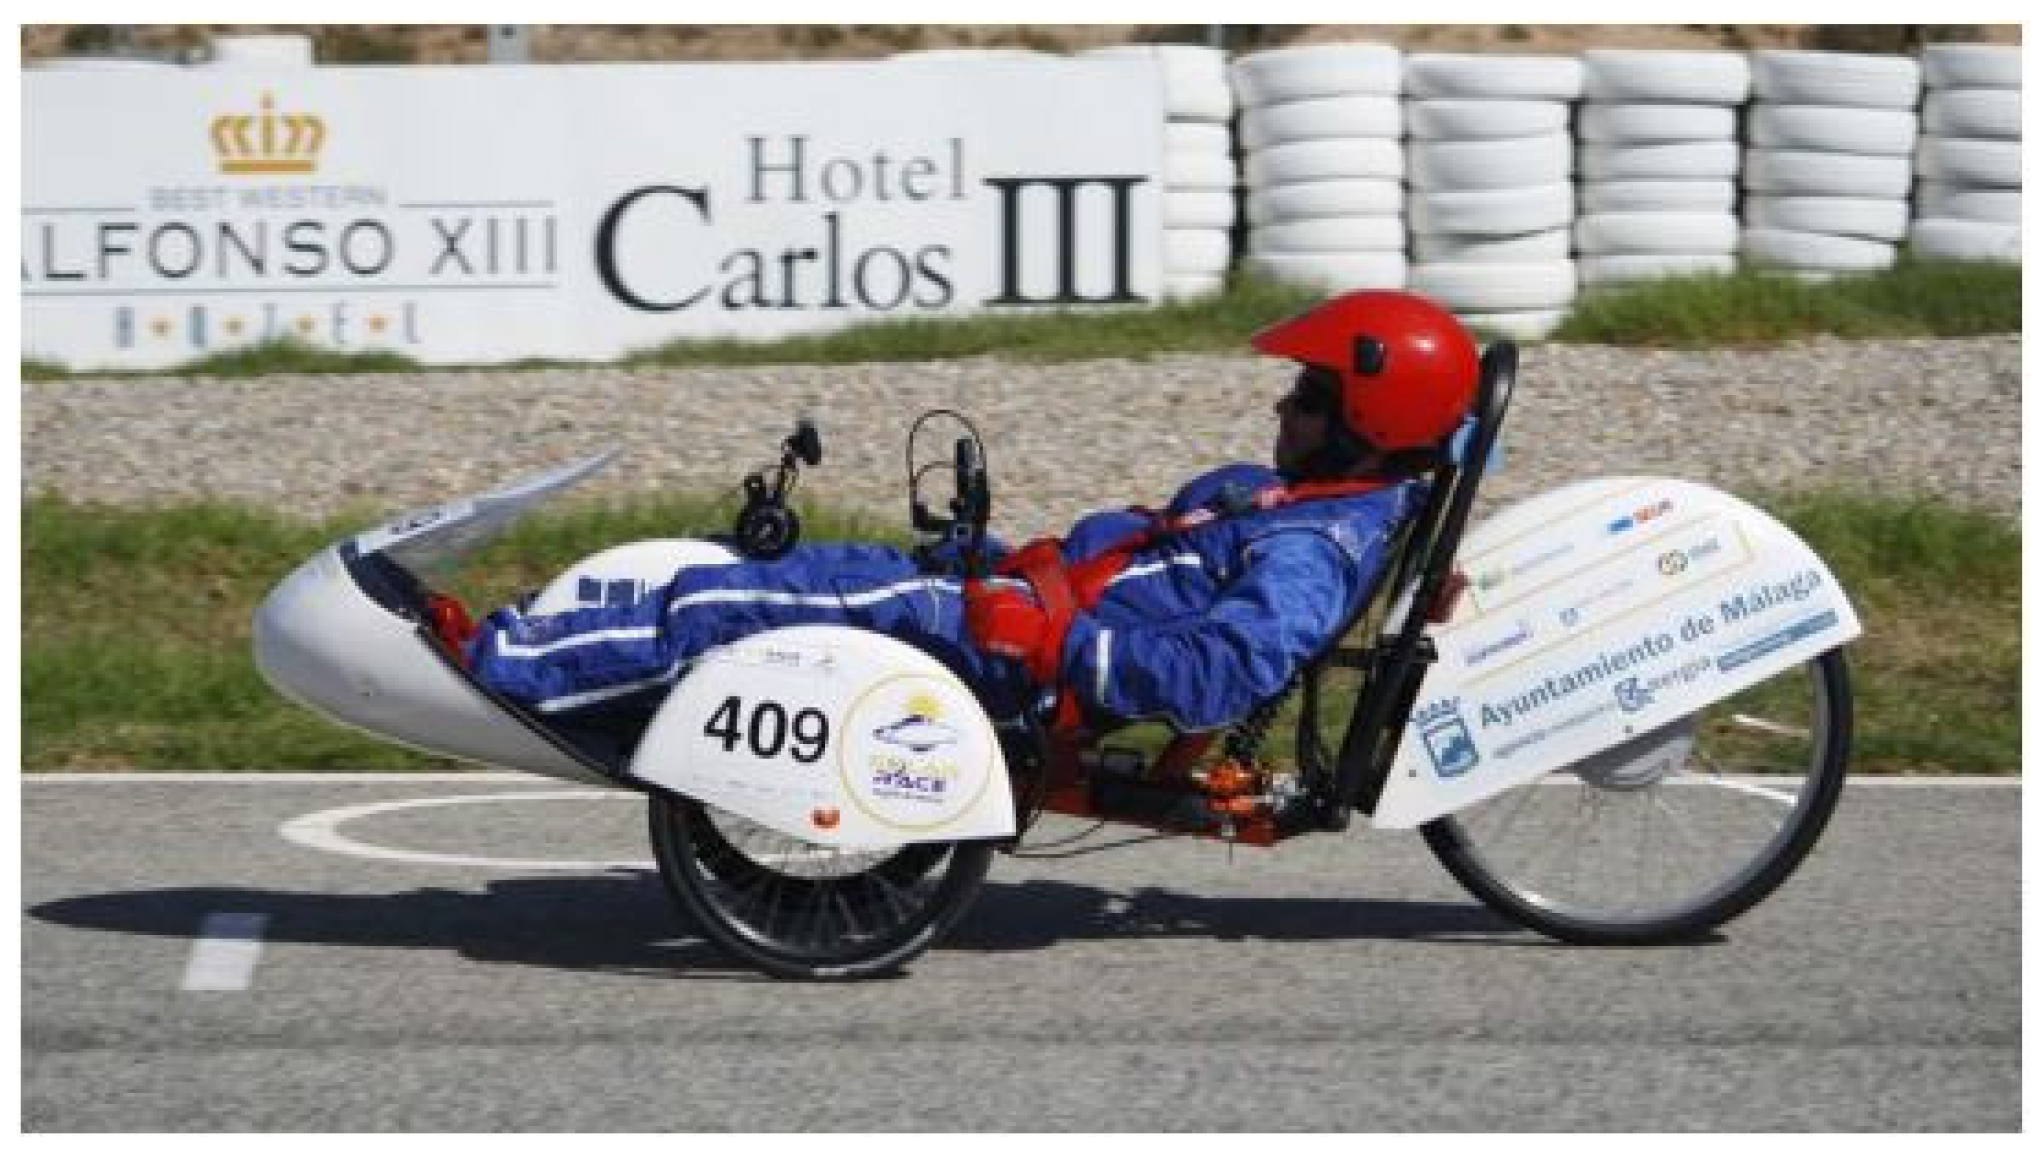
18], among which there is the development of a software tool—computer model—capable of simulating the operation of LEV prototypes (see
Figure 1) in order to predict and improve their performance in the different competitions.
According to the state of the art in reference to these types of competitions and electric racing vehicles, in terms of the development of software models and simulations of electric vehicles, a great variety of research papers can be found. It is worth highlighting investigations such as [
19], in which a detailed analysis of the power demand of a lightweight ultra-efficient electric vehicle for the Shell Eco-marathon competition was performed. This paper presents a “tank to wheel” model of the vehicle power system that was developed in order to compute the total energy consumption.
In related works such as [
20], a multiphysics model of a light electric vehicle was developed and validated, where the model was used to try to optimise the driving strategy, achieving a 9% reduction in energy consumption. The validation of the model was carried out by means of a test bench and an outdoor test on a straight trajectory.
In other related investigations such as [
21], a method for optimising the driving strategy of a light electric competition vehicle was presented in such a way that energy consumption is minimised. The research was focused on defining and solving the task of the dynamic optimisation of the vehicle speed strategy.
Other interesting results are offered for the optimisation of driving strategies based on driving patterns by authors in studies such as [
22]. This research dealt with the different control modes, presenting very complete comparisons of different simulations. The vehicle dynamics were tested with several control topologies to investigate the most suitable one. The control topologies adopted were direct torque control (DTC), model predictive direct torque control (MP DTC) and voltage predictive control (PVC). The obtained results show that the dynamics of the electric drive system of the vehicle under the PVC system were improved in comparison with the other control schemes.
Although there is a large number of research papers on the design and modelling of ultra-efficient light electric vehicles, no references have been found that address the study of the effect of the different control strategies on power demand through speed control, engine torque control or battery power control. This article aims to provide a quantitative analysis of the effect of these types of control modes on energy consumption to contribute to improving the performance of light electric vehicles. In fact, this is fundamental information for design engineers since it will allow for the subsequent optimisation of the different control strategies of the vehicle’s driving mode.
Therefore, continuing in this line of research, a simulation tool for estimating the LEVs’ performance developed in Matlab/Simulink [
23] is proposed in this paper. These types of tools allow us to quickly experiment with aspects of the vehicle, such as engine speed, power and torque, battery type and size, weight and so on, and to see how these changes affect performance and range.
2. Methodology
Modelling is the relationship between mathematics, i.e., abstract reasoning, and the physical environment [
24]. The creation of a mathematical model (modelling) is based on designing an (abstract) mathematical space parallel to a physical system—in this case, an electric racing vehicle—in such a way that relations between the two are established.
A dynamic model is a mathematical description of the dynamic performance of a system. Therefore, dynamic modelling describes every variable of a system or process that changes over time. The dynamic modelling of electric vehicles deals mainly with the movement of electric vehicles on a surface.
When talking about models, it is in most cases about approximations of the system or process that will be more or less accurate depending on what is considered and what is neglected in the model. In this sense, it is vitally important to keep a good relationship between the simplicity and precision of the model. Therefore, it is necessary to study in depth the context of the process or system in order to see which are the most important factors, which factors can be neglected or which simplifications can be assumed [
25]. It is about looking for a model that is as simple as possible while sufficiently describing the parameters or variables that need to be analysed depending on the system.
In general terms, in systems and automation engineering, this type of system, defined by an equation or equations as shown below, is called SISO or MISO depending on whether it has a single input and output or multiple inputs and outputs, respectively.
Graphically, this type of system is usually represented by a block diagram, as shown in
Figure 2:
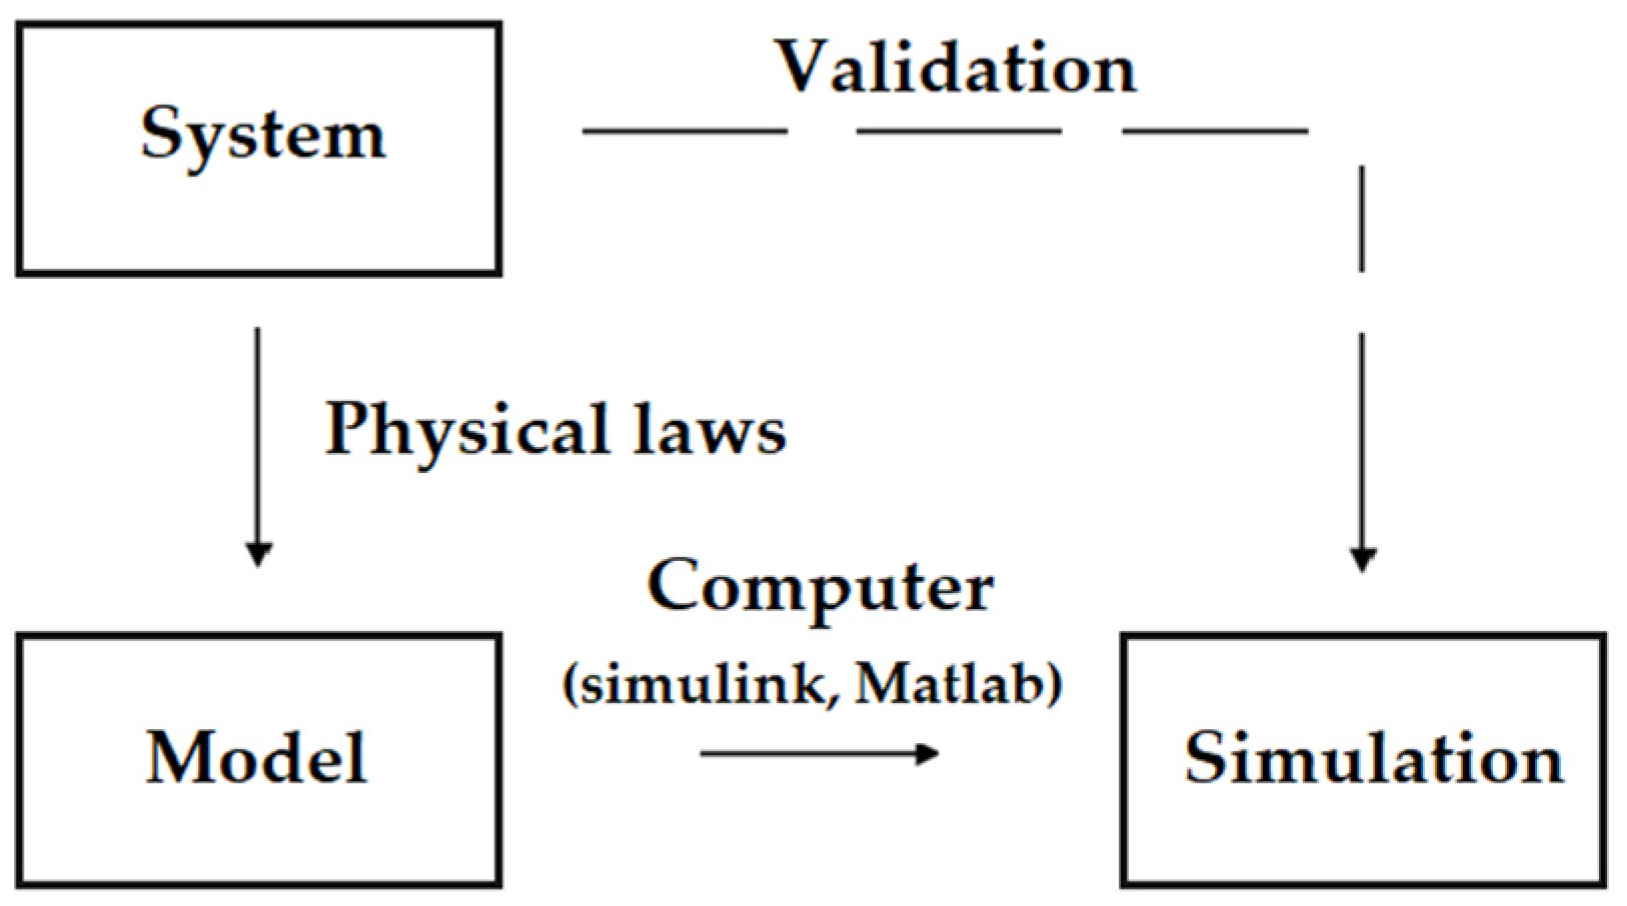
The work methodology when approaching the modelling of a dynamic system requires, as previously mentioned, knowledge of the physical laws that describe the system, the development of a model based on these laws, the implementation of this model in a computer program and its subsequent validation. The workflow would be as shown in the following chart in
Figure 3:
The creation of a model will allow tests to be carried out in the laboratory, which will represent a great saving in both time and money for the design process and subsequent competition.
The simulations will also show interesting data on engine torque and speed that can be used to optimise vehicle design, as well as predict performance and range. The ultimate objective is to understand the vehicle’s fuel consumption and apply strategies to keep it as low as possible and hence improve its efficiency.
2.1. Dynamic Modelling of the Electric Vehicle
In this section, the equations that model the dynamic performance of the vehicle are developed, which will allow us to create the model and perform simulations later.
The mathematical model of an electric vehicle has been described and developed by various authors in the literature [
26,
27,
28], considering the longitudinal dynamic model (LDM) of the vehicle. The modelling of the electric vehicle that they present is based on fundamental theories of physics, specifically on Newton’s laws of motion. In studies such as [
25], an analysis is presented on the sensitivity of this type of models when estimating energy demand and on which parameters have greatest influence on the accuracy of the results. However, other authors in the literature based on vehicle dynamics focus on the estimation of the specific power (VSP) for LEVs; that is, the power per unit mass [
29]. Finally, other investigations [
30] use simulations to understand and examine the energy that flows during the motorisation or regeneration of the vehicle.
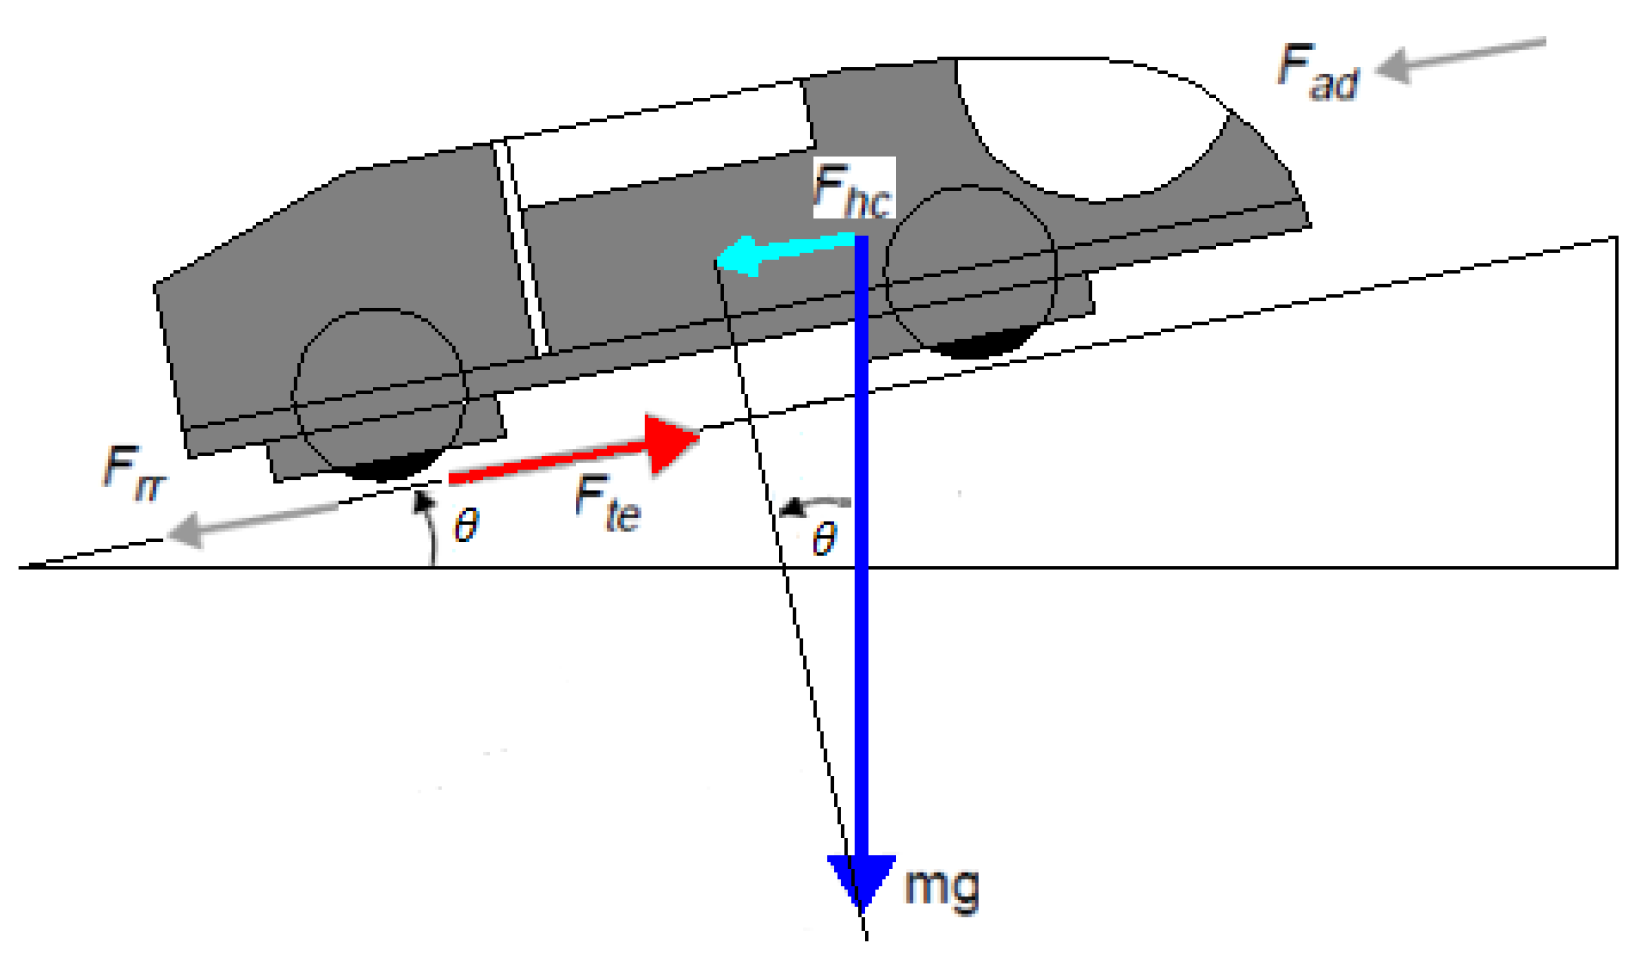
The essential dynamics of vehicles deal with the forces that affect the movement of these, i.e., the acceleration force (Fa), the force due to an inclined surface (Fhc), the rolling force (Frr) and the aerodynamic force. (Fad).
Considering a vehicle of mass
m, moving at speed
v, down a slope of angle
Ѳ, as in
Figure 4, the tractive effort must be fulfilled by:
Overcoming rolling resistance.
Overcoming aerodynamic resistance.
Overcoming the component of the weight of the vehicle that acts on the slope.
Accelerating the vehicle if the speed is not constant.
Each of these cases will be considered in more detail below.
Friction resistance is the force necessary to overcome the forces that offer resistance to movement, such as friction between the tyre and the road surface, with the aim of converting the motor effort into movement, avoiding slipping and lateral displacements. The equation is:
where
μRR is the coefficient of rolling resistance.
The
μRR value taken for light vehicles over asphalt road is 0.0055. Other typical values used according to the surface conditions encountered can be found in [
31].
This part of the force is due to friction from the body of the vehicle moving through the air. The formula for this component is:
where
ρ is the air density,
A is the frontal area,
v is the speed and
Cd is a constant called the drag coefficient.
The Cd is a dimensionless factor that quantifies the resistance that a solid presents to penetrate and move through a fluid, usually air. This coefficient is independent of the size of the body and the velocity of the fluid up to a certain point. After this point, noticeable variations in Cd are experienced.
Air density, of course, will vary according to temperature, altitude and humidity. However, a value of 1.225 kg·m−3 is usually used in most cases.
This force is the component of the vehicle weight that acts along the slope as shown in
Figure 4. Then, by resolution of the forces,
If the speed of the vehicle is changing, then a force clearly needs to be applied in addition to the forces shown in
Figure 4. This force will provide the linear acceleration (
a) of the vehicle and is given by the equation derived from Newton’s second law.
The force required to make the wheels spin faster must also be considered. For this reason, the rotational acceleration must be taken into account, in addition to the linear one.
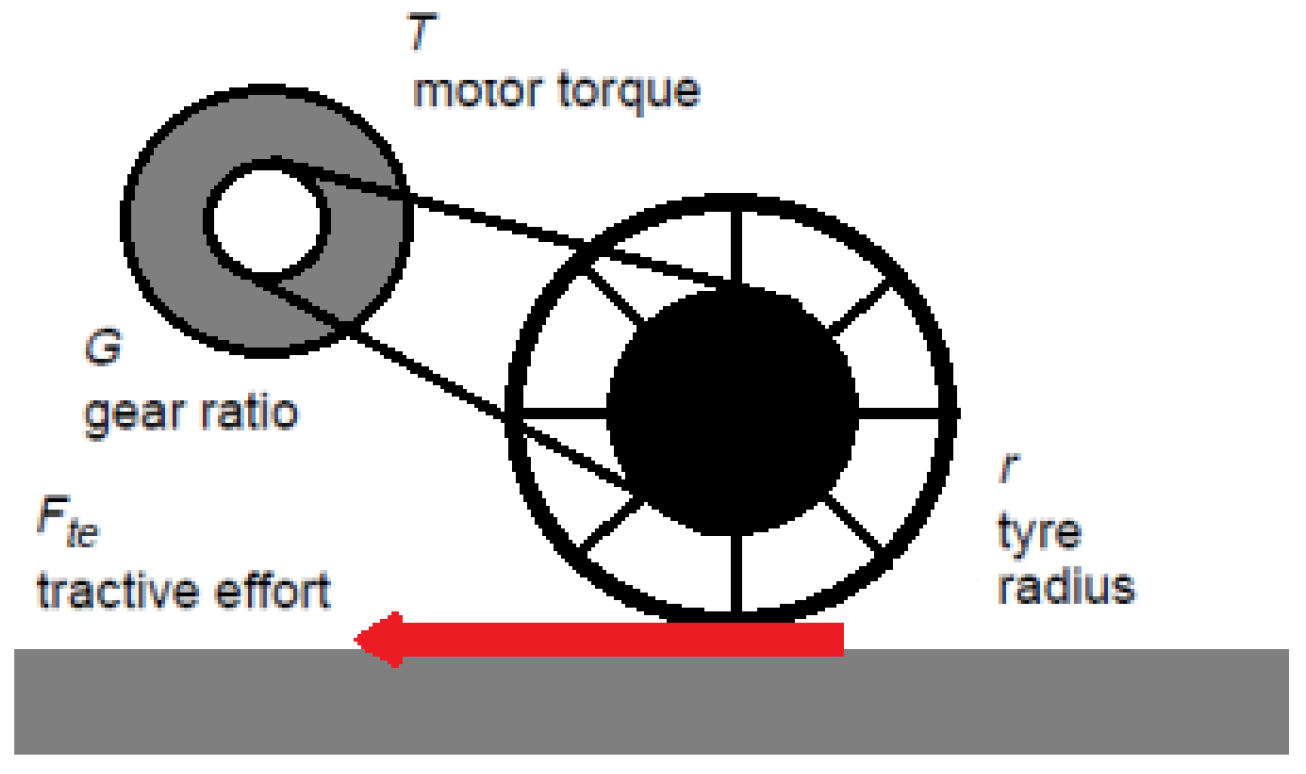
The tractive effort supplied by the propulsion system and the motor torque, shown in
Figure 5, can be expressed as:
where
T is the motor torque in Nm,
G is the gear ratio and
r is the tyre radius.
Similarly, the angular acceleration of the engine is:
The torque required for this angular acceleration is:
where
I is the moment of inertia of the engine.
The force on the wheels required to provide the angular acceleration (
Fωa) can be obtained by combining this equation with Equation (5). In addition, if the system consists of a gear one, the efficiency will never be 100%, so it is necessary to integrate the efficiency
ηg of the gear system. The required force can be written as:
The total effort force is the sum of all these forces:
2.2. Modelling of Vehicular Dynamics
Once the forces that intervene in the dynamic modelling of the vehicle are known (see
Figure 4), the equations that model its behaviour can be found.
The mechanical or traction force of the vehicle is given by Equation (9). Furthermore, the mechanical torque is related to the mechanical force through the following equation:
The first-order differential equation that solves the vehicular dynamics is as follows:
2.3. Electric Vehicles Performance Modelling
If the power or energy required to move the vehicle is to be known, the efficiency of the various components that make up the vehicle system must be considered.
The energy required (
Pte) to move the vehicle for one second is equal to the power; therefore, the energy required each second is:
This equation can be rewritten as a function of the motor’s torque (
T) and its angular velocity (
w) as:
where
n is the angular velocity in r.p.m.
And considering the efficiency of the motor (
ηm), the necessary electrical power (
Pelectric) is:
where
Pmot is the mechanical power of the engine.
The inefficiencies of the engine, controller and gear system mean that the motor power is not the same as the traction power, and therefore the electrical power required by the motor (
Pmotin) is greater than the mechanical output power (
Pmotout), according to the equations:
The power consumed from the battery is:
Therefore, the
Total Consumption in Wh of the vehicle is:
The distance travelled by the vehicle (
s) is given by the following equation:
The speed (
v) in units of km/h is:
And, finally, the
Consumption per km in Wh/km of the vehicle is given by:
2.4. Engine Modelling
Electric motors are machines [
32,
33,
34] that convert electrical energy into mechanical energy. Their main advantage over traditional combustion engines is that they are capable of delivering maximum torque from the start. In addition, they are characterised by allowing energy to be recovered through regenerative braking (except motors with series winding), being very silent and not producing any polluting emissions. If the characteristic curves of an electric motor are compared with those of a combustion engine, it is observed in the electric motor that, in constant torque zone, the power increases linearly from zero to maximum speed. From there, it remains constant. This gives these types of engines great power at low and medium speeds compared to a combustion engine.
This section deals with the modelling of the performance of the electric vehicle’s motor [
35]. The engine is responsible for supplying the mechanical power necessary to move the vehicle following the torque and speed instructions. In this case, the type of motor used in the electric vehicle is a 48 V and 500 W brushless DC hub motor. Initially, the decision was made to use an existing block in Matlab’s Electrical Machines library (Permanent Synchronous Machine) capable of simulating the performance of this type of motor, but the discrete mathematical model of this motor needs a discrete time of 2 x 10
-6 to obtain good results. This fact means that the complete execution of the vehicle simulation model will take a long time, this being of little use for the purpose of this project. For this reason, a simplified engine model was chosen that would allow for obtaining results in a more reasonable time frame.
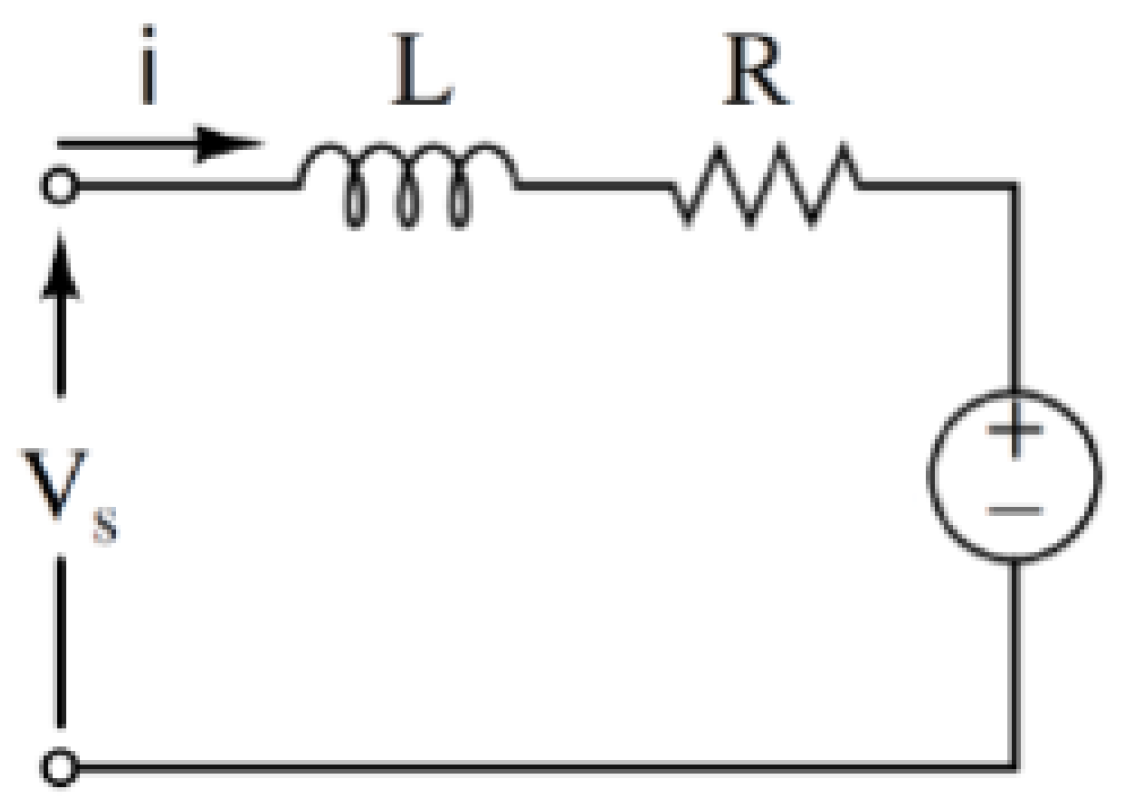
The equations that describe the model, based on the equivalent electrical circuit, proposed in
Figure 6 are as follows:
The torque developed by the motor is proportional to the current in the armature (
I):
The motor voltage (
Ea) is proportional to the motor speed in rad/s:
The applied voltage (
Vs) is equal to the voltage generated by the motor plus the voltages that are conducted through the resistance (
R) and inductance (
L):
The mechanical torque offered by the motor is equal to the electrical torque developed minus the losses due to friction and due to inertia. In addition, the model includes electrical losses based on the no-load intensity of the motor. Therefore, the engine torque is:
where
b is the friction coefficient,
J is the motor inertia,
I0 is the vacuum intensity and
Vnom is the motor nominal voltage.
When a model of an electric motor based on its equivalent electrical circuit is created, it is necessary to know the electrical parameters that define it, as well as a series of constants that provide a great deal of information about the characteristics of the specific electric motor. These parameters can at times be found in an easy and accessible way in the data sheets provided by the manufacturers. However, on many other occasions, these parameters are difficult to locate and, therefore, it is essential to carry out some trials or tests in the laboratory in order to find their magnitude.
In this work, both the phase resistance in the stator and the armature inductance were measured. In addition, tests were carried out with the oscilloscope to obtain the motor constant (Kv) and the number of pole pairs of the motor.
2.4.1. Stator Resistance (Rs)
The motor stator resistance is defined as the resistance between one of the stator phases and the centre of the winding. The resistance of the winding depends on the temperature. It is common to find this information in the data sheets for a value of normalised temperature conditions of 25 °C or for other temperatures. In any case, if the value of the resistance at a certain temperature is known, only the thermal constant of the material (for example, copper 0.004 K−1) is needed to find the value at another specific temperature.
Either a digital multimeter or an RLC meter can be used to measure resistance. When the value of the resistance is very small and cannot be measured with the voltmeter, it will be necessary to build a Winston bridge and, by applying Ohm’s law, obtain the value of this resistance. In both cases, it must be considered that, if the stator configuration is star, the final value of the resistance is half the value that has been measured.
2.4.2. Inductance (L)
The inductances inside the windings of a permanent magnet motor are usually different (Ld < Lq). This is due to the low reluctance on the q axis. However, the inductances at the surface are usually the same because the magnets are mounted on the surface and the reluctance is the same for any position.
There are various procedures used to measure inductance. If an inductance meter is available, it can be determined directly from the motor terminals. Another way to obtain the inductance is to feed the motor with a known voltage source and measure the current in the motor’s armature.
where
Va,
Ra and
Ia are the armature voltage, armature resistance and armature intensity of the motor, respectively.
2.4.3. Electrical Constant of the Engine
The test procedure used to obtain the motor constant, kv (V/krpm), is as follows. Firstly, two phases of the motor are connected through the probe to the oscilloscope and, secondly, the hub motor is rotated in such a way that a sinusoidal type of signal is generated.
The motor constant
kv is obtained from the amplitude and angular velocity:
2.4.4. Pole Pairs
Finally, to determine the number of pole pairs of the motor, we proceeded to manually rotate and count the transitions of the output of any Hall effect signal during one revolution.
The results of these tests are summarised in
Table 1.
2.5. Battery Modelling
In this section, the performance of the electric vehicle battery is modelled. The battery [
36,
37] is responsible for supplying the energy necessary to feed the motor. In this case, the type of battery used in the electric vehicle was 48 V 12 Ah lithium ion, consisting of 13 cells of 3.7 V each. It was decided to use an existing block in the Electrical library Sources from Matlab (Battery) that implements a dynamic parametric model capable of representing the most commonly used rechargeable batteries [
38,
39,
40,
41].
This model is characterised by a series of parameters that can be modified to obtain a specific type of battery based on the battery specifications and the discharge characteristic curves.
The parameters that model the battery of our electric vehicle are:
Nominal voltage;
Nominal capacity;
Initial state of charge.
2.6. Aerodynamics Modelling
Vehicle aerodynamics deal with the study of the actions and effects exerted by air on a moving vehicle. The air flow outside the vehicle originates a series of actions, such as forces and moments, that significantly affect movement. The effects that it causes are both resistance to vehicle movement and changes in directional stability.
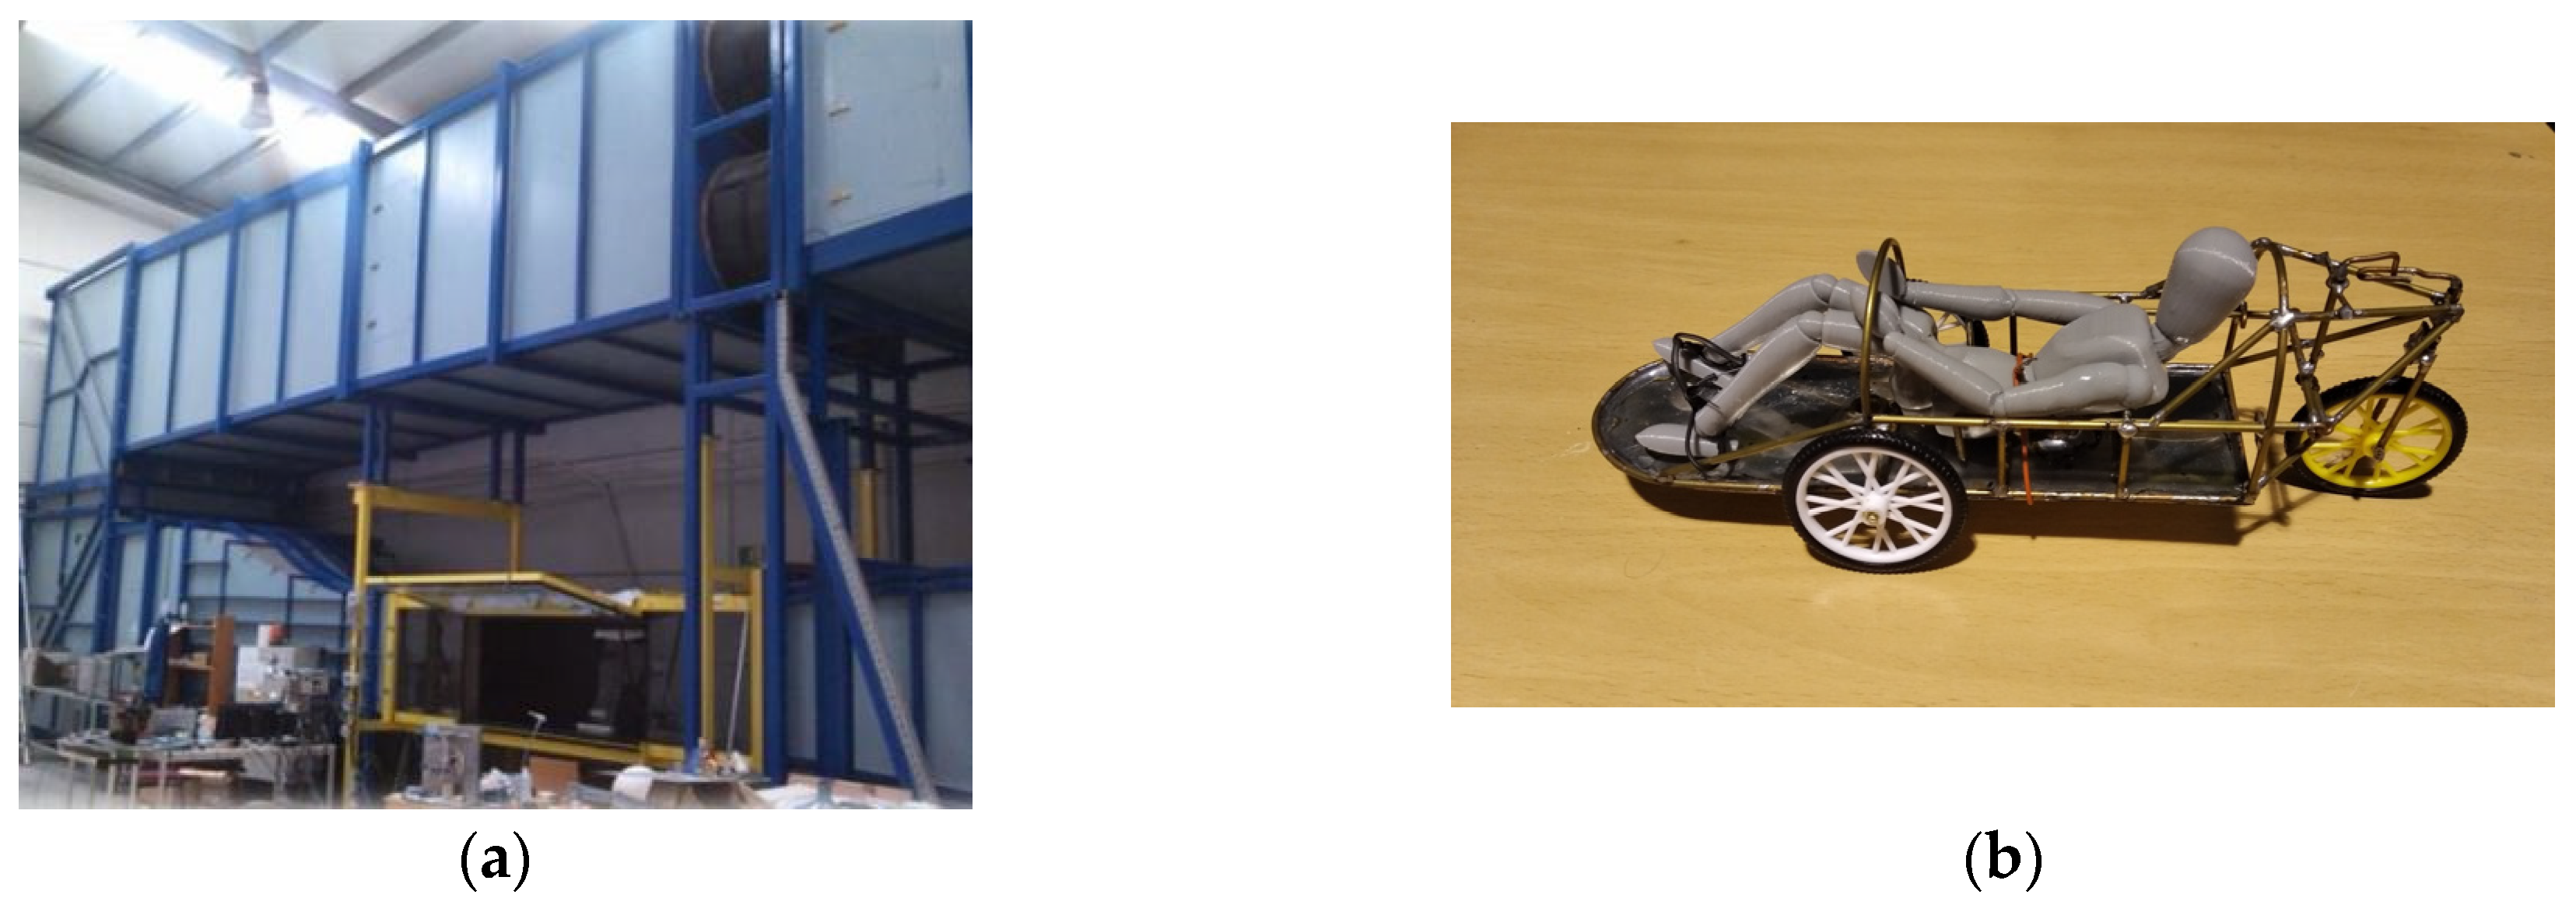
This phenomenon can be approached in different ways. Traditionally, experimental methods such as wind tunnel analysis have been used. Another way is to use so-called computational fluid dynamics (CFD), which is based on using numerical approximations of the equations provided by fluid dynamics. These solutions are calculated with computers and good results are obtained for complex systems that are often impossible to solve analytically in fluid dynamics.
In collaboration with the Fluid Mechanics area of the University of Malaga, tests were carried out on the aerodynamics of a scale model of the vehicle in a wind tunnel (
Figure 7). The aerodynamic resistance was measured both in the horizontal and vertical planes of the scale model of the vehicle.
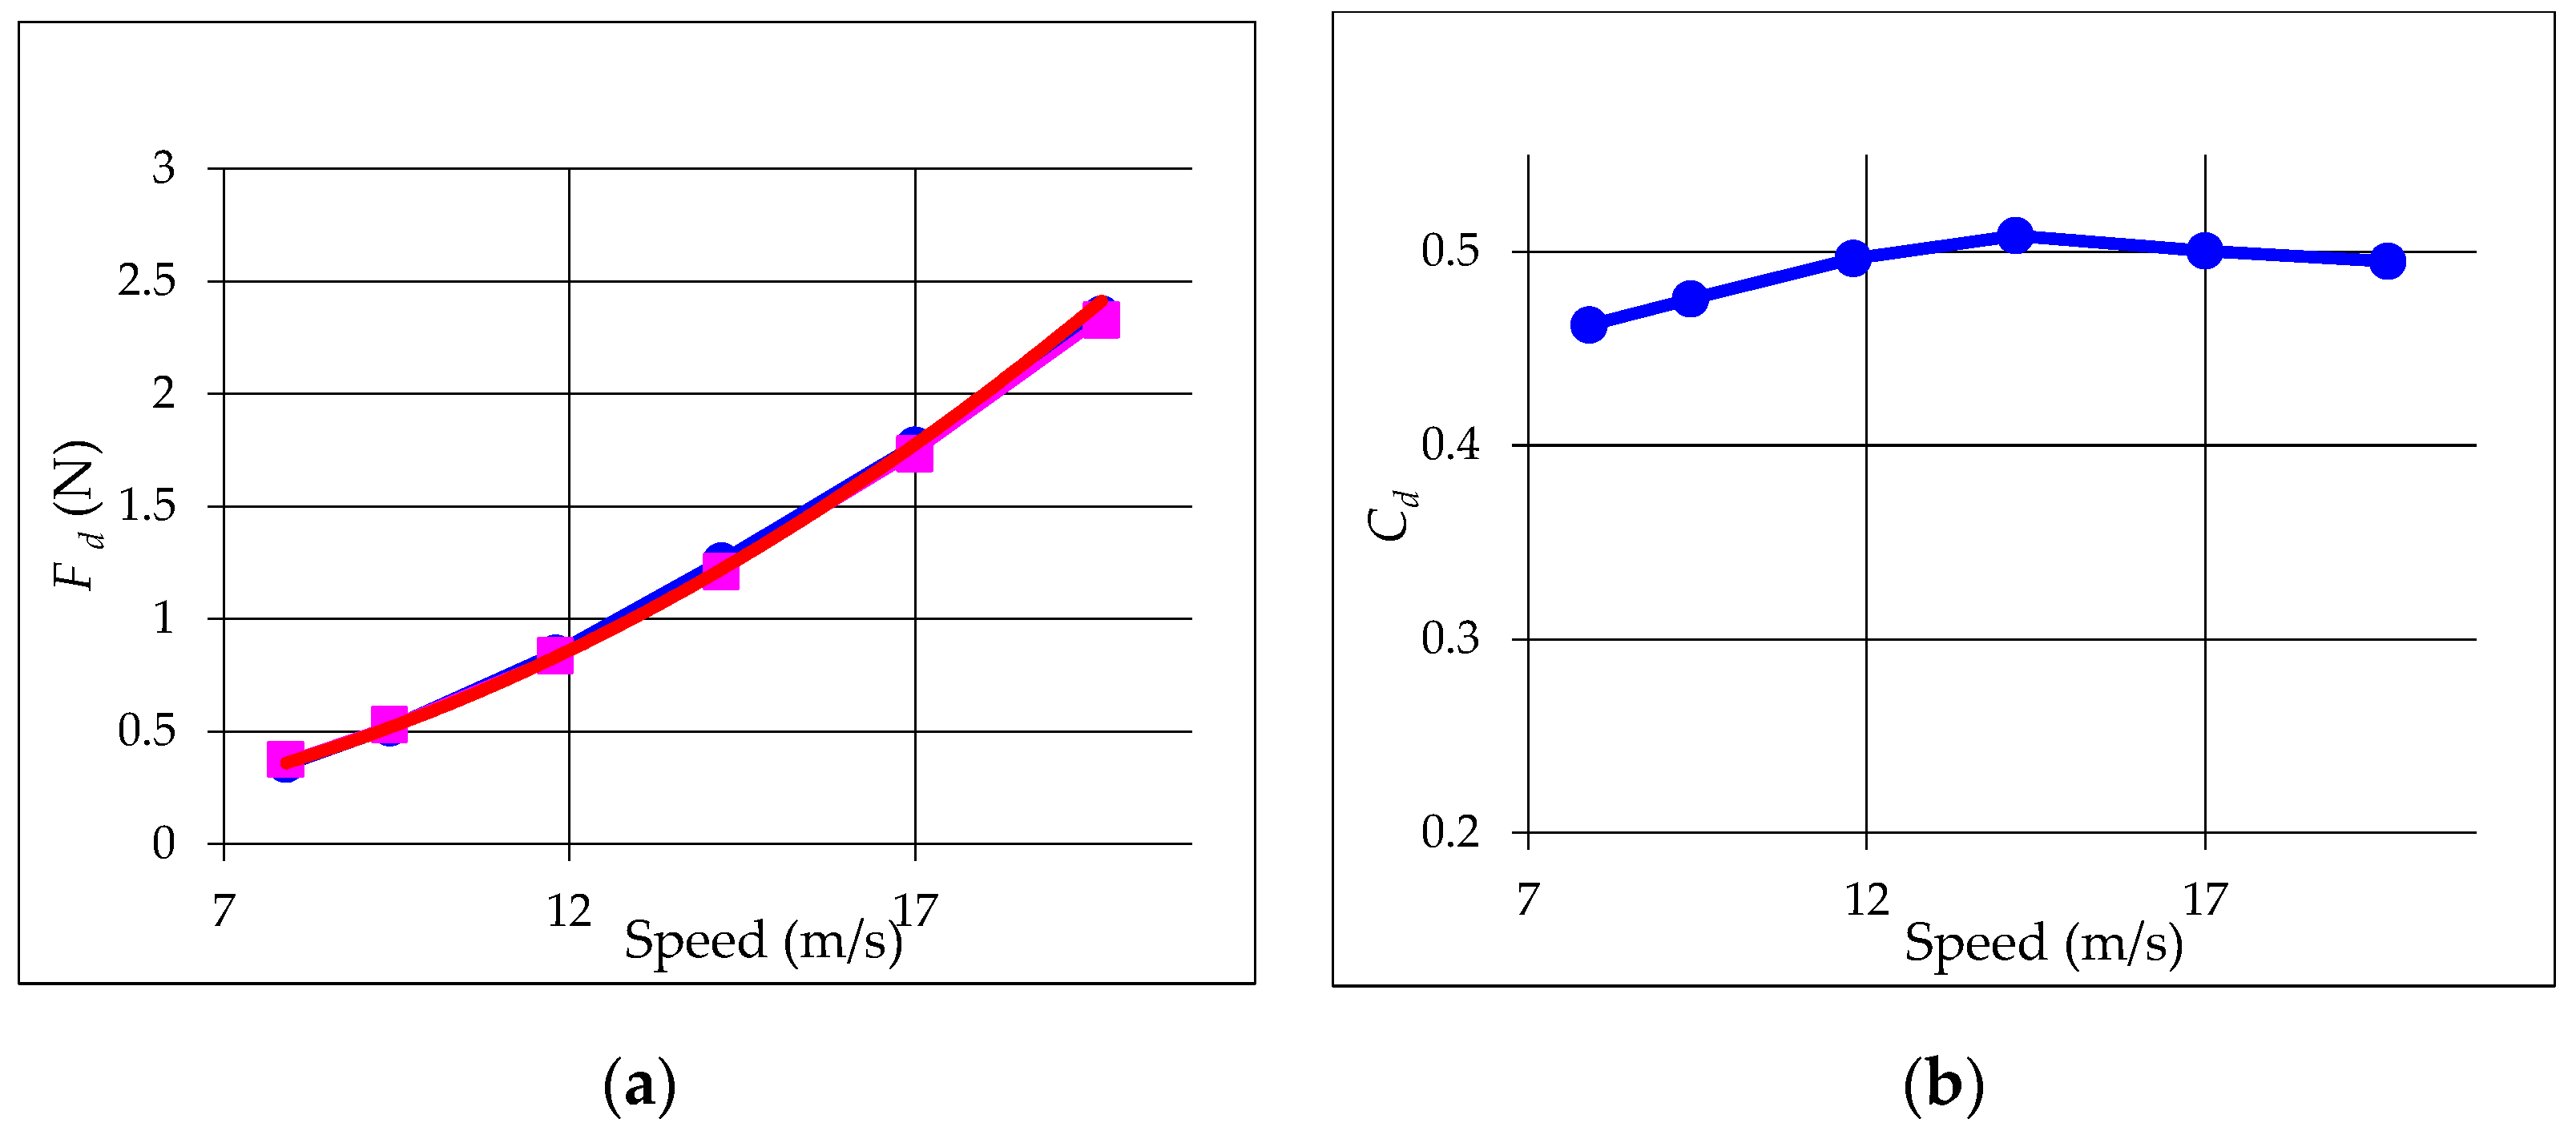
A 1:4.5 scale model of the vehicle was manufactured and tests were carried out with wind speeds between 7.9 and 19.7 m/s. Longitudinal and vertical forces were measured. The vertical force is always less than 0.2 N and can be neglected. It can be verified that the longitudinal force fits very well to a quadratic function, which allows the aerodynamic coefficient
Cd to be calculated by applying Equation (2). In this equation, the value of 1.225 Kg/m
3 was taken for the air density and 0.02 m
2 for the front area of the model. The results are shown in
Figure 8 and, from them, it can be concluded that the value of the coefficient
Cd is quite stable regarding speed. We took the average value of these results as the definitive
Cd, obtaining a value of
Cd = 0.49.
2.7. Circuit Modelling
The circuit model includes a data matrix containing the distance to the origin and the slope values at each point on the route.
To calculate the slope force, it is necessary to know the elevation profile of the route. This can be obtained in several ways, such as by means of a circuit plan suitably divided into sections and by characterising the angles of inclination. Some authors use GPS for characterisation [
7] of the route or road, but it must be taken into account that, from our point of view, the information provided by both Google Earth or a built-in GPS system does not provide sufficiently accurate elevation data. For this reason, we considered that it is much more convenient for the model to obtain these data using an inclinometer, since this device provides a higher accuracy of the ground than what can be obtained by using GPS.
Figure 9 shows the map and the elevation profile of the circuit used in the real tests of the vehicle.
In this work, all the relevant distance and inclination data of the route were obtained by performing a reconnaissance lap along the route to capture all these data automatically with an inclinometer and an odometer.
2.8. Simplifications to the Model
The modelling of a process or a plant allows us to know and predict the dynamics and performance under different circumstances (disturbances). In the modelling process, a series of simplifications were assumed that greatly reduce the complexity of a model of these characteristics.
Firstly, it was assumed that the vehicle object of the modelling moves on a surface with a constant rolling coefficient. Secondly, only the aerodynamic resistance in the longitudinal direction of the movement of the vehicle was considered. Both the frontal and rear effect of the wind thrust were considered, while the lateral effects were neglected since they only directly influence the load of the wheels (tyres) against the road and the directional stability of the vehicle that assumes the pilot maintaining the trajectory traced in the circuit. Thirdly, a simplified motor model was considered to improve the computational time of the simulation, as mentioned in
Section 2.4 Furthermore, a constant performance was used for the transmission system.
Finally, a series of simulations were carried out with the simulation tool. The calibration and validation of the proposed model were carried out by comparing it with the data collected in a real test of the TEO2 vehicle.
3. Simulink Model Development
Matlab was used in this work [
23] because it is a computer software that allows for programming and visualising the results in the same environment. Currently, it is one of the most widely used programs for solving engineering and scientific problems [
8,
42,
43,
44,
45], in addition to many other fields. Matlab has various tools, such as Simulink, that allow the user to work easily and comfortably. It also has a tool for the development of graphical interfaces (GUIs), which, in this case, allowed the model to be implemented as a much more attractive, intuitive and user-friendly simulation tool.
This section presents the block model implemented in the Simulink Matlab tool based on the equations that describe the vehicle performance model.
The initial pre-set values for the model are based on the technical specifications of the experimental TEO2 prototype (
Figure 1), which are detailed below.
Dimensions:
Engine controller:
Engine: Brushless DC.
Battery: 13-cell Li-ion battery with BMS.
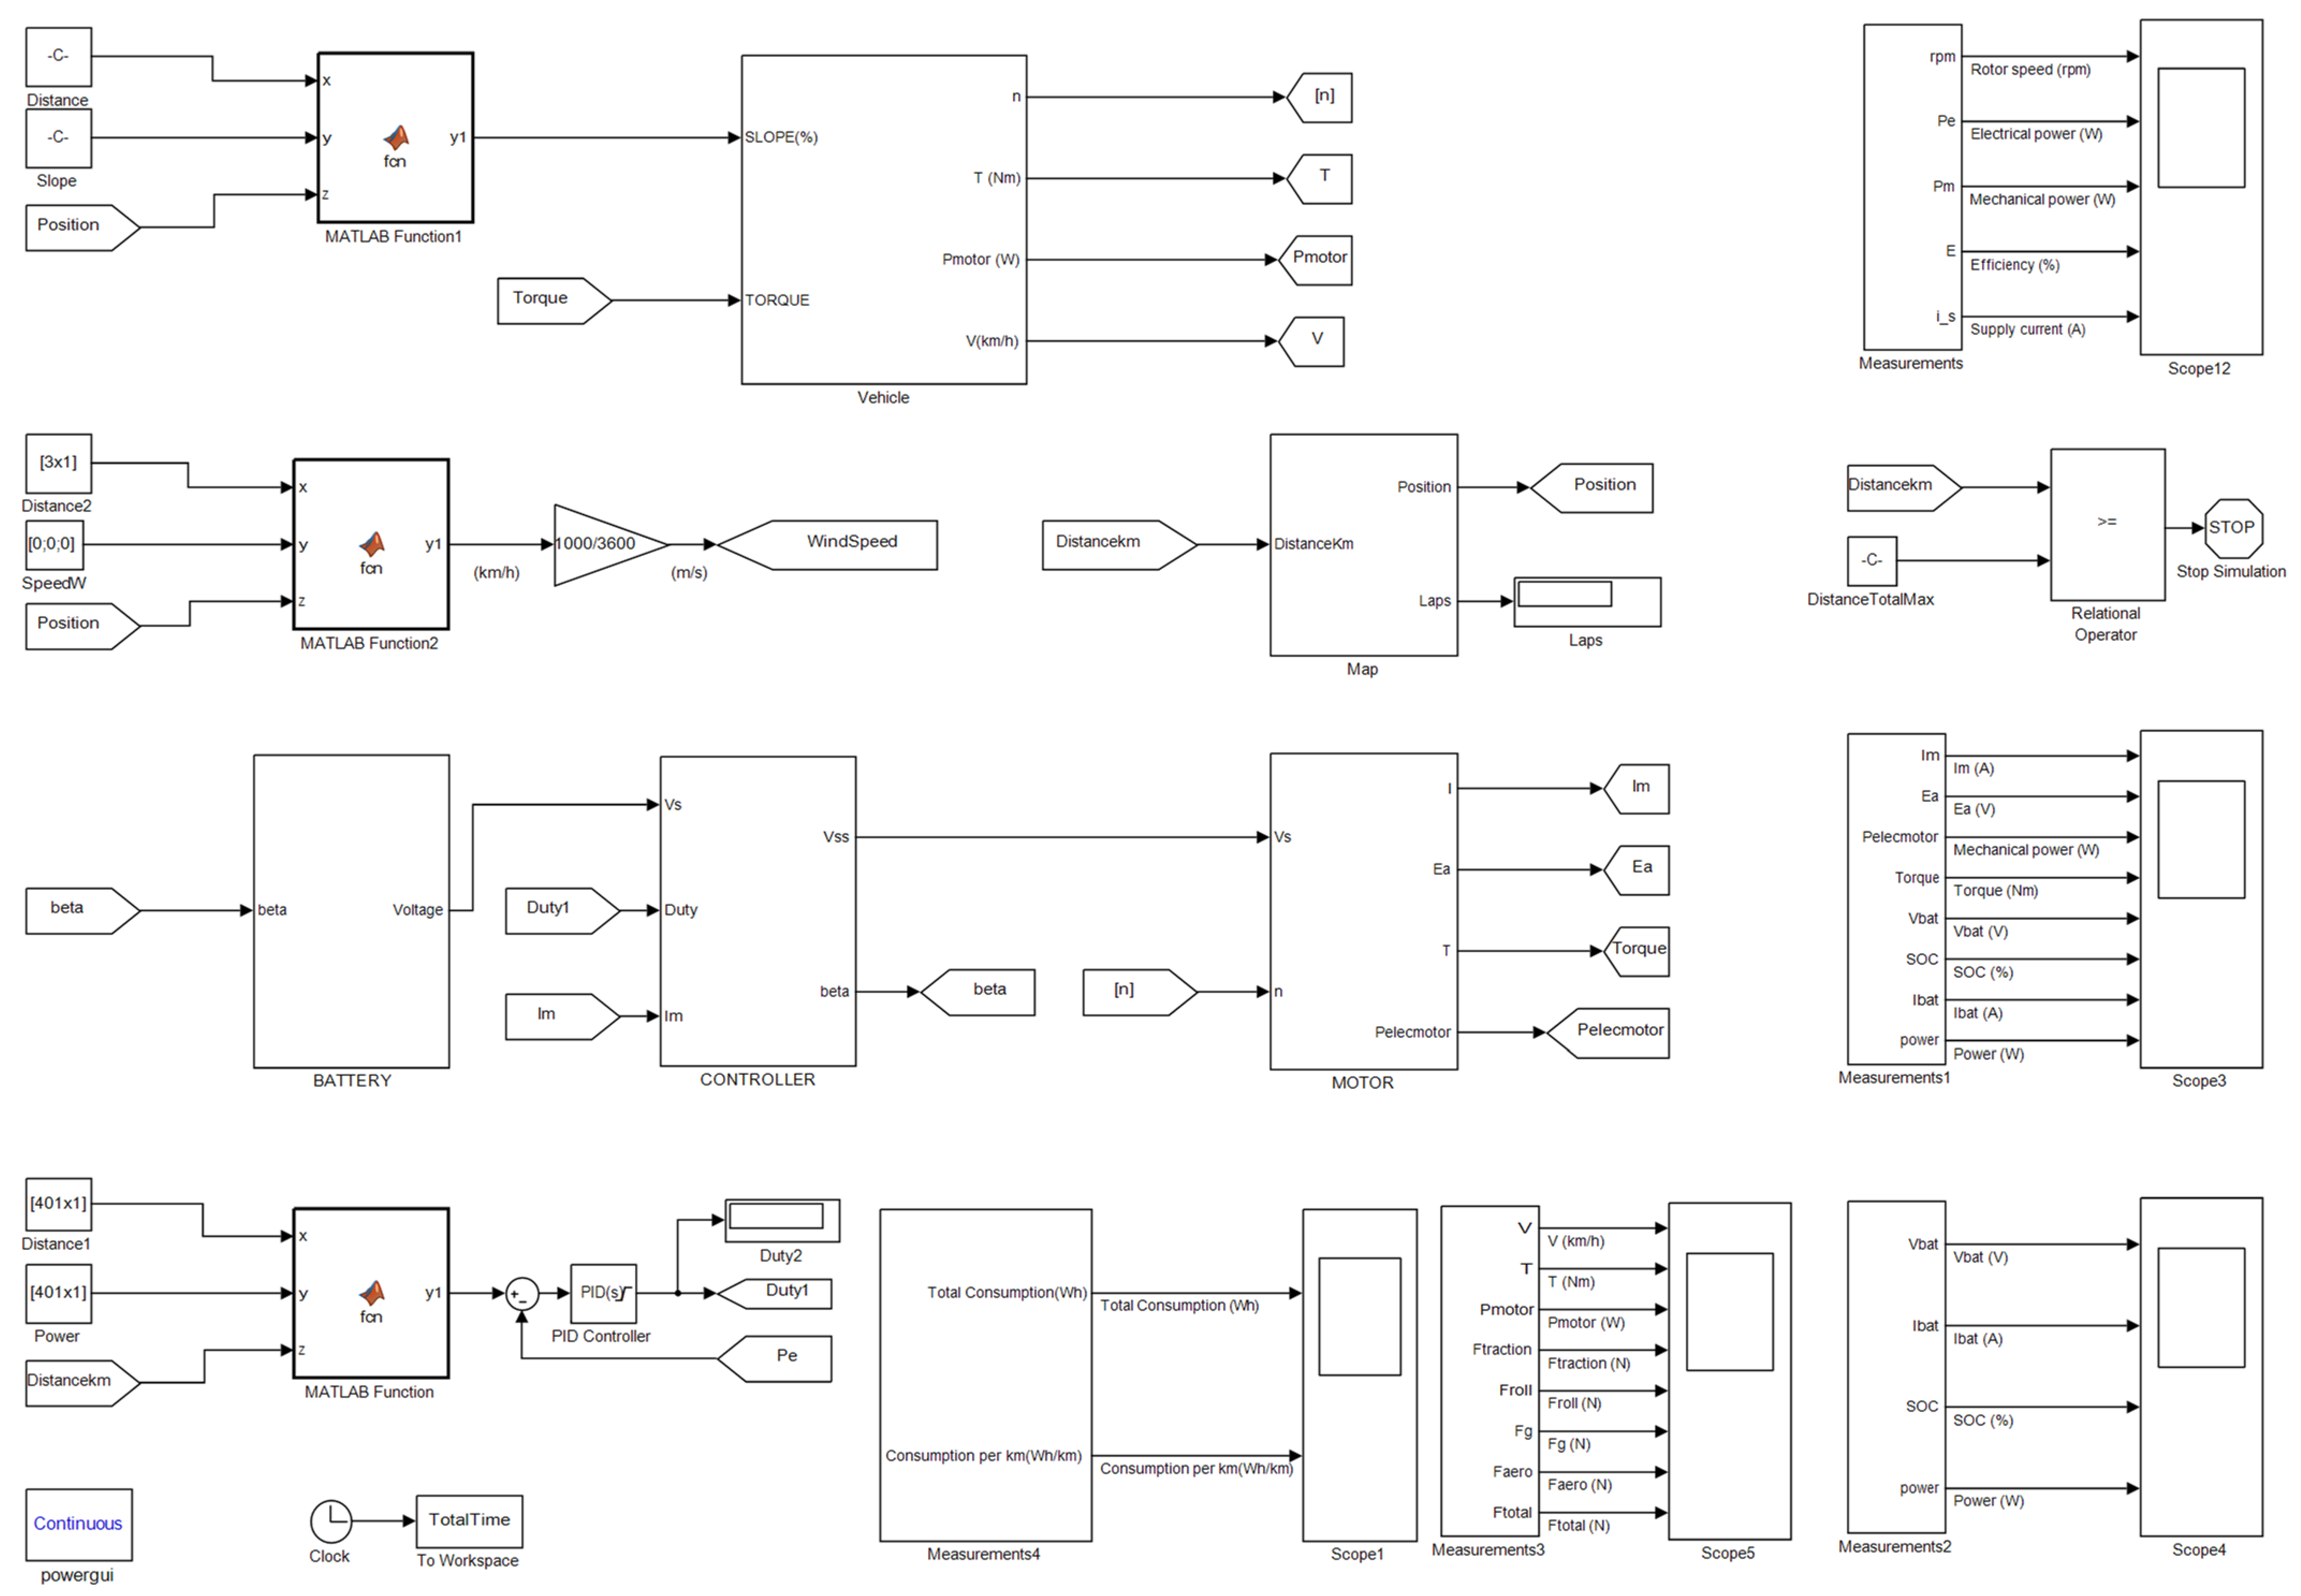
The simulation tool involves each component of the complete system model of the vehicle; that is, it is made up of the part that models the vehicle, the battery, the controller, the motor and the throttle (see
Figure 10 and
Figure 11).
3.1. Vehicle Model
This section deals with the modelling of the vehicle dynamics. Four different vehicle dynamics models were implemented. Depending on the input variable that is imposed, it will have control over the duty cycle (Duty cycle), motor torque, battery power or vehicle speed.
In this dynamic block, it imposes or fixes the torque of the engine at any moment as an input variable. In this way, control on the motor traction torque of the vehicle is carried out. This is interesting, as it will allow us to set the value of the engine torque to zero on the downhill slopes of the circuit, thus taking advantage of all the potential energy of the vehicle on the descents.
The ‘Vehicle’ subsystem (see
Figure 10) is responsible for solving the first-order differential equation that modelled the dynamic performance of the vehicle (11), as seen in
Section 2.2. At this point, it is important to remember that the input speed of this block, which is involved in the calculation of the aerodynamic resistance, is the speed of the vehicle with regard to the air, which is obtained by superposing the speed with the road and the speed of the wind.
The Matlab Function1 and torque blocks obtain the necessary input parameters to the ‘Vehicle’ subsystem. The first of them provides the value in % of the slope of the circuit at that instant. The second one provides the dynamic model with the value of the torque supplied by the electric motor (see
Figure 11).
3.2. Battery Block Model
In this section, the performance of the electric vehicle battery is modelled. Battery [
36] is responsible for supplying the energy necessary to feed the motor. It was decided to use an existing block in the Electrical library Sources from Matlab (Battery) that implements a parametric dynamic model capable of representing the most used rechargeable batteries.
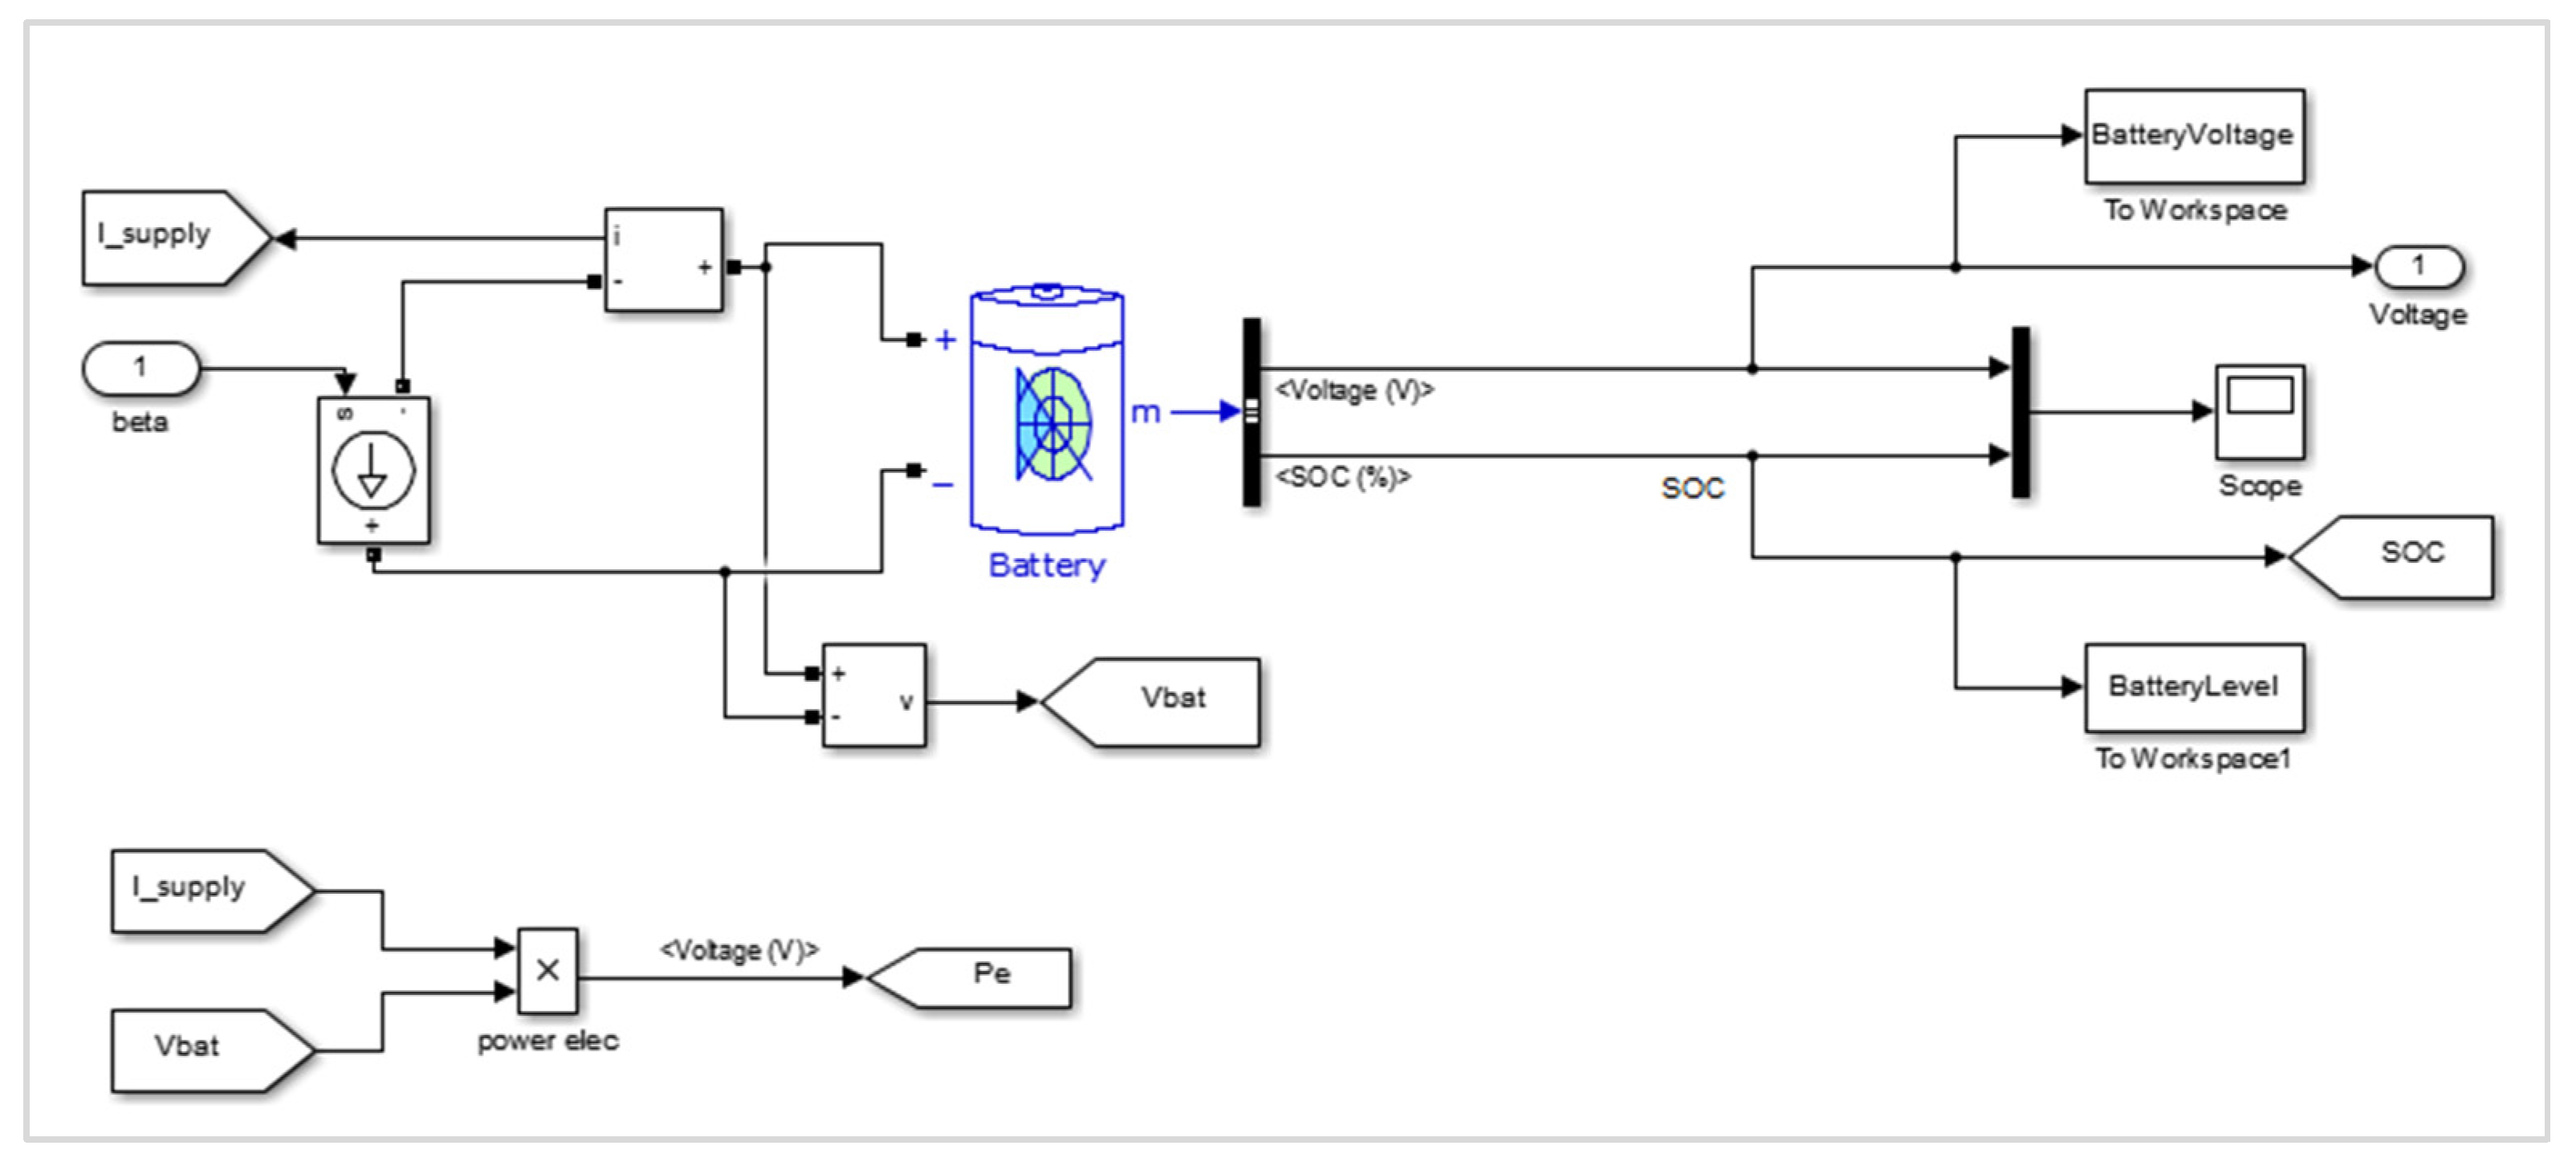
The BATTERY subsystem has an output, Voltage, which is the voltage supplied by the battery, and an input, beta, which is the discharge current. Next, in
Figure 12, the internal configuration of the subsystem is presented, where some elements, such as the ammeter, voltmeter and controlled current source, have been added. The current source is controlled through the
beta variable, which is determined by the current that the vehicle’s electric motor is demanding at any given moment.
3.3. Engine Block Model
This section models the performance of the motor of the electric vehicle. The engine is responsible for supplying the mechanical power necessary to move the vehicle following the torque and speed instructions.
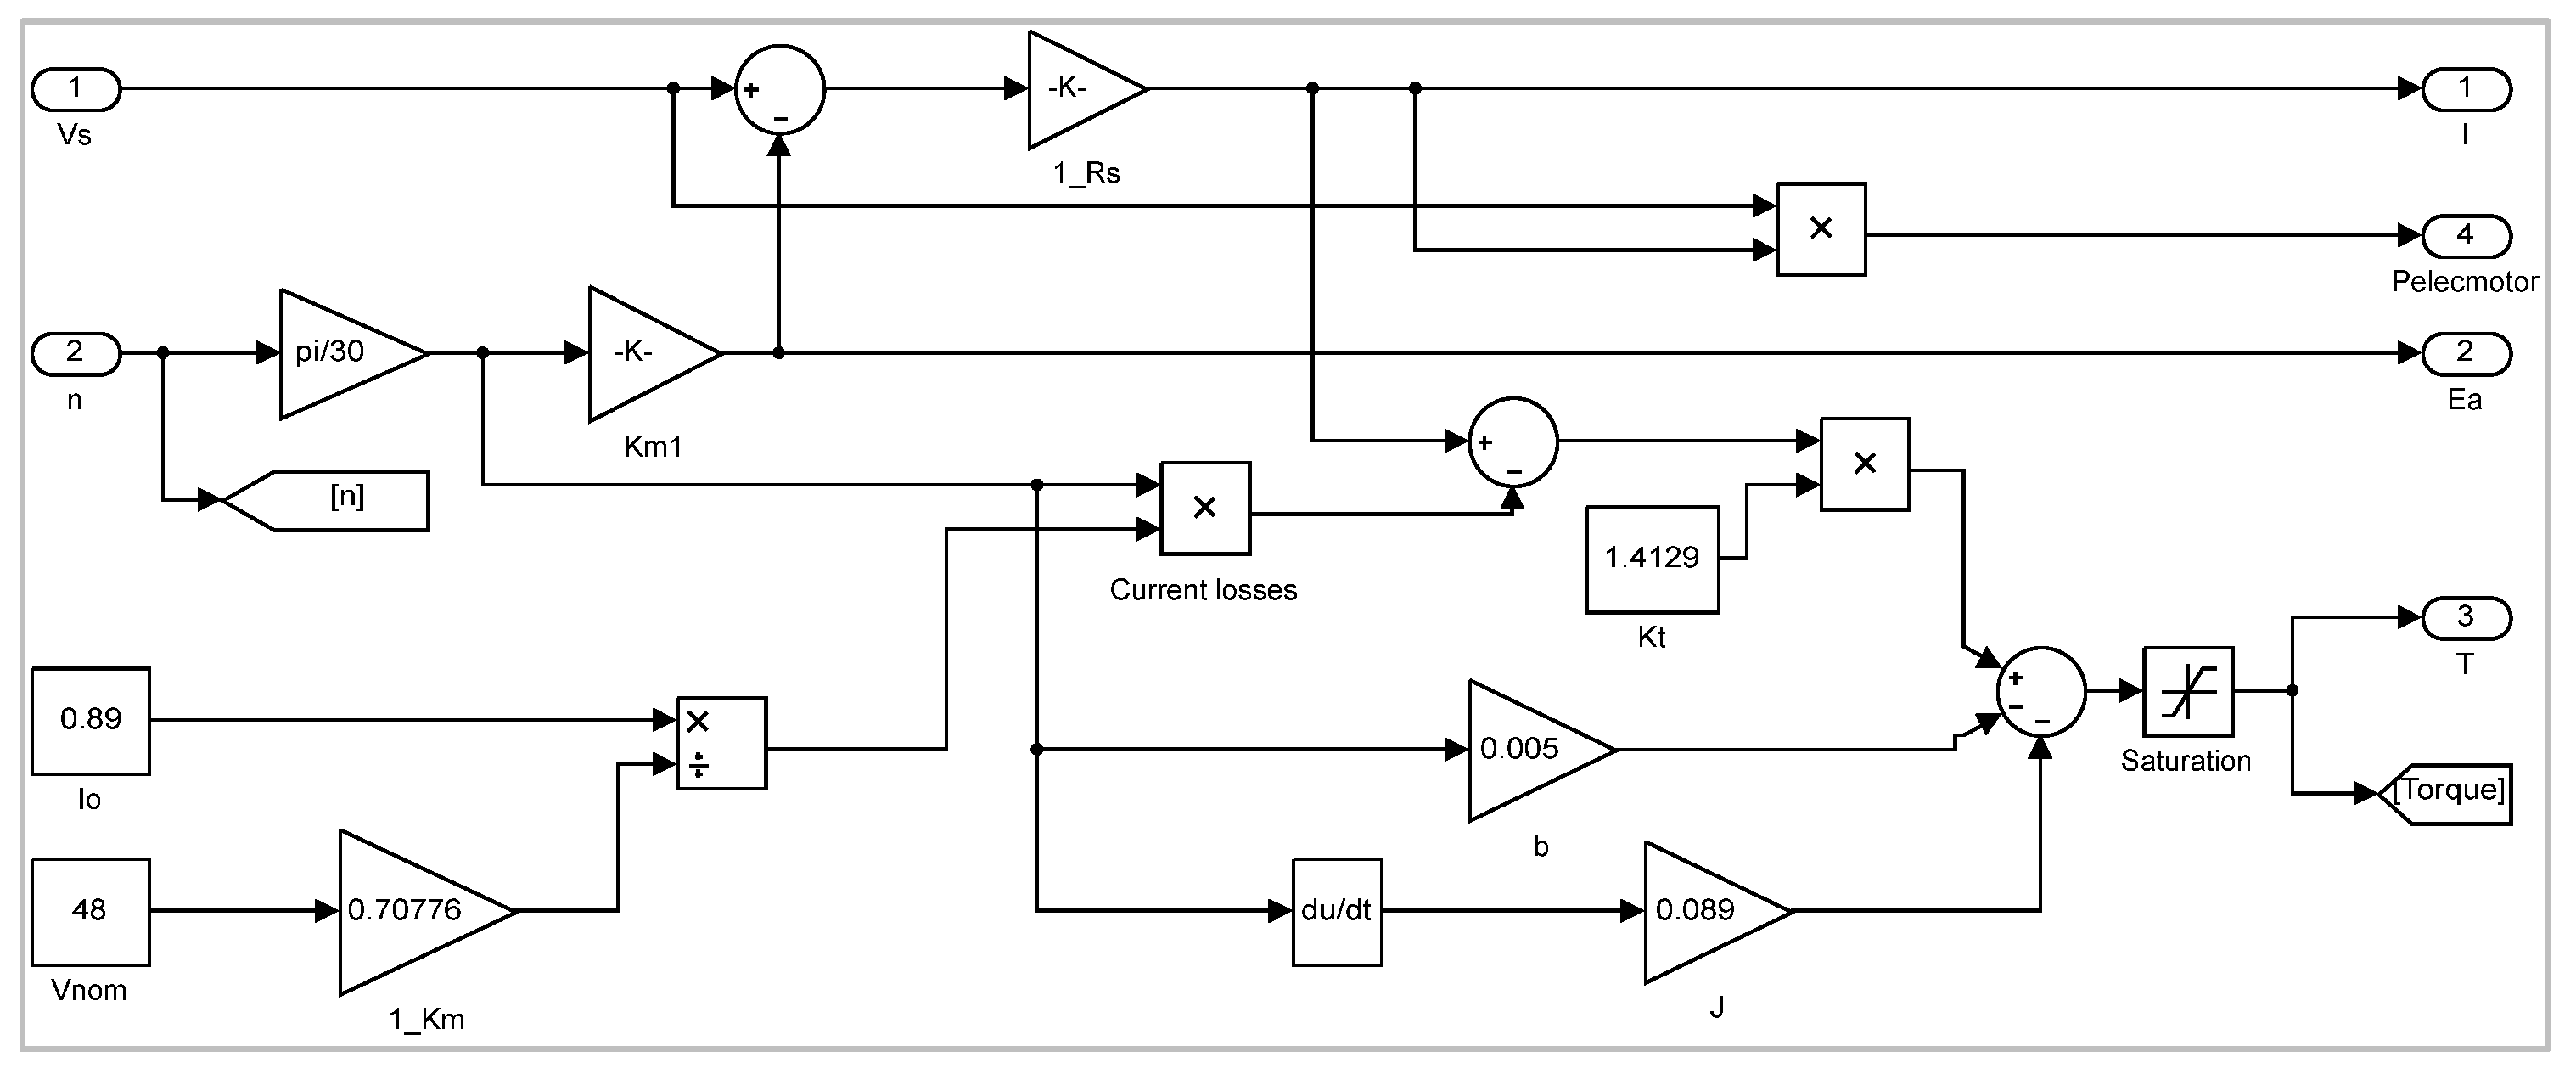
The motor block implements a dynamic model of a DC motor. These motors can work both in motor mode and in generator mode, this being determined by the sign of the mechanical torque (positive for motor mode, negative for generator mode). The engine block model layout is shown in
Figure 13.
In order to simulate the performance of this engine when it is connected to the battery of the vehicle, it has the input parameter Vs, which provides the voltage from the battery. In addition, the engine has an input speed ‘n’ in r.p.m that is fed back from vehicle dynamics. As outputs, the motor block presents the current, the electromotive force, the torque and the power of the motor.
3.4. Control Modes
In most of the literature, driving cycles are used to simulate the models, which try to resemble the performance of a driver on an urban or interurban route; see, as an example, the New European Driving Cycle (NEDC), which consists of four repeated ECE-156 driving cycles and one extra-urban cycle (EUDC). However, this type of test is designed with the aim of evaluating the environmental impact of automobiles, and, from our point of view, for a prototype electric vehicle, which this study concerns, whose objective is consumption efficiency, it is considered inconvenient for the variable that is to be set as the simulation input to be the speed profile. It will be more suitable to try to address the problem of improving vehicle efficiency by proposing different driving strategies, such as setting the duty cycle, engine torque, battery power or vehicle speed. In this sense, authors such as [
46] reflect in their studies forms of ecological driving whose objective is a reduction in consumption.
This section explains the different models or modes of control over the electric motor. As previously mentioned, four different models were implemented. Depending on the input variable that is imposed, we will have control over the duty cycle of the motor controller, the motor torque, the battery power or the vehicle speed.
3.4.1. Duty Cycle Control
In this part, the input variable is the duty cycle generated by the controller, so a direct control is being carried out on the motor. By varying the duty cycle, the motor supply voltage is being varied. In this case, the user enters the duty cycle as input data to the simulation tool.
This block simulates the behaviour when the throttle signal acts directly on the motor controller, without using power, torque or speed feedback.
3.4.2. Torque Control
In this section, the input variable of the simulation tool is the motor torque. Using these data as the set point of proportional–integral–derivative (PID) control, the duty cycle of the motor controller is obtained as output.
This block simulates the behaviour when the throttle signal acts as the set point input of a PID controller, whose feedback signal must be obtained from a sensor that measures the current consumed by the motor.
3.4.3. Battery Power Control
In this section, the input variable of the simulation tool is the battery power. Using these data as the set point of PID control, the duty cycle of the motor controller is obtained as output.
This block simulates the behaviour when the throttle signal acts as the set point input of a PID controller, whose feedback signal must be obtained from a sensor that measures the current supplied by the battery.
3.4.4. Vehicle Speed Control
In this part, the input variable of the simulation tool is the vehicle speed. Using these data as the set point, PID control is performed to maintain the vehicle speed adjusted to this set point. By varying the vehicle speed, the voltage, current and torque motor supply is obtained.
3.4.5. Controller
The vehicle control system is a fundamental part of energy saving. In this respect, control systems that present feedback of some signal, such as engine speed or current, are much more advantageous than control systems without feedback. In systems with feedback, a reference or setpoint value is established for the feedback variable and an algorithm is executed, usually PID, that forces the real magnitude of that reference variable to remain as close to the actual measured values as possible.
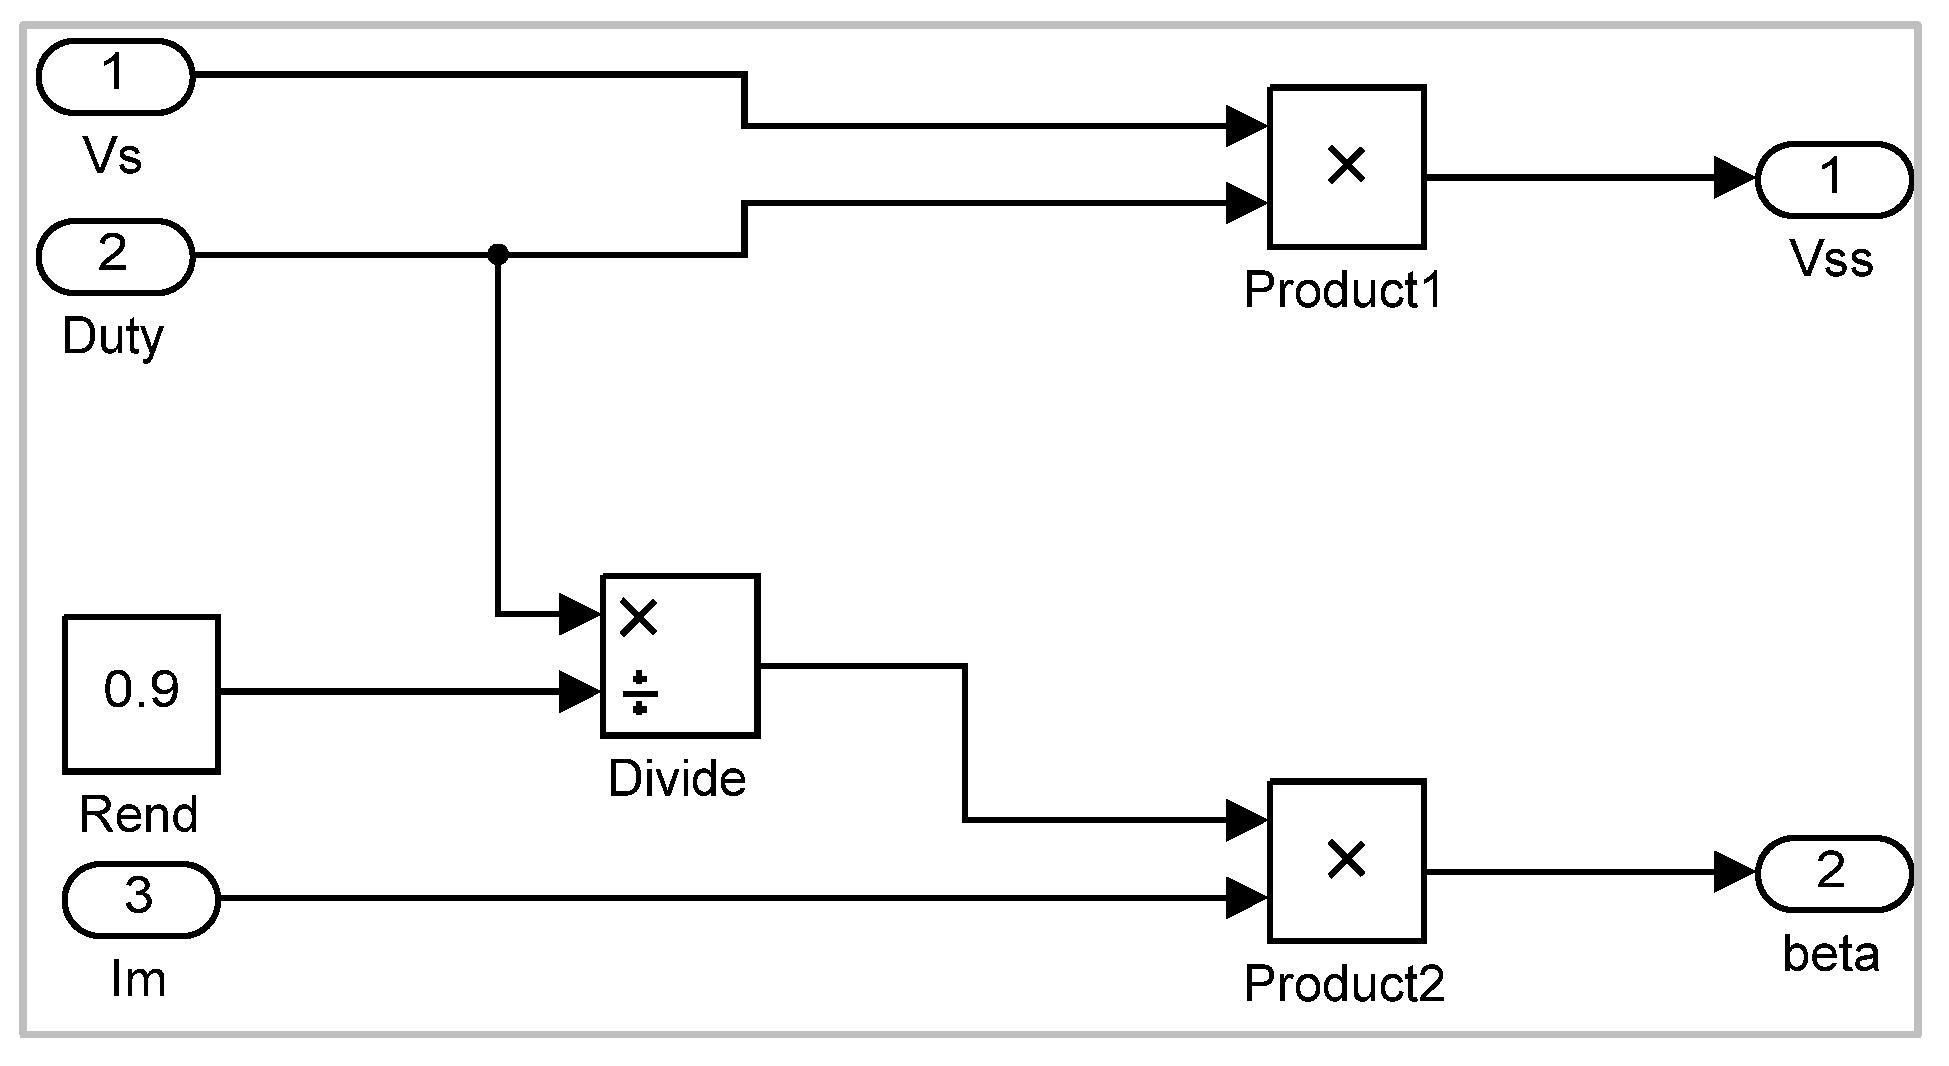
This block is responsible for regulating the supply voltage of the electric motor of the vehicle. As input parameters, the block needs the battery voltage and the duty cycle. Feedback signals can be motor current, battery current, or vehicle speed. As output parameters, it offers the voltage (Vss) for the electric motor supply and the discharge current (beta) of the battery.
The motor supply voltage is the product of the battery voltage times the duty cycle. The model includes a parameter that introduces the performance of the controller as can be seen in
Figure 14.
The motor supply voltage (
Vss) is the product of the battery voltage (
Vs) times the duty cycle (
Duty):
The current drawn from the battery (
β) is equal to the motor current (
Im) times the duty cycle and divided by the controller efficiency (
Rend):
3.5. Block Model of the Road
This section is responsible for supplying the block model with the distance and inclination data in each position of the vehicle’s route.
The block oversees building the piecewise linear function and obtaining the inclination value corresponding to the current section of the route.
The position of the vehicle in the circuit is given by the map subsystem based on the distance covered. In addition, this block returns the number of laps to the circuit as data (see
Figure 9).
4. Description of the Graphical Interface
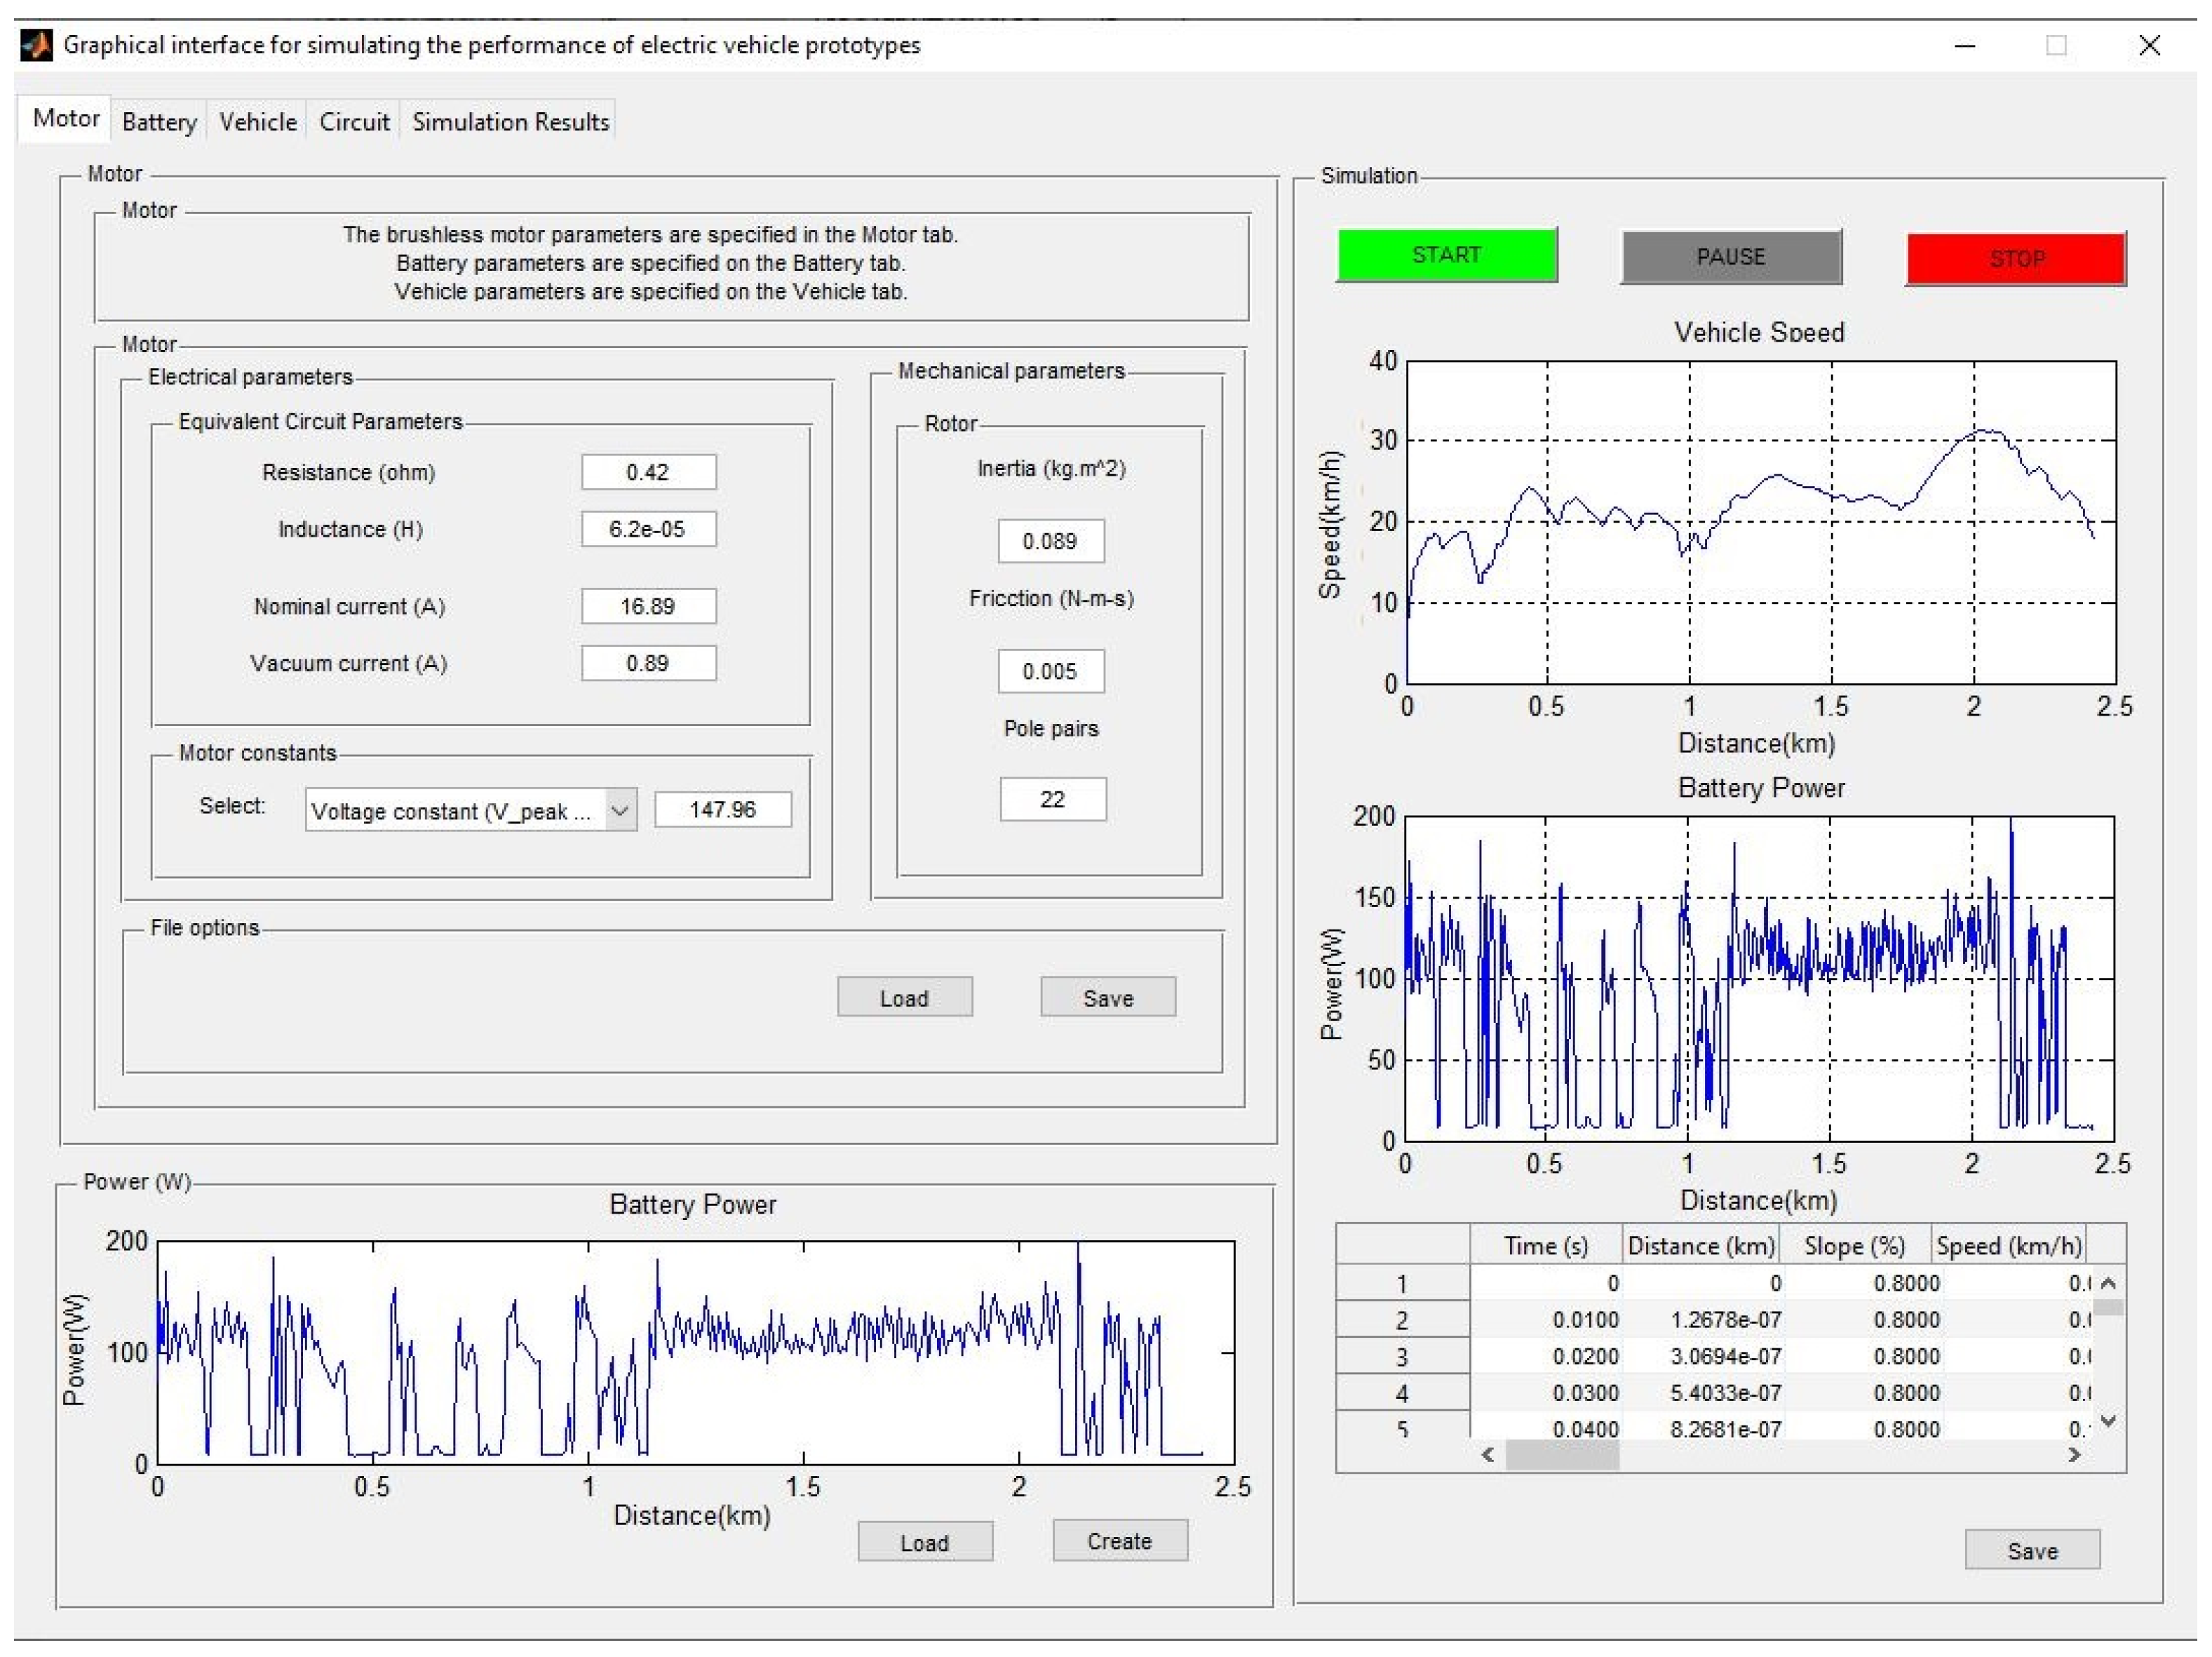
A user-friendly graphical interface was designed using the Matlab GUIDE platform. The purpose of the GUI is to be able to easily control and simulate the Simulink model that has been developed in Matlab. The parameter values of each block can be modified through this interface so that each user can simulate according to a configuration, fixing a series of variables and modifying others, to determine the effect that it causes on the performance of the vehicle. Through this interface, these steps are easy to apply, avoiding the direct manipulation of the model created in Simulink and its possible complexity.
On the home screen of the simulation tool, there is a drop-down menu. In this menu, the user must select the simulation model depending on whether to control the duty cycle, motor torque, battery power or vehicle speed, respectively. Once one of the options is selected, the program opens a main window that links to each of the available simulation models.
The interface is structured in panels to visually facilitate the work. Three zones are distinguished within the bulk of the simulation tool. The first one, located in the upper left part of it, is where the main parameters of the electric vehicle model are located. In the second zone, which is distinguished in the lower left part of the interface, the duty cycle, motor torque, battery power or vehicle speed are located according to the input parameter. Finally, the right area of the interface shows the fundamental part of the simulation tool where the simulation of a prototype electric competition vehicle is carried out.
5. Results and Discussion
This section presents the results and the evaluation and validation process of the simulation tool for the proposed vehicle. Most of the research, both on conventional EVs and HEVs—electric vehicles and light electric vehicles—carry out simulations and real tests based on the driving cycles (speed profile) that are established according to the norm as previously mentioned. In this proposal, the control strategies adopted for the model were control over the duty cycle, the motor torque, the battery power and the vehicle speed. The results of the tests carried out show that the dynamic performance of the vehicle under such a control was better compared to other control schemes in achieving the objective of improving the vehicle’s energy efficiency.
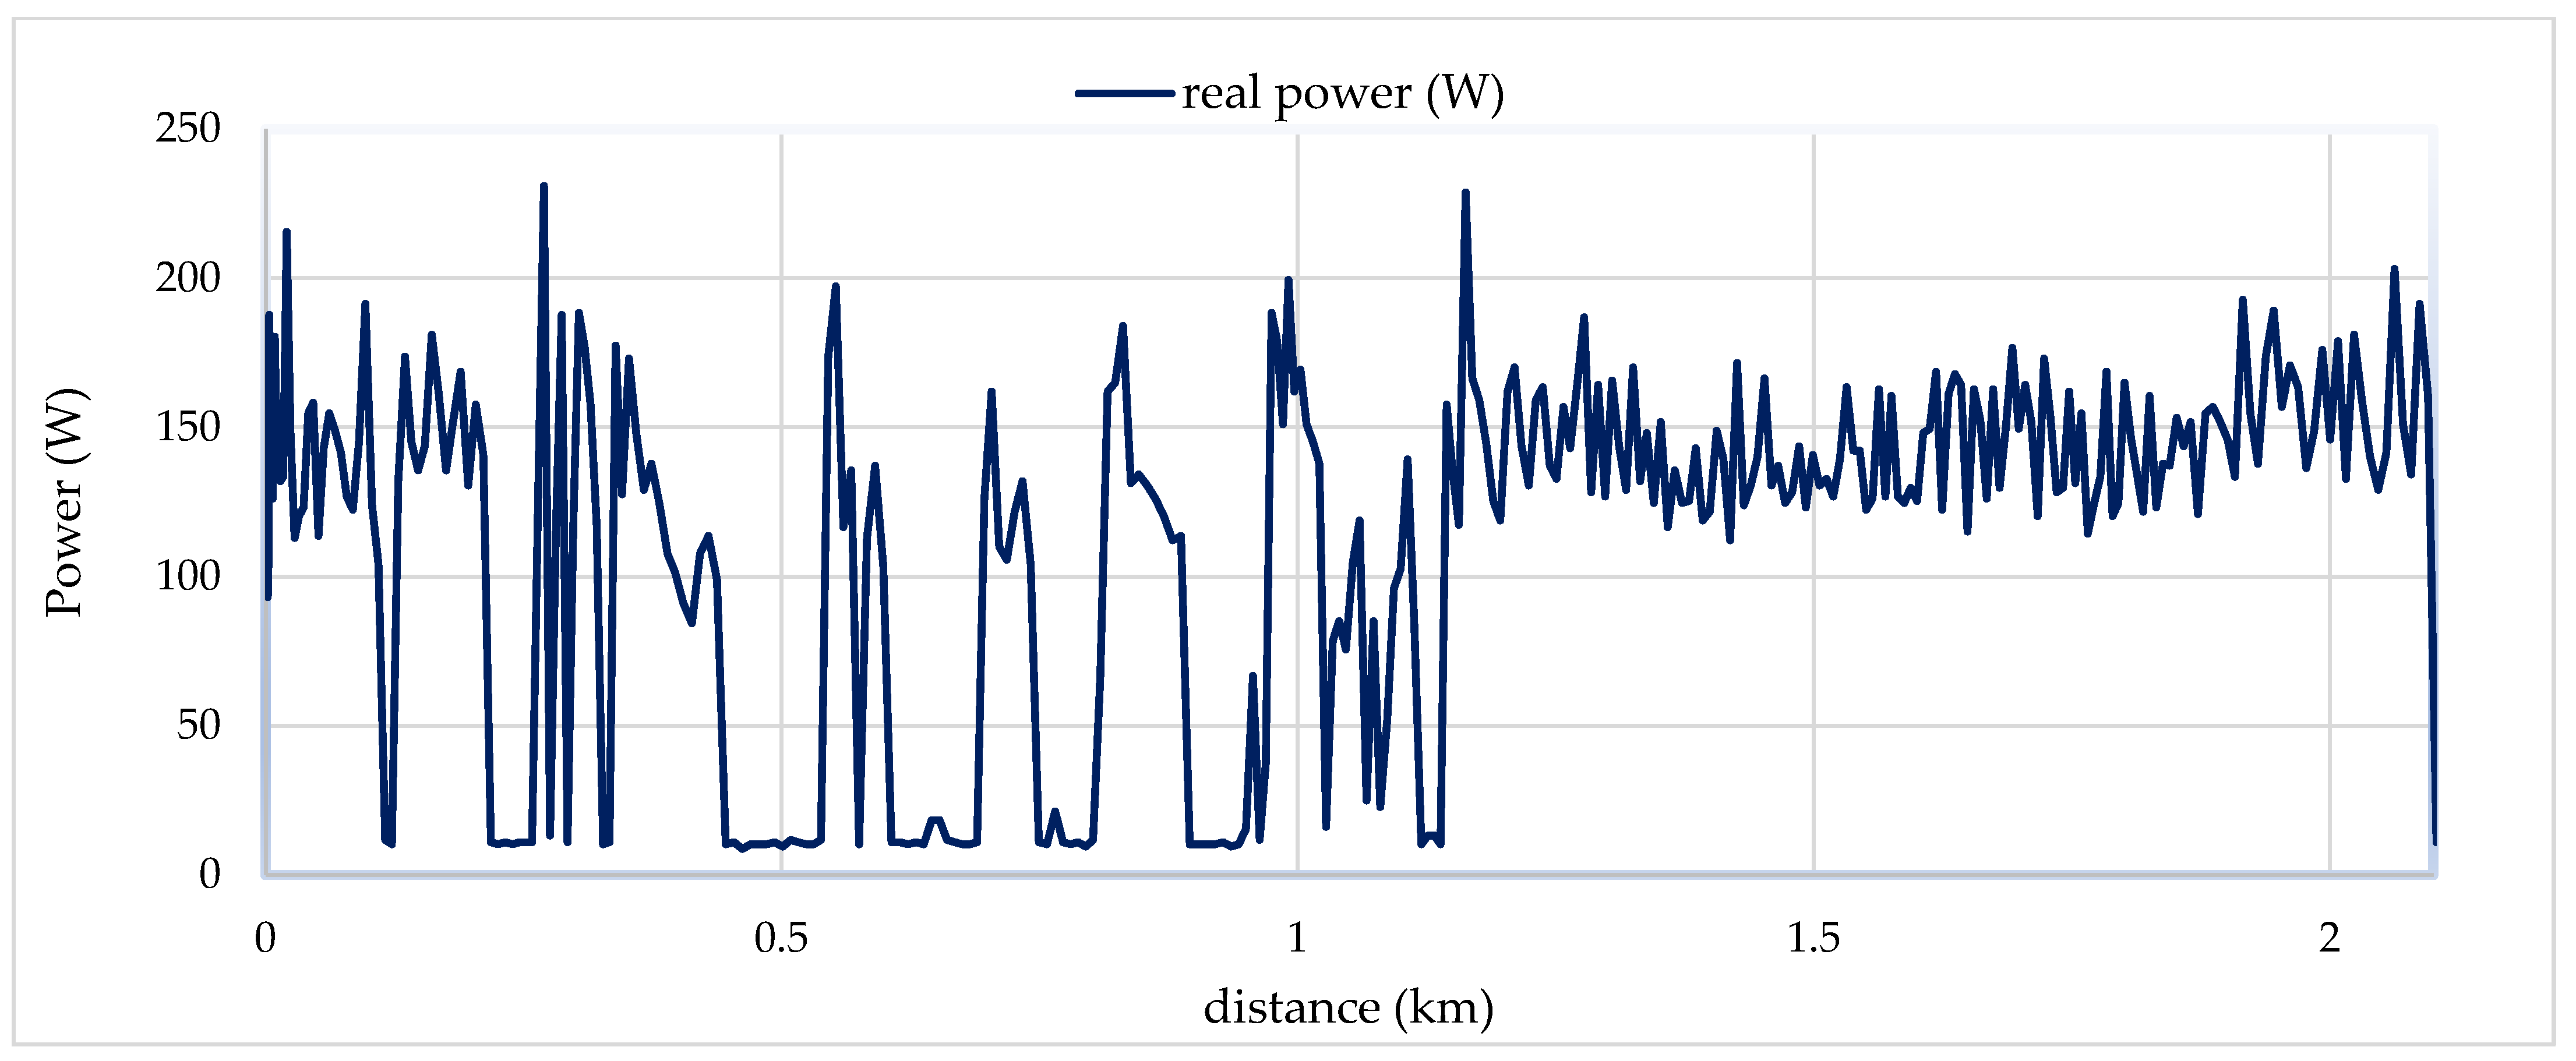
The calibration and validation of the simulation tool were performed by comparing it with the data collected in a real test of the TEO2 vehicle. This vehicle does not have a feedback loop control system, so the control was carried out directly by the pilot, who manually regulated the duty cycle of the motor controller. In the test, an attempt was made to apply a varied driving strategy so that, in the first part of the circuit power, peaks were alternated while, in the second part, an attempt was made to keep the power approximately constant.
The simulation of the model was carried out by configuring through the user interface all the parameters corresponding to the vehicle, such as those related to the engine, weight, aerodynamic coefficient, etc., that characterise it, the elevation profile of the circuit and the selected driving strategy (see
Figure 15). The input data to the model were the real power of the vehicle in the test, which is shown in
Figure 16.
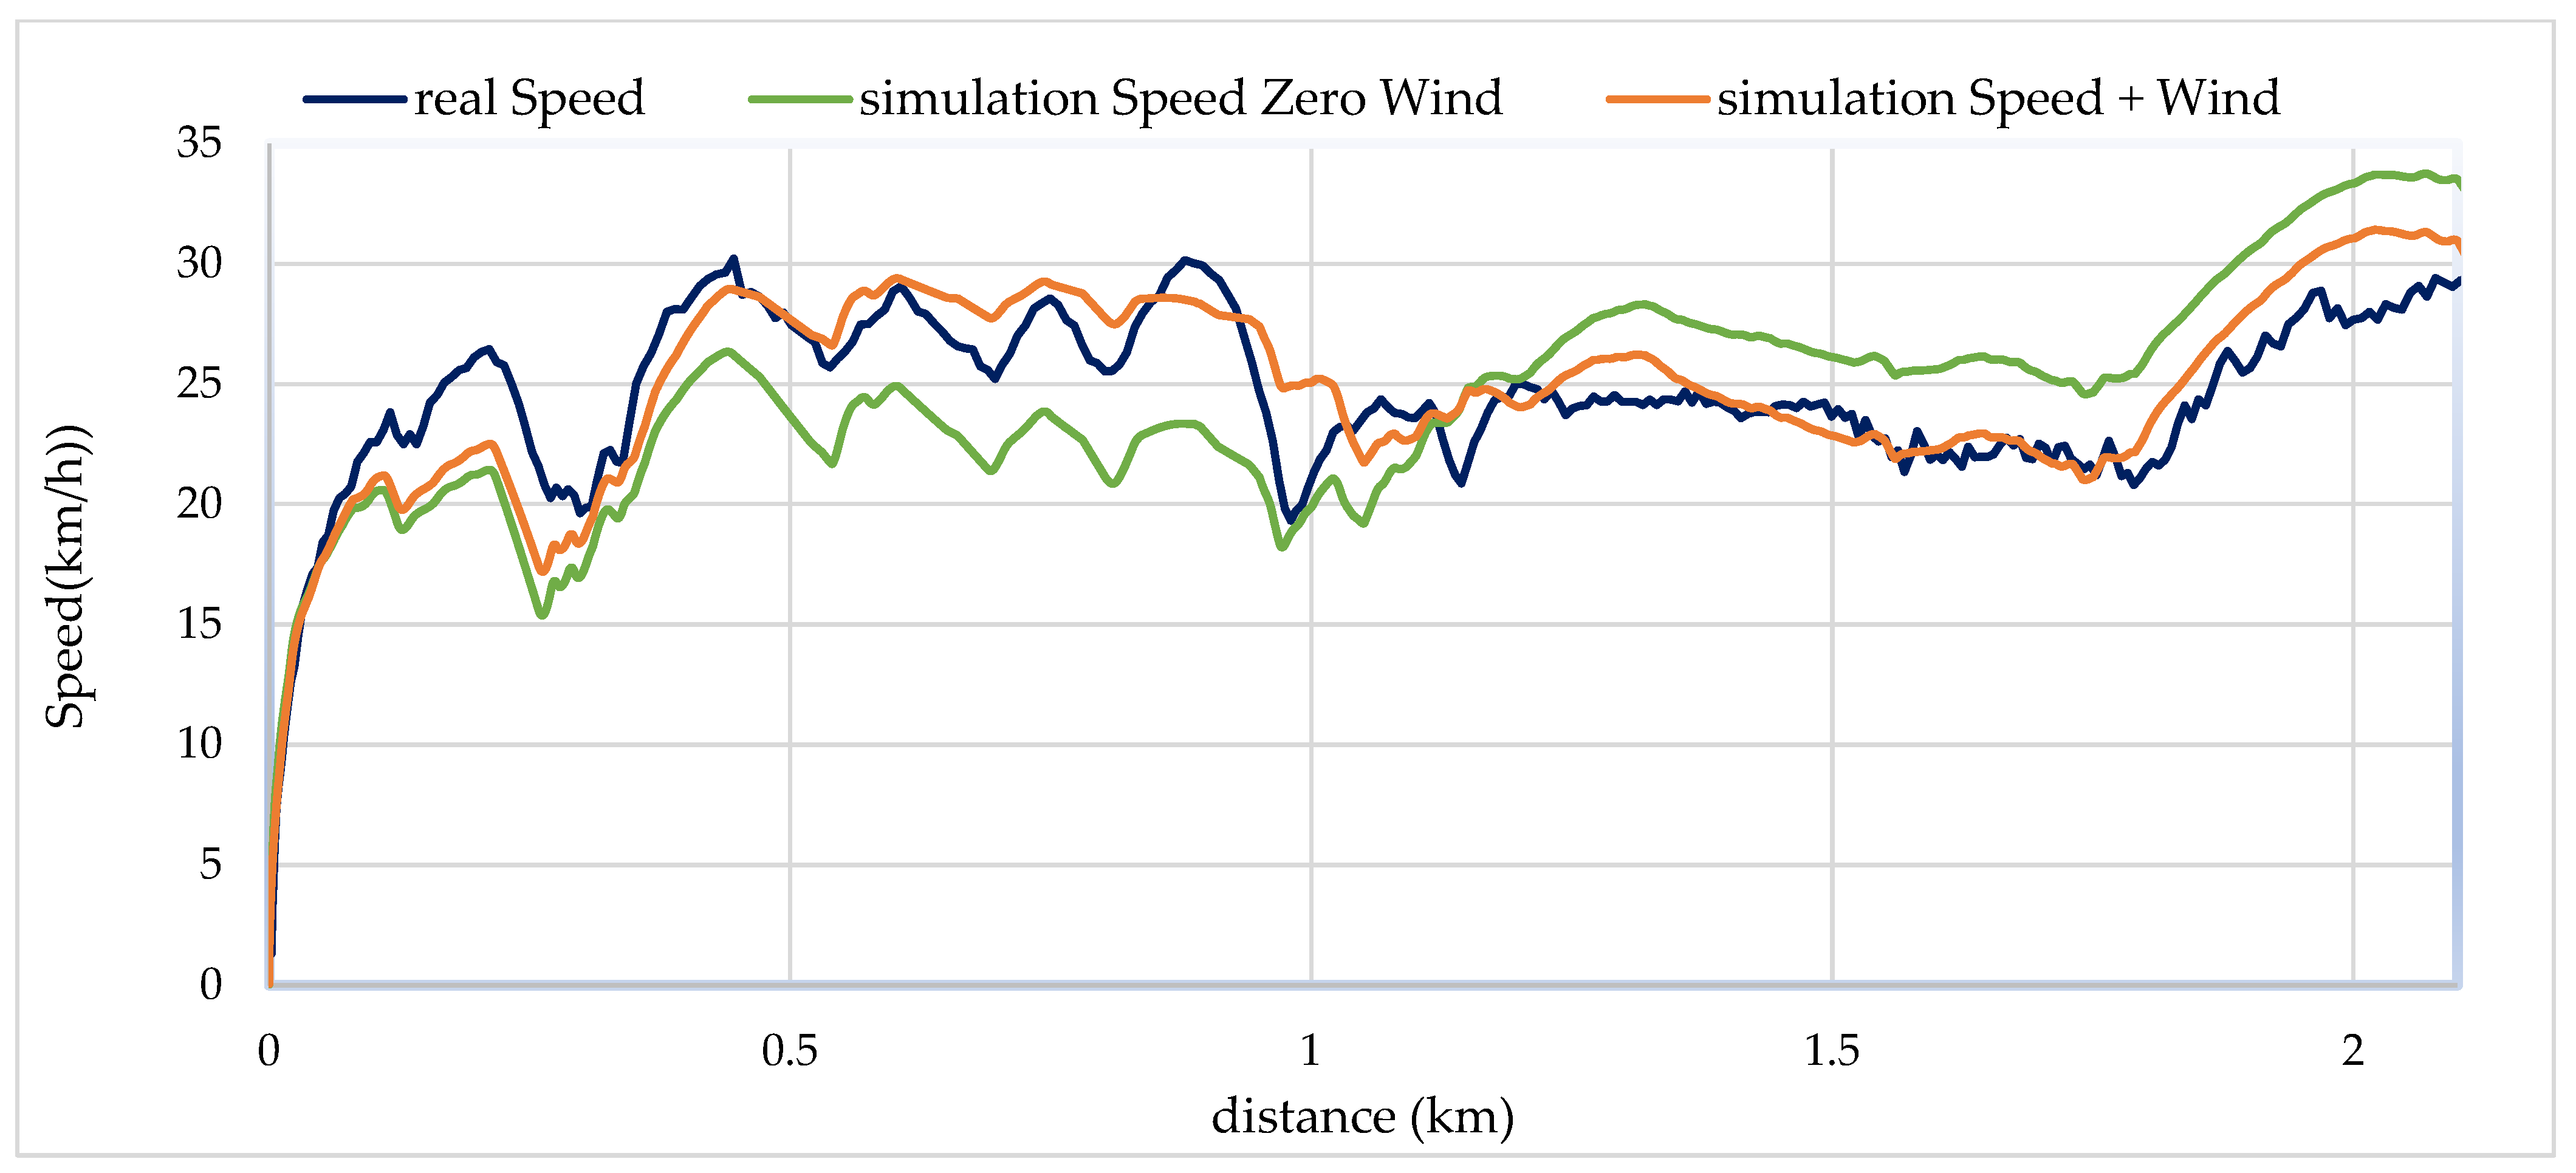
A representation of the real speed versus the simulated speed is shown in
Figure 17, where a comparison of the superimposed results is presented. If speeds are compared, it can be seen that the speed profile is similar, but, in the first section, the speed of the simulation is lower while, in the second section, it is higher. Considering the topology of the circuit, which is a round trip (see
Figure 9), the effect of the wind on the movement of the vehicle is considered as a hypothesis of the variations with respect to the real speed in the vehicle test. No wind speed data were collected in the vehicle test, but the wind weather conditions were acceptably good on the day of the test. In order to know the effect of wind, a new simulation was carried out that includes the variable speed of the wind in different sections on the route. A favourable winds speed of 10 km/h was introduced in the first half of the route while, in the second part, this wind is contrary to the movement of the vehicle. It can be seen in
Figure 17 how, by including the wind speed, the results offered by the simulation tool are much closer to the real data test. In this case, the result of the mean deviation of the model with respect to the real speed data is acceptable. In addition, this deviation may be due to other factors that affect the model variables, as well as the simplifications that were considered in it. Something to keep in mind is that the efficiency of the engine is not constant, which can lead to small variations in terms of mechanical torque.
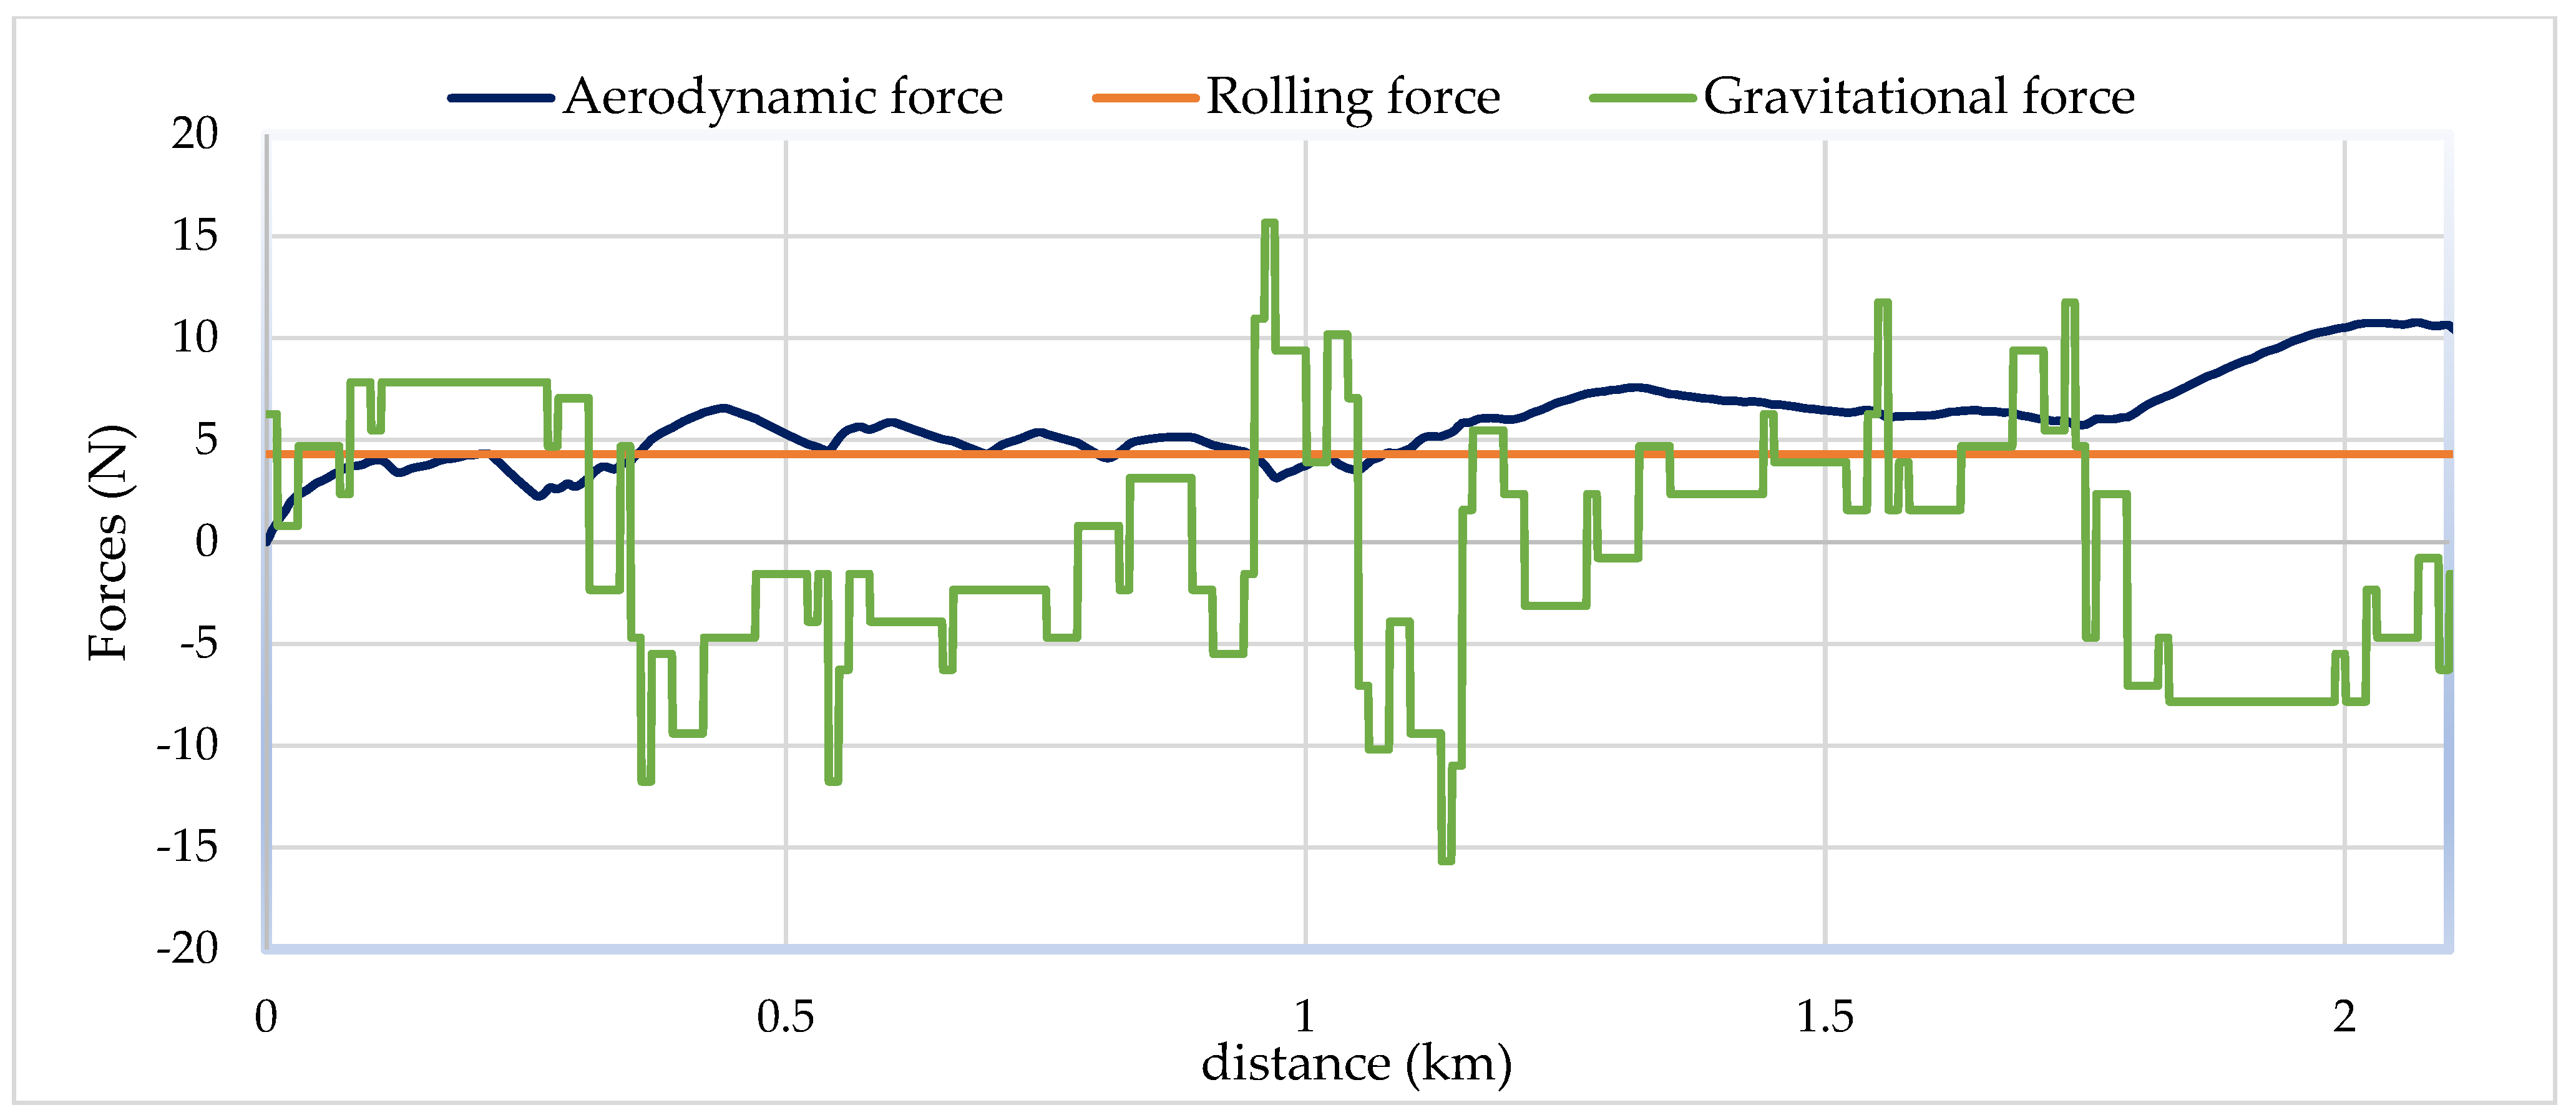
The implemented block model offers a great variety of information in representations of measurements about the engine, vehicle dynamics, power, etc. In addition, the interface allows us to save all the relevant data in a spreadsheet for detailed analysis. As an example,
Figure 18 shows a representation of the vehicle dynamic forces from the data collected, in which the contribution of each of them can be observed independently.
Considering all of the above, we can conclude that the developed model represents a good approximation to the real data because of the similarity of the results compared to the results of the measurements on the route in the real test of the vehicle.
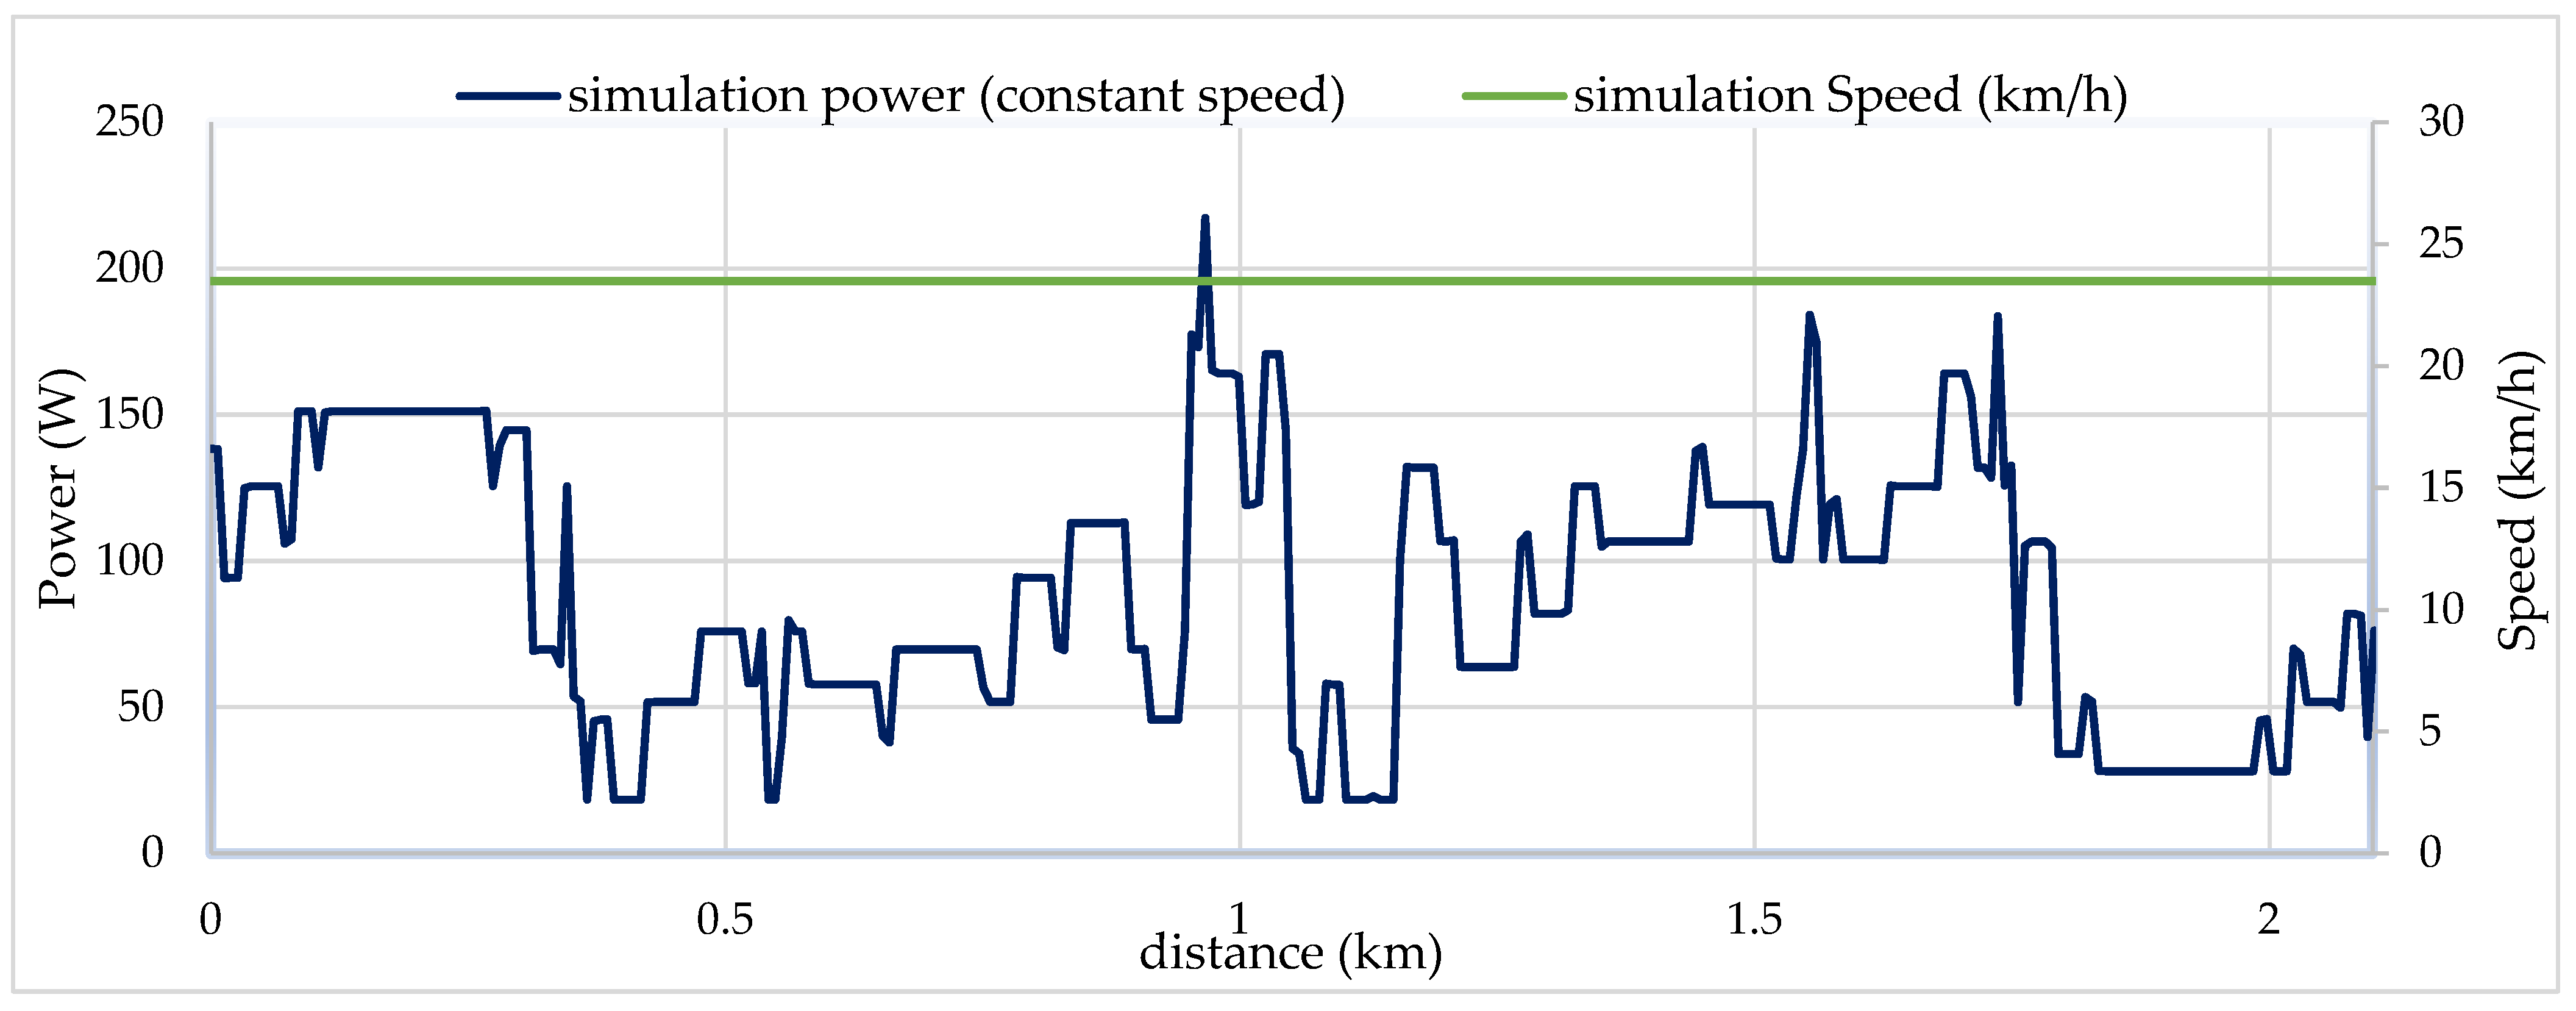
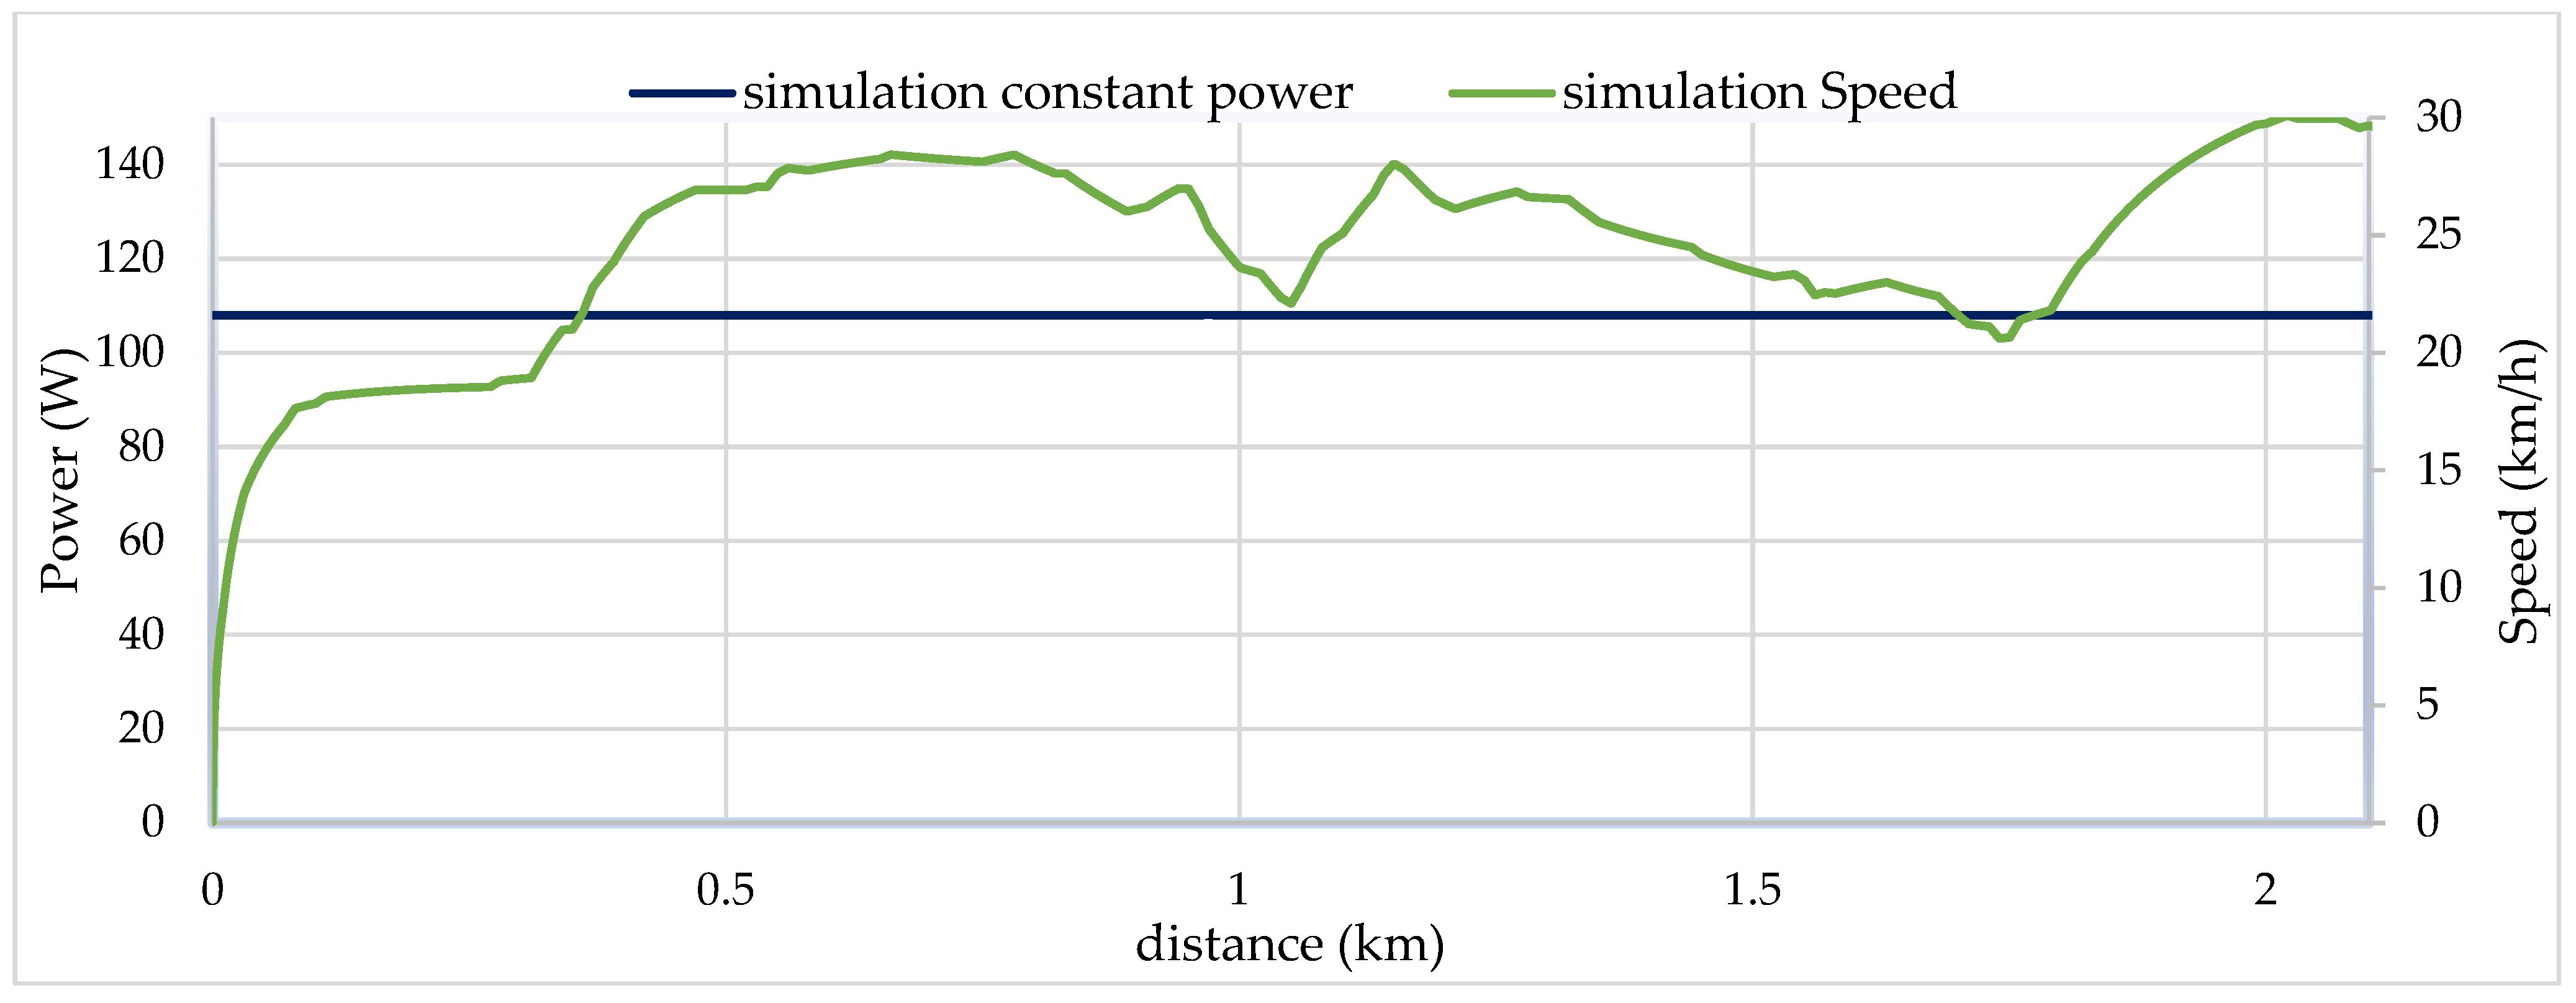
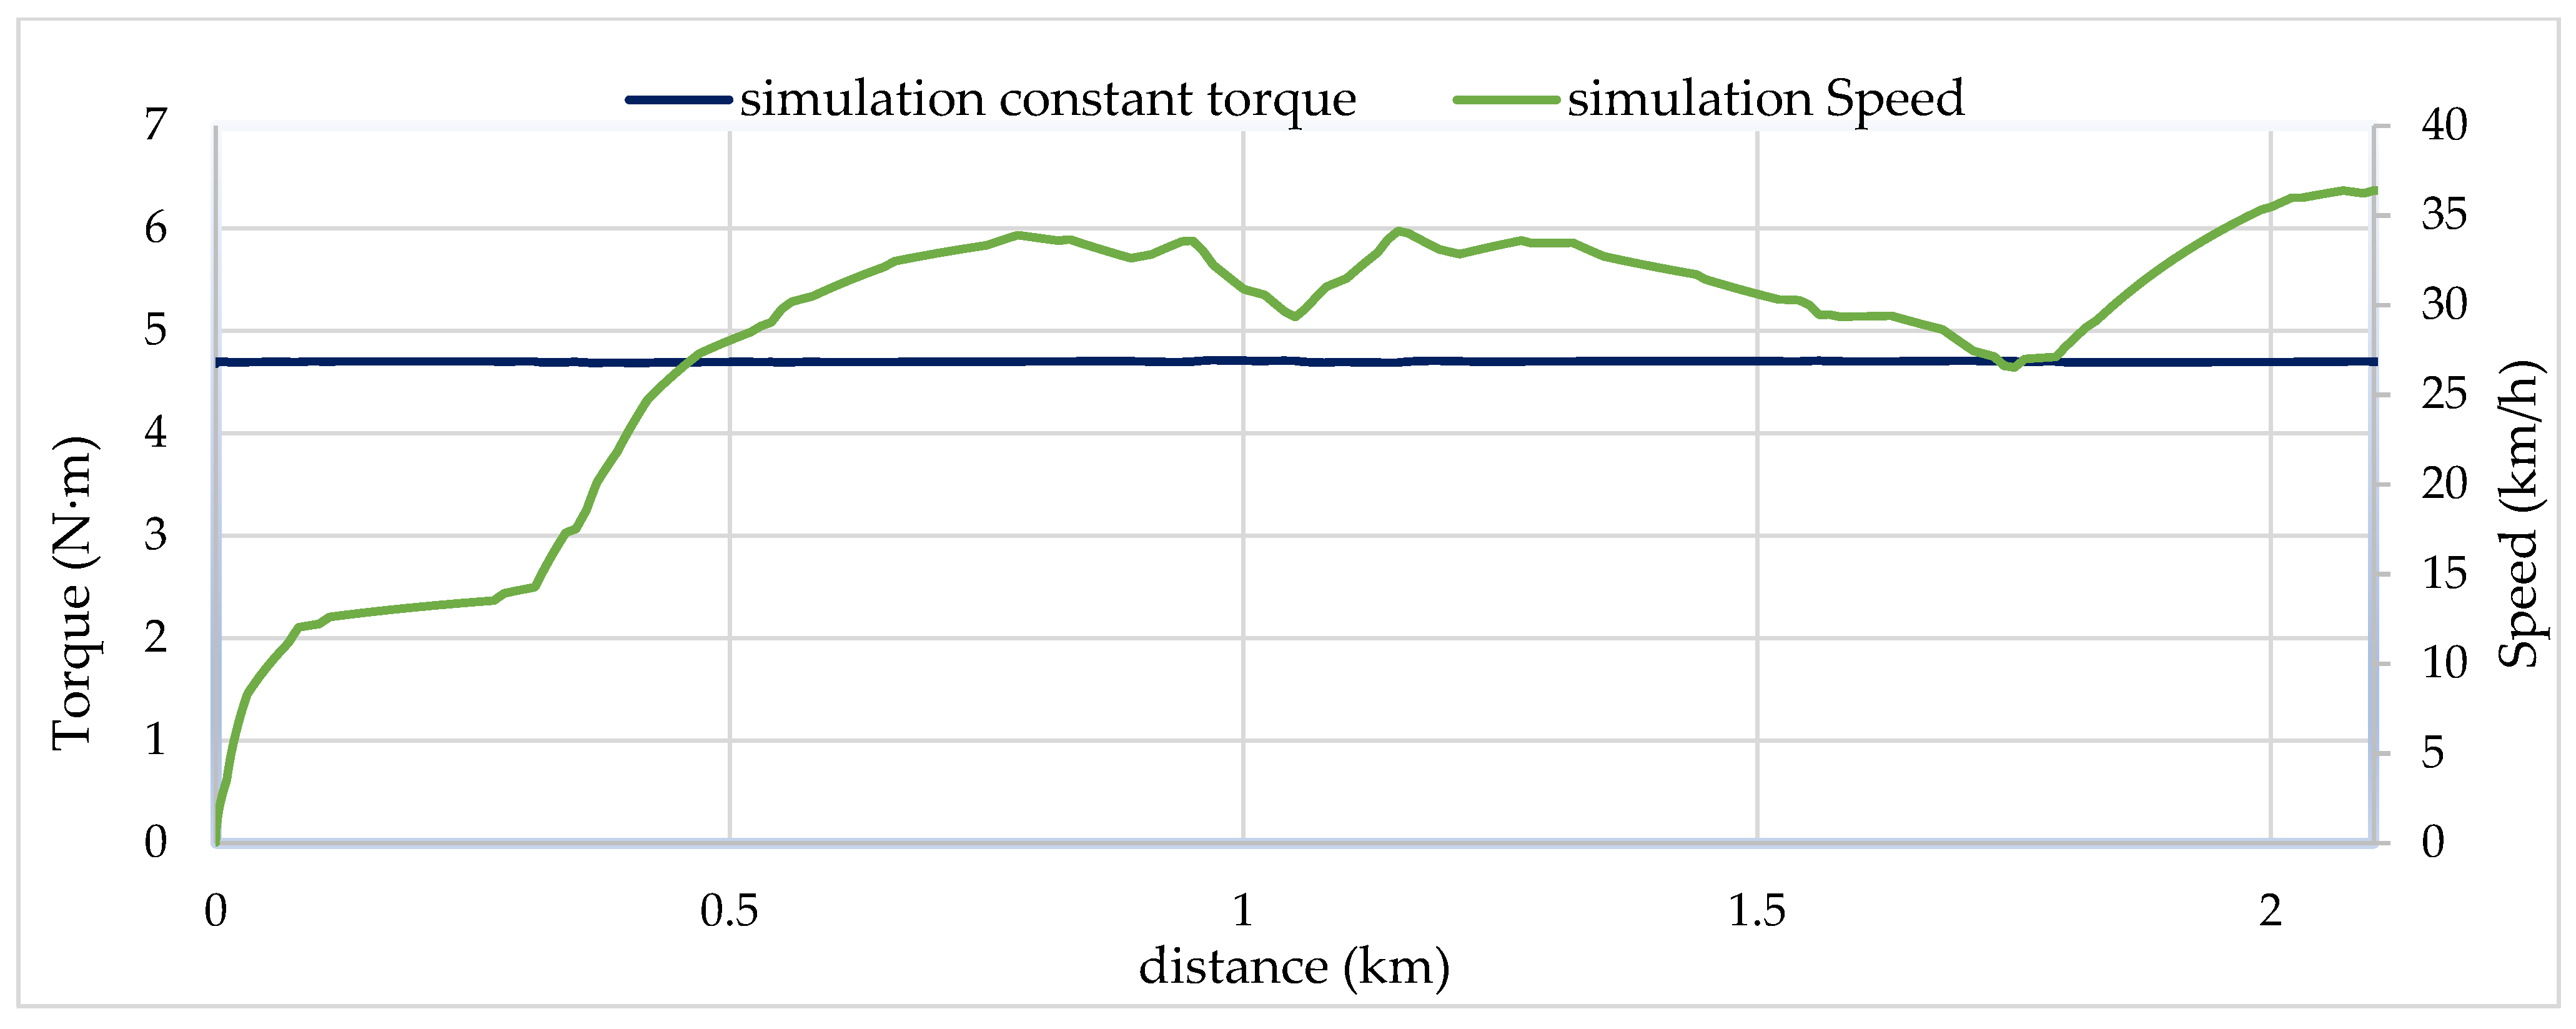
The objective of the simulation tool is to test different strategies to improve the performance of the vehicle. Three simple strategies were developed to compare which of them offers a better performance in terms of energy efficiency. They were adjusted so that the time it takes to complete the circuit is the same. For this purpose, the effect of the three driving strategies was simulated. The first one is based on maintaining a constant speed (see
Figure 19), the second one tries to maintain a constant power (see
Figure 20) and the third one is based on maintaining constant torque (see
Figure 21). In all cases, the total time taken to complete the route was the same as in the first simulation test.
The objective of these simulations is to compare the energy consumption of the vehicle (see Equations (17) and (21)) in each of the driving strategies proposed to find out which of them is the most efficient. These results are shown in
Table 2 and, from them, it can be concluded that the constant speed strategy is the most efficient for the selected circuit. The simulation tool allows one to compare more complex driving strategies, in which the value of the control variable can be modified in each section of the circuit instead of being constant throughout the entire route.
6. Conclusions
The overall objective of the research work was achieved, which was to create a simulation tool that fully characterises the operation of light electric vehicles based on the physical laws that describe their performance. Also, an interface was designed that allows simulations to be carried out and all the parameters of the model to be controlled in a very intuitive way.
The tool was applied in the modelling of a real vehicle and the results provided by the model were compared with those obtained experimentally with said vehicle. These results show that the model provides with enough precision the values of the most interesting variables to evaluate the performance of the vehicle, such as instantaneous power or speed, as well as all the forces exerted on it. In addition, the model allows for comparing different driving strategies and predicting which of them is the most appropriate from the point of view of energy efficiency.
Therefore, the tool can be considered useful both for future vehicle designs and for establishing improvements in vehicle efficiency on the road.
The model that was developed in Simulink allows for great possibilities for its improvement or expansion. One of the first improvements could be to create an analysis and control procedure that aims to find the optimum point for the vehicle’s performance through specific strategies of duty cycle, torque, power or speed. Finally, the proposed model is ideal for real-time applications due to the simplifications that were considered for this purpose; therefore, it can be very useful as an application used to minimise energy consumption along an established route in future tests with the vehicle.
