Article

Quantification and Pictorial Expression of Driving Status Domain Boundaries for Autonomous Vehicles in LTAP/OD Scenarios

1
School of Mechanical and Automotive Engineering, Shanghai University of Engineering Science, Shanghai 201620, China
2
Shanghai Smart Vehicle Cooperating Innovation Center Co., Ltd., Shanghai 201805, China
*
Author to whom correspondence should be addressed.
World Electr. Veh. J. 2023, 14(7), 187; https://doi.org/10.3390/wevj14070187
Submission received: 25 June 2023 / Revised: 6 July 2023 / Accepted: 12 July 2023 / Published: 14 July 2023
(This article belongs to the Special Issue Advances in ADAS)

Abstract

:
The ability of advanced driver assistance systems (ADAS) and autonomous vehicles to make human-like decisions can be enhanced by providing more detailed information about vehicles and in-vehicle users’ states. In this paper, the driving status domains of vehicles in left turn across path/opposite direction (LTAP/OD) scenarios are subdivided into comfort, discomfort, extreme, and crash, and the boundaries of each status domain are quantified and visualized. First, real unprotected left turn road segments are chosen for the actual vehicle testing. Subjective passenger comfort evaluation results and objective motion state data of vehicles during the experiment are organized and analyzed by statistics. In addition, the pictorials are plotted to determine the comfort and extreme status domain boundaries based on motion state parameters. Second, based on the unprotected left turn kinematic analysis and modeling, as well as a skilled driver risk perception and operational model, the Safe Collision Plots (SCP) of conflicting vehicles in LTAP/OD scenarios are quantified and expressed as pictorial examples. By combining objective motion parameters and passenger experience, intuitively quantifying each driving status domain of vehicles can provide more fine-grained information for the design parameters of ADAS and autonomous vehicles and increase public trust and acceptance of them.

1. Introduction

1.1. Background

Intersections are the most frequent location for vehicle collisions. To reduce their frequency and the hazards they cause, industry personnel have developed various ADAS applications to warn drivers of impending collisions at intersections. However, collisions rarely occur in everyday driving, and false alarms can still occur with the existing warning system. In addition, there will be nuisance alerts (which are correct according to the logic of the warning algorithm but may be perceived as unhelpful by the driver, possibly due to their frequency, timing, intensity, or manner [1], especially for some aggressive drivers/driving behavior). This combination of false and nuisance alerts may undermine the effectiveness of warning applications and drivers’ trust by annoying them and causing them to ignore or even turn off the applications [2,3,4,5,6,7]. Therefore, to implement a practical intersection collision warning application, it is essential to set reasonable alert thresholds and algorithms that minimize false and nuisance alerts. Quantifying driving status domains and their boundaries for vehicles can provide a better reference for designing IMA (intersection movement assist) applications in LTAP/OD scenarios. Developers can set more credible alerts and intervention thresholds for ADAS.
As shown in Figure 1, LTAP/OD (Left Turn Across Path/Opposite Direction) is one of the most complex situations for vehicles driving at urban intersections. It is prone to collisions, where the left-turning vehicle is called the Subject Vehicle (SV), and the oncoming vehicle is named the Principal Other Vehicle (POV). The same acronyms will be used throughout this paper. In this scenario, the intersection does not have a separate signal phase for the SV. The SV must enter the intersection, but because the oncoming traffic in the opposite direction has the right of way, the SV needs to constantly adjust its own speed and steering angle to communicate the intention to turn left to the oncoming traffic. It should also judge the distance and speed of the oncoming traffic, from which it can choose the appropriate safe gap and pass quickly. The employment of cooperative strategies, such as vehicle-to-vehicle (V2V) or vehicle-to-infrastructure (V2I) communication, to deal with unprotected left turn maneuvers at intersections has been extensively researched in a wider body of literature [8,9]. However, we cannot always rely on all vehicles to have fully functional V2V or V2I communication systems, especially considering that for a long time in the future, the vast majority of automobiles on the road will be traditional vehicles without such systems [10]. Therefore, improving the decision-making ability of autonomous driving is still the focus and difficulty of today’s research.
Current autonomous vehicles tend to adopt a more conservative driving style to ensure a high level of vehicle safety in unprotected left turn maneuver conditions, which has led to much of the previous work being focused on the comfort status domain, the status domain where in-vehicle users feel safe and attempt to remain comfortable. This also leads to a certain degree of the “left turn dilemma” of autonomous vehicles, which reduces the efficiency of mixed traffic flow at intersections. Due to the dynamic changes of the driving scenario, skilled human drivers are driven by particular additional motivations (e.g., to drive in a hurry or to pass efficiently). They will choose to temporarily sacrifice some of their comforts while ensuring safety (entering the discomfort status domain). Then they will return to a safe and comfortable status as soon as possible [11,12]. This can also inform the optimization of autonomous vehicles’ unprotected left turn maneuvers, improving their safety and efficiency in passing at intersections.

1.2. Related Work

J Bärgman et al. [13] created a fine-grained, quantifiable series of definitions for the safe spatiotemporal space outside of the comfort status domain boundary. However, the object of its study is the traditional driver, and the parameters such as vehicle speed and relative distance of vehicles are also fixed in the experimental setup, although actually, they are changing dynamically in the real world. The data obtained from the experiment are collected subjectively by a limited number of experimental participants, which are less reproducible and not generalizable or convincing. Neither can their quantitative metrics be effectively correlated with the design parameters and driving behavior associated with autonomous vehicles. M Junghans et al. [14] compared the differences in safety and kinematic patterns of human-driven vehicles and autonomous vehicles during unprotected left turn maneuvers. Autonomous vehicles make conservative and safe left turns compared to human-driven vehicles. However, the results should be handled carefully since the number of cases considered is meager, and more situational factors need to be considered to come to more sound conclusions. L Meng et al. [15] used post-encroachment time (PET) to measure the comfort status domain boundary (PET = 2–4 s), but PET does not serve as a direct measure of the comfort status domain boundary. This is because PET is an ex-post metric, not a metric that is directly perceived by drivers and passengers. In order to ensure the comfort of in-vehicle users during left turns, not only should the PET alone be taken into account, but also other highly relevant vehicle motion parameters such as lateral and longitudinal acceleration. Ref. [16] provided quantitative models and visualized the results for the safety and collision analysis of lane-keeping systems operating under different speed combinations and maneuver conditions. However, no work has been conducted to extend its analytical approach to the development of IMA (intersection movement assist) applications.

1.3. Contributions

In order to achieve more credible and reliable functions, this paper seeks to provide more refined vehicle and in-vehicle users’ state information for ADAS and autonomous driving systems and improve the human-like decision-making capability of autonomous vehicles in LTAP/OD scenarios. In this paper, the vehicle driving status domain under LTAP/OD scenarios is subdivided into comfort, discomfort, extreme, and crash. By combining actual vehicle motion performance parameters and passenger experience, the indicators of each status domain boundary are determined and quantified. The main work of this research paper is as follows.
  • The experimental vehicle in this study is set up as closely as feasible to the standard autonomous vehicle configuration, and real-world LTAP/OD scenarios are chosen for actual vehicle testing. The subjective passenger comfort evaluation results and objective vehicle motion state data collected during the experiment are statistically organized, analyzed, and expressed as pictorials. Based on the vehicle motion state parameters, the boundaries of the comfort and extreme status domains are visually determined.
  • The kinematic analysis model of the unprotected left turn of the vehicle is established. In conjunction with the risk perception and operation model of a skilled driver, the Safe Collision Plots (SCP) of conflicting vehicles with different combinations of velocity and relative distance in LTAP/OD scenarios are quantified, and the safety status domain boundary of the vehicle is visually determined.
  • By combining actual vehicle motion parameters and passenger experience, we segment the driving status domains and provide a pictorial quantification method which may provide a theoretical and data foundation for improving the performance of ADAS and autonomous vehicles.
This paper is divided into six main sections. The research background of this paper and the current state of research on ADAS and the unprotected left turn behavior of autonomous vehicles are described in Section 1. The detailed definition of each status domain and its boundaries are introduced in Section 2. Section 3 introduces the experimental design of this paper, including the experimental equipment, participants, and routes. In Section 4, metrics for comfort, extreme, and safety status domain boundaries are identified, intuitively quantified, and visually expressed. Moreover, the results obtained in this paper are discussed in Section 5. Section 6 is the conclusion and outlook of this paper. This chapter summarizes the research findings and looks toward future work.

2. Definition of Each Status Domain and Its Boundary

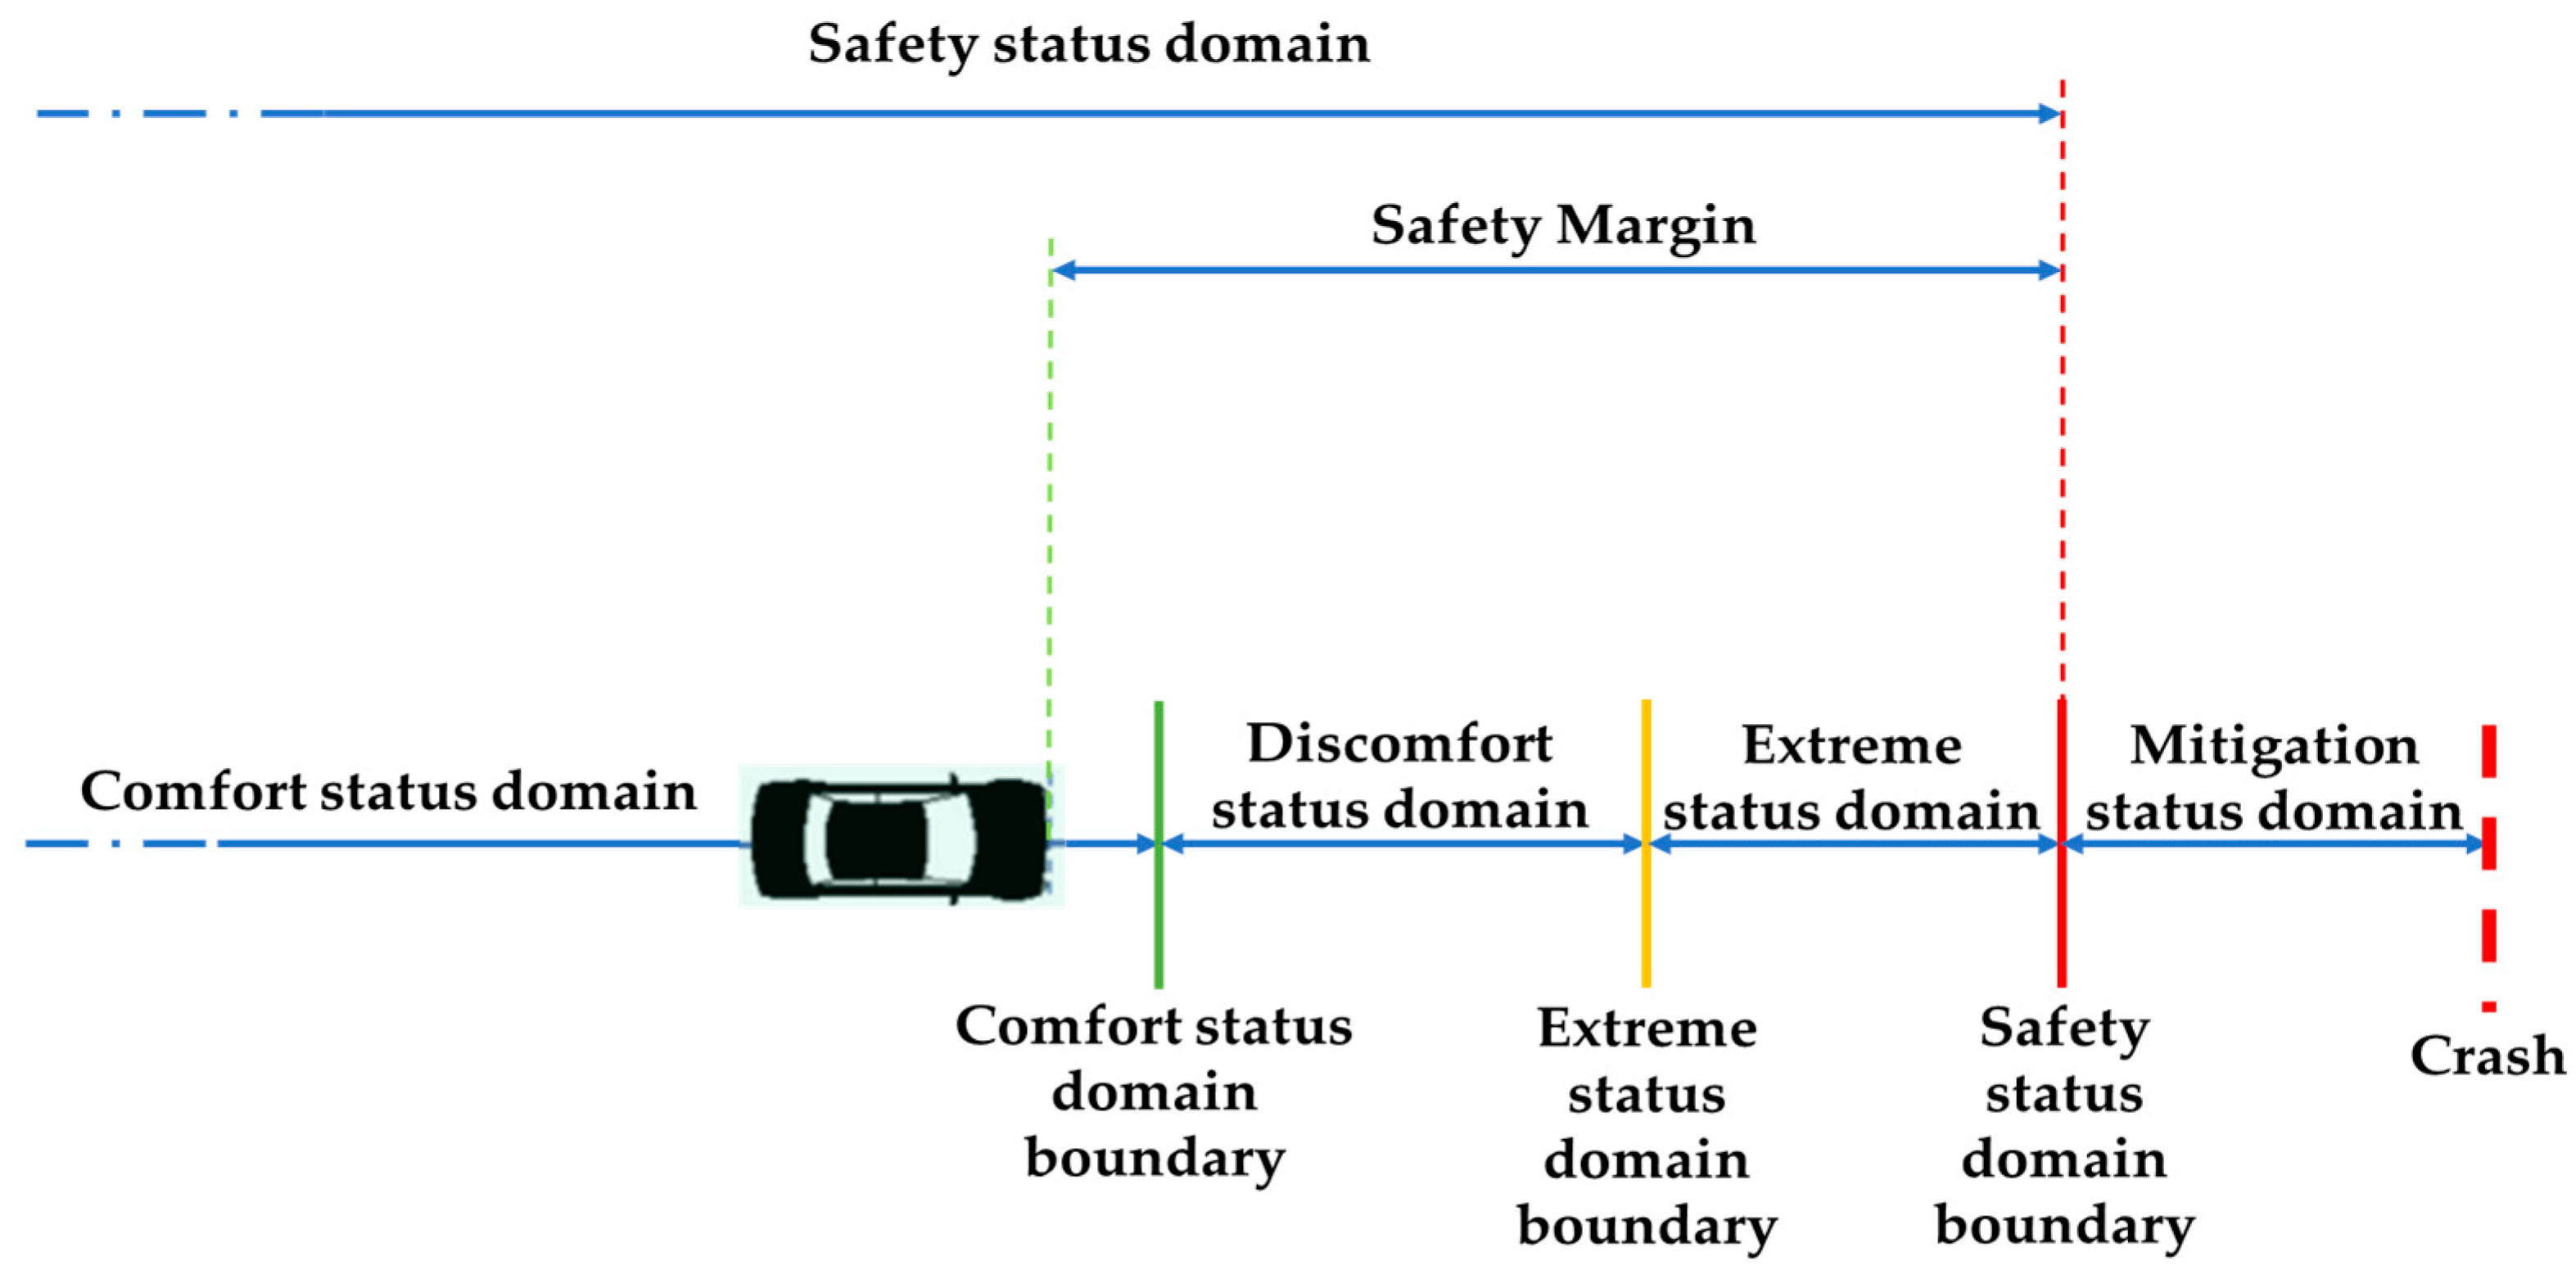
Comfort status domain: A status domain in which in-vehicle users feel comfortable and absolutely safe. If they have high requirements for safety and comfort (e.g., children in the car), they will not voluntarily cross the comfort status domain.
Discomfort status domain: Due to the dynamics of situations, steady drivers occasionally become more aggressive (e.g., emergency meetings) and voluntarily cross the comfort status domain boundary, accepting a temporary reduction in comfort requirements while ensuring safety. When the in-vehicle users are more motivated, there is a tendency to tolerate higher driving speeds, accompanied by different feelings of comfort and risk. They may sacrifice some of their comforts and force themselves to cross the comfort status domain boundary and enter the discomfort status domain.
Extreme status domain: The higher their extra motivation, the farther he or she goes into the discomfort status domain. However, there is another boundary that in-vehicle users basically do not voluntarily cross, which we call the extreme status domain boundary. This status domain has a small safety margin, which may cause intense discomfort and fear to the drivers and passengers and even affect the surrounding traffic participants, thus reducing the public’s trust and acceptance of ADAS and autonomous vehicles. The extreme status domain is a more dangerous area, and in-vehicle users will primarily not actively cross the extreme status domain boundary even with extra motivation, which is unacceptable to both in-vehicle users and surrounding traffic participants unless it is to avoid an impending traffic accident.
Safety status domain: The safety status domain includes comfort, discomfort, and extreme status domains. The safety status domain boundary is the bottom line to ensure the safety of the vehicle. Once crossed, a collision will not be avoided. There is also a mitigation status domain beyond which the vehicle can no longer avoid a collision. However, the consequences of a collision can be mitigated by driver action or ADAS functions. A diagram of each status domain and its boundaries is shown in Figure 2.

3. Experimental Setup

This paper investigates the quantification of the comfort, extreme, and safety status domain boundaries of autonomous vehicles in LTAP/OD scenarios by combining vehicle motion performance parameters and passenger experience. Therefore, the research subjects of this paper are the vehicles and the passengers. The data needed for this experiment are mainly vehicle motion state data and passenger subjective evaluation results.

3.1. Experimental Equipment

The experimental equipment in this paper mainly include the experimental vehicle and sensors for collecting vehicle motion state parameters.
(1)
Experimental vehicle
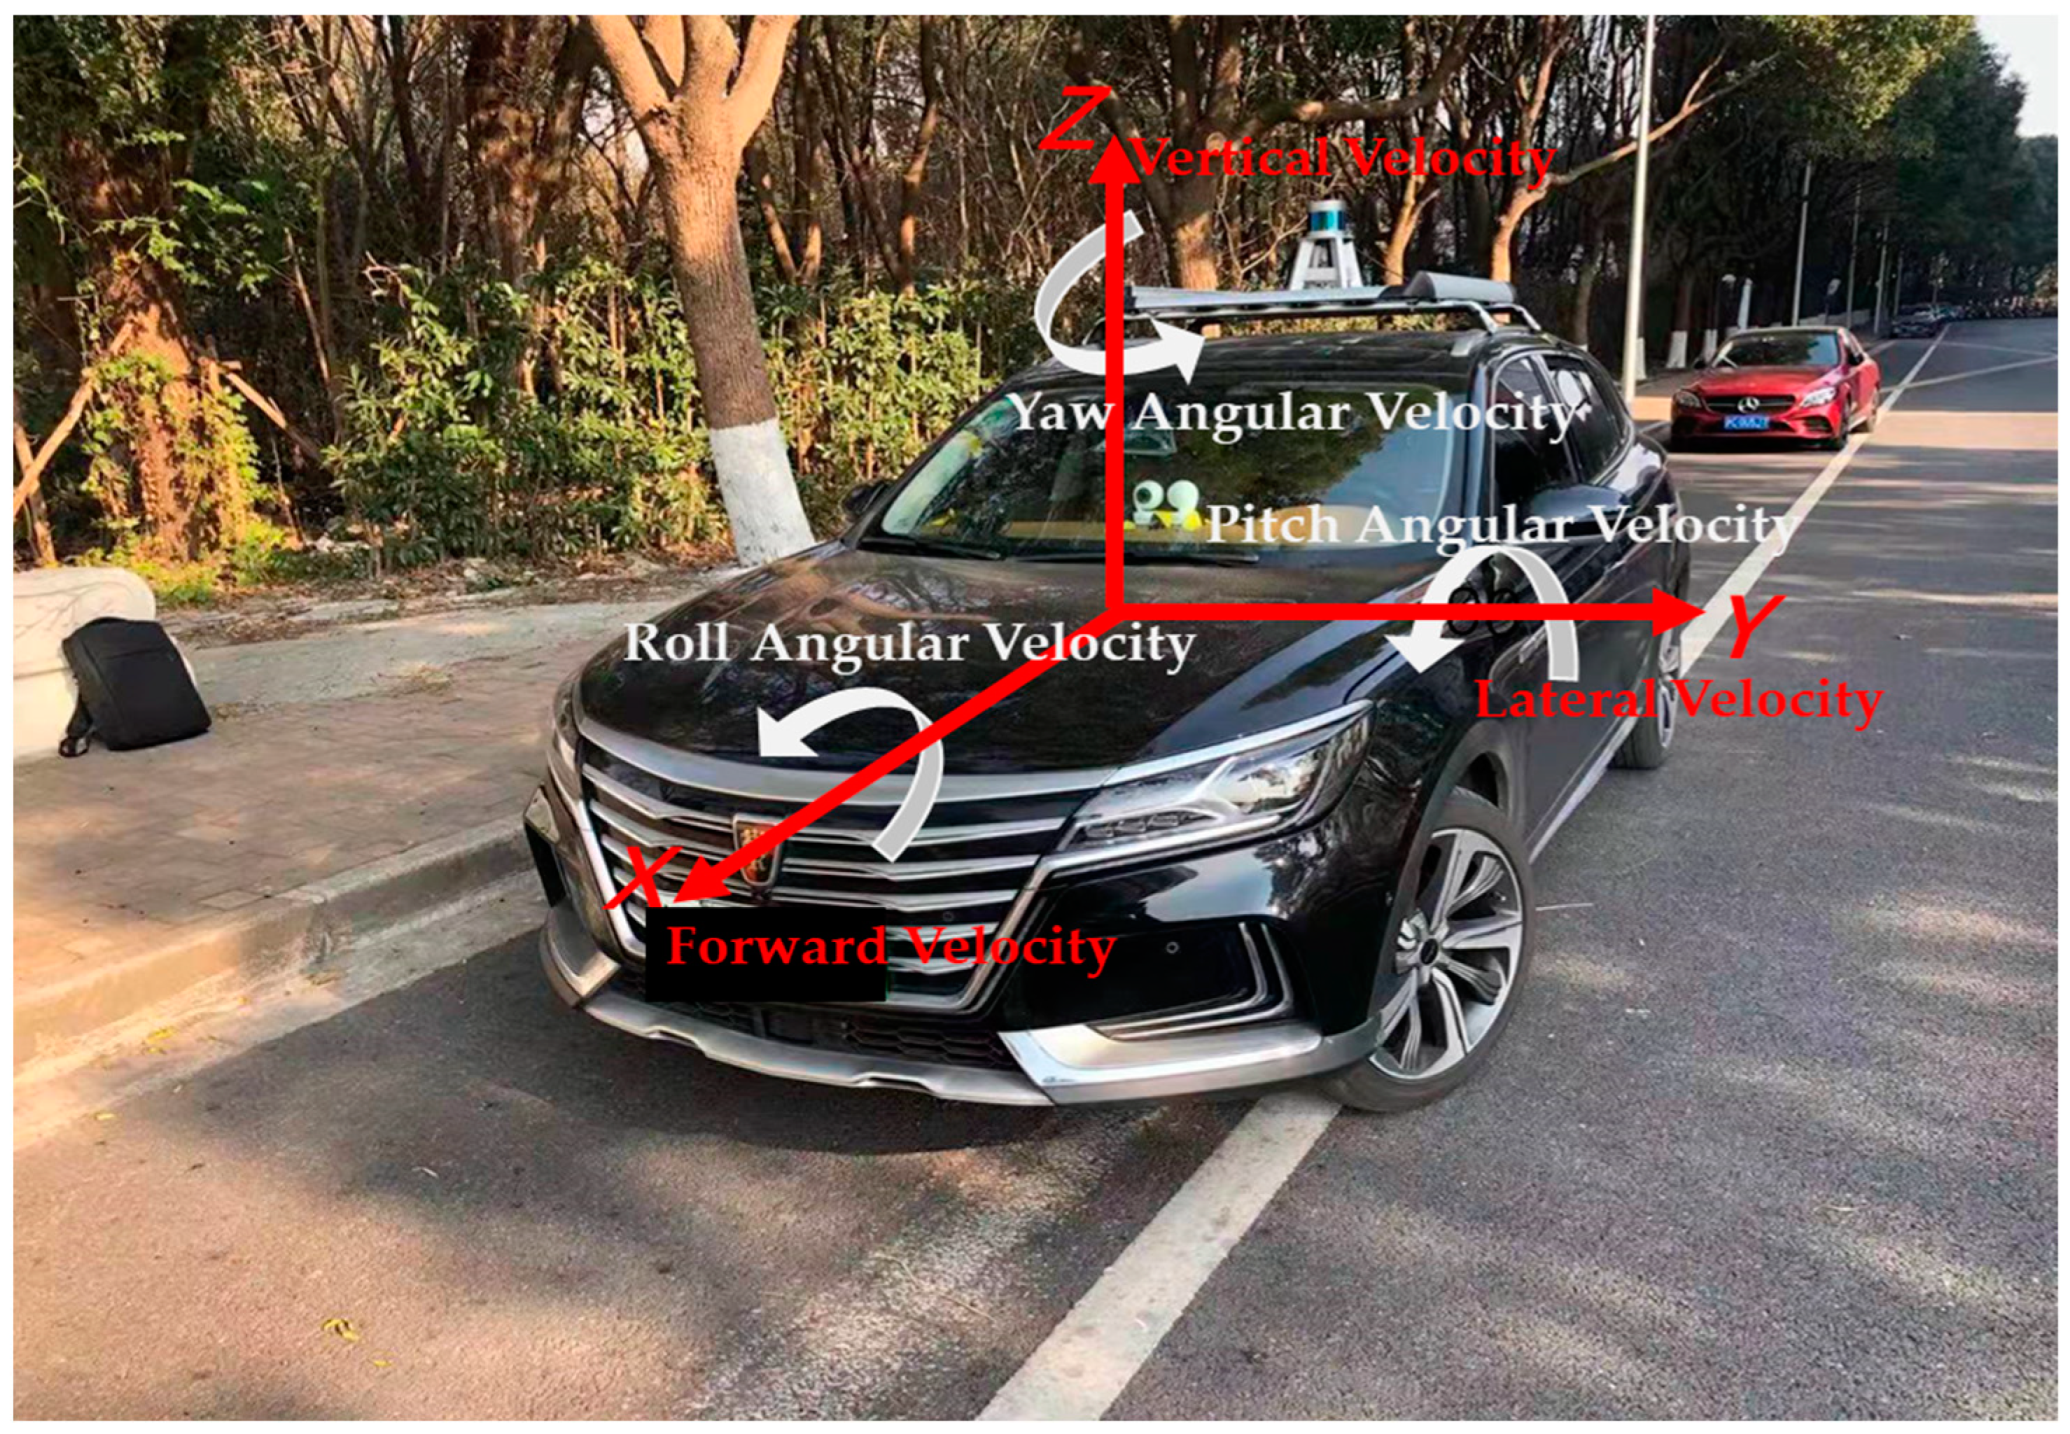
Referring to the current mainstream configuration of autonomous vehicles, the ROEWE RX5 hybrid (SAIC Motor, Shanghai, China) was selected for the experiment. To improve the effectiveness of the experiment, some visual sensors such as LIDAR and cameras are added to make the operating conditions of the experimental vehicle more compatible with an actual autonomous vehicle. The appearance of the experimental vehicle is shown in Figure 3, and the main relevant parameters are shown in Table 1.
These parameters are the main factors that affect vehicle performance and passenger comfort during steering. Different vehicle models and configurations may slightly affect the experimental results. The experimental vehicle selected in this paper, regarding the mainstream autonomous vehicle configurations, can provide a baseline for subsequent studies.
(2)
Equipment for collecting vehicle motion state parameters
The TANS 3-axis navigational sensor from Kistler was chosen for this experiment. It combines a solid-state, triaxial rate gyro with a triaxial accelerometer in a single, ultra-compact housing. The device can be expanded to 6 axes of simultaneous measurement capability, including the acceleration range of ±3 g and the normal operating temperature of −40 °C–85 °C. The sensor is easy to install and can be built into the barycenter of the vehicle with a simple interior modification, which also satisfies the working conditions.

3.2. Experimental Participants

During the actual experiment, there are three users in the vehicle: the driver, the test passenger, and the data recorder. The data recorder is seated in the passenger seat, and the passenger is located in the rear row with the seat belt fastened, maintaining a natural ride state.
(1)
The driver
The driver selected is a 36-year-old male with more than eight years of driving experience and no traffic accidents in the last five years.
(2)
The test passengers
The subject passengers of this experiment were randomly recruited for all personnel at the Shanghai University of Engineering Science. They were paid after the experiment and had no obvious problems of their own. This resulted in the recruitment of 31 people, aged between 18 and 36 years old, with an average age of 25 years old, of whom 19 are male and 12 are female.
(3)
The data recorder
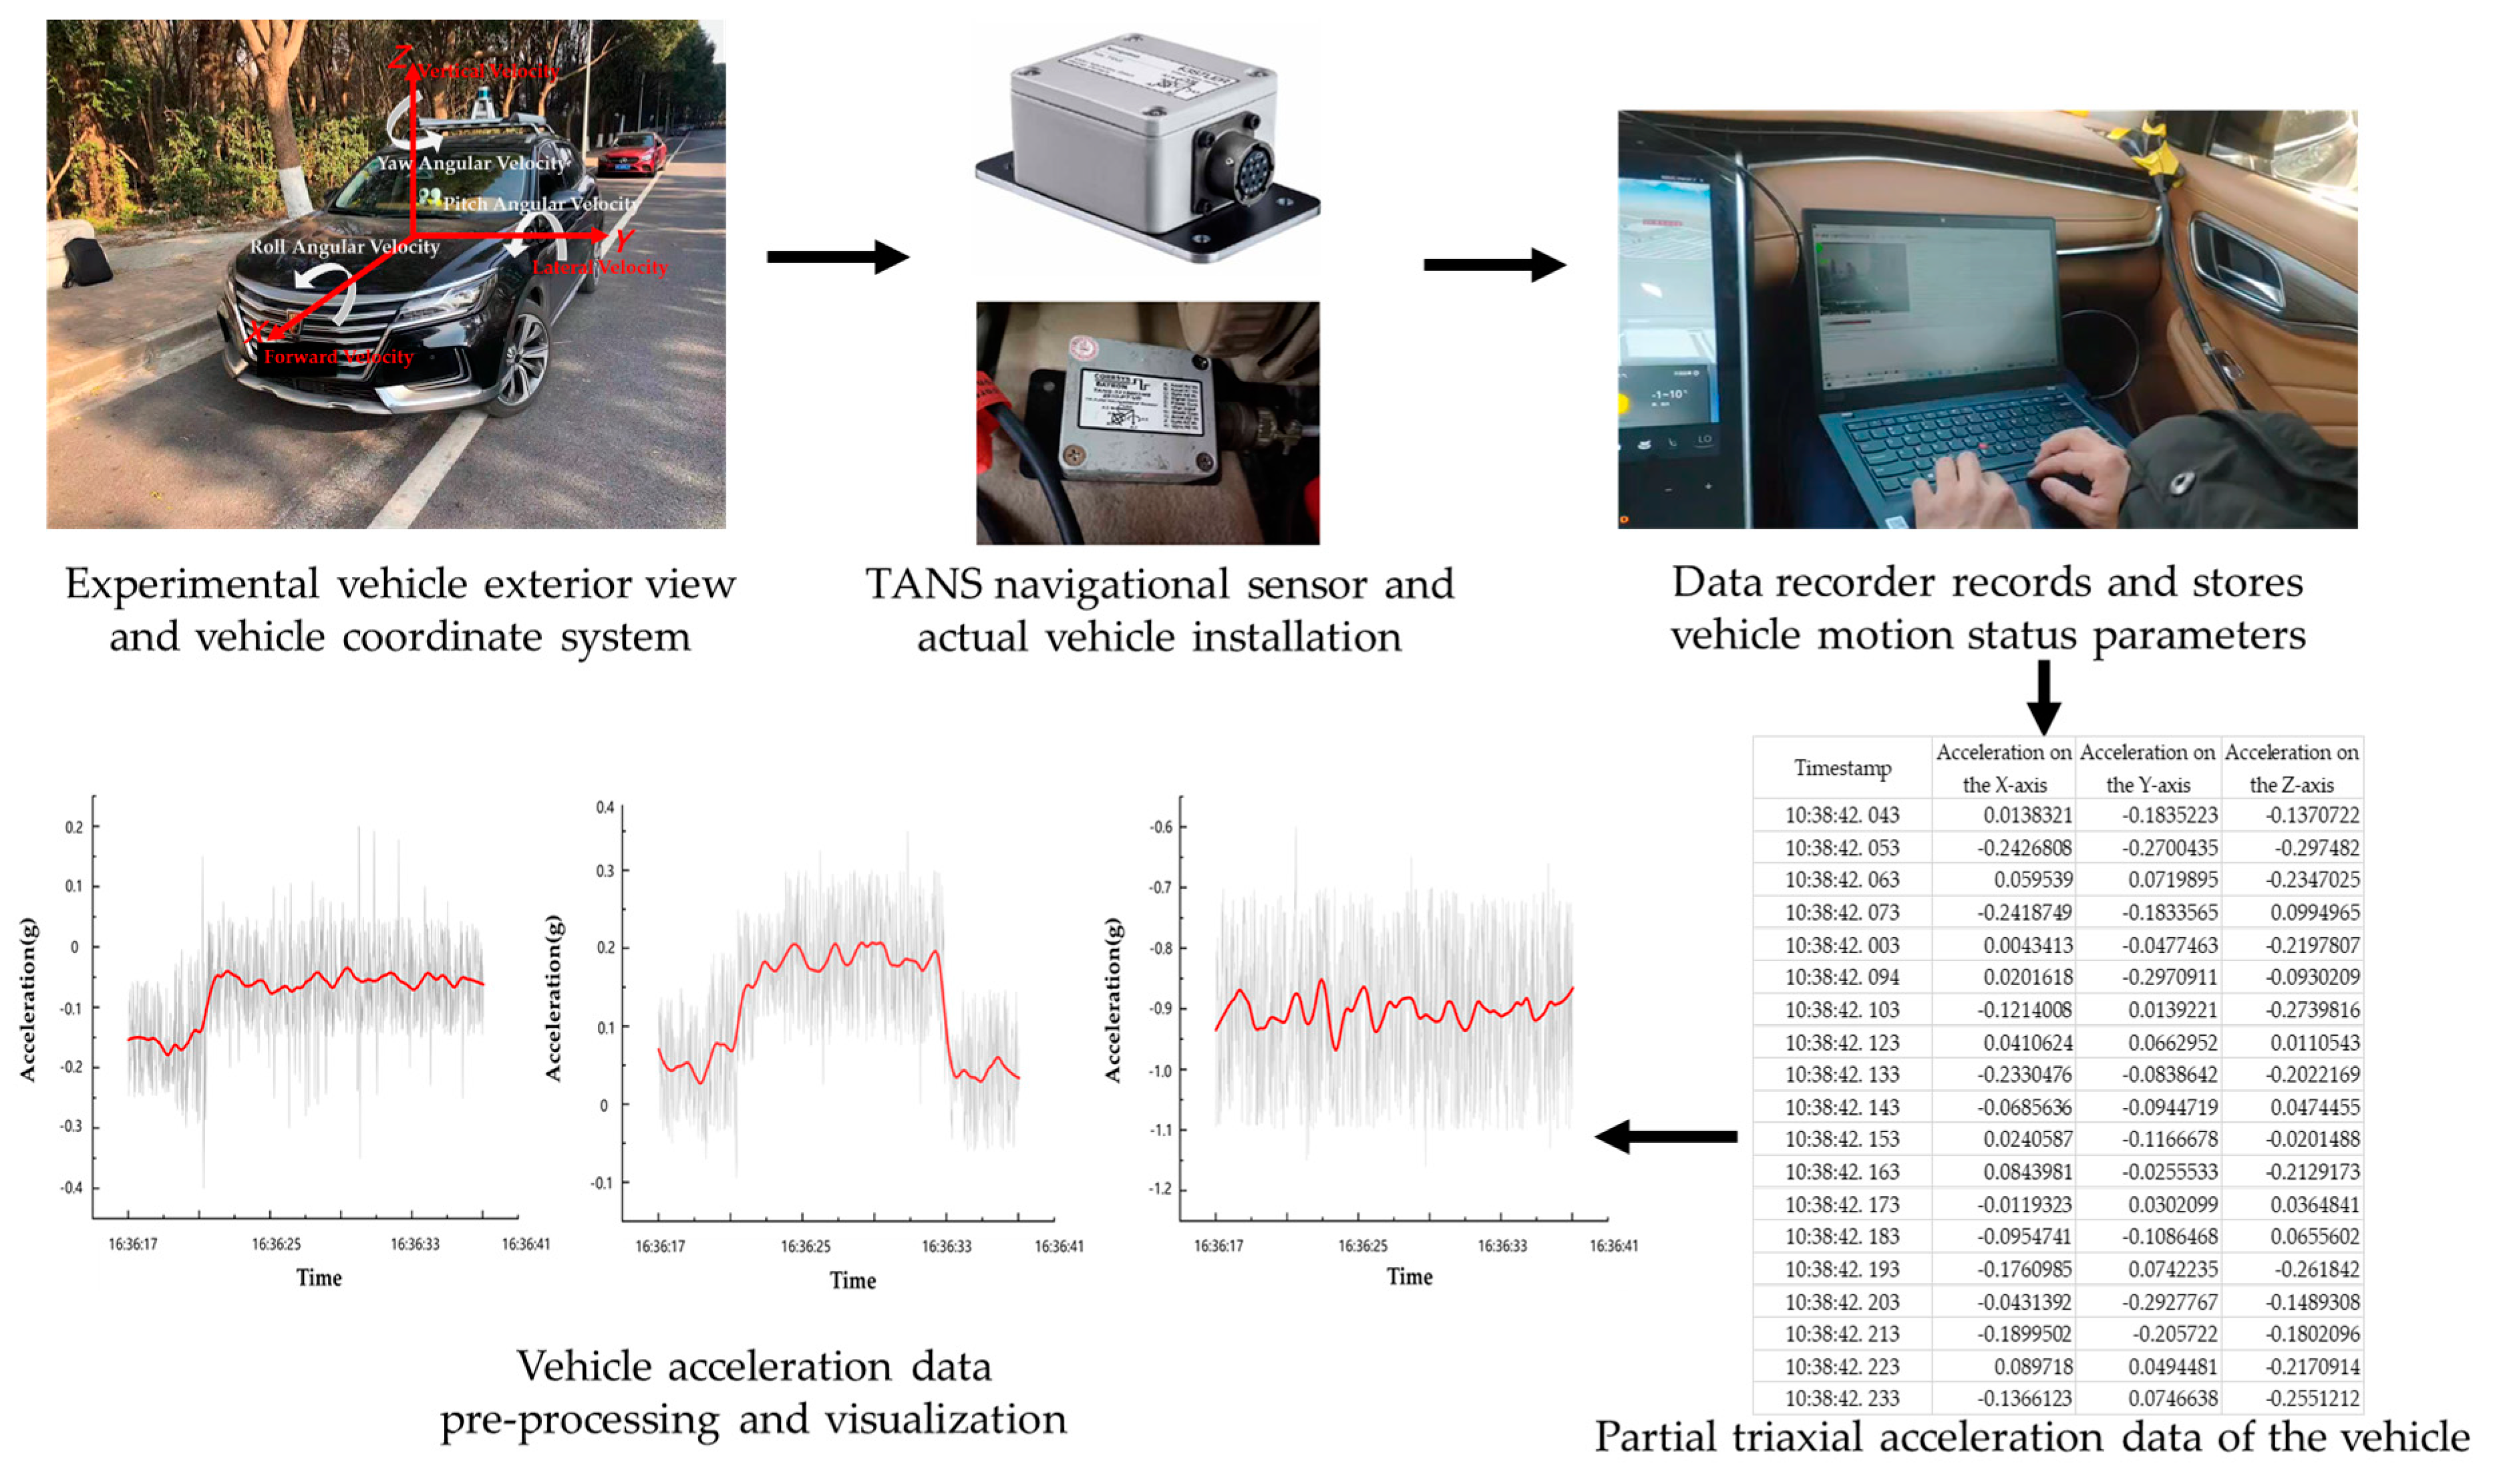
The data recorder is responsible for recording and storing vehicle motion parameters and subjective evaluation information of the test passengers. The experimental data acquisition and processing flow are shown in Figure 4.

3.3. Experimental Route

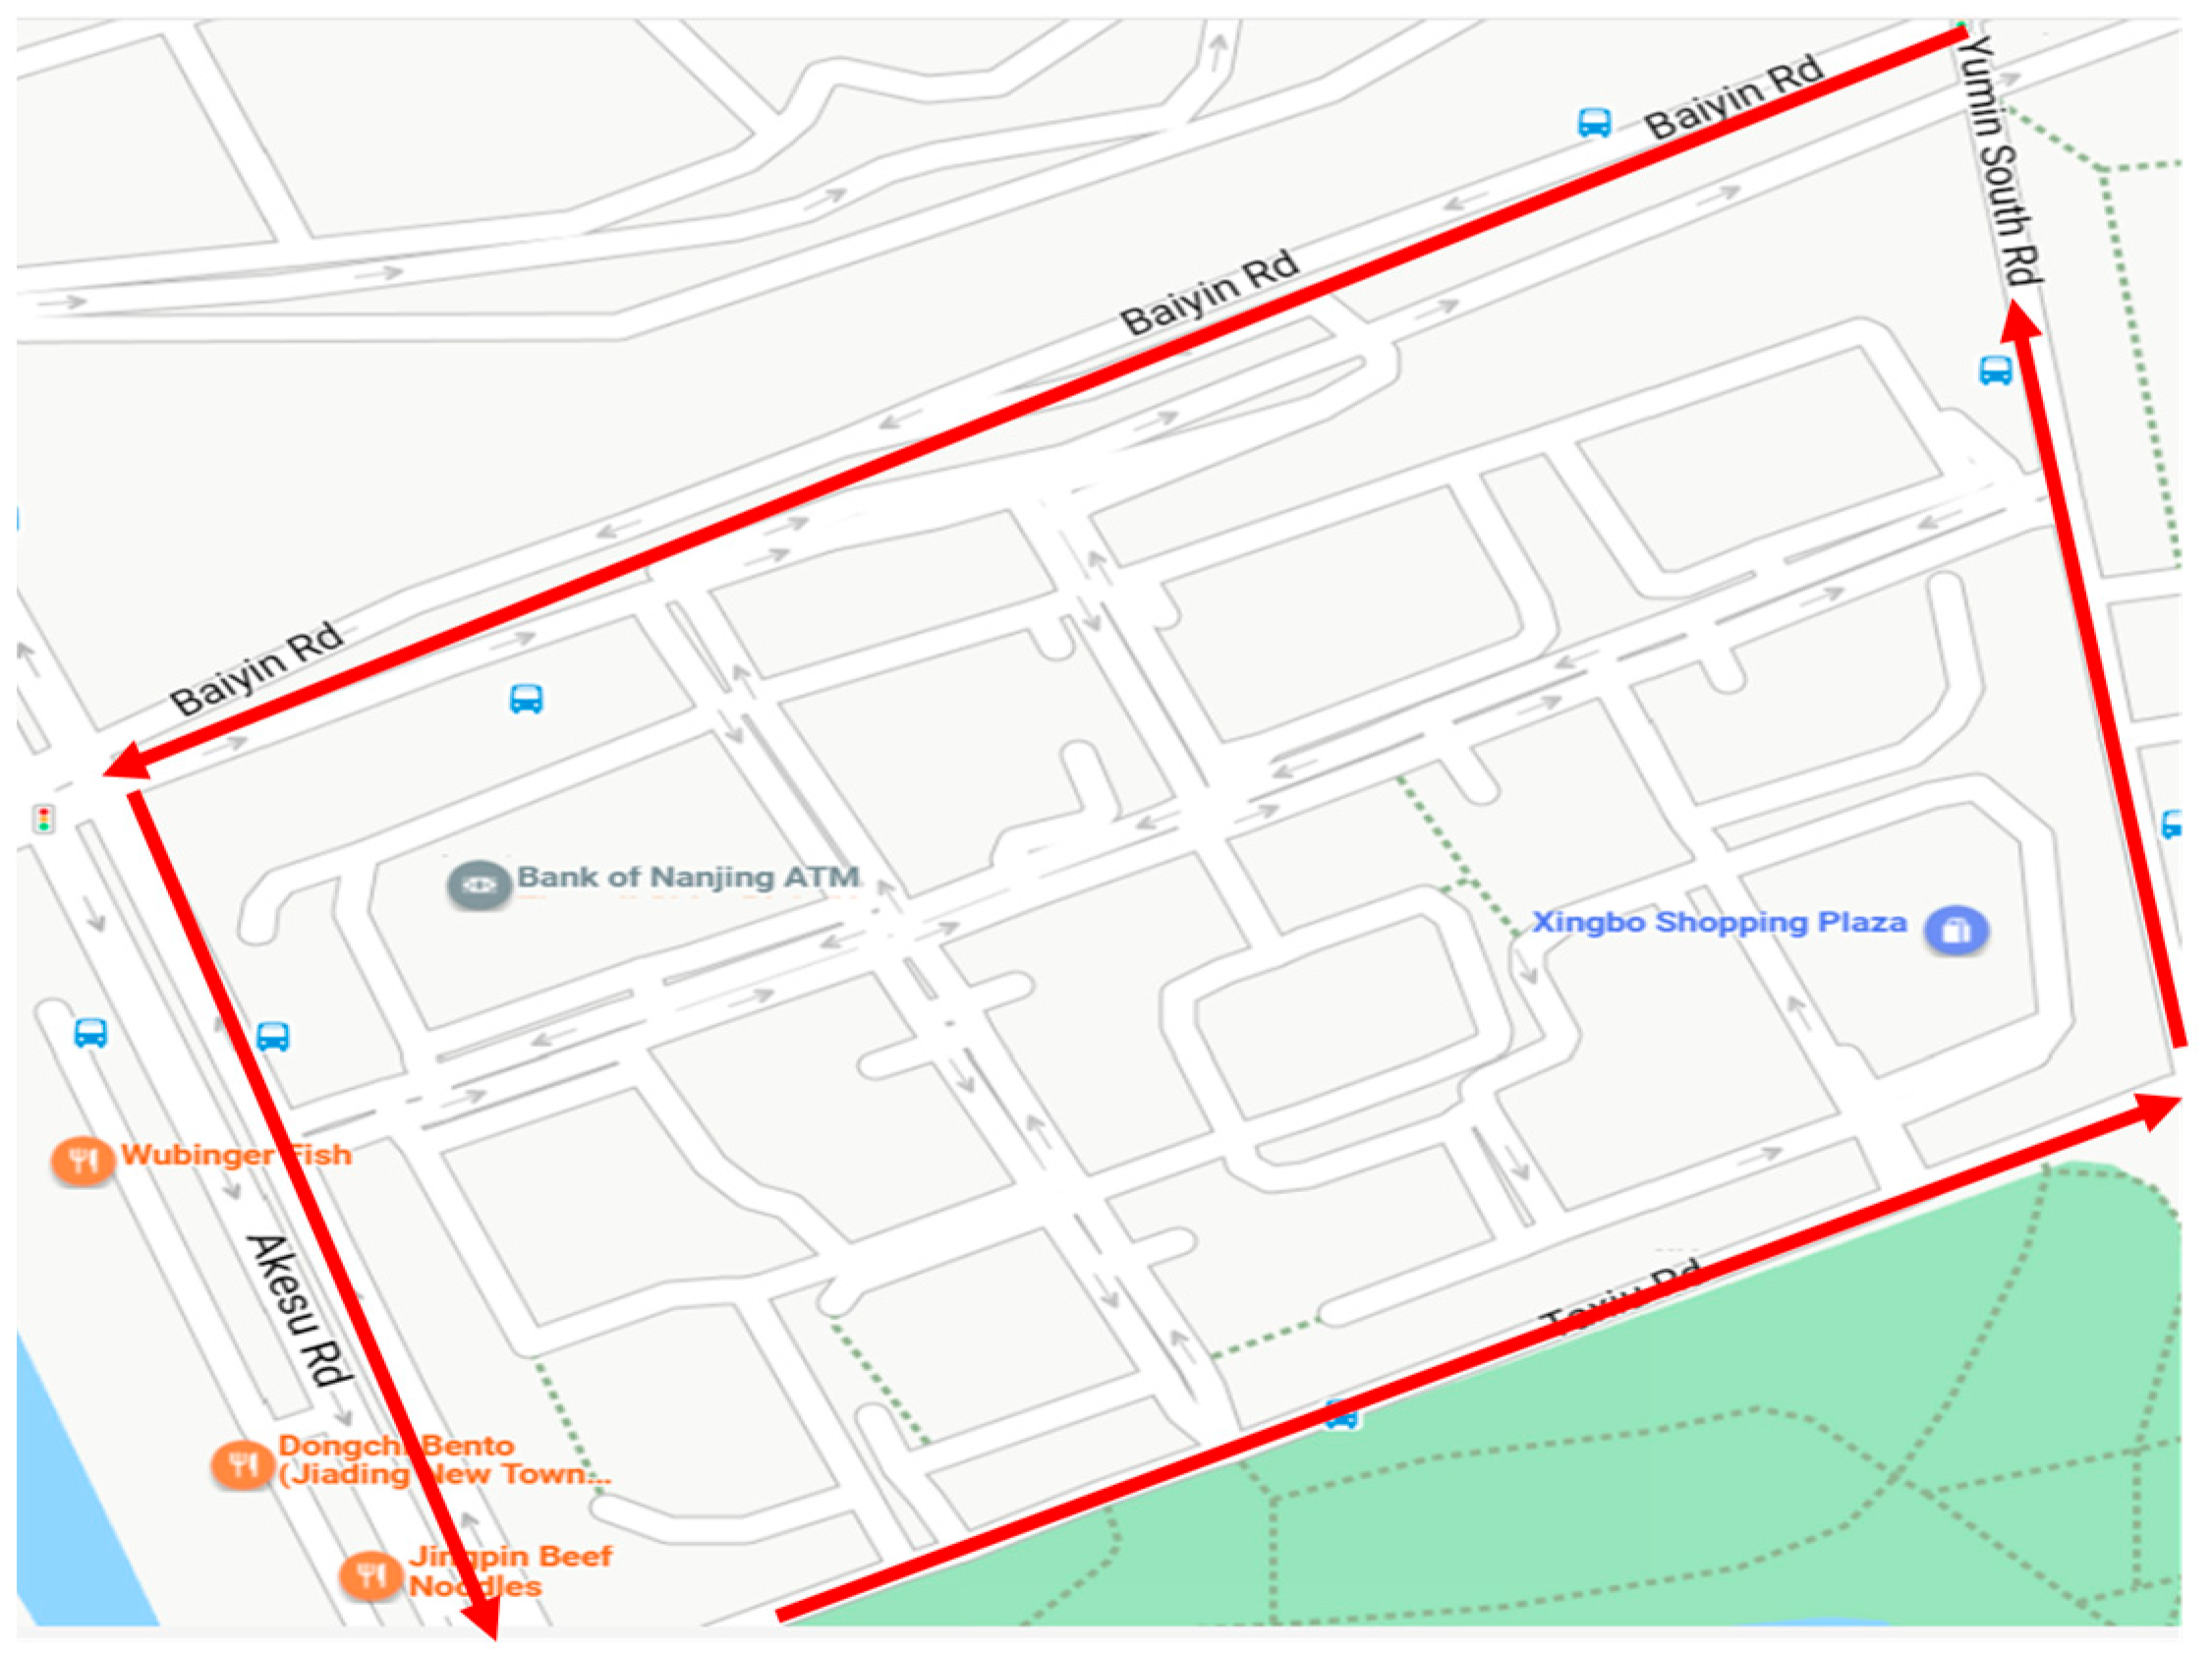
The experimental route is located in a rectangular closed-loop area formed by four road sections, Baiyin Road, Taxiu Road, Yumin South Road, and Akesu Road, in Jiading District, Shanghai. Moreover, the intersection of each road section is a typical LTAP/OD scenario, as shown in Figure 5. The experimental participants performed several unprotected left turn operations in the experimental area at different times and with different traffic flows.

4. Determination and Quantification of Boundary Metrics for Each Status Domain

4.1. Determination and Quantification of Comfort Status Domain Boundary

Comfort is one of the direct manifestations of autonomous vehicles’ quality and an essential factor that affects the subjective feelings of in-vehicle users. When autonomous vehicles are tested on real roads, inappropriate driving behavior can even lead to conditions such as motion sickness. Therefore, the quantification of the comfort status domain boundary is crucial for the development of autonomous vehicles.
Based on the SAE J3016 standard of the International Society of Automotive Engineers [17], the driver performs all the dynamic driving tasks of the vehicle in the L0 stage. In-vehicle users consist of the driver and passengers. In the L1 to L2 stages, the autonomous driving system can perform part of the vehicle’s transverse and longitudinal motion control tasks instead of the driver. At this point, the driver and the autonomous driving system work together to complete the vehicle’s dynamic driving tasks. From L3 to L4 stages, the autonomous driving system can autonomously perform all vehicle motion control. As a result, the driver’s role as an in-vehicle user has changed significantly. The driver can act as a passenger and perform manual takeover operations only when the automated driving system fails or when the vehicle is out of its Operational Design Domain (ODD). Eventually, by the L5 stage, the in-vehicle users’ type can be composed entirely of passengers. Compared to traditional driver comfort research, passenger comfort research in an autonomous driving environment is significantly underdeveloped and slow. Therefore, the quantification of the comfort status domain boundary described in this paper focuses on passengers, and no further research will be conducted on traditional drivers.
The most commonly used method to evaluate the riding comfort of autonomous vehicles at home and abroad is the subjective evaluation method, in which the subjective rating of the subjects determines the advantages and disadvantages of comfort. However, it is difficult to establish a valid correlation between subjective passenger ratings and the optimization of autonomous vehicles’ design parameters. Moreover, subjective passenger ratings are influenced by various external factors and are likely to be constantly changing. Therefore, subjective evaluation methods are less convincing and repeatable. It is of limited help to improve the riding experience of autonomous vehicles. Compared to subjective evaluation methods, objective evaluation methods are reproducible and measurable. The combination of riding comfort and vehicle motion performance parameters, among others, can provide an excellent theoretical and data basis for improving the performance of autonomous vehicles [18].
This paper combines subjective and objective evaluation methods to quantify the comfort status domain boundary of autonomous vehicles. The subjective evaluation method focuses on the comfort score of passengers, and the objective evaluation method uses the vehicle motion performance parameters as the primary reference index. The acceleration, the time derivative of the acceleration (jerk), the acceleration peak, and the jerk peak in the longitudinal, lateral, and vertical directions are usually selected as the driving and riding comfort evaluation index. Unlike the straight running condition, additional consideration of lateral control is required when driving on a curve or making a left turn at an intersection. The longitudinal and lateral speeds of the vehicle constantly change during the left turn, i.e., the vehicle is in a state where lateral motion control and longitudinal motion control are coupled.
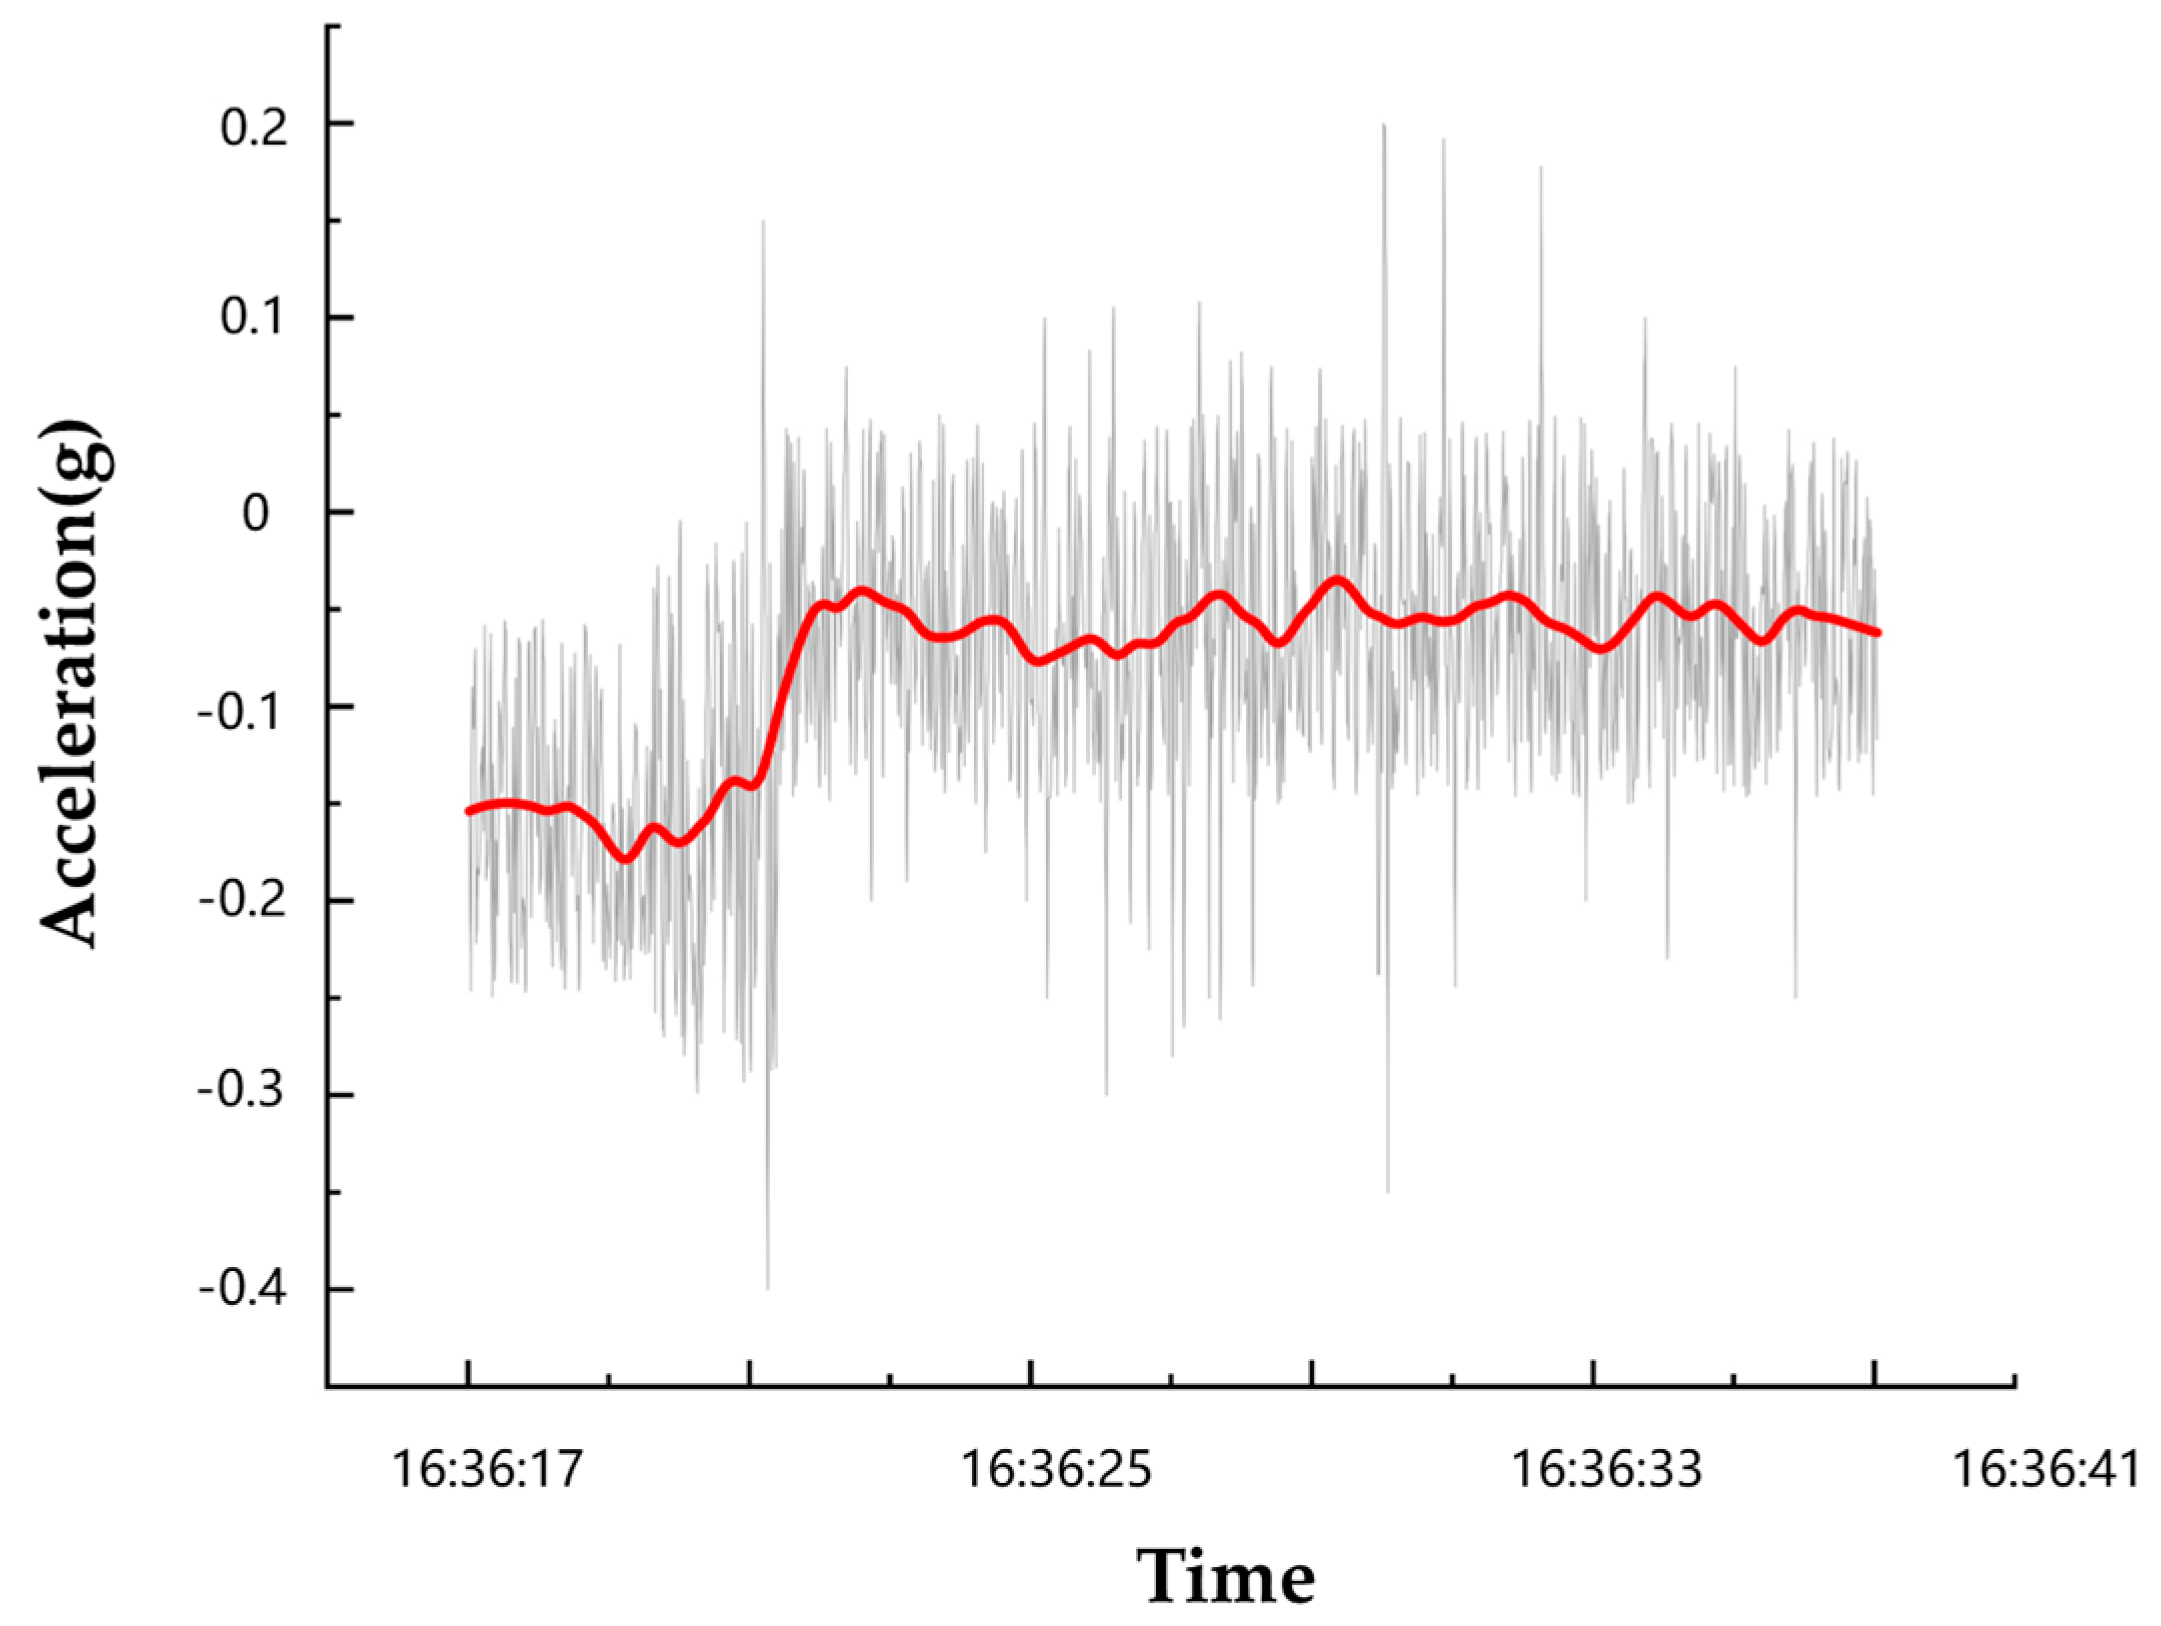
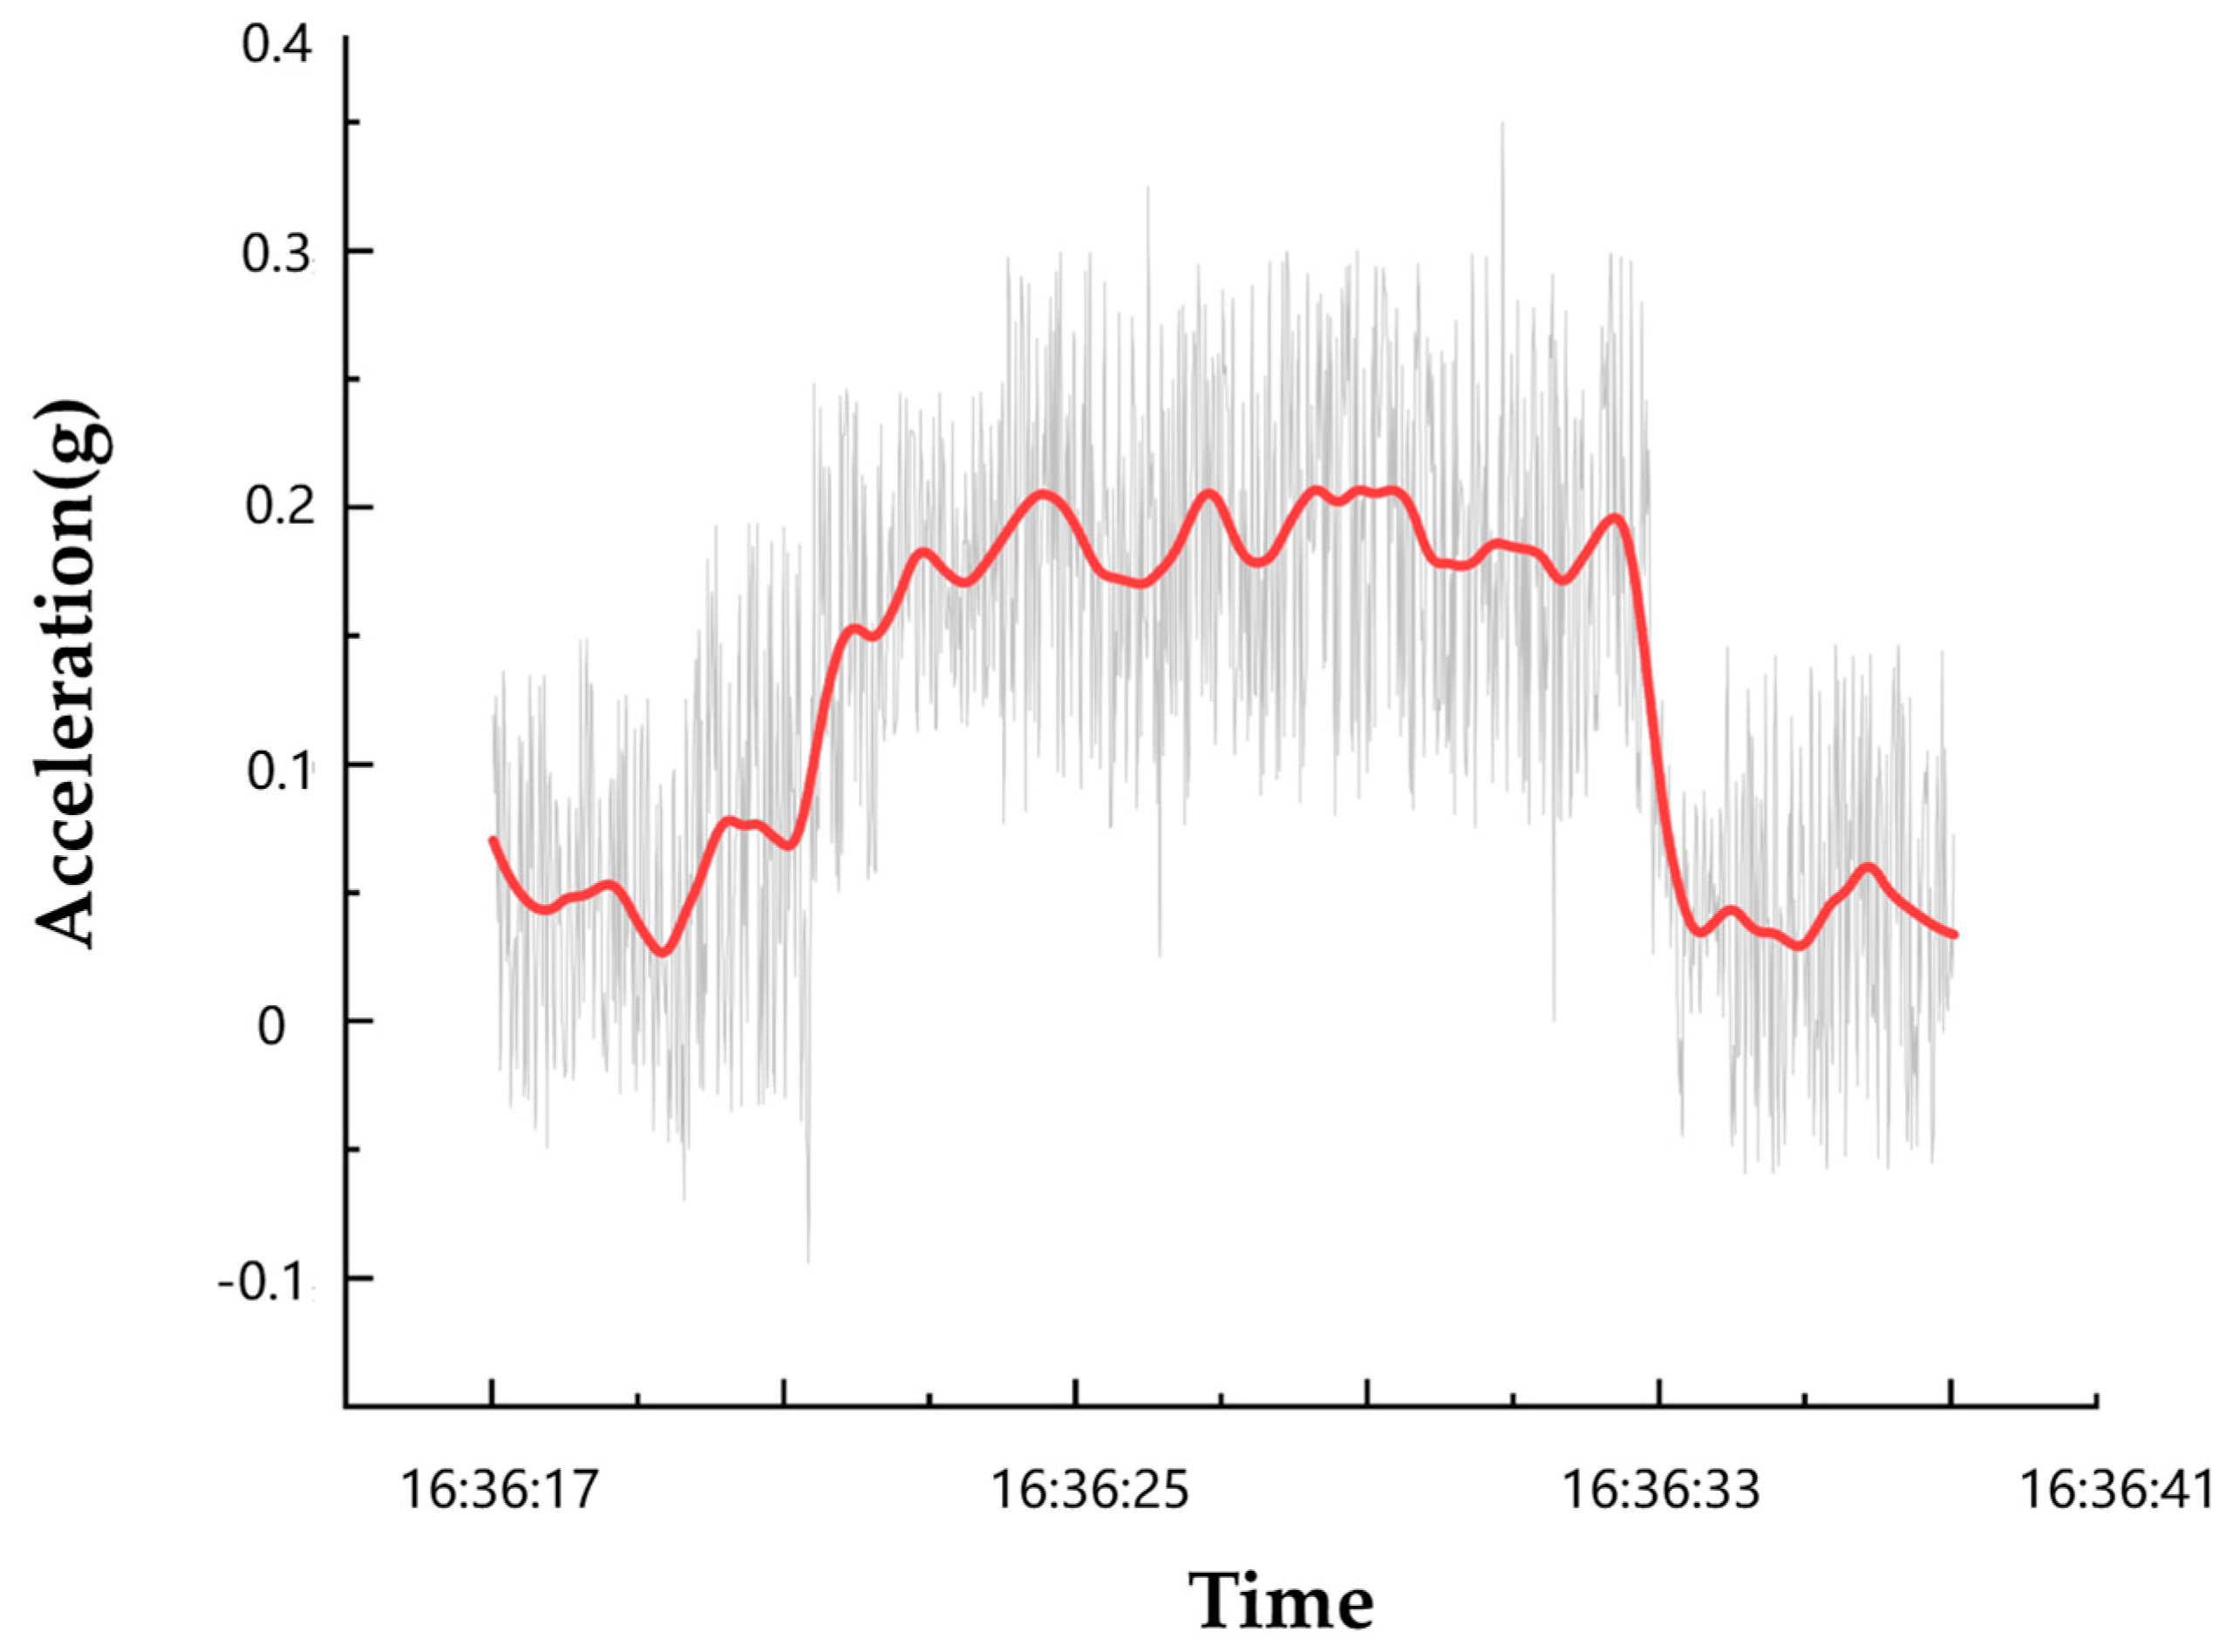
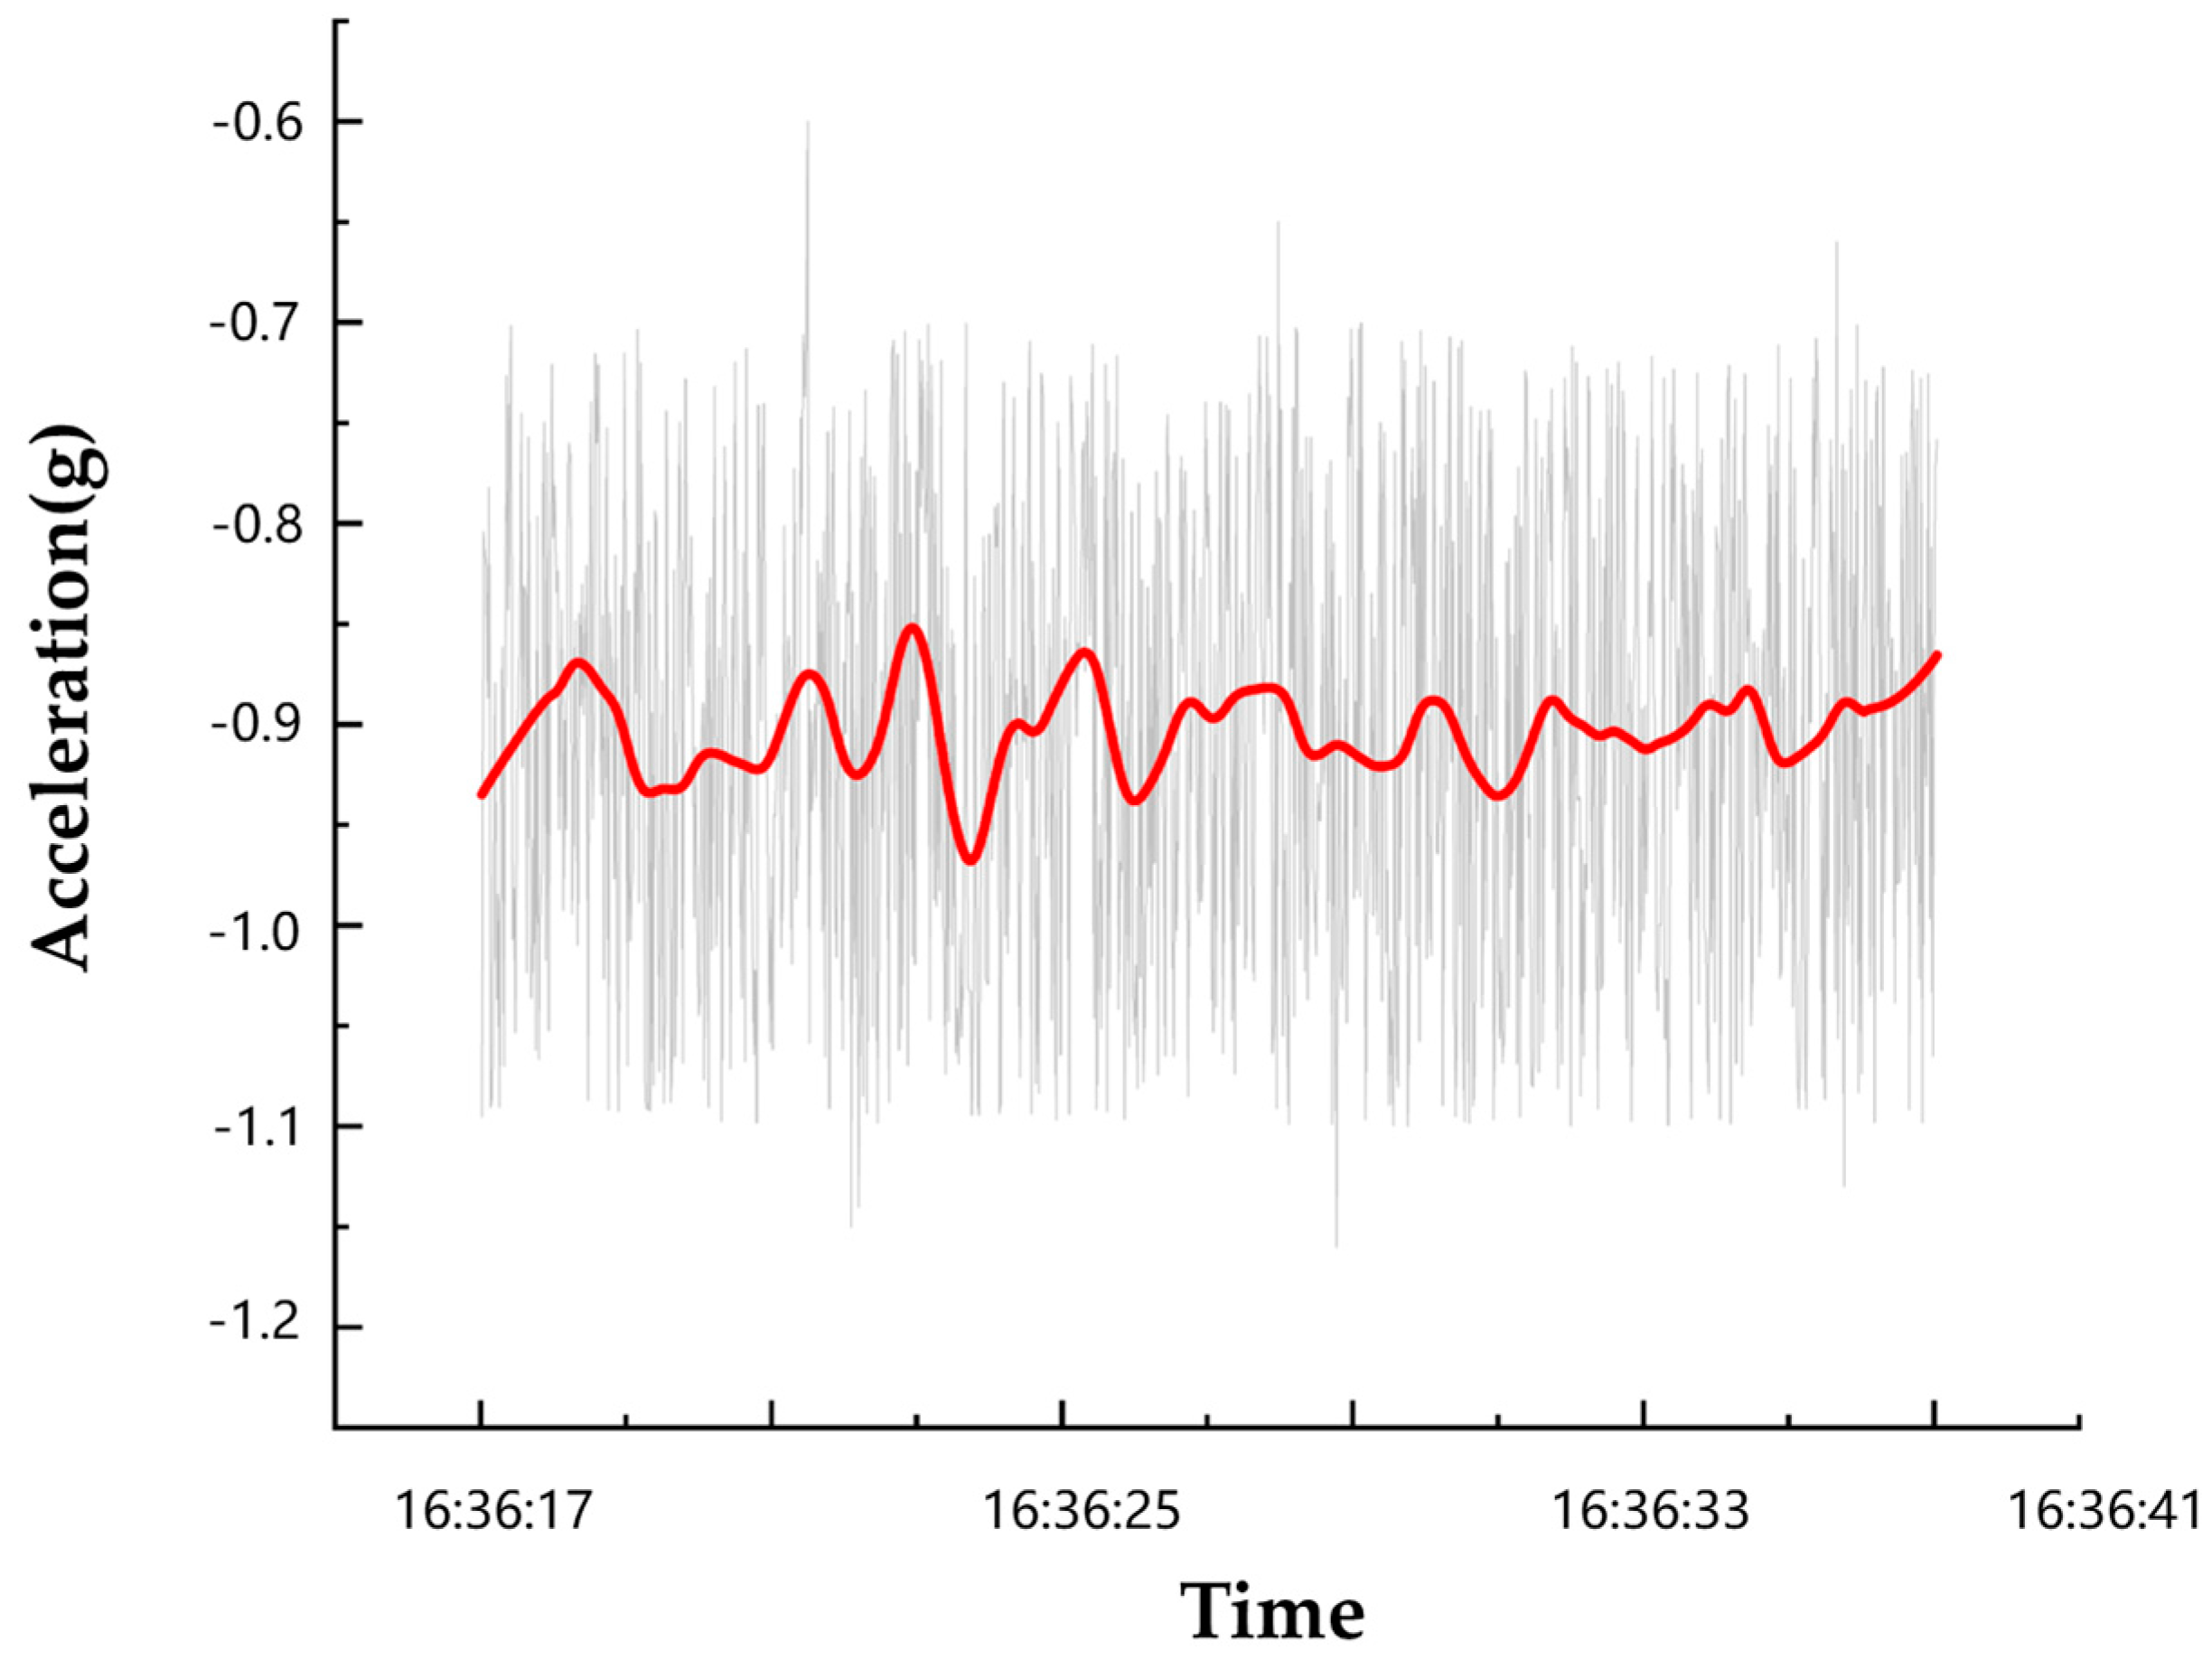
In order to investigate the effect of vehicle acceleration and related parameters on riding comfort, vehicle acceleration data are collected in each axial direction, and the results of a single unprotected left turn operation are visualized and analyzed. Influenced by the equipment and driving operation and other factors, the acceleration data of the vehicle has apparent small non-stable fluctuations, which affects the analysis of the overall trend. In this paper, the data is reprocessed by a filtering function to remove some invalid points, as shown in Figure 6, Figure 7 and Figure 8.
As shown in Figure 6, Figure 7 and Figure 8, the acceleration values of the Y-axis, i.e., the lateral direction, vary significantly more under the left turn condition. In contrast, the acceleration values of the X-axis and Z-axis are relatively more stable. The constant change of lateral acceleration of the vehicle is likely to cause the passenger’s body to sway from side to side, which is an essential factor affecting comfort. Therefore, for the vehicle unprotected left turn condition, the lateral acceleration and jerk, the lateral acceleration peak, and the jerk peak are essential parameters to characterize the vehicle motion state, which are also critical indicators to quantify the comfort status domain boundary.
In order to analyze the distribution of vehicle motion state parameters under unprotected left turn conditions, 620 sets of data from 31 subjects in this experiment are counted, and the frequency statistics chart of vehicle lateral acceleration and lateral jerk are plotted.
As shown in Figure 9, the lateral acceleration range during the whole unprotected left turn maneuver is 0~0.6 g, among which a proportion of less than 0.1 g accounts for about 10%, more than 0.4 g accounts for about 4%, and 0.1~0.4 g accounts for about 86%. Therefore, the acceleration value of the vehicle necessary to complete an unprotected left turn maneuver is typically between 0.1 g and 0.4 g.
As shown in Figure 10, the lateral jerk of the vehicle throughout the unprotected left turn ranges from 0 to 1.0 (g/s), of which a proportion less than 0.1 (g/s) accounts for about 18%, a proportion greater than 0.6 (g/s) accounts for about 4%, and a proportion from 0.1 to 0.6 (g/s) account for about 78%. Therefore, the lateral jerk of the vehicle completing an unprotected left turn maneuver is typically in the range of 0.1 (g/s) to 0.6 (g/s).
Through the above analysis, the factors affecting passenger comfort when the vehicle performs unprotected left turn operations are initially identified, including the lateral acceleration and the lateral jerk, obtained from the intelligent sensor devices installed on the vehicle. In addition, passenger comfort evaluation results recorded through the device operator were also compiled, and the specific rating method is shown below.
As shown in Table 2, if the tested passengers feel uncomfortable, the rating range is 1–5; if they feel comfortable, the rating range is 6–10. In addition, 5 is the dividing line; between 5 and 6 is not the rating range we set. The higher the score, the better the comfort. The passengers are required to inform the data recorder of the comfort evaluation results after completing an unprotected left turn operation for recording and storage.
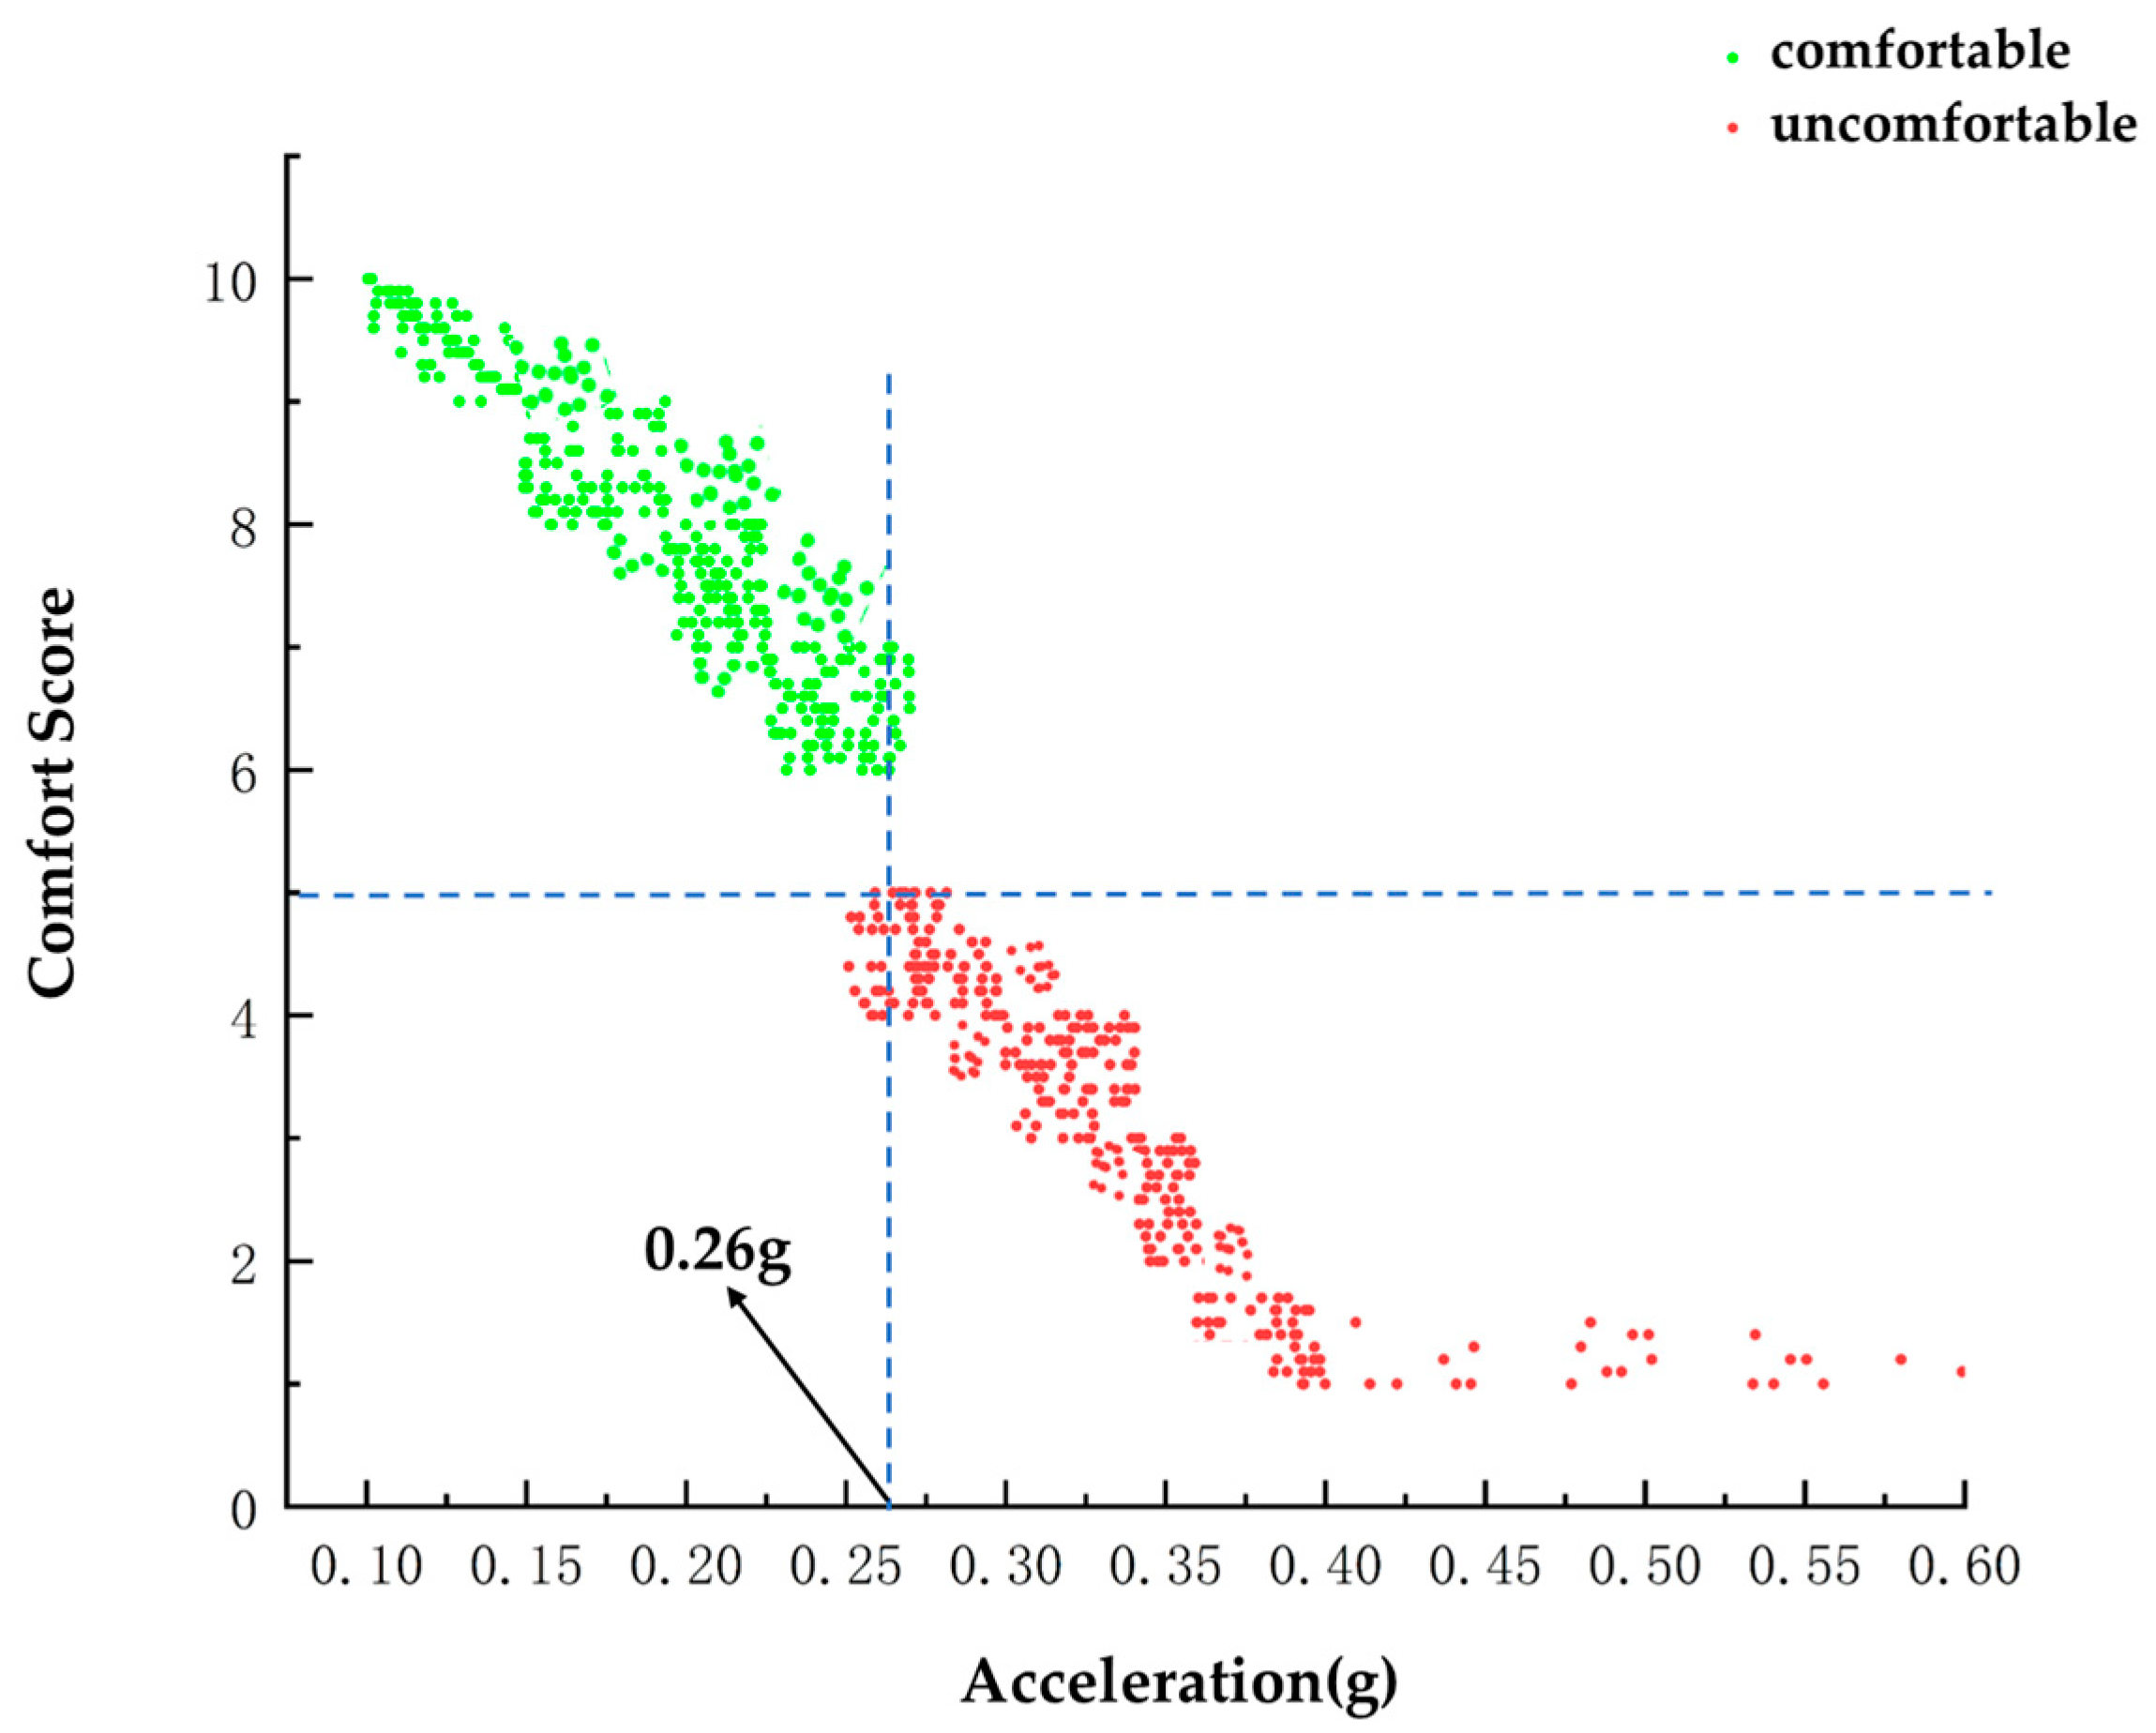
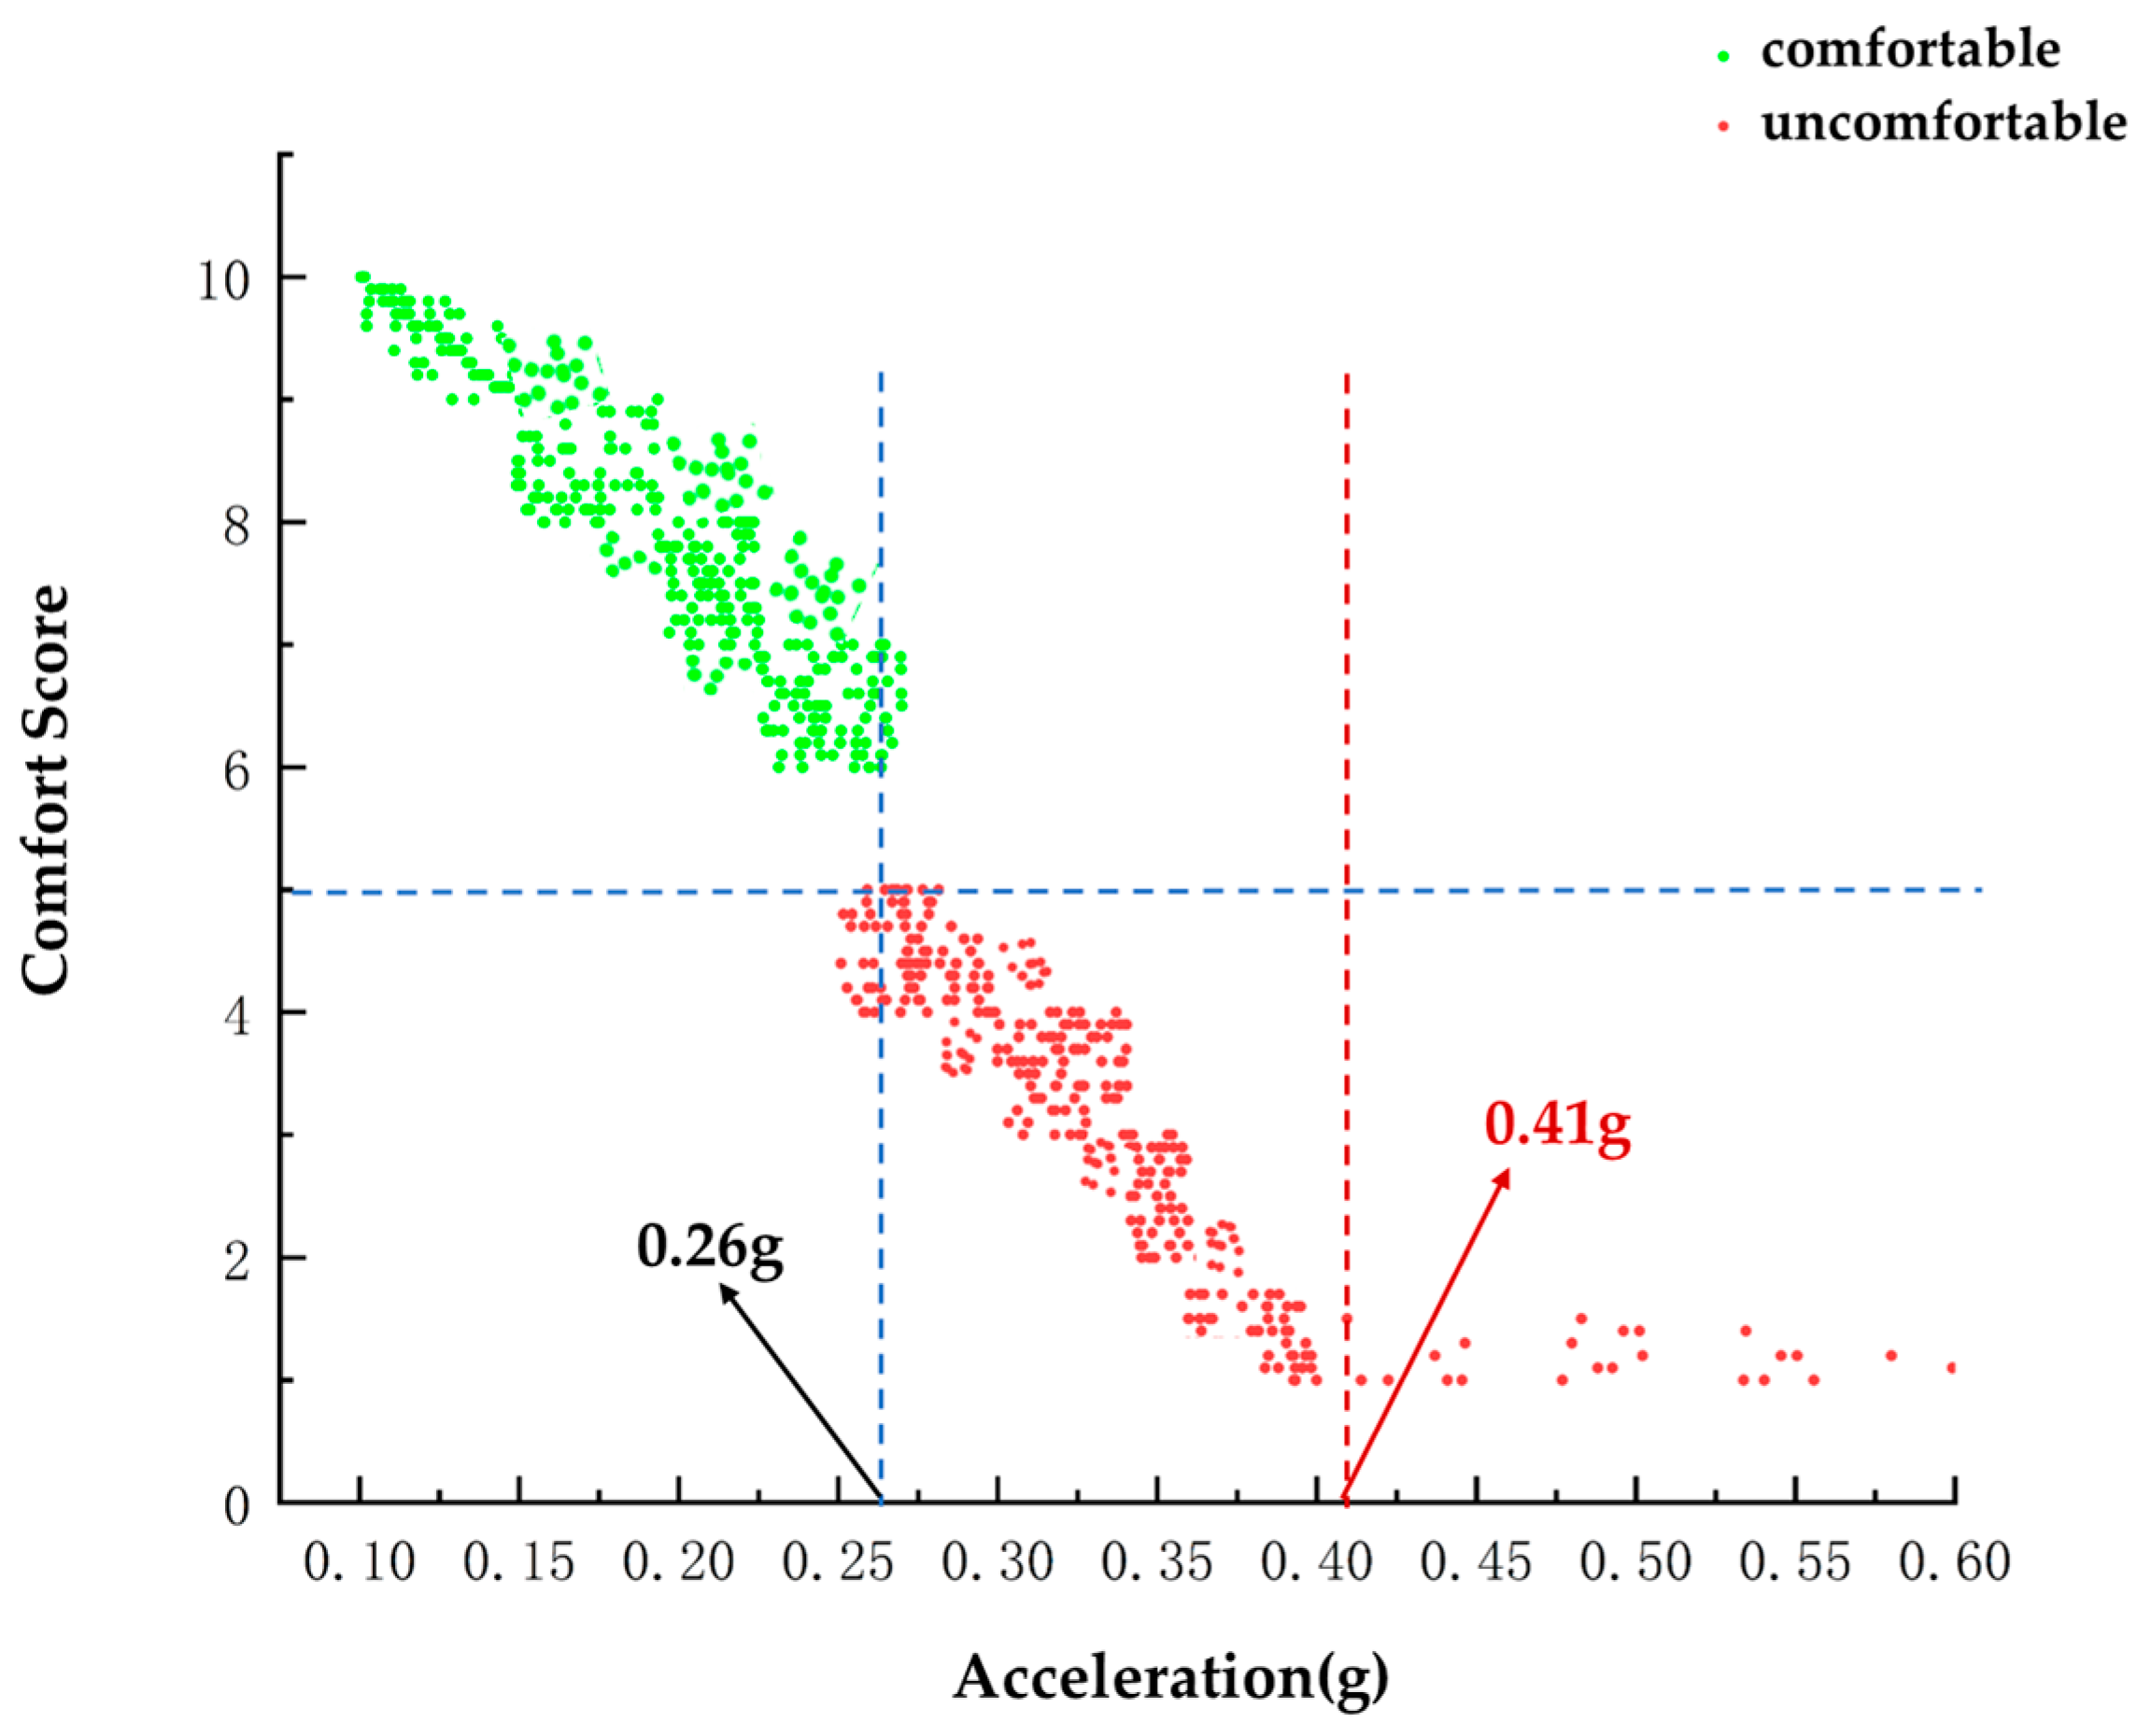
The vehicle motion parameters are set as the horizontal axis variable, and the passenger comfort evaluation results are set as the vertical axis variable to investigate the relationship between them. As shown in Figure 11, the vehicle lateral acceleration is negatively correlated with passenger comfort evaluation results, indicating that the greater the lateral acceleration of the vehicle, the more likely it is to cause passengers discomfort. From the statistical data, it can be seen that when passengers change from the comfortable status to the uncomfortable status, the corresponding lateral acceleration value is about 0.26 g, which is the comfort status domain boundary of autonomous vehicles. Due to the differences in individual factors such as age and gender, the evaluation results of some passengers are evenly distributed near the boundary and do not affect the experimental results.
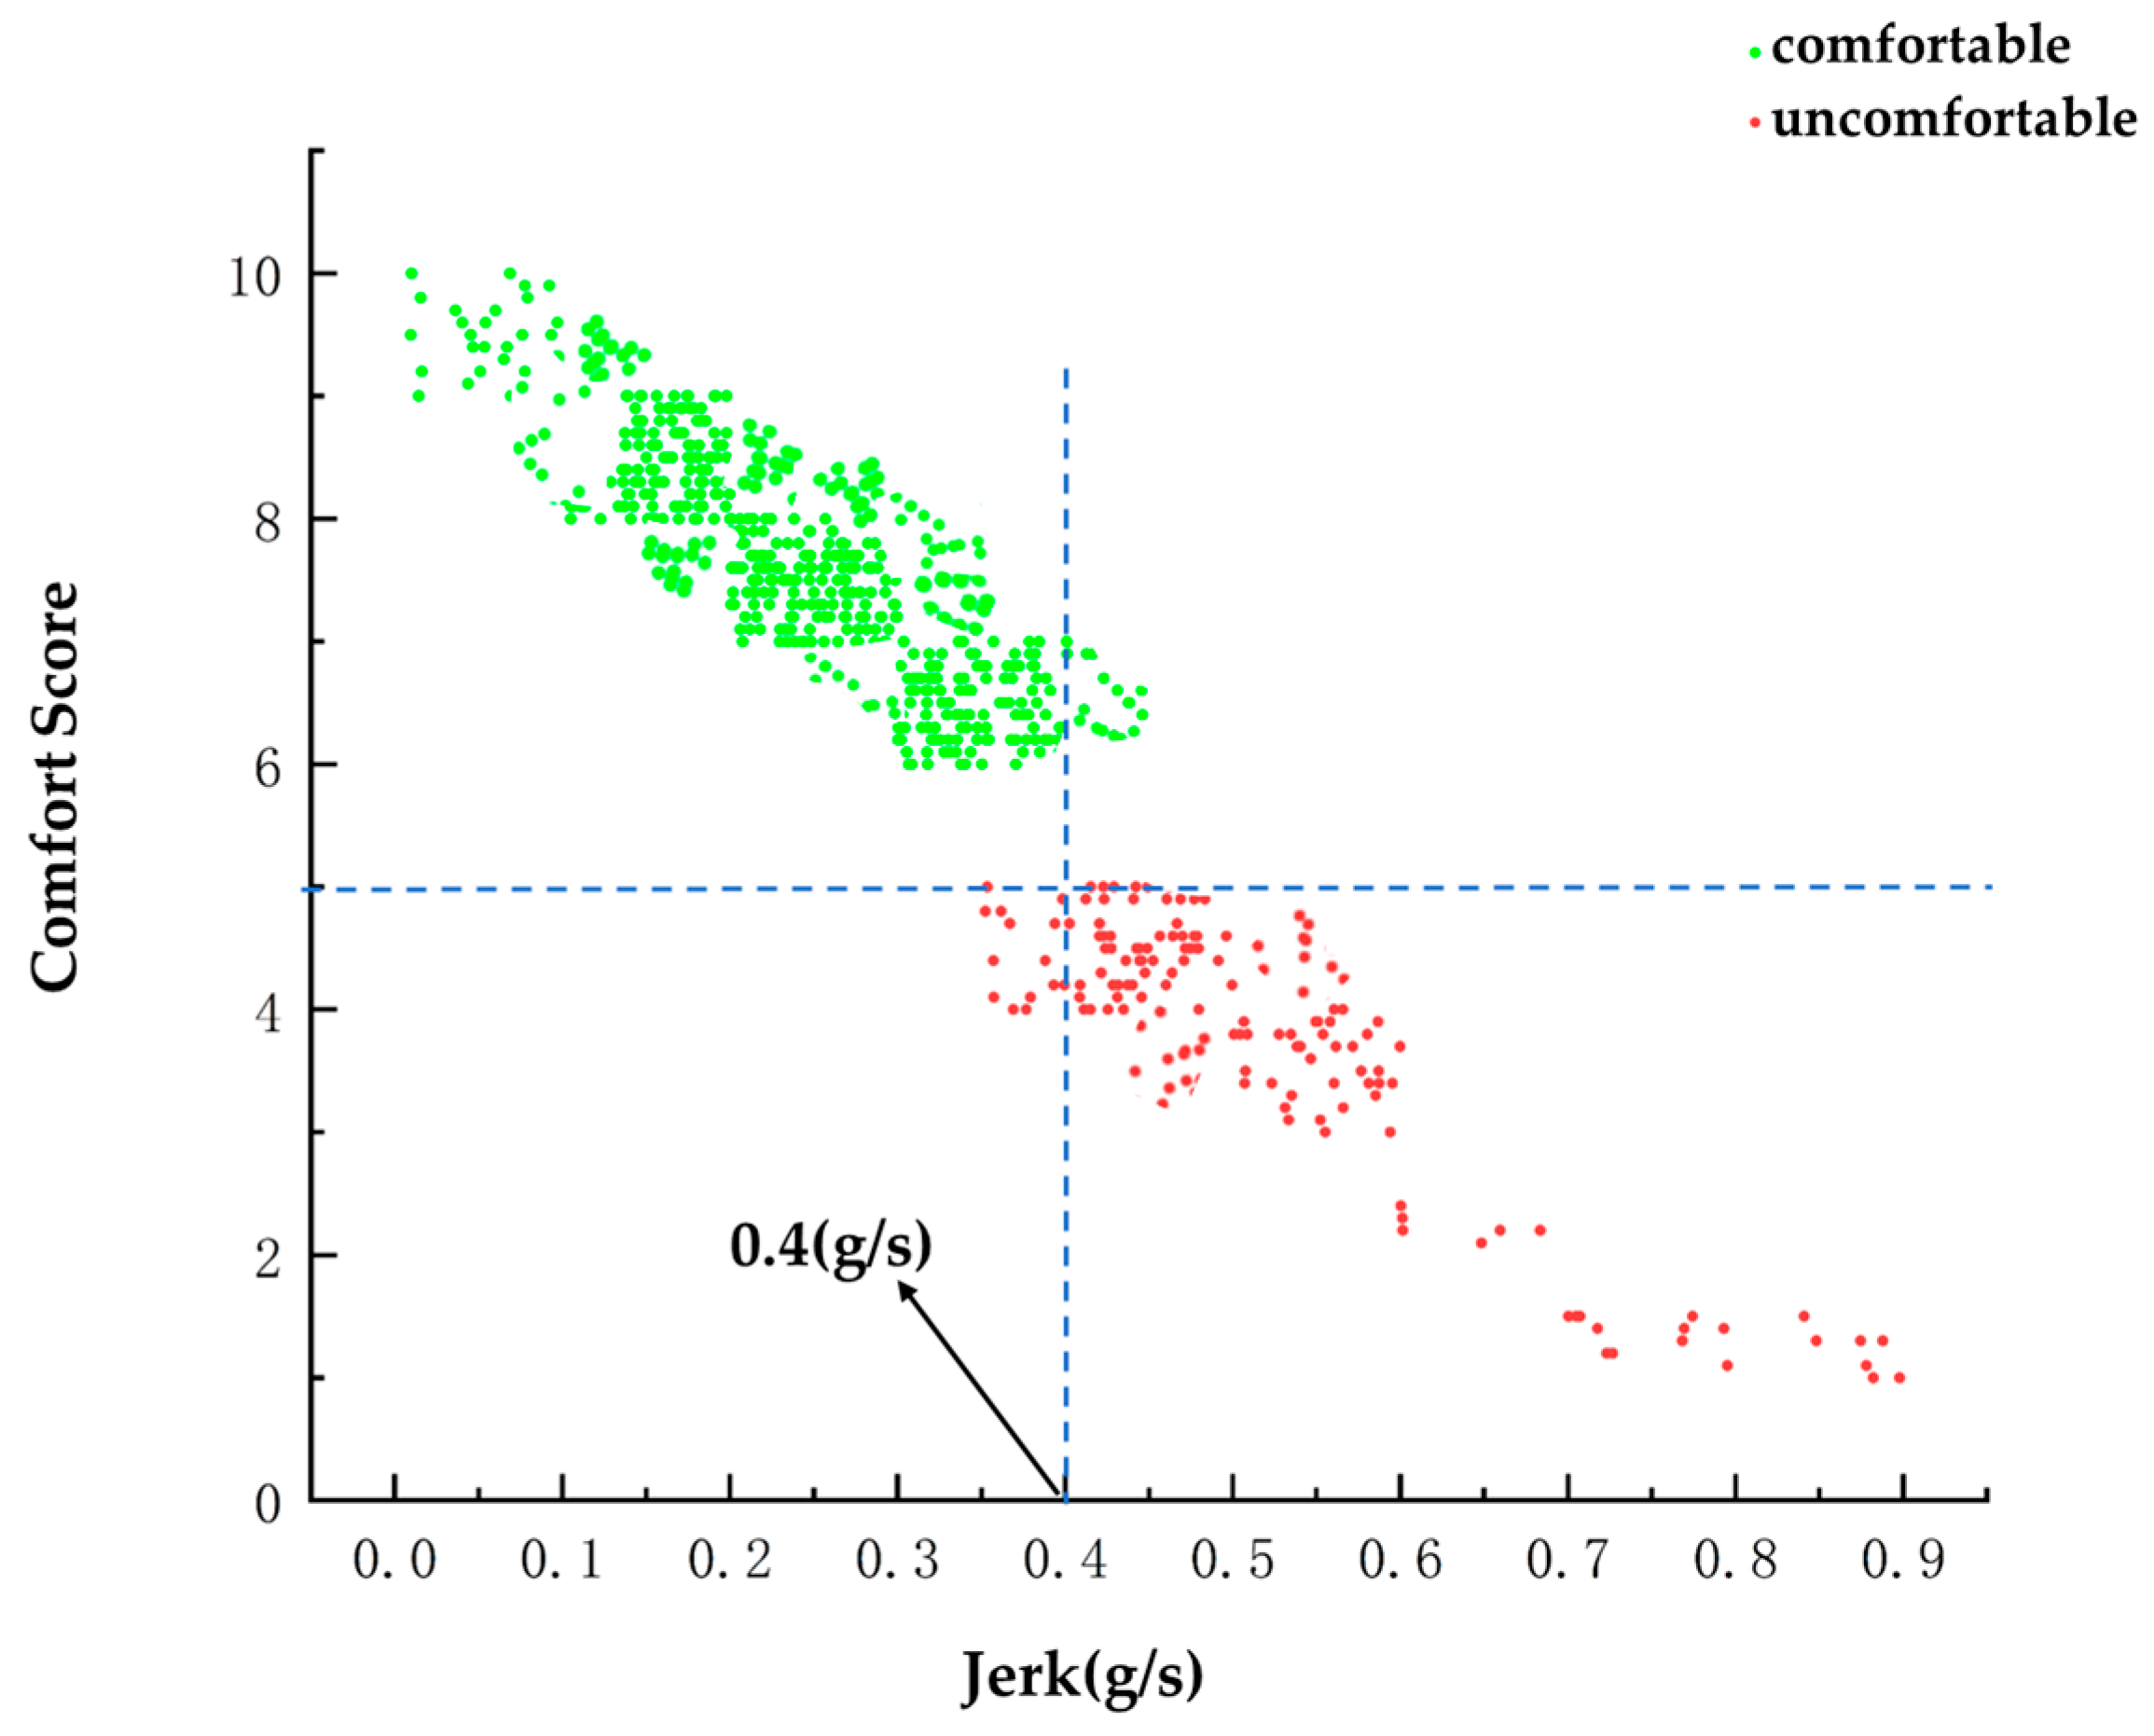
As shown in Figure 12, the vehicle lateral jerk is negatively correlated with passenger comfort evaluation results, indicating that the greater the lateral jerk of the vehicle, the more likely it is to cause passengers discomfort. From the statistical data, it can be seen that when passengers change from the comfortable status to the uncomfortable status, the corresponding lateral jerk value is about 0.4 (g/s), which is the comfort status domain boundary of autonomous vehicles. Due to the differences in individual factors such as age and gender, the evaluation results of some passengers are evenly distributed near the boundary and do not affect the experimental results.

4.2. Determination and Quantification of Extreme Status Domain Boundary

The safety margin of the extreme status domain is small, which will cause intense discomfort and fear among drivers and passengers and even affect the surrounding traffic participants. Drivers generally do not actively cross the extreme status domain boundary. Therefore, this paper selects the lateral acceleration and lateral jerk data with low comfort scores and minimal occurrence ratio as the judgment condition of the extreme status domain.
As shown in Figure 13, when the vehicle lateral acceleration exceeds 0.41 g, the passenger comfort score is low, and the quantity of data is tiny. As shown in Figure 9, the lateral acceleration values for a normal unprotected left turn maneuver are essentially between 0.1 g and 0.4 g, indicating that the drivers and passengers basically do not actively cross this range. Therefore, the extreme status domain boundary of autonomous vehicles is when the lateral acceleration is 0.41 g. This is also consistent with the lateral acceleration value (0.4 g) defined in [19] for “aggressive turns”.
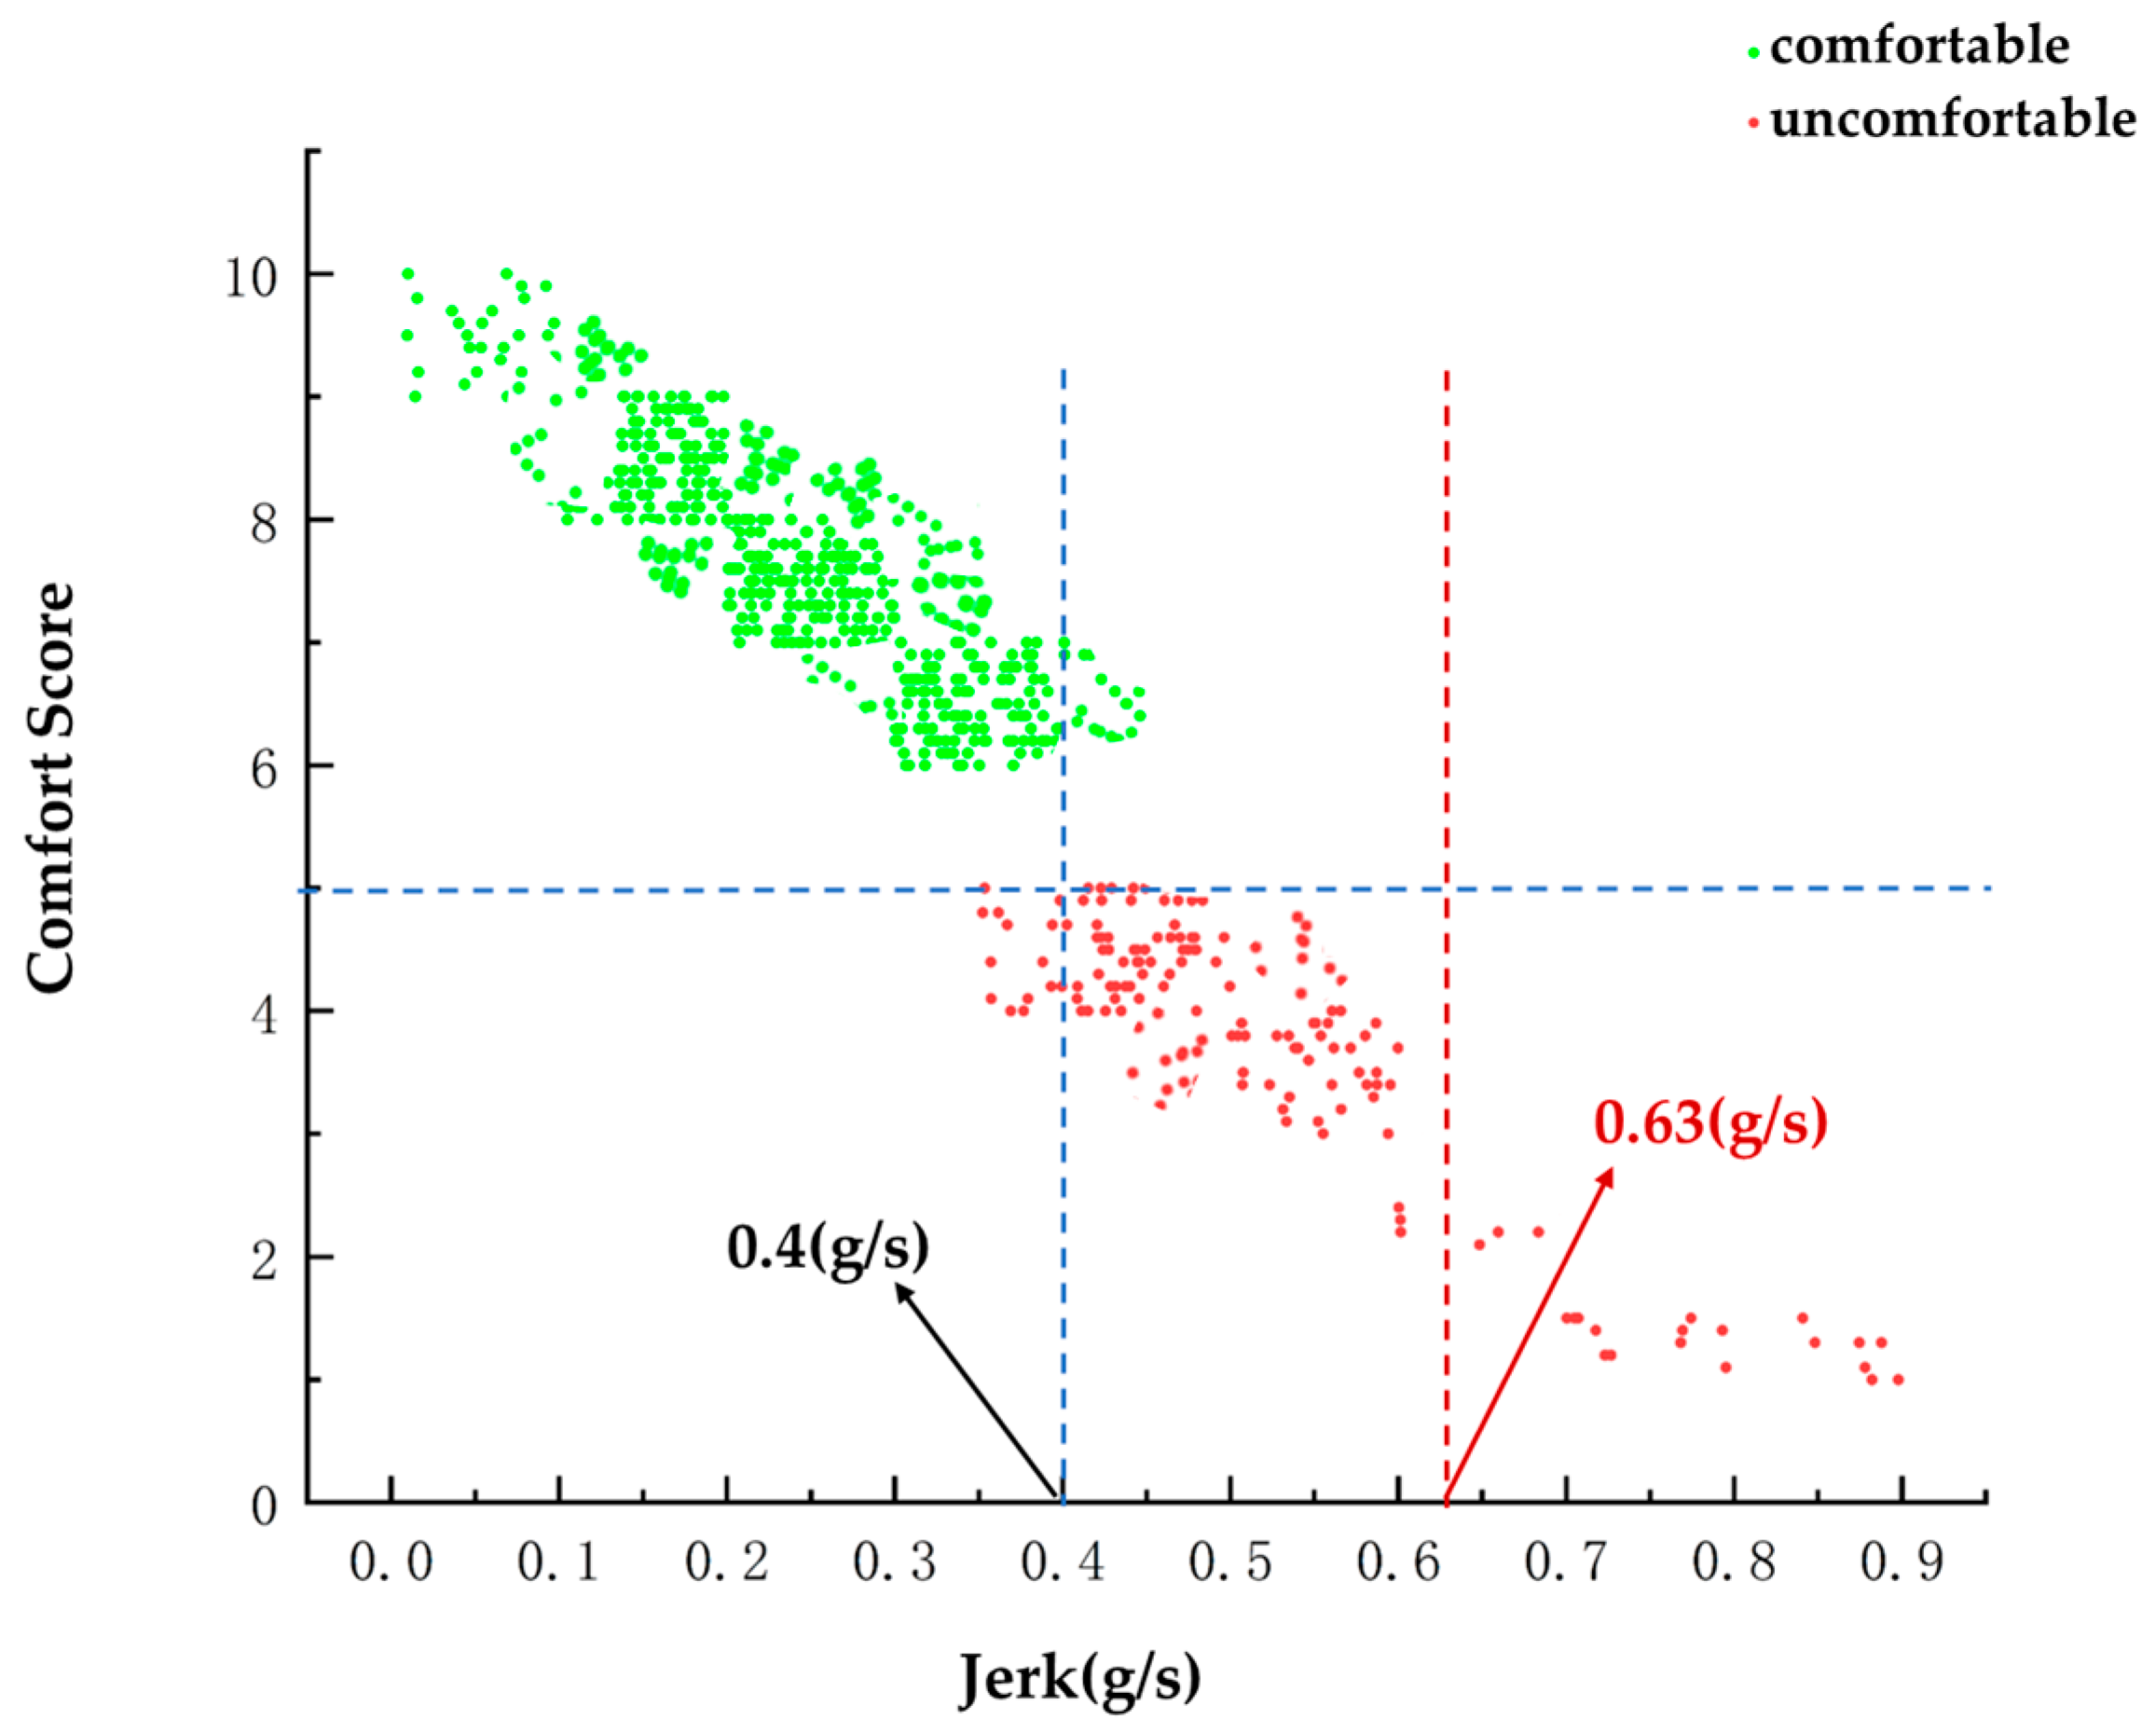
Similarly, the extreme status domain boundary of autonomous vehicles is when the lateral jerk is 0.63 (g/s), as shown in Figure 14.

4.3. Determination and Quantification of Safety Status Domain Boundary

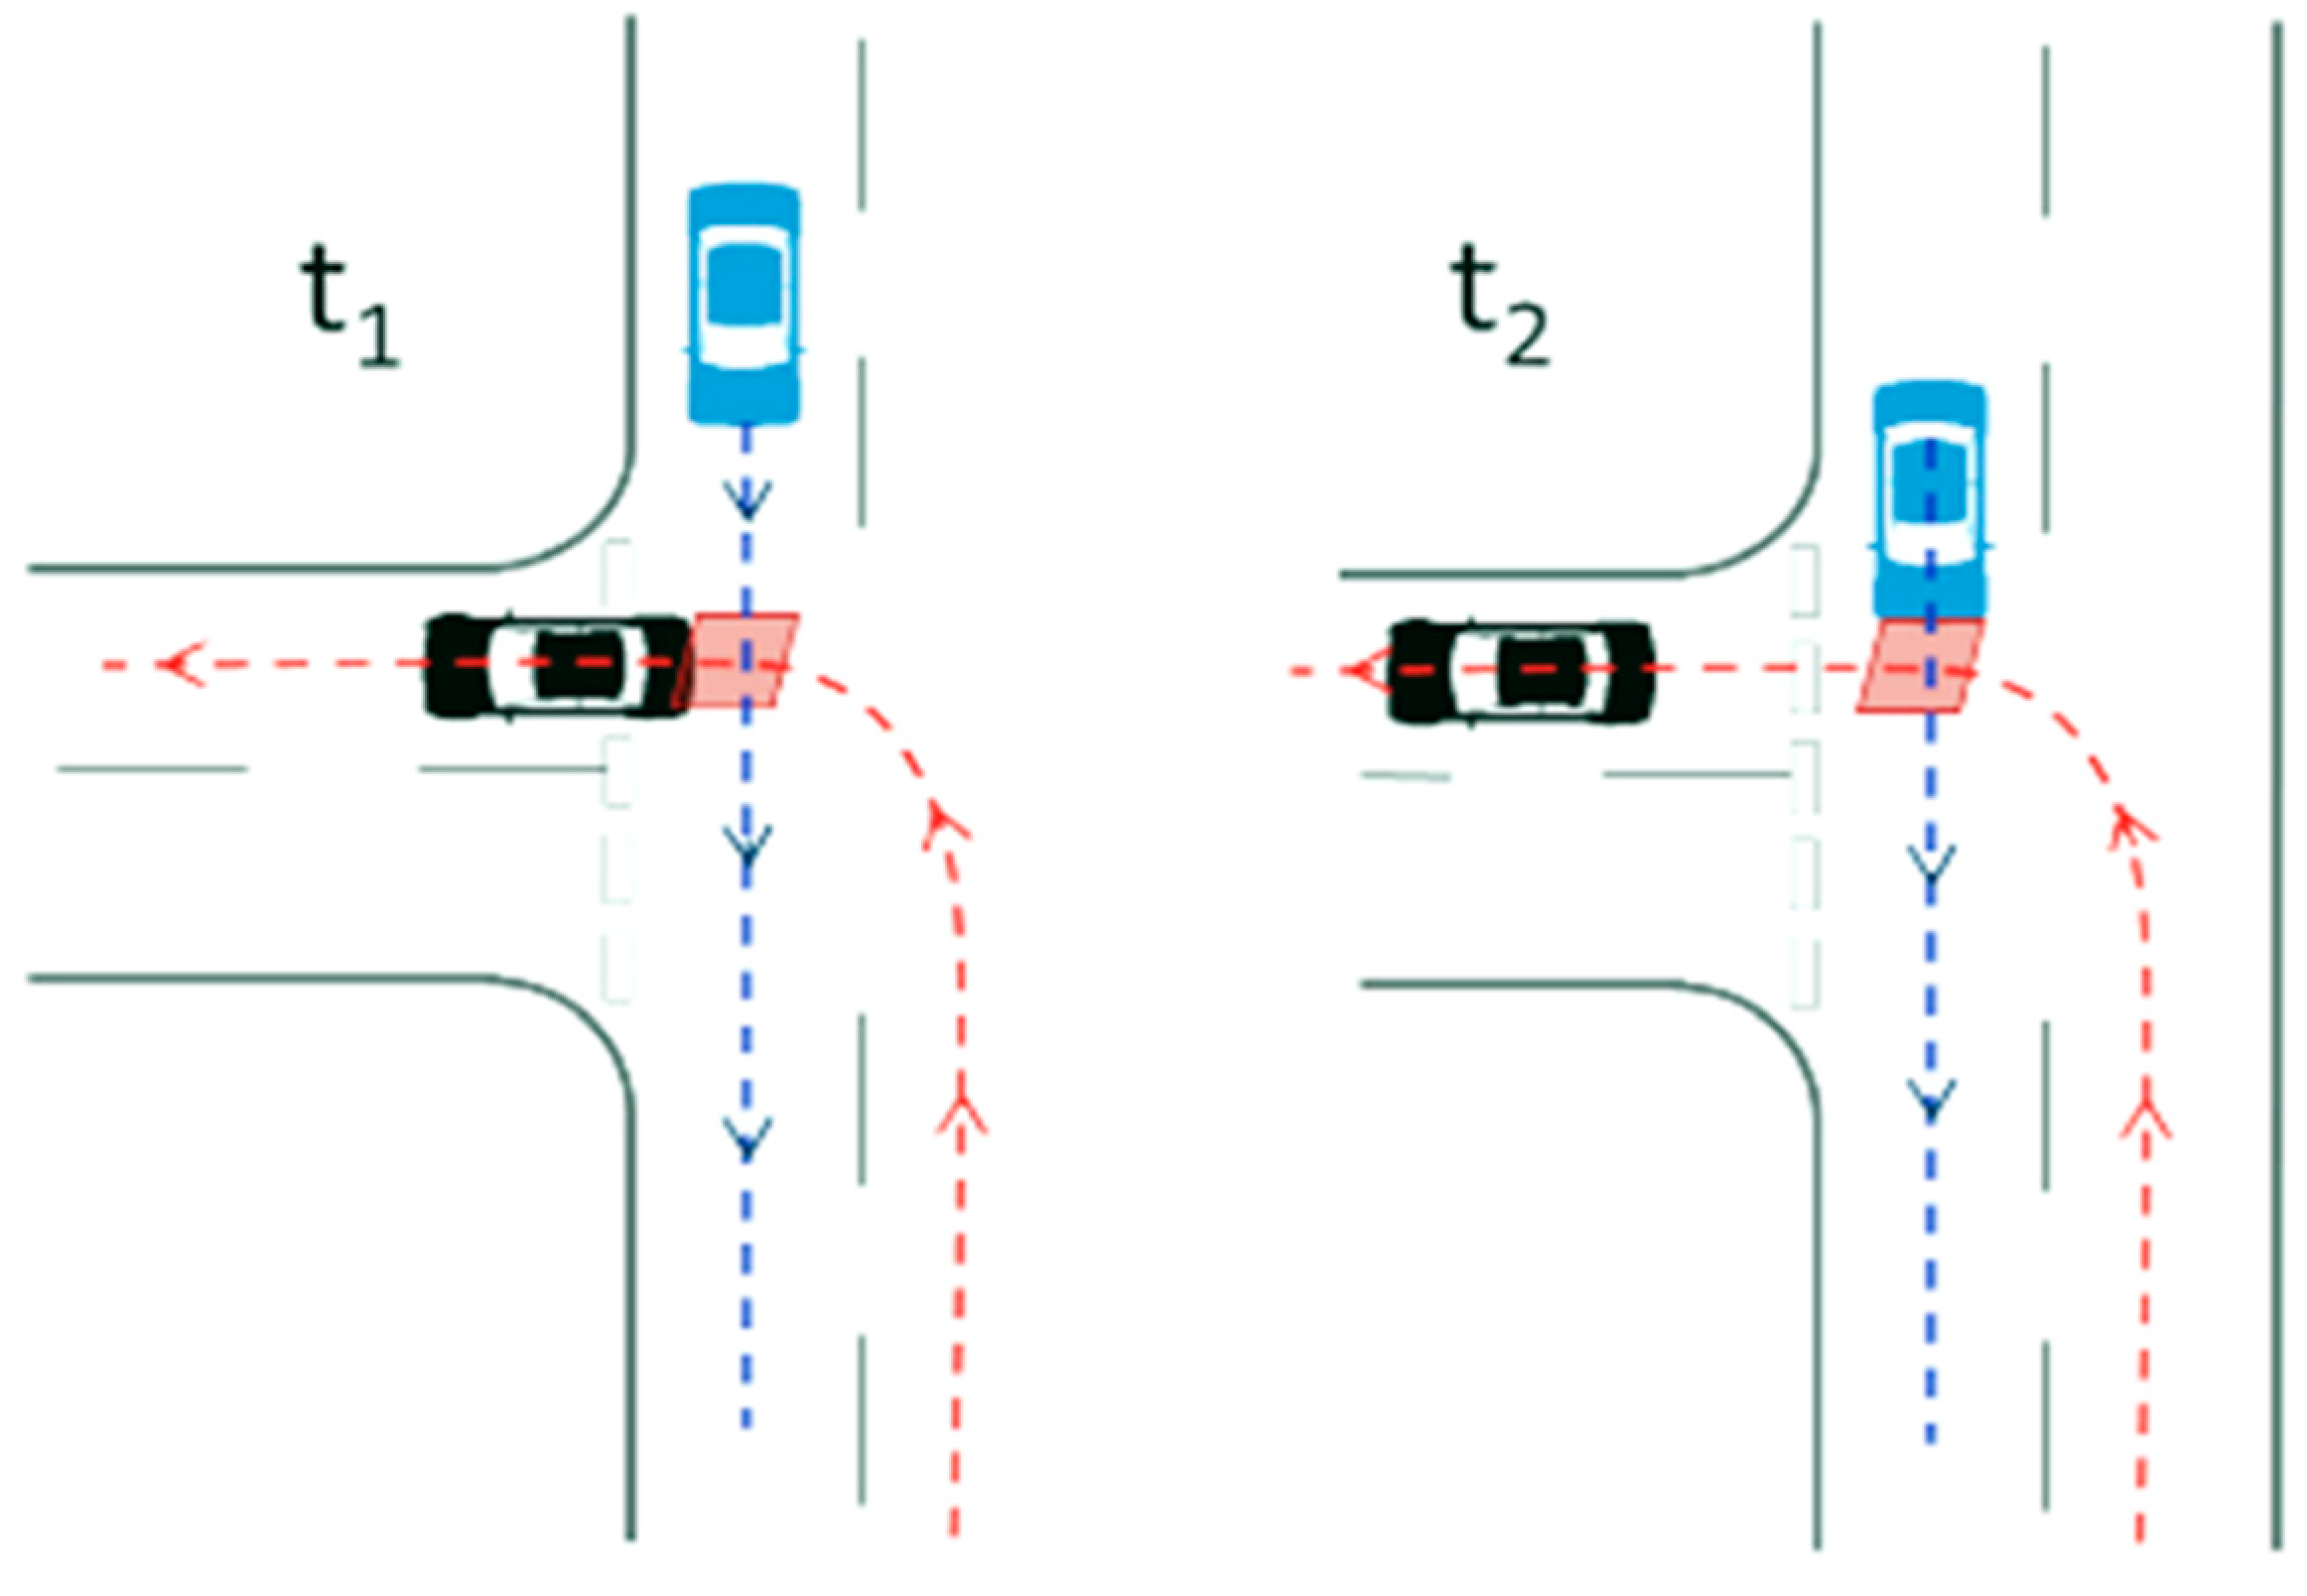
Some studies analyzing the safety status of LTAP/OD scenarios use post-encroachment time (PET). As illustrated in Figure 15, the trajectories of left-turning and straight-traveling vehicles form a diamond-shaped area at the intersection where their paths overlap, i.e., there is a potential conflict. This area is called the encroachment zone. PET is the time gap between when the first vehicle leaves the encroachment zone and when the second vehicle enters the encroachment zone.
Although PET can provide an objective measure of the safety margin of left turn driving behavior, the PET calculation utilizes the actual time the vehicle arrives at the conflict point. Hence, PET is an ex post facto measure. However, for the design of ADAS and autonomous vehicles, it is necessary to predict when the vehicle reaches the conflict point to make a judgment and decide whether to make an alarm or an intervention. Therefore, this paper draws on the calculation method of PET. We use the trajectory and speed predicted by the autonomous driving system to predict the PET value of conflict vehicles, which is also the judgment condition for quantifying the safety status domain boundary of autonomous vehicles.
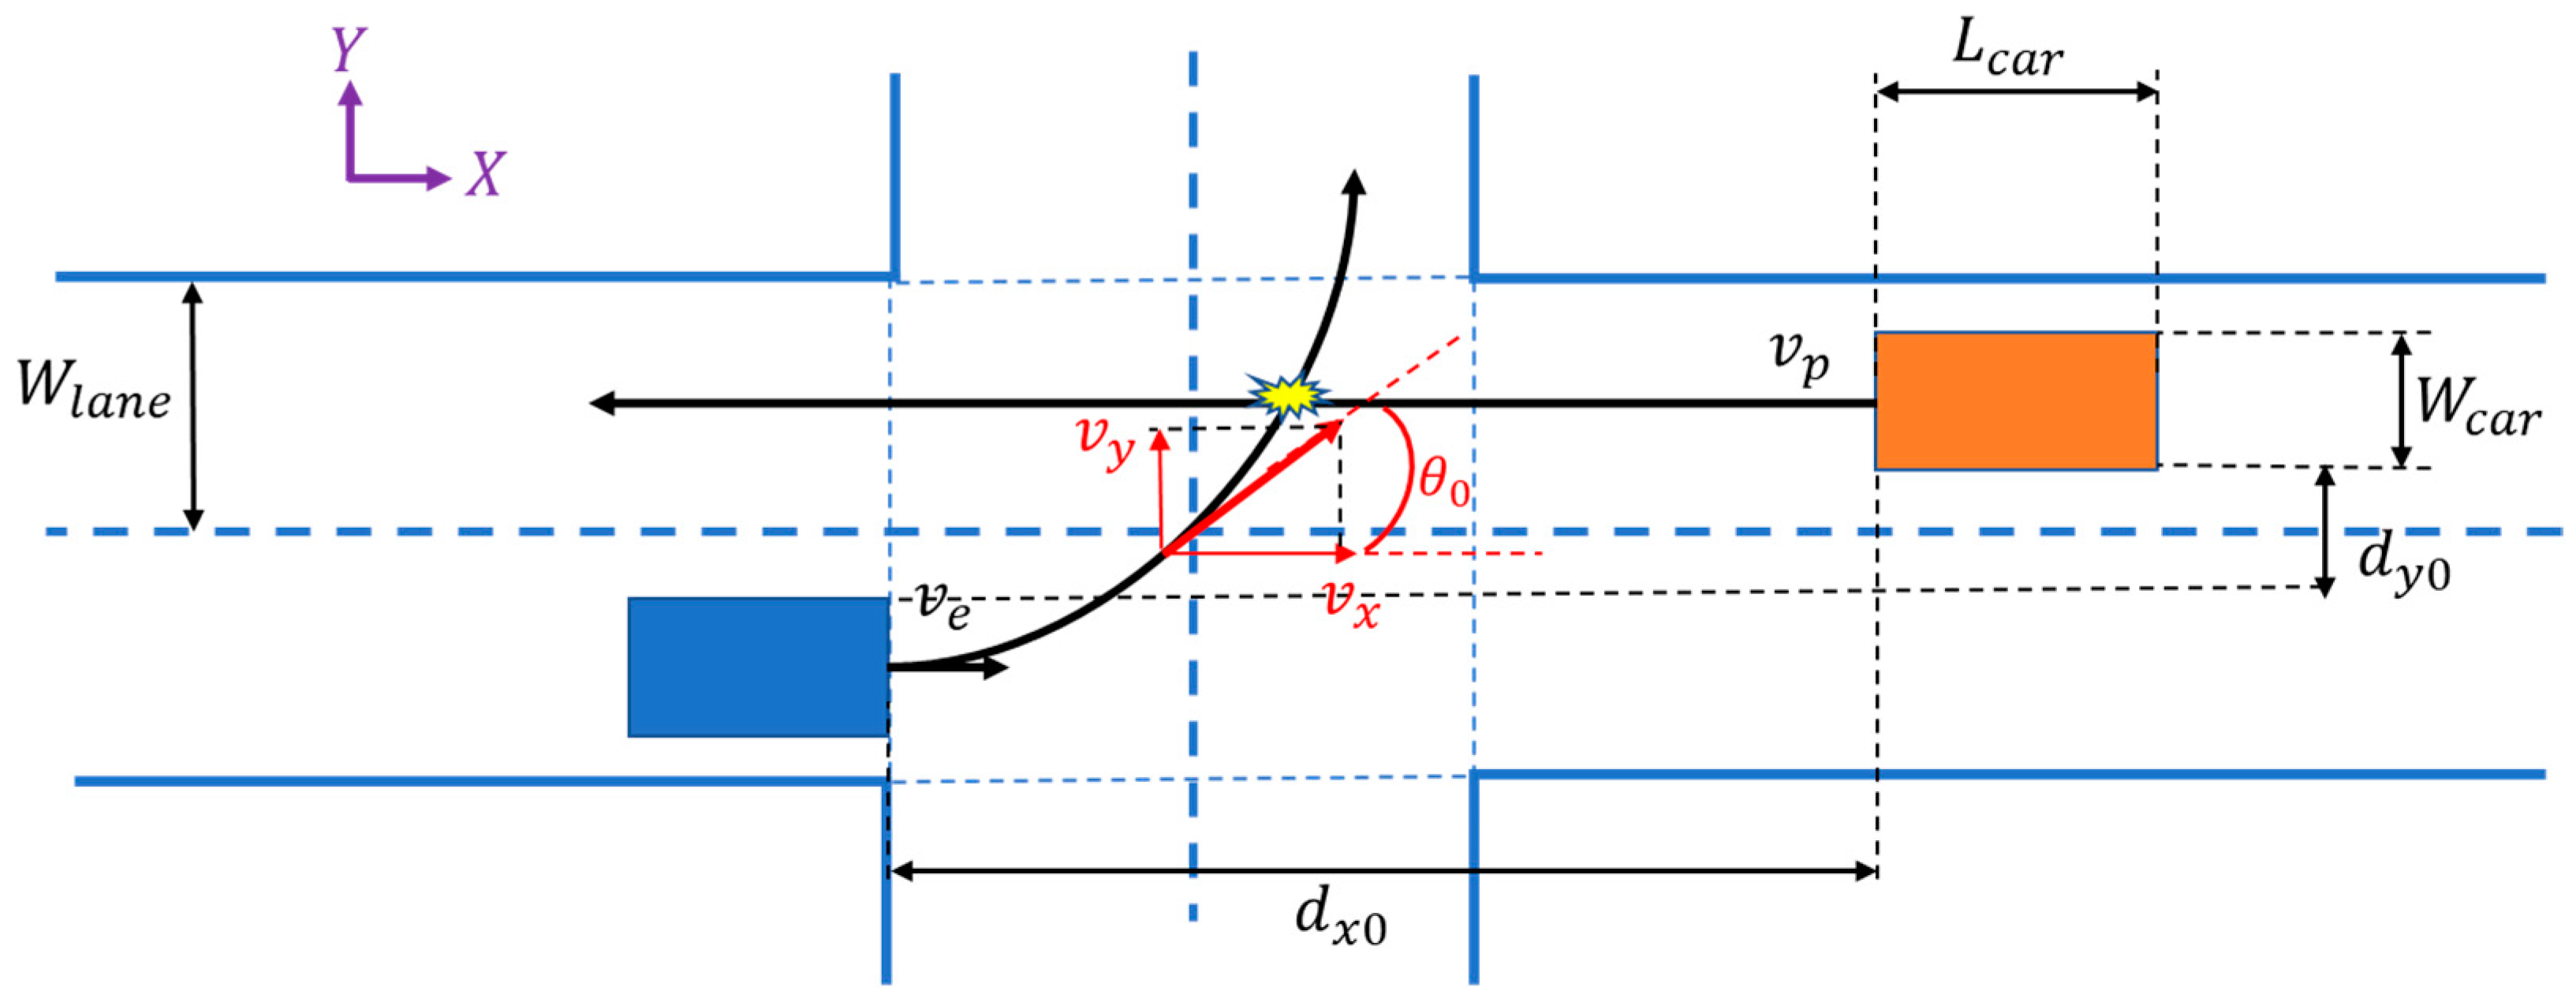
The velocity of the SV changes more obviously during the left turn maneuvers. However, the velocity of the POV basically does not change a lot, so it is set to a constant speed, and the POV mainly focuses on longitudinal movement. The influence of lateral movement can be ignored. K Nobukawa et al. [20] argued that unprotected left-turning vehicles are also affected by intersection geometry as it relates to the length and curvature of the vehicle turning path. However, contrary to the initial expectation, the geometry of the intersection has no clear and direct relationship with the reference trajectory and speed of the vehicle. Therefore, the effect of intersection shape on the experimental results is not considered in this paper for the time being. Other factors, such as weather, visibility, and road surface conditions, are not directly available from the driving database and will not be analyzed here. The vehicle kinematic model and related scenario parameters are shown in Figure 16.
Where v e is the absolute velocity of SV; v x is the velocity component of SV in the x -direction; v y is the velocity component of SV in the y -direction; d x 0 is the relative distance of conflicting vehicles in the x -direction; d y 0 is the relative distance of conflicting vehicles in the y -direction; W l a n e represents the width of the road; and W c a r and L c a r denote the width and length of the vehicle, respectively.
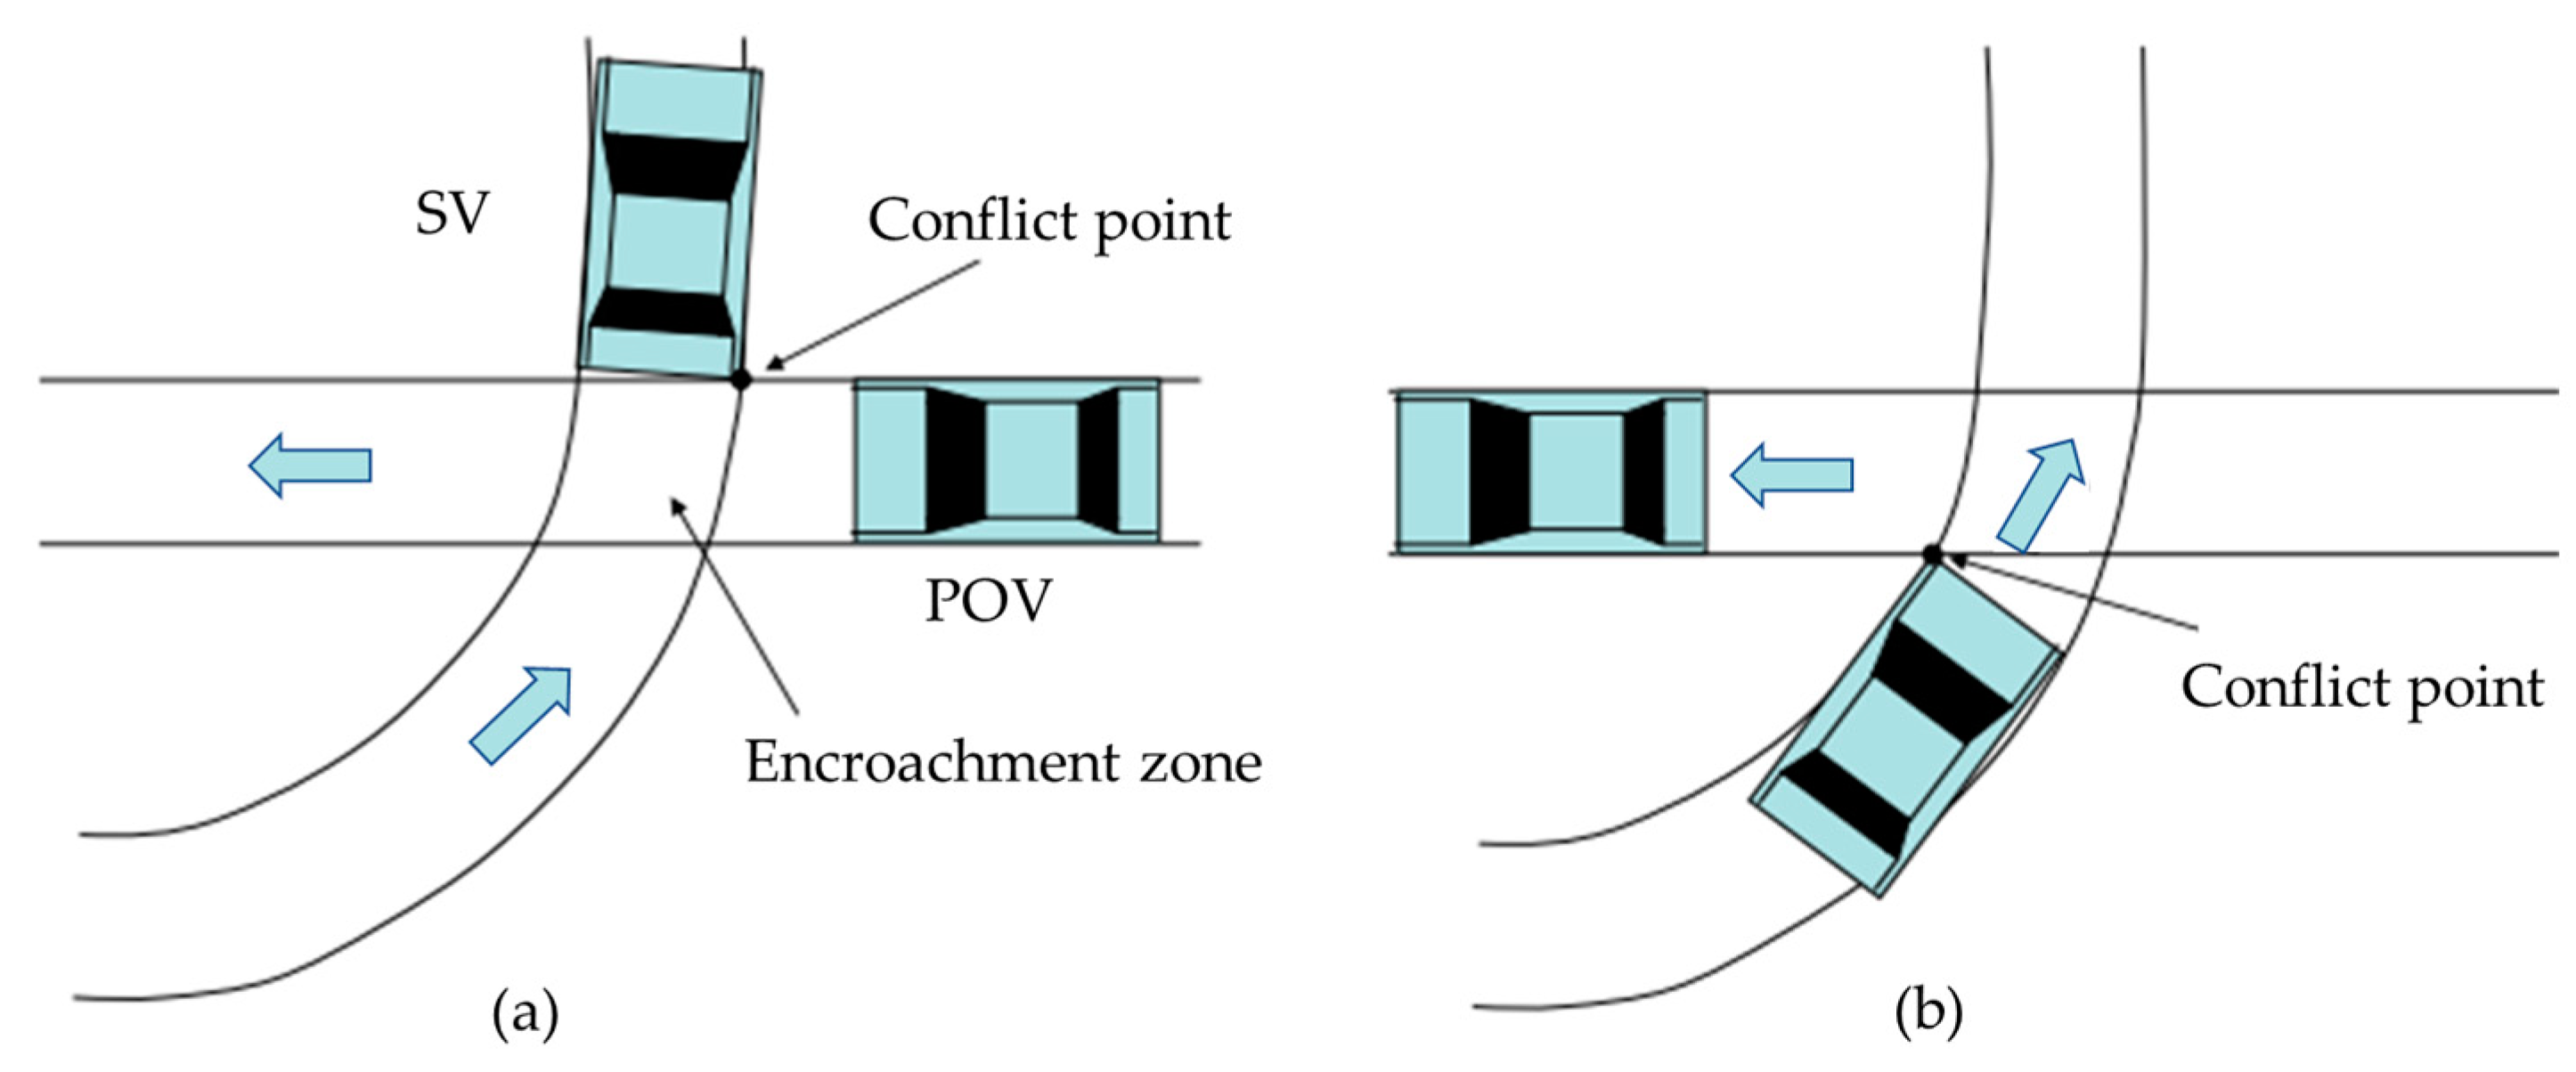
For the LTAP/OD case, there is a potential conflict when the left turn SV and POV are in either one of the following situations, as shown in Figure 17. The first case represents the SV crossing the intersection before the POV (Figure 17a); and the second case represents the SV crossing the intersection after the POV (Figure 17b). In the first case, the conflict point is located at the last point where the SV leaves the encroachment zone; and in the second case, it is found at the first point where the SV arrives at the encroachment zone. Moreover, note that since the vehicle shapes are assumed to be rectangular, the speed changes of the vehicles are negligible in and near the encroachment zone, and the edges of the encroachment zone are approximately linear to make the conflict point always appear on one of the vertices of the encroachment zone. As a result, a conflict point is typically found in the top-right corner of the encroachment zone in the case of the SV crossing first (Figure 17a), and the bottom-left corner in the other case (Figure 17b).
K Nobukawa et al. [20] mined 530 LTAP/OD scenarios from the naturalistic driving database (RDCW-FOT) and obtained the critical safety PETs of 2 s (the SV crosses first) and −1 s (the SV crosses second) for two conflict scenarios in (a) and (b), respectively, as the judgment conditions for quantifying the safety status domain boundary in this paper.
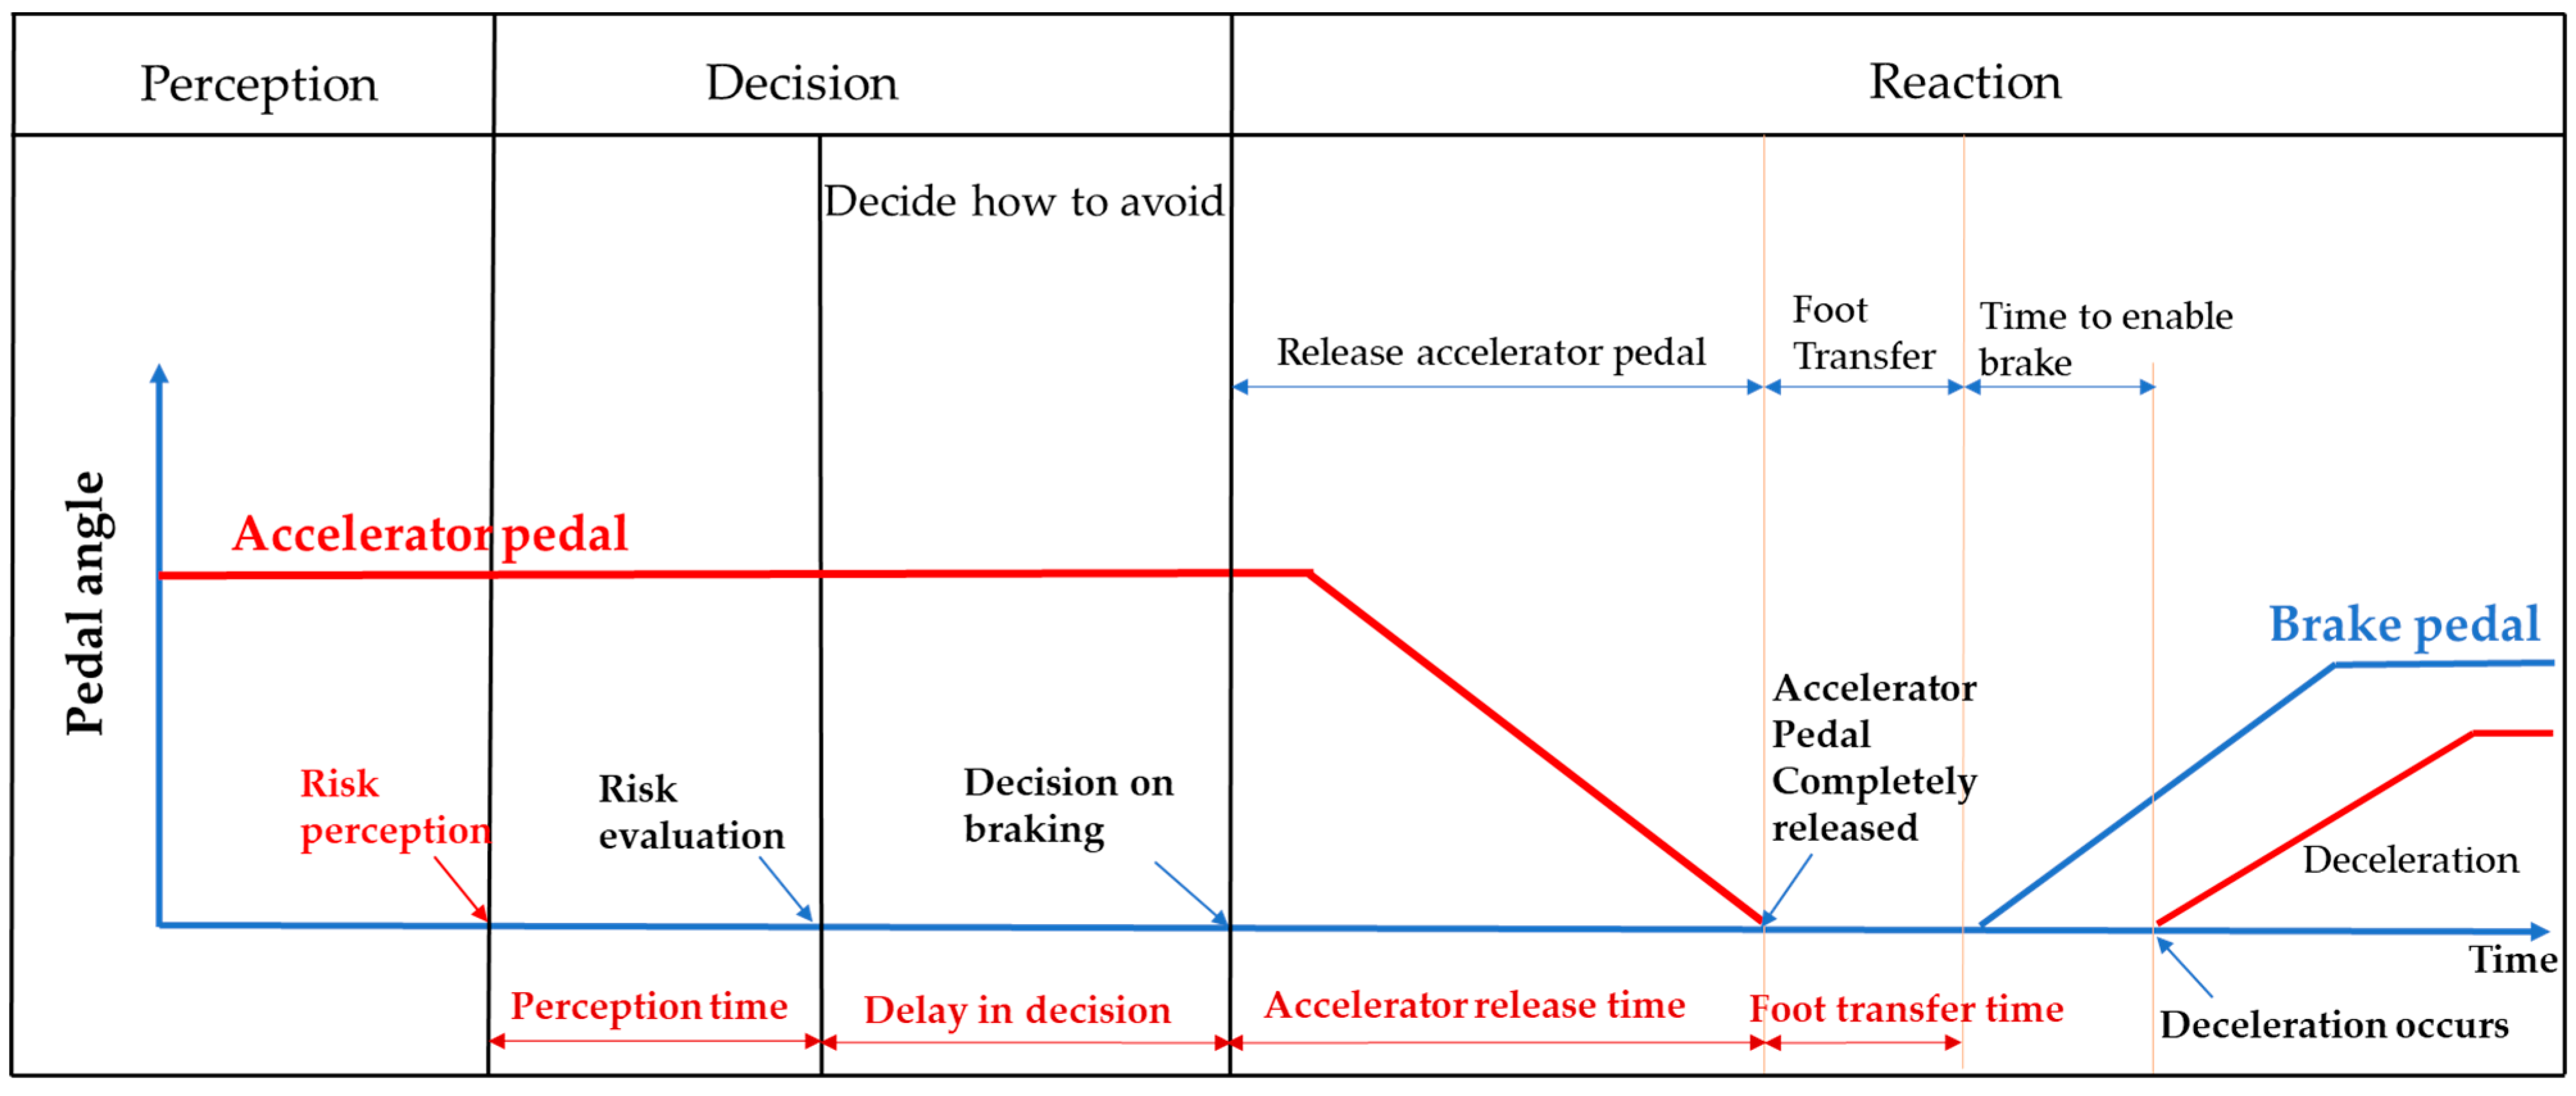
In vehicle motion and collision analysis, a competent and careful human driver model is used to simulate the driver’s driving behavior before encountering a risk. The avoidance capability in this driver model is achieved by braking only. The driver model is divided into three phases: “Perception”; “Decision”; and “Reaction”. The diagram in Figure 18 is a visual representation of these segments.
The safety and collision status domains of SV and POV are visualized based on vehicle unprotected left turn kinematic model and a skilled driver risk perception and operation model. Figure 19 shows the visual distribution pictorial of the safety and collision zone corresponding to different combinations of the lateral velocity of SV ( v y ) and the relative distance of conflict vehicles ( d x 0 ) when the longitudinal velocity of SV ( v x ) is 5 km/h and the velocity of POV ( v P ) is 40 km/h. Green represents the safe area, yellow represents the collision situation shown in Figure 17a, and red represents the collision situation shown in Figure 17b. The green and yellow dividing line is the safety status domain boundary of the conflicting vehicles under different combinations.
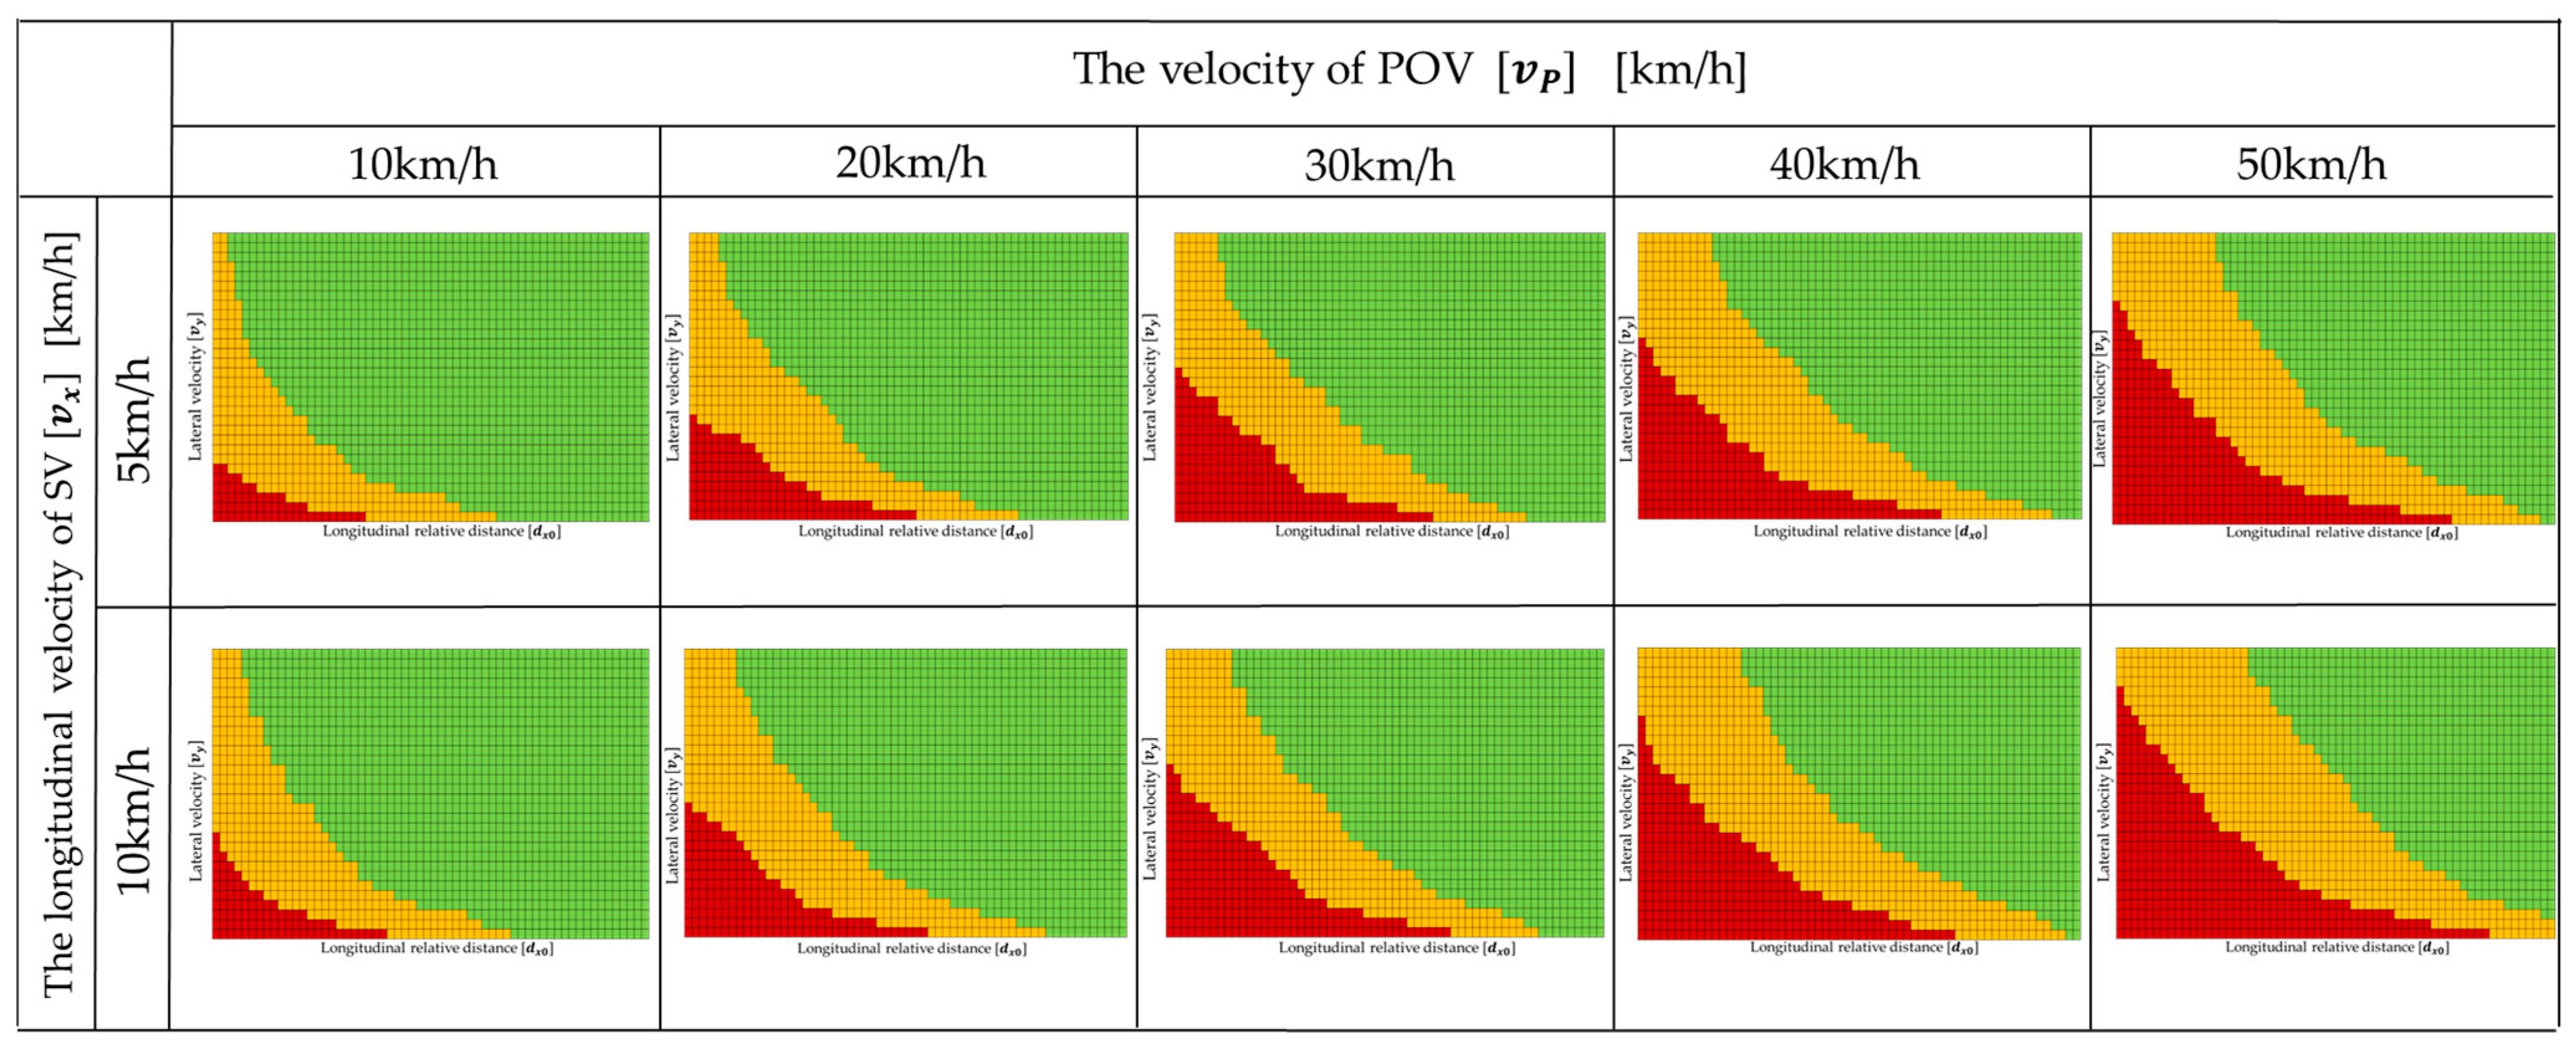
Figure 20 shows the distribution of the safety and collision statuses corresponding to different velocity combinations and relative distances for SVs and POVs.

5. Discussion

Traditional ADAS designs typically reference objective kinematics close to the safety status domain boundary. This paper argues that the design of ADAS should also include the boundaries of the comfort and extreme status domains. The drivers and passengers are less likely to accept ADAS interventions (warning and/or brake/steering control) in the comfort status domain or even in parts of the discomfort status domain. However, they are more willing to accept ADAS interventions when approaching the extreme status domain boundary. All drivers and passengers should receive all interventions when crossing the extreme status domain boundary. When an autonomous vehicle enters the extreme status domain, the vehicle and in-vehicle users have a smaller safety margin and are closer to a collision. Therefore, if an intervention is to be initiated, the in-vehicle users will feel that the intervention is justified.
In contrast, interventions before the vehicle crosses the extreme status domain boundary may be considered as a nuisance or false alarm because drivers and passengers may simply feel uncomfortable and there is no impending unsafe incident. The discomfort may be voluntary if the driver is more incentivized to cross the comfort status domain boundary. Developers can set more reasonable alert and intervention thresholds for ADAS based on comfort and extreme status domain boundaries, thereby reducing the occurrence of nuisance and false alerts.
Moreover, the quantification of the comfort status domain, extreme status domain, and safety status domain boundaries can inform and improve the optimization of unprotected left turn maneuvers of autonomous vehicles. Autonomous vehicles can drive relatively aggressively, sacrificing some of their comforts in order to achieve efficient passage at intersections.

6. Conclusions and Outlook

In this paper, the subjective passenger comfort evaluation results and objective vehicle 3-axis acceleration and jerk data collected in real LTAP/OD scenarios are statistically analyzed and visualized. We discovered that the vehicle lateral acceleration and jerk values corresponding to the comfort status domain boundary of autonomous vehicles are 0.26 g and 0.4 (g/s), respectively. Moreover, the vehicle lateral acceleration and jerk values corresponding to the extreme status domain boundary are 0.41 g and 0.63 (g/s). Secondly, an unprotected left turn kinematic model of vehicles is developed and combined with a skilled driver risk perception and operation model, quantifying the Safe Collision Plots (SCP), i.e., the safety status domain boundary, of conflicting vehicles with different combinations of velocity and relative distance in LTAP/OD scenarios.
The quantification and pictorial expression of each driving status domain boundary extend the concept of the established safety boundary and help autonomous vehicles understand driving behaviors. This can lead to better velocity planning suggestions for unprotected left turn maneuvers of autonomous vehicles in LTAP/OD scenarios. At the same time, it can help developers design more intelligent and refined decision-making and control algorithms to adjust vehicles towards achieving more human-like behavior. It can also inform and improve the design of ADAS and autonomous vehicles’ parameters and driver acceptance, helping to achieve more explicit two-way interaction between in-vehicle users and vehicles, and promoting public trust and acceptance of ADAS and autonomous vehicles.
Autonomous vehicles can also obtain information on the individual characteristics and driving habits of in-vehicle users through various technical means, determine the differences in acceptance of vehicle parameters by different passengers, and adjust the control algorithm in real-time based on the information obtained, which can theoretically realize personalized passenger customization algorithms for autonomous vehicles.

Author Contributions

Conceptualization, X.R. and H.Z.; methodology, X.R.; software, X.R.; validation, X.R., H.Z. and X.W.; formal analysis, X.R.; investigation, X.W.; resources, W.Z.; data curation, X.W.; writing—original draft preparation, X.R.; writing—review and editing, H.Z.; visualization, W.Y.; supervision, H.Z.; project administration, H.Z.; funding acquisition, W.Z. All authors have read and agreed to the published version of the manuscript.

Funding

This research received no external funding.

Data Availability Statement

Not applicable.

Conflicts of Interest

The authors declare no conflict of interest.

References

  1. Campbell, J.L.; Richard, C.M.; Brown, J.L.; McCallum, M. Crash Warning System Interfaces: Human Factors Insights and Lessons Learned; Technical Report DOT HS 810 697; NHTSA: Washington, DC, USA, 2007. [Google Scholar]
  2. McCall, J.C.; Trivedi, M.M. Driver behavior and situation aware brake assistance for intelligent vehicles. Proc. IEEE 2007, 95, 374–387. [Google Scholar] [CrossRef]
  3. Sullivan, J.; Tsimhoni, O.; Bogard, S. Warning Reliability and Driving Performance in Naturalistic Driving; University of Michigan Transportation Research Institute: Ann Arbor, MI, USA, 2007. [Google Scholar]
  4. Hancock, P.A.; Billings, D.R.; Schaefer, K.E.; Chen, J.Y.; De Visser, E.J.; Parasuraman, R. A meta-analysis of factors affecting trust in human-robot interaction. Hum. Factors 2011, 53, 517–527. [Google Scholar] [CrossRef] [PubMed]
  5. Nodine, E.; Lam, A.; Stevens, S.; Razo, M.; Najm, W. Integrated Vehicle-Based Safety Systems (IVBSS) Light Vehicle Field Operational Test Independent Evaluation; National Highway Traffic Safety Administration: Washington, DC, USA, 2011. [Google Scholar]
  6. Nodine, E.; Stevens, S.; Lam, A.; Jackson, C.; Najm, W.G. Independent Evaluation of Light-Vehicle Safety Applications Based on Vehicle-to-Vehicle Communications Used in the 2012–2013 Safety Pilot Model Deployment; National Highway Traffic Safety Administration: Washington, DC, USA, 2015. [Google Scholar]
  7. Yan, X.; Zhang, Y.; Ma, L. The influence of in-vehicle speech warning timing on drivers’ collision avoidance performance at signalized intersections. Transp. Res. Part C Emerg. Technol. 2015, 51, 231–242. [Google Scholar] [CrossRef]
  8. Hafner, M.R.; Cunningham, D.; Caminiti, L.; Del Vecchio, D. Cooperative collision avoidance at intersections: Algorithms and experiments. IEEE Trans. Intell. Transp. Syst. 2013, 14, 1162–1175. [Google Scholar] [CrossRef]
  9. Lytrivis, P.; Thomaidis, G.; Tsogas, M.; Amditis, A. An advanced cooperative path prediction algorithm for safety applications in vehicular networks. IEEE Trans. Intell. Transp. Syst. 2011, 12, 669–679. [Google Scholar] [CrossRef]
  10. Boran, C.; Bostrom, O.; Jacobson, B.J.; Lie, A.; Sander, U. Saving Lives with V2X versus On-Board Sensing Systems-Which will be More Effective?: Technology Leadership Brief. In Proceedings of the SAE Convergence 2012, Detroit, MI, USA, 16–17 October 2012. [Google Scholar]
  11. Summala, H. Towards understanding motivational and emotional factors in driver behaviour: Comfort through satisficing. In Modelling Driver Behaviour in Automotive Environments: Critical Issues in Driver Interactions with Intelligent Transport Systems; Springer Publishing: New York, NY, USA, 2007; pp. 189–207. [Google Scholar]
  12. Vaa, T. Drivers’ information processing, decision-making and the role of emotions: Predictions of the Risk Monitor Model. In Human Modelling in Assisted Transportation: Models, Tools and Risk Methods; Springer Publishing: New York, NY, USA, 2011; pp. 23–32. [Google Scholar]
  13. Bärgman, J.; Smith, K.; Werneke, J. Quantifying drivers’ comfort-zone and dread-zone boundaries in left turn across path/opposite direction (LTAP/OD) scenarios. Transp. Res. Part F Traffic Psychol. Behav. 2015, 35, 170–184. [Google Scholar] [CrossRef] [Green Version]
  14. Junghans, M.; Krauns, F.; Sonka, A.; Böhm, M.; Dotzauer, M. Comparison of safety and kinematic patterns of automated vehicles turning left in interaction with oncoming manually driven vehicles. Trans. Transp. Sci. 2021, 2, 1–12. [Google Scholar] [CrossRef]
  15. Meng, L.; Wang, Y. Tool Development and Quantitative Analysis for Naturalistic Left Turn Across Path/Opposite Direction (LTAP/OD) Driving Scenarios. Master’s Thesis, Chalmers University of Technology, Göteborg, Sweden, 2016. [Google Scholar]
  16. UNECE. Proposal for the 01 Series of Amendments to UN Regulation No. 157 (Automated Lane Keeping Systems); UNECE: Geneva, Switzerland, 2022; p. 100. [Google Scholar]
  17. SAE International. Taxonomy and Definitions for Terms Related to Driving Automation Systems for On-Road Motor Vehicles J3016_202104. Available online: https://www.sae.org/standards/content/j3016_202104/ (accessed on 16 May 2023).
  18. Qin, Y.; Xue, Y.; Xing, Z.-Y.; Wang, Y.-H. Study on Ride Comfort Indices Correlation Analysis Based on BP Neural Network. In ICTIS 2011: Multimodal Approach to Sustained Transportation System Development: Information, Technology, Implementation; American Society of Civil Engineers: Reston, VA, USA, 2011; pp. 2283–2289. [Google Scholar]
  19. Tesla. Safety Score Beta. Available online: https://www.tesla.com/support/safety-score#version-2.0 (accessed on 10 May 2023).
  20. Nobukawa, K. A Model Based Approach to the Analysis of Intersection Conflicts and Collision Avoidance Systems; University of Michigan: Ann Arbor, MI, USA, 2011. [Google Scholar]
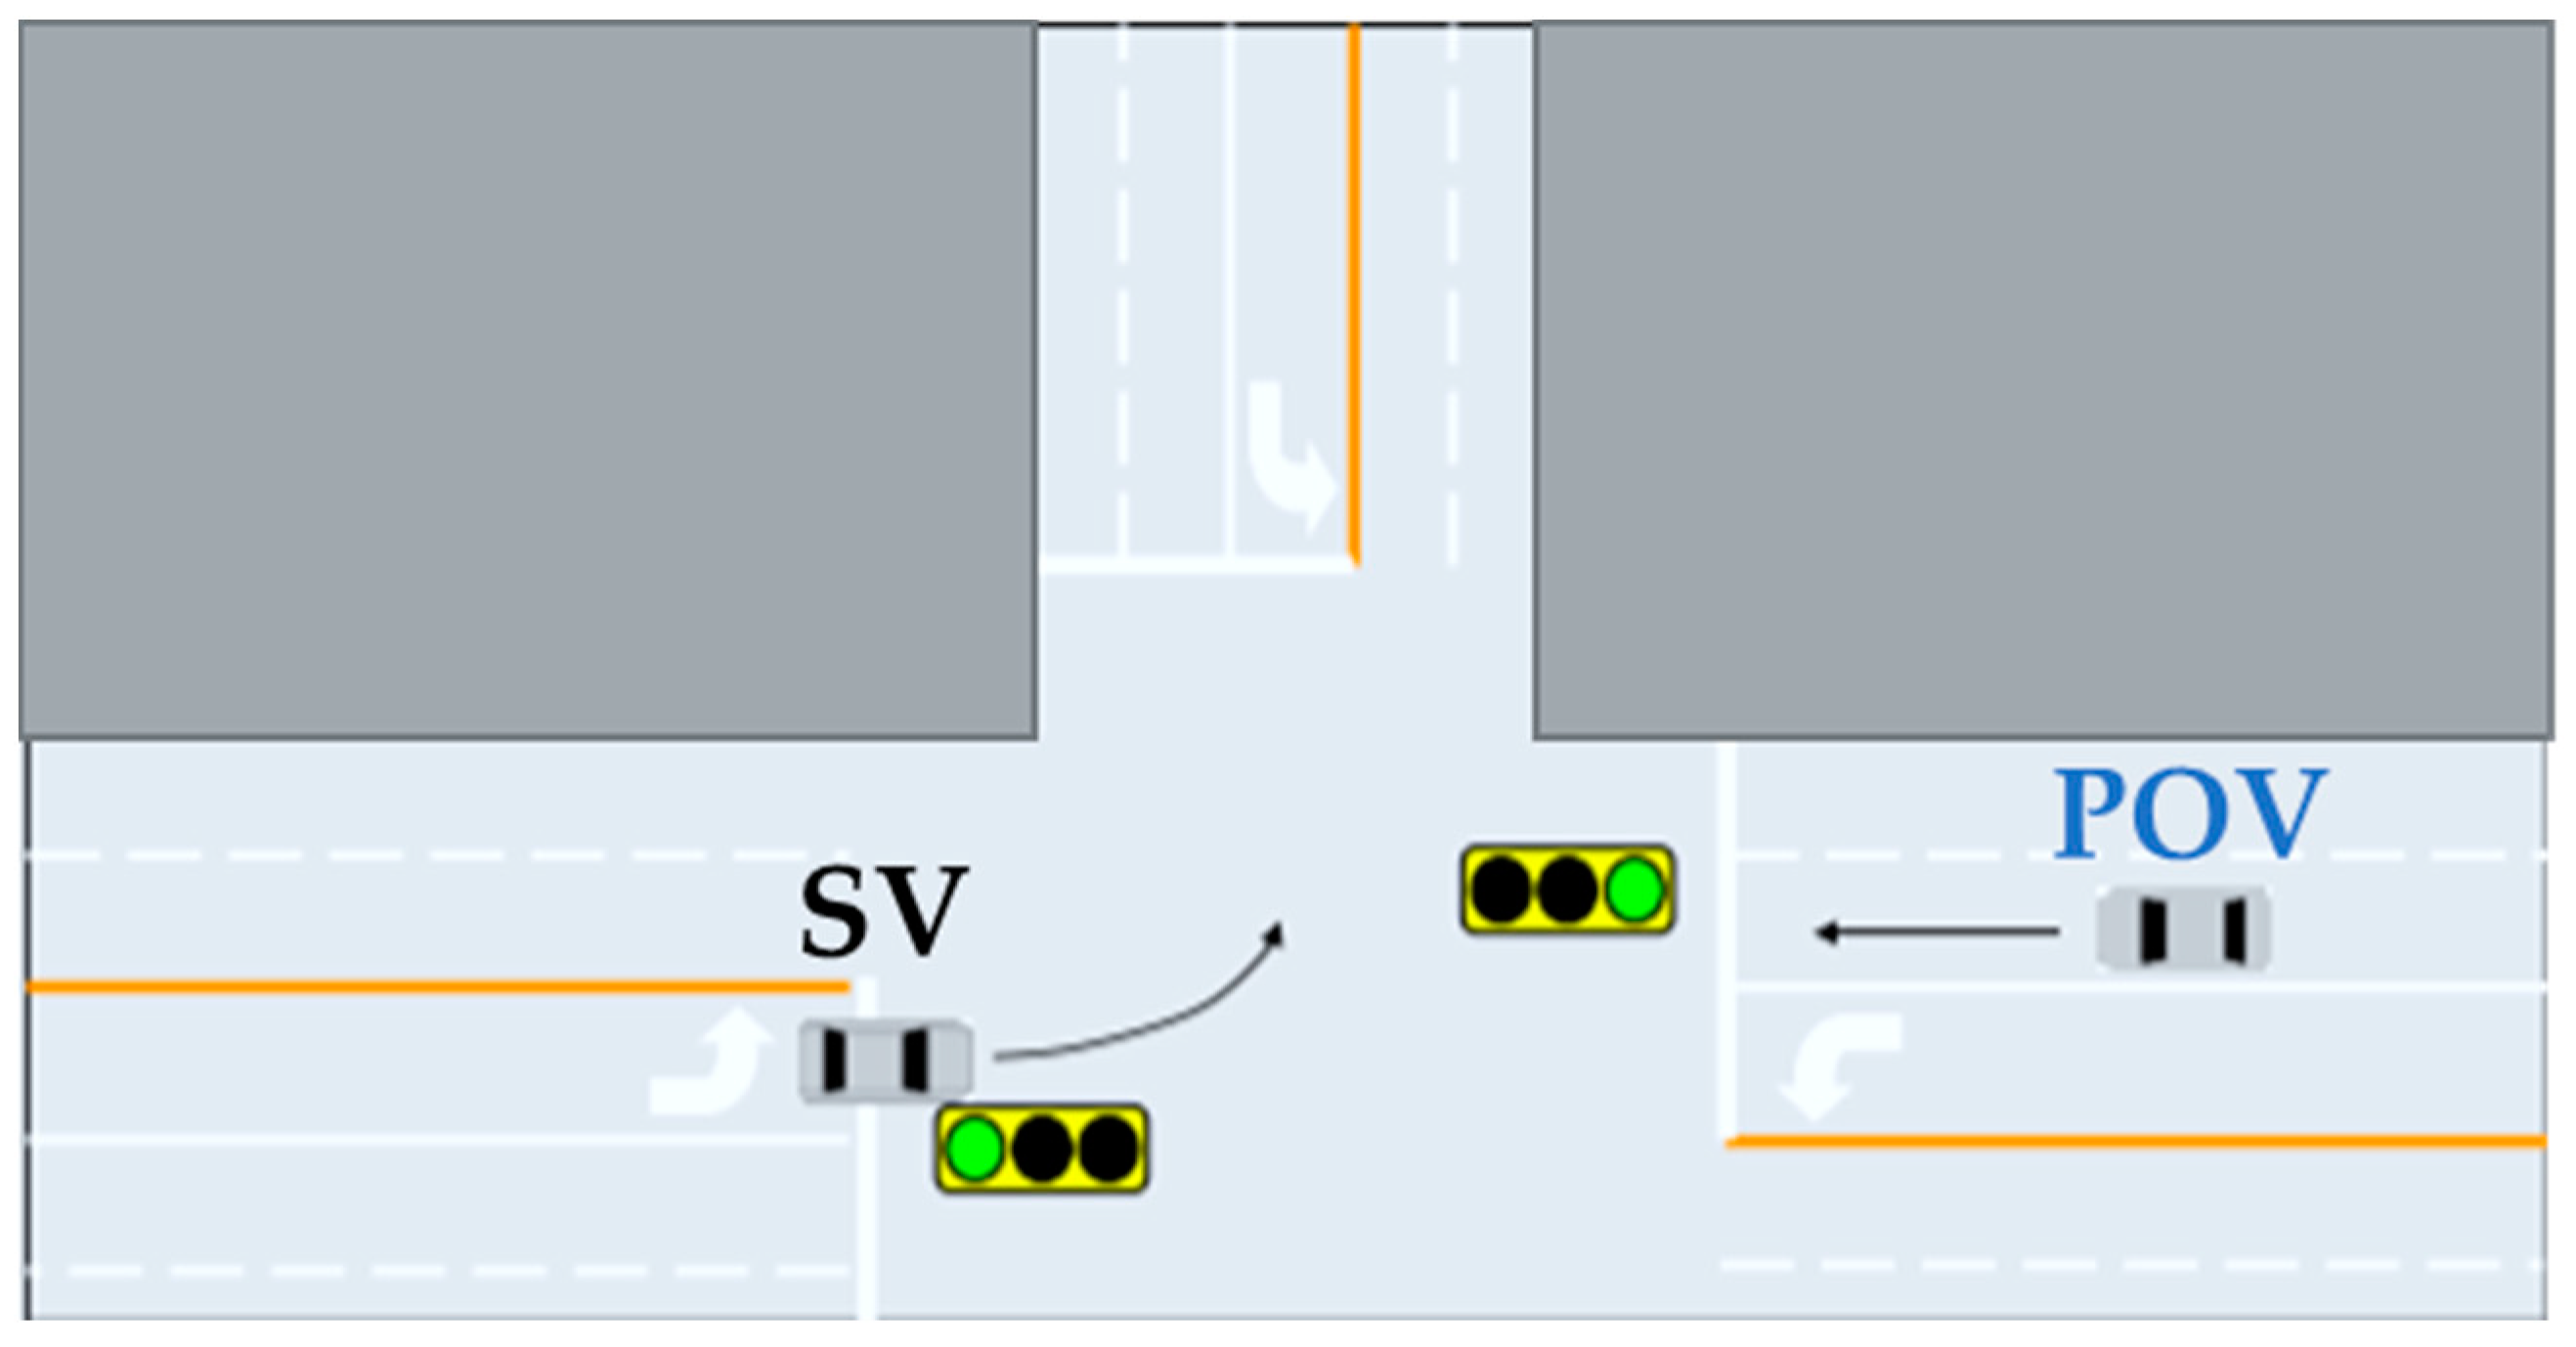
Figure 1. Schematic diagram of LTAP/OD scenario.
Wevj 14 00187 g001
Figure 2. Schematic diagram of each status domain and boundary.
Wevj 14 00187 g002
Figure 3. Experimental vehicle exterior view and vehicle coordinate system.
Wevj 14 00187 g003
Figure 4. Experimental data acquisition and processing process. The gray lines are the raw data, and the red line is the result of filtering.
Wevj 14 00187 g004
Figure 5. Schematic diagram of the experimental route. The red lines and arrows indicate the route and direction we traveled during the experimental.
Wevj 14 00187 g005
Figure 6. Acceleration data of the vehicle in the X-axis direction. The gray lines are the raw data, and the red line is the result of filtering.
Wevj 14 00187 g006
Figure 7. Acceleration data of the vehicle in the Y-axis direction. The gray lines are the raw data, and the red line is the result of filtering.
Wevj 14 00187 g007
Figure 8. Acceleration data of the vehicle in the Z-axis direction. The gray lines are the raw data, and the red line is the result of filtering.
Wevj 14 00187 g008
Figure 9. Frequency statistics chart of vehicle lateral acceleration data.
Wevj 14 00187 g009
Figure 10. Frequency statistics chart of vehicle lateral jerk data.
Wevj 14 00187 g010
Figure 11. Visualization of scatter plots of vehicle lateral acceleration and passenger comfort scores and comfort status domain boundaries.
Wevj 14 00187 g011
Figure 12. Visualization of scatter plots of vehicle lateral jerk and passenger comfort scores and comfort status domain boundaries.
Wevj 14 00187 g012
Figure 13. Visualization of scatter plots of vehicle lateral acceleration and passenger comfort scores and extreme status domain boundaries.
Wevj 14 00187 g013
Figure 14. Visualization of scatter plots of vehicle lateral jerk and passenger comfort scores and extreme status domain boundaries.
Wevj 14 00187 g014
Figure 15. Illustration of the two moments in time used in the calculation of PET when one vehicle turns left (the black vehicle, SV, its trajectory is shown by the red dashed line) in front of an oncoming vehicle (the blue vehicle, POV, its trajectory is shown by the blue dashed line) with the right-of-way. The red rhombus is the encroachment zone. PET = t2 − t1 [20].
Wevj 14 00187 g015
Figure 16. Vehicle kinematic model and related parameters. The blue rectangle represents the left-turning vehicle (SV), and the orange rectangle represents the vehicle going straight (POV).
Wevj 14 00187 g016
Figure 17. Analysis of main conflict points. (a) represents the SV crossing the intersection before the POV; (b) represents the SV crossing the intersection after the POV.
Wevj 14 00187 g017
Figure 18. A competent and careful human driver model.
Wevj 14 00187 g018
Figure 19. Safe Collision Plots (SCP).
Wevj 14 00187 g019
Figure 20. Safe Collision Plots (SCP) for different velocity combinations of SV and POV and relative distance. Green represents the safe area, yellow represents the collision situation shown in Figure 17a, and red represents the collision situation shown in Figure 17b.
Wevj 14 00187 g020
Table 1. Main relevant parameters of the experimental vehicle.
Name of the ParameterSpecification of the Parameter
Length/width/height (mm)4556 ∗ 1855 ∗ 1719
Wheelbase (mm)2700
Curb Weight (kg)1690
Maximum Torque (Nm)250
Maximum Power (Kw)124
Steering SystemElectric Power Steering (EPS)
Suspension SystemFront: McPherson Independent Suspension
Rear: Multi-link Beam Independent Suspension
Table 2. Comfort rating table of test passengers.
UncomfortableComfortable
12345678910
Disclaimer/Publisher’s Note: The statements, opinions and data contained in all publications are solely those of the individual author(s) and contributor(s) and not of MDPI and/or the editor(s). MDPI and/or the editor(s) disclaim responsibility for any injury to people or property resulting from any ideas, methods, instructions or products referred to in the content.