1. Introduction
With the increasing concerns about the fossil energy crisis, environmental pollution, and global warming, there is an urgent demand for the development of green energy. As an essential branch of global green energy development, electric vehicles (EVs) are being widely researched. The motivation to purchase EVs has been transferred from a policy-led to a market-led approach in many countries [
1,
2,
3]. As the key part of the powertrain of EVs, electrical machines (EMs) play a crucial role in an EV’s driving performance. At present, most electric-drive machines are integrated with gearings and differentials into the electric axles (EAs), which are laid out between the front wheels or rear wheels and are known as the central drive unit [
4]. The vehicle space between wheels can be used to design EMs with relatively long axial lengths. Due to the retention of the differentials, it is easy to drive the vehicle.
As an alternative solution to making EVs drive, in-wheel motors (IWMs) are laid out inside the wheel hub and can be called distributed drive units. The most important feature is that the IWMs, gearing, and brakes are all integrated into the wheel hub. There is no need for a clutch, differential, or half shaft. Therefore, IWMs allow for a high degree of design flexibility in these vehicles and save more room for passengers and batteries. Moreover, independently controlled wheels make some advanced driving strategies possible [
5,
6,
7]. Compared with a central drive unit, IWMs face some challenges. The operating environment is harsh because the heat from the brakes leads to high ambient temperature, and the compact structure makes heat dissipation difficult. To keep IWMs from overheating under normal operating conditions, it is great of importance to design an effective cooling system.
The current cooling systems for electric vehicles are very diverse and complex. In [
8], these systems are grouped into 15 types according to the different cooling measures for the stator and rotor. In general, they can be classified into water cooling and oil cooling based on the coolant properties or classified into direct cooling and indirect cooling based on the way the coolant acts on the end windings. For the end windings, the main heat dissipation path is from the slot winding to the stator core, water jacket, and the coolant. However, on this path, there is thermal resistance contributed by slot insulation and the air between the slot windings and stator core, as well as the contact thermal resistance between the stator core and cooling jacket. The actual temperature gradient is large, and the temperature of the end windings is generally much higher than the coolant. To improve the heat dissipation of the end windings and reduce the temperature gradient, direct oil cooling is proposed for automotive traction EMs [
9,
10]. This direct cooling methodology is usually divided into two types, oil-submerge-cooled and oil-spray-cooled, as shown in
Figure 1a,b. The oil-submerge cooled system cools the EM through the paths in the stator core and end windings. A stator sleeve is usually necessary to keep the oil flow from the rotor. An oil-spray-cooled system is a more common method for stator cooling because it has smaller flow resistance and more flexible oil spray paths. Unlike the EMs applied in the central drive units with a wide variety of cooling methods, IWMs mainly focus on air cooling [
11] and water or oil channel design in the cooling jacket [
12,
13,
14]. However, compared with the EMs in EAs, IWMs have a flatter structure as well as smaller surface area, which is theoretically proportional to the heat dissipation capacity when using a cooling jacket.
The objective of this paper is to design an oil-spray-cooled system for IWMs through only four pipes and use an effective method to analyze the temperature field.
Figure 1c shows a diagram of the cooling system. The oil flows through four pipes and sprays from the nozzles to the stator carrier and drips freely to the end windings and rotor ends. The short axial length makes it more likely that no additional rotor cooling system is required. Directly calculating the temperature field of the oil-spray-cooled system is a one-way procedure just considering the material parameters, structure geometries, boundary conditions, and heat sources. In fact, the temperature variations will cause changes in the fluid in the convective heat-transferring coefficient (HTC). And, for the cooling systems with oil spraying and dripping, the heat transfer effect depends on the location and shape of the oil fluid interface inside the motor. Therefore, the fluid field needs to be calculated in advance to obtain an accurate fluid distribution. In this paper, the interaction and interfacial behavior between oil and air are analyzed by means of a volume-of-fluid (VOF) model [
15]. Considering that the thermal inertial of oil fluid is much smaller than motor solid, the mixed timescale method is applied to derive the converged temperature field [
16]. Finally, a prototype of the proposed IWM is fabricated for testing and verification.
2. Oil Cooling Design
Due to the compact structure limitation, the IWM is designed with a combination of 24-pole and 36-slot, which leads to a 1-slot coil pitch and a so-called concentrated winding configuration. The outer diameter of stator and rotor and the axial length are 270 mm, 214 mm, and 45 mm, respectively. The stator and rotor core are stacked with steel laminations with a 0.3 mm thickness. The rotor consists of 48 rare-earth magnets, all of which have the NdFeB-48UH grade. Each pair of magnets is laid out in a V-shape to provide more flux and reluctance torque than the layout with surface-mounted magnets. The designed maximum continuous torque is 130 Nm, which can be outputted up to 1000 rpm. The corresponding rated power is 54.5 kW as the sum of four wheels. Based on the volume of active parts of the stator and rotor, the rated torque density is 50.5 kNm/m3.
The short axial distance between end windings makes it possible to place several oil pipes with some nozzles to cross over the stator carrier. Then, the oil can spray from the nozzles to the stator carrier. For the end windings, the oil will drip down to them if the oil flow rate is sufficient. By referring to the standard in [
17], the churning loss due to the oil dripping to the rotor ends is analytically proportional to the 3rd power of the rotor speed and 4.7th power of the rotor diameter. The axial length influence can be neglected because the oil only drips to the ends. The maximum speed of the IWM is 3600 rpm, much lower than that of the EA’s motor, which usually reaches 15,000 rpm. The churning loss is only about 6% of an EA’s motor, with a rotor diameter 156 mm.
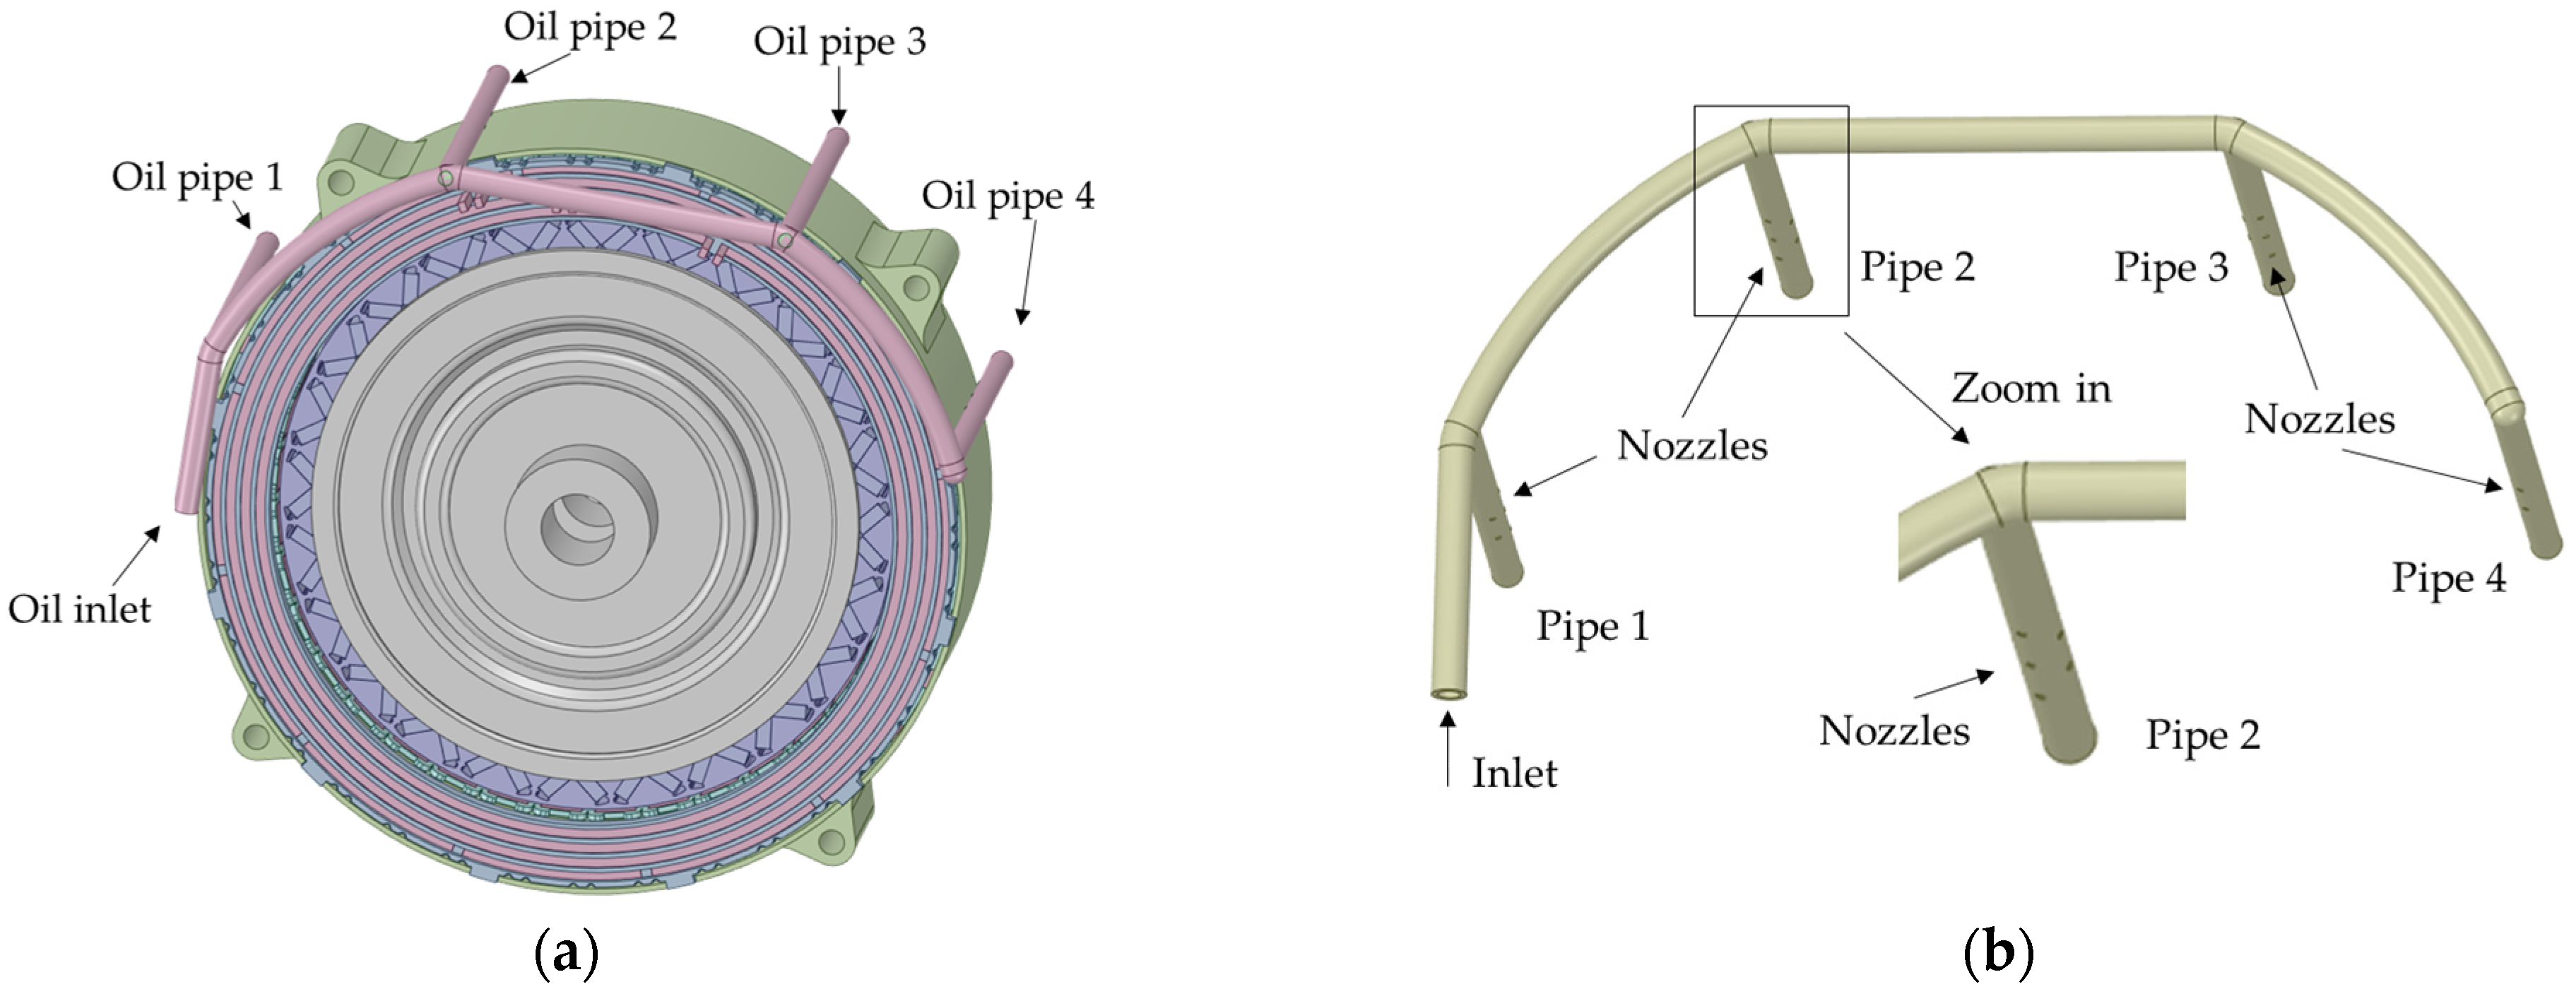
Figure 2a is a CAD design drawing of the proposed IWM with four oil pipes. These pipes are distributed evenly with a certain curvature to keep both cylindrical surfaces of the IWM dripped when the tires are titled slightly.
Figure 2b shows all four oil pipes with five drilled nozzles in each pipe. It is noted that the oil flow rate is not constant from the nozzles if the nozzle diameter is the same. To make the total flow rate of pipe 1 and pipe 2 basically equal to pipe 3 and pipe 4, a virtual design of experiments (DOEs) method is used to optimize the nozzle diameters in each pipe.
Table 1 lists the optimized result. As seen from the row of oil flow rate, the sum of pipe 1 and pipe 2 is 2.999 L/min, and the sum of pipe 3 and pipe 4 is 3.001 L/min.
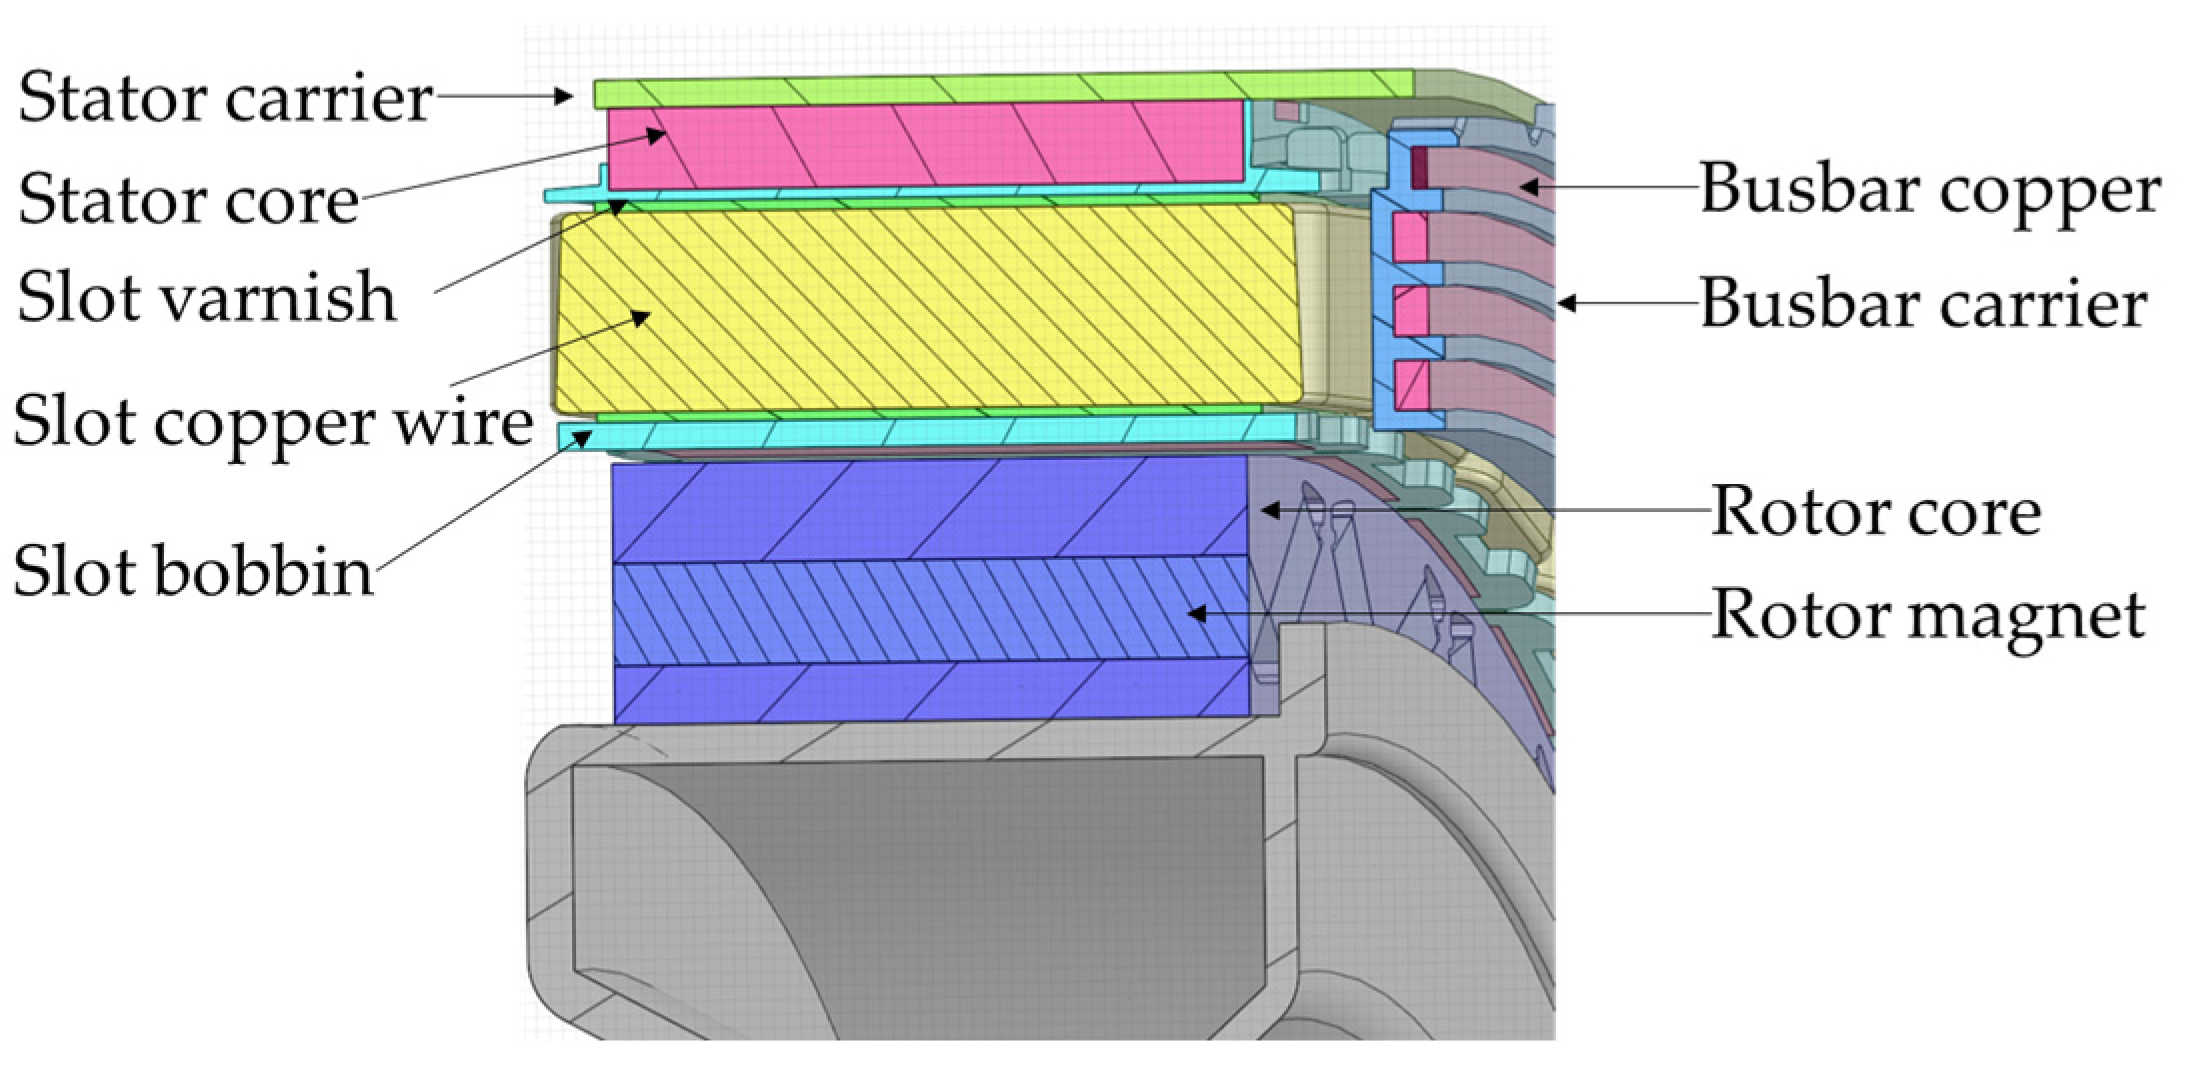
Figure 3 shows a cross-section of this IWM, where the busbar is held in place by a busbar carrier. For cooling systems using a cooling jacket, the busbar often becomes overheated and then fails due to it being a greater distance from the coolant than the end windings. In this oil-spray-cooled system, the thermal behavior of the busbar is greatly improved. The oil-spray-cooled concept for IWMs described in this paper even allows the busbar to be partially dripped when the oil flows along the stator carrier to the end windings.
Table 2 shows the materials, thermal conductivity, specific heat capacity, and density of each part. The winding wraps contain the round wires, air, and varnish, so that the density is an equivalent value obtained by considering wire diameter, coating thickness, and gaps among round wires. For those parts with three thermal conductivities, it means the material is anisotropic along the circumferential, radial, and axial directions, in order. The stator and rotor cores consist of many steel laminations. Therefore, they are isotropic in the axial cross-sectional plane but have lower thermal conductivity along the axial direction due to the insulating coating and the air present between the laminations. The copper windings consist of many round wires. They are laid out from the slot’s opening along the outward radial direction to the slot’s bottom. This makes the wires denser and provides a slightly better heat transfer capability along the radial direction than the circumferential direction. Empirical values of 2 W/m·k and 5.5 W/m·k are employed.
3. Analysis Method
3.1. Governing Equations
The N-S equations describing the heat conduction between the various solid parts of the motor and the convective heat exchange between the fluid and the solid mainly consist of the continuity equation, the momentum equation, and the energy equation, whose differential forms in the 3D Cartesian coordinate system are as follows:
In (1)–(3), t represents time; is the density of the fluid; is the velocity vector; , , and are the velocity components in the , , and directions, respectively; is the dynamic viscosity of the fluid; is the pressure; is the specific heat capacity; and is the generalized source term.
The heat transfer between solids, such as windings and insulation, only requires the solution to Equation (3), whereas the complete flow information of the oil is obtained by solving all three equations in conjunction with the effect of the flow state on the heat dissipation of the motor, which is generally turbulent.
In this paper, the two-equation
-
eddy viscosity model [
18] is used to determine the turbulent viscosity
to solve the fluid flow field, with which the corresponding transport equation in tensor form is:
where
and
take values in the range (1,2,3);
is the generation term of turbulent energy
due to the mean velocity gradient;
is the generation term of turbulent energy
due to buoyancy;
represents the contribution of pulsation expansion in compressible turbulence;
,
, and
are empirical constants;
and
are the Prandtl numbers corresponding to turbulent energy
and dissipation rate
, respectively; and
and
are the source terms.
3.2. Two-Phase Model
VOF models are widely used in solving two-phase problems, which is a method of tracking the location and motion of a free surface between two or more immiscible fluids in a fixed Eulerian reference system using the mass conservation equation:
where
αq is the volume fraction of
q phase;
Sq is the mass source for
q phase;
mqp is the mass transferred from phase
q to phase
p; and
mpq is the mass transferred from phase
p to phase
q. As for this oil-cooled e-motor, the
q and
p phases are defined as oil and air, respectively, and the mass-transferred term is ignored. The implicit method is used to solve the upper equations with a high-accuracy interface-tracking scheme, which is compressive in Fluent. Based on the variable
αq, the free surface of the volume fraction of fluid at different times is constructed and tracked. If
αq = 1, the computation cell is fully occupied by the q phase. If
αq = 0, the cell is occupied by the
p phase. If 0 <
αq < 1, the cell consists of two phases, and there is an interface. For each cell, the sum of the volume fraction is equal to one unit.
3.3. Fluid–Solid Thermal Coupling
The thermal inertia of the solid parts of the motor is much greater than that of the oil coolant. The solid temperature field takes more than 20 min to reach a thermal equilibrium state, whereas the oil temperature field reaches a thermal equilibrium state in only dozens of seconds. Based on this big deviation in timescales, the mixed timescale method is employed to solve for the temperature field, rather than solving the fluid and solid temperature fields together [
19]. Specifically, this method uses different solvers for the fluid and solid domain calculation, then couples them by exchanging the information of all the conjugate surfaces.
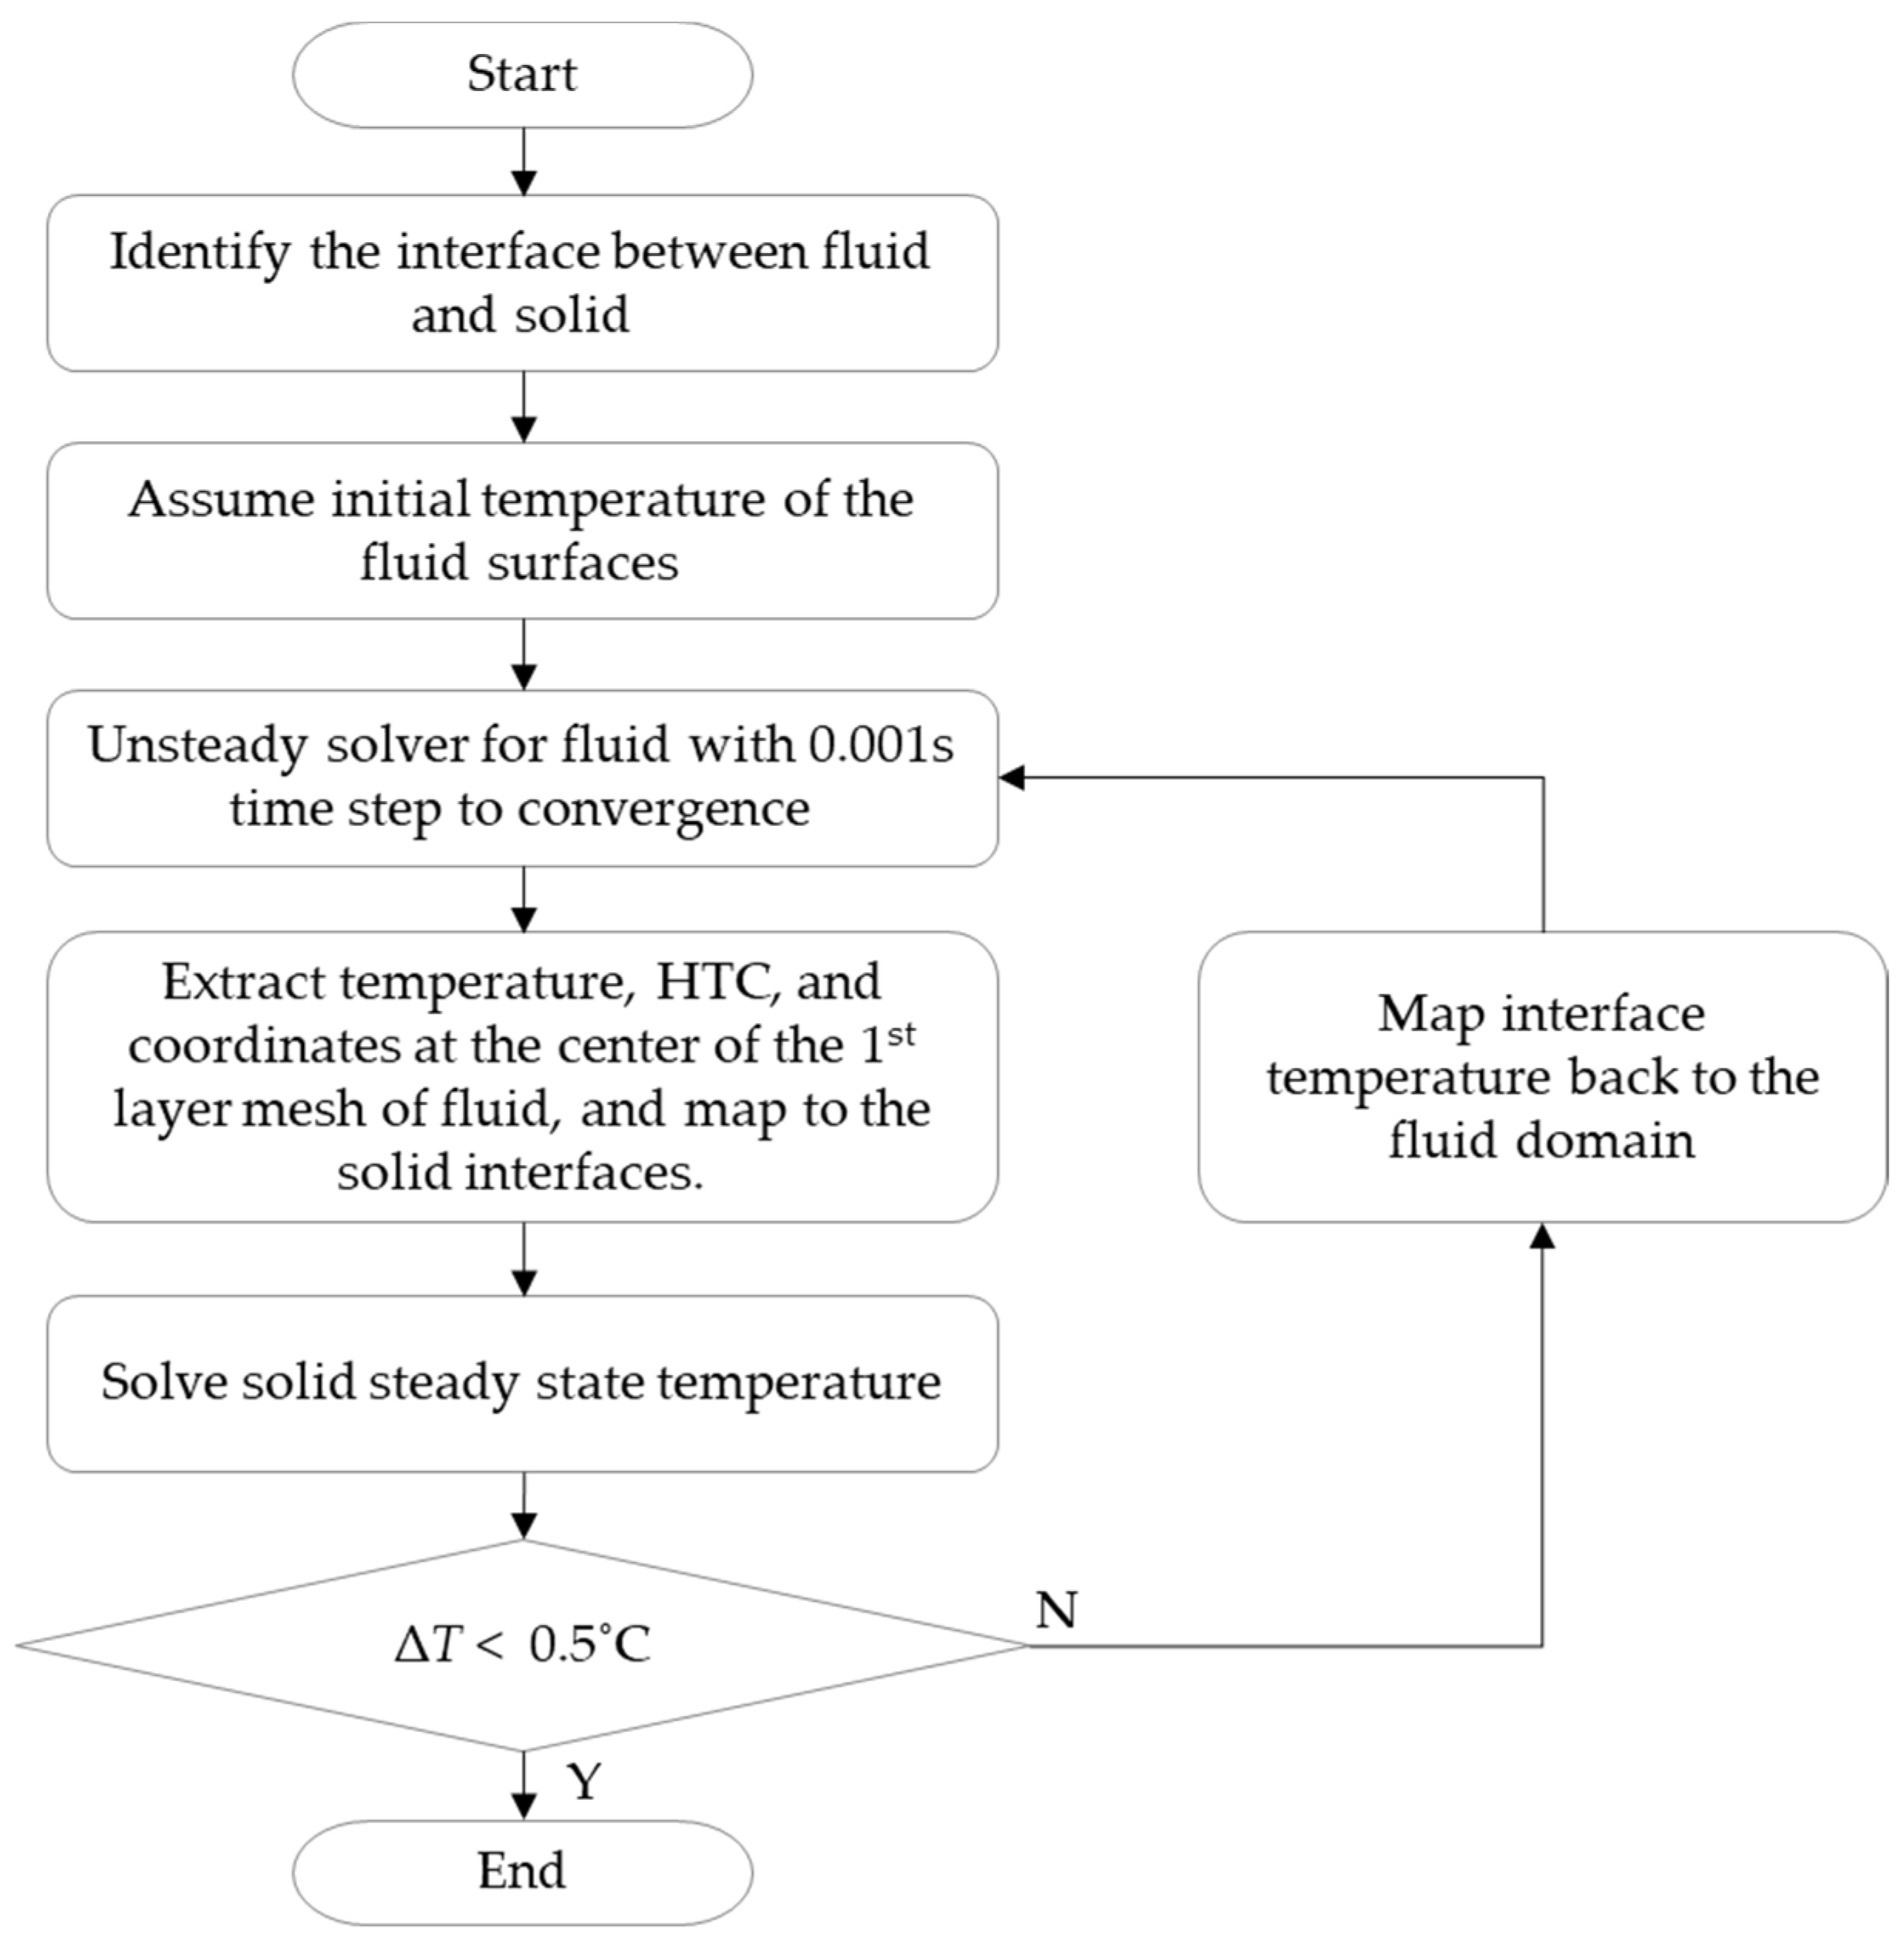
Figure 4 shows the flowchart of the simulations.
The detailed procedures for processing the simulations of fluid and thermal problems in the EMs are described as follows.
- (1)
Separate the solid parts of the motor from the fluid domain and identify the interfaces between the fluid and the solid.
- (2)
Assume a suitable initial temperature, e.g., 80 °C, on all surfaces of the fluid in contact with the solid parts.
- (3)
Use the unsteady solver to simulate the two-phase fluid domain consisting of air and oil as a VOF model in a time step 0.001 s and monitor the velocity, pressure, and temperatures at multiple locations. The flow field is considered to converge when the inlet and outlet flows in the oil circuit system reach equilibrium and when the physical quantities at multiple spatial locations remain essentially constant.
- (4)
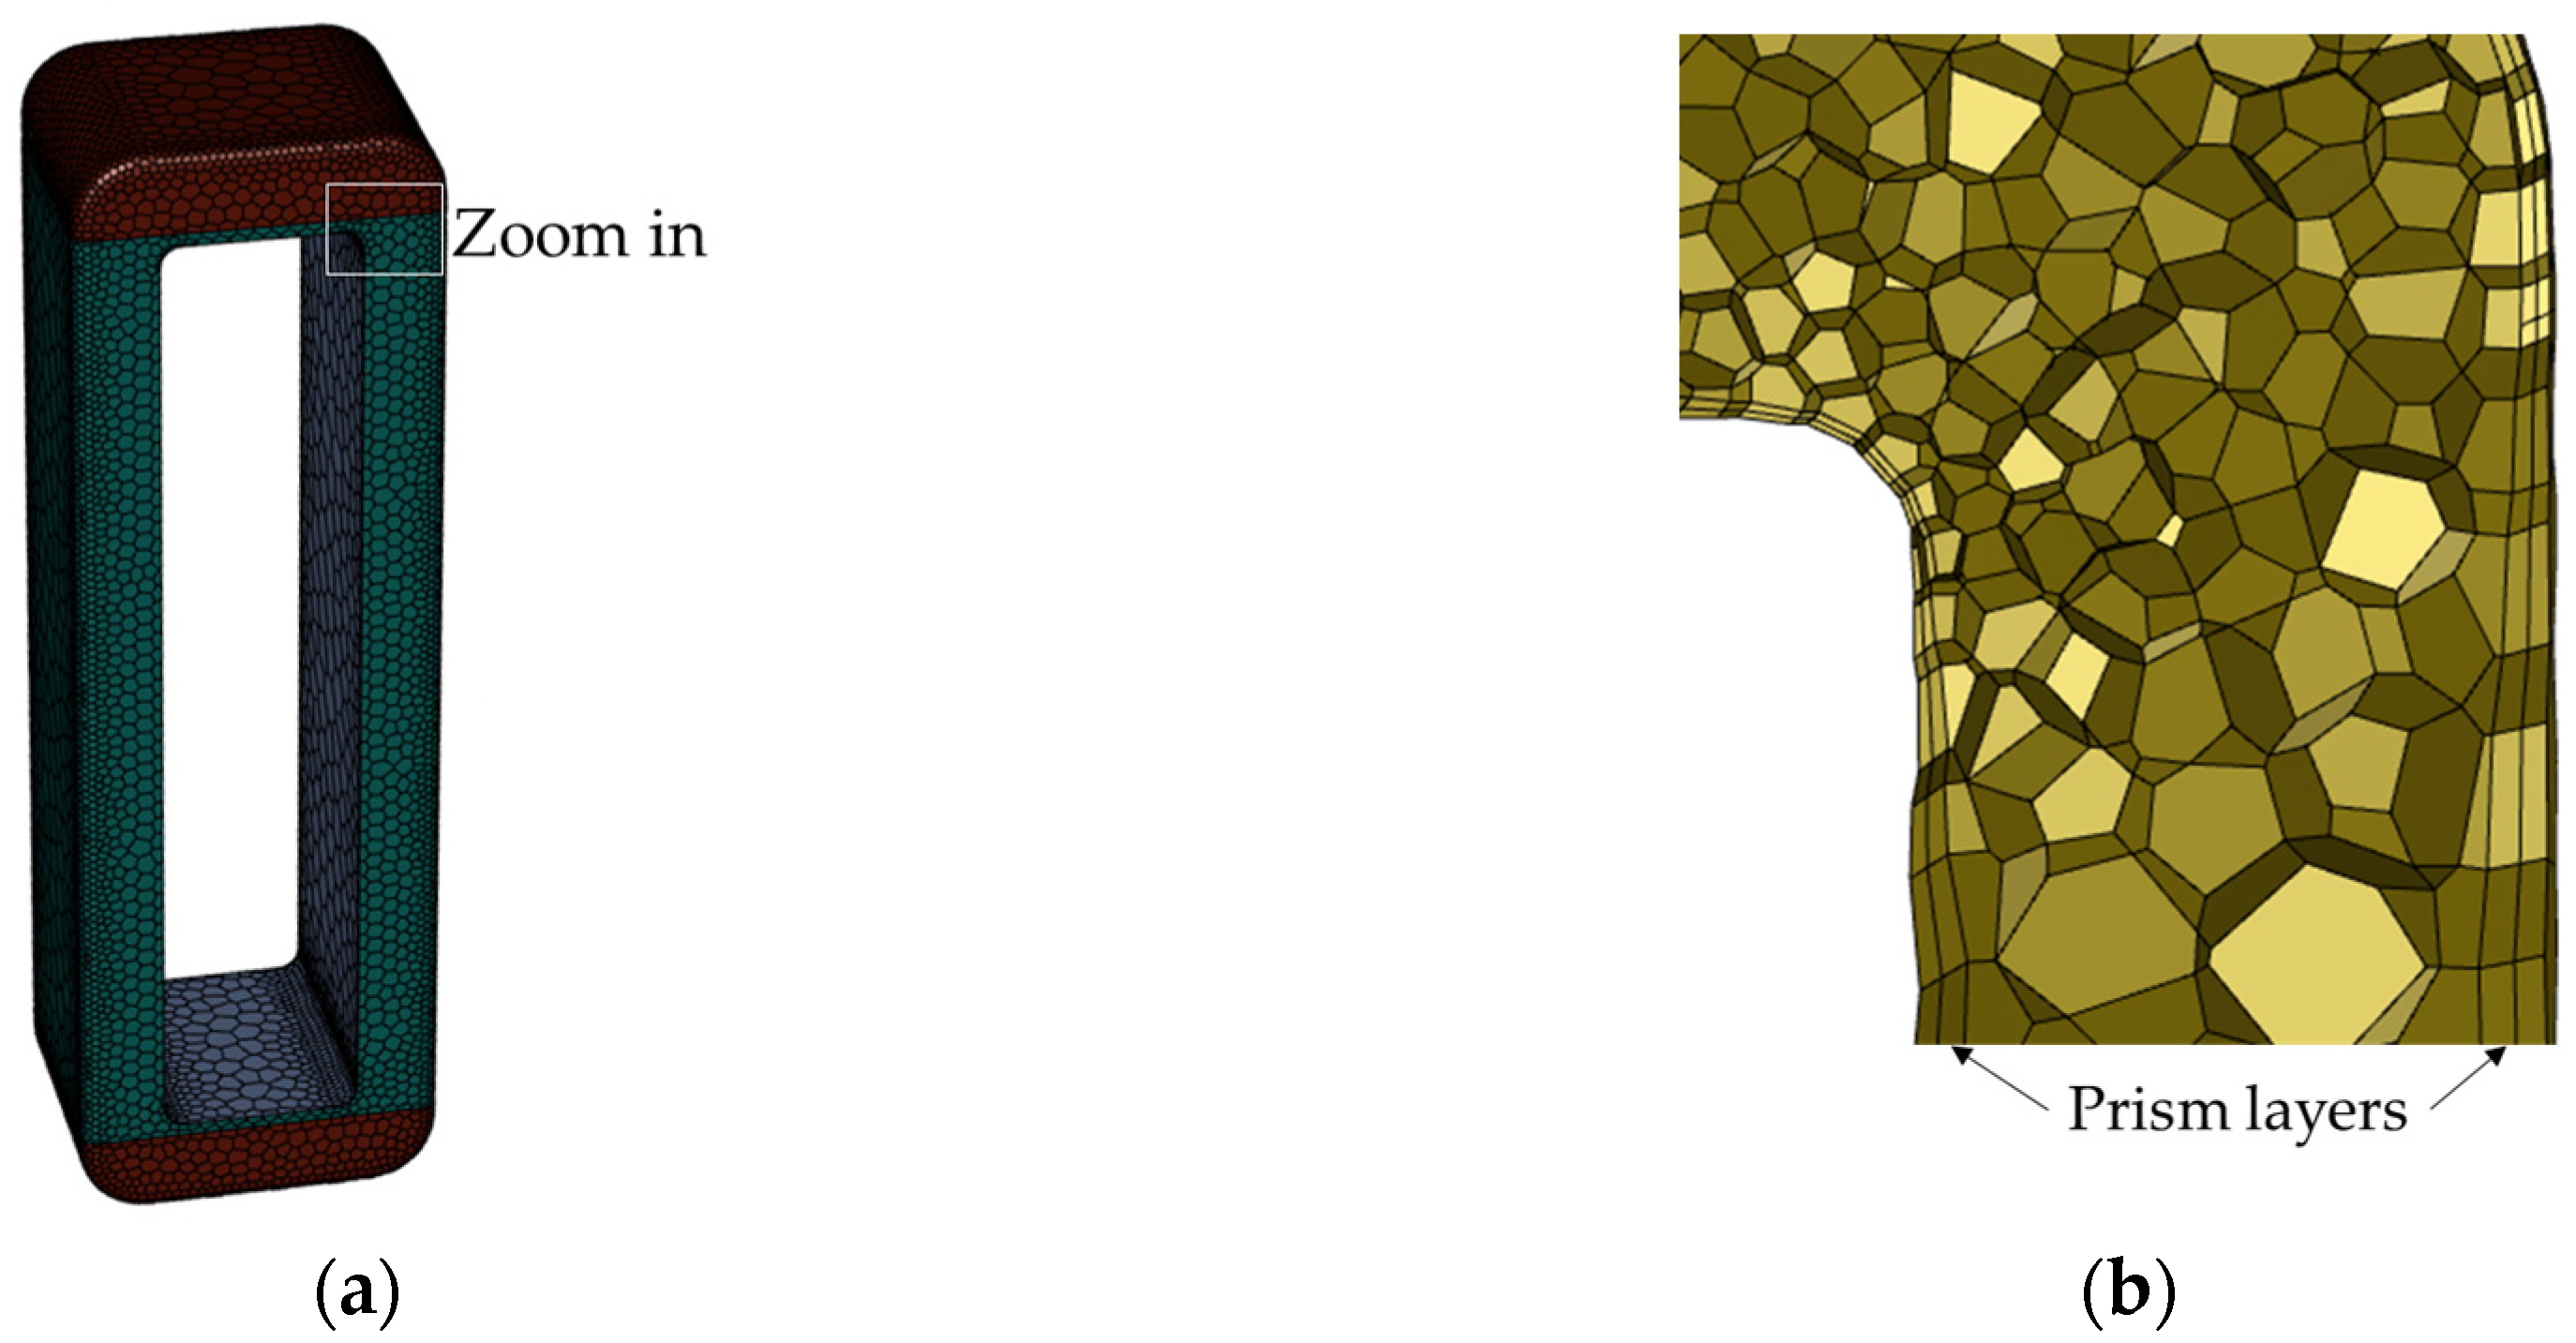
Extract the temperatures, 3D coordinates, and convective HTC at the center of the first boundary layer mesh of the fluid, which can be seen from
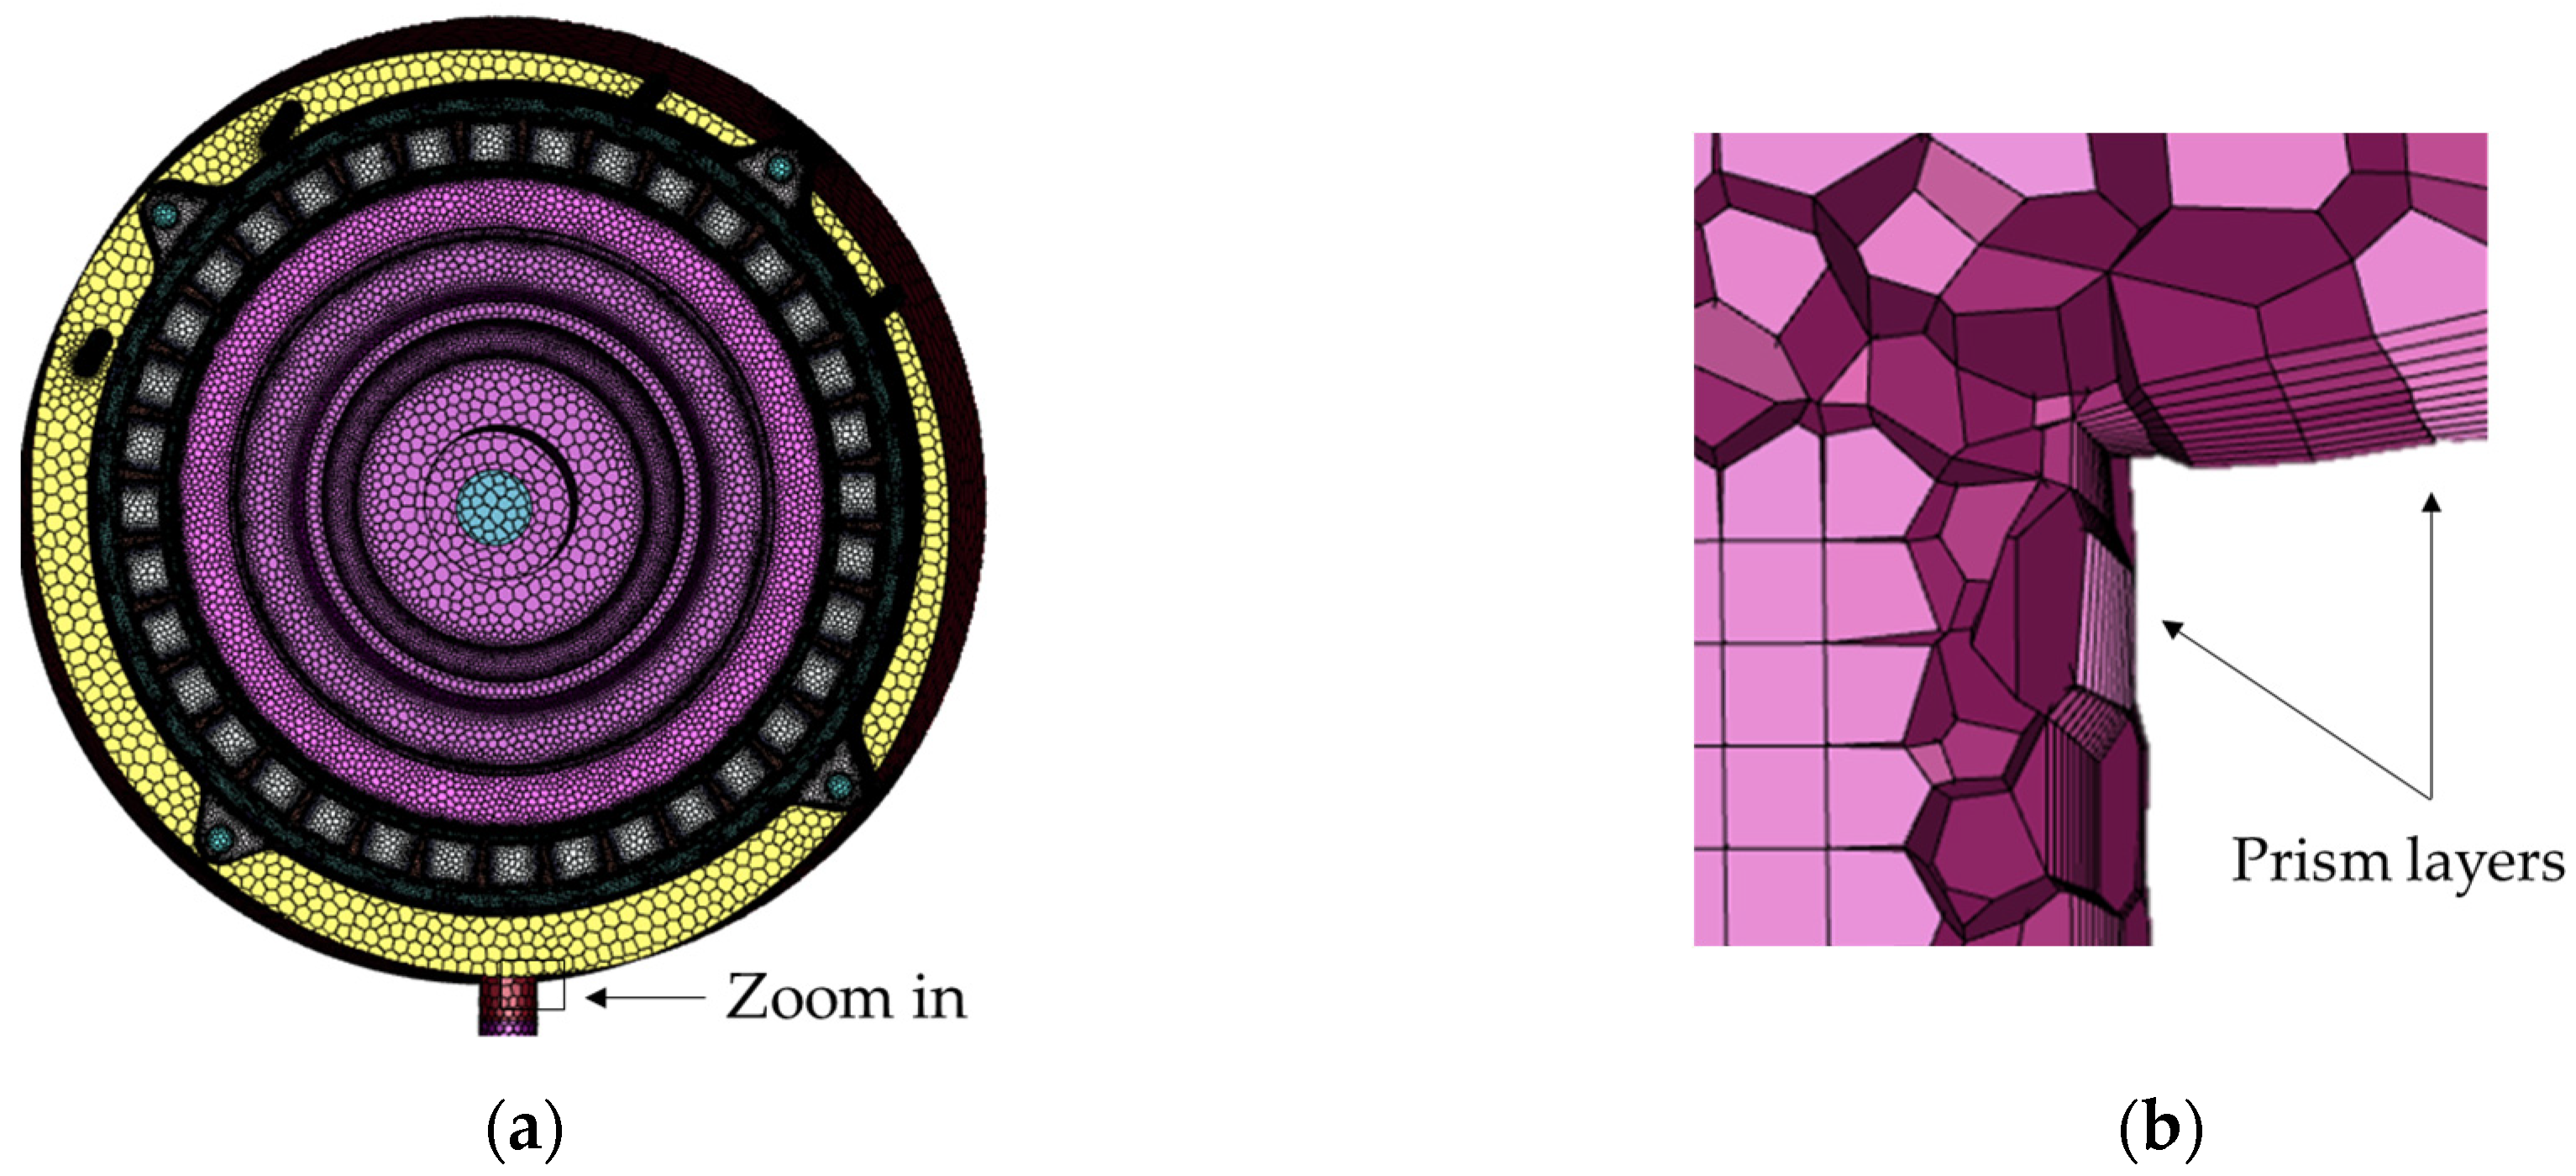
Figure 5b, and then map them in the form of a field to all solid surfaces intersecting the fluid.
- (5)
Perform the steady-state solution for the solid heat transfer simulation until convergence, then map the results for the temperature fields on all the solid surfaces in contact with fluid back to the ΔT in the solid that is less than 0.5 °C. Then, the temperature field of the fluid and solid is obtained for the given operating point.
3.4. Meshing for Fluid and Solid
The 3D geometry of the IWM is modeled using the America CAD design software Creo 7.0. After importing the model into the general computational fluid dynamics (CFD) software, Ansys Fluent, the fluid domain is discretized using the Fluent-meshing tool. The total number of polyhedral meshes is about 30 million.
Figure 5a shows an overview of the fluid mesh. Finer cells with a surface size of 0.1 mm are applied in regions of obviously expected oil flow and coarser mesh in other regions. To capture the oil film on the surfaces of the stator carrier and copper wires, the surface cell sizes are further refined. To improve the accuracy of the turbulence and heat transfer solution, a 10-layer prismatic mesh was profiled along the boundaries, as shown in
Figure 5b.
The mesh of the solid’s domain consists of polyhedral and hexahedral elements and includes the regions shown in
Figure 3. The solids are connected to each other by 32 interfaces, in which 8 face groups are created in contact with fluid domains for temperature field and convective heat transfer mapping. The distributed winding in the slot is not created separately but by a bulk region to equate the copper wire and the insulating varnish, as shown in
Figure 6a. To improve the simulation accuracy, the surface of the equivalent winding is arranged with three prismatic thermal boundary layers, as shown in
Figure 6b. To improve the accuracy of the heat transfer calculation of the air gap, the mesh in the radial direction of the air gap is divided into 10 layers.
3.5. Losses and Boundaries
Compared with EMs applied in the central units, the copper loss makes more contributions than the iron loss in most operating conditions due to the relatively low speed. Cooling systems only using a cooling jacket make the heat dissipation of the end windings and rotor difficult. For the proposed cooling system, the heat dissipation is much improved because both end windings and rotor ends can be directly cooled by the dropped oil. Due to the shorter axial length than EAs’ motor, the overheat risk in the axial middle position is also reduced. All losses, including the windage loss and bearing loss, are mapped to the corresponding motor parts. The values of these losses are shown in
Table 3. They are related to the rated point of 130 Nm at 1000 rpm.
The temperature boundary inside the IWM rotor is set to 110 °C by considering the heat impact from the brake, and the ambient temperature is 80 °C. The inlet oil temperature is 80 °C, and the flow rate is 6 L/min, with a viscosity, density, and specific heat capacity of 4.43 × 10⁻³ kg/(m·s), 852 kg/m3, and 2360 J/(kg·K), respectively.
4. Analysis Results
Initially, the fluid domain is full of air, and the oil is input through inlet boundary at 6 L/min. A pressure condition is applied at the outlet boundary, and the gravity direction is specified as the downward vertical direction. The simulation time step is 0.001 s. Even with the calculation method shown in
Figure 4, it took a workstation with 44 cores about 240 h to calculate 5 s of the simulation. However, it would take much more time if solving the fluid and solid together, which have about 50 million mesh elements in total.
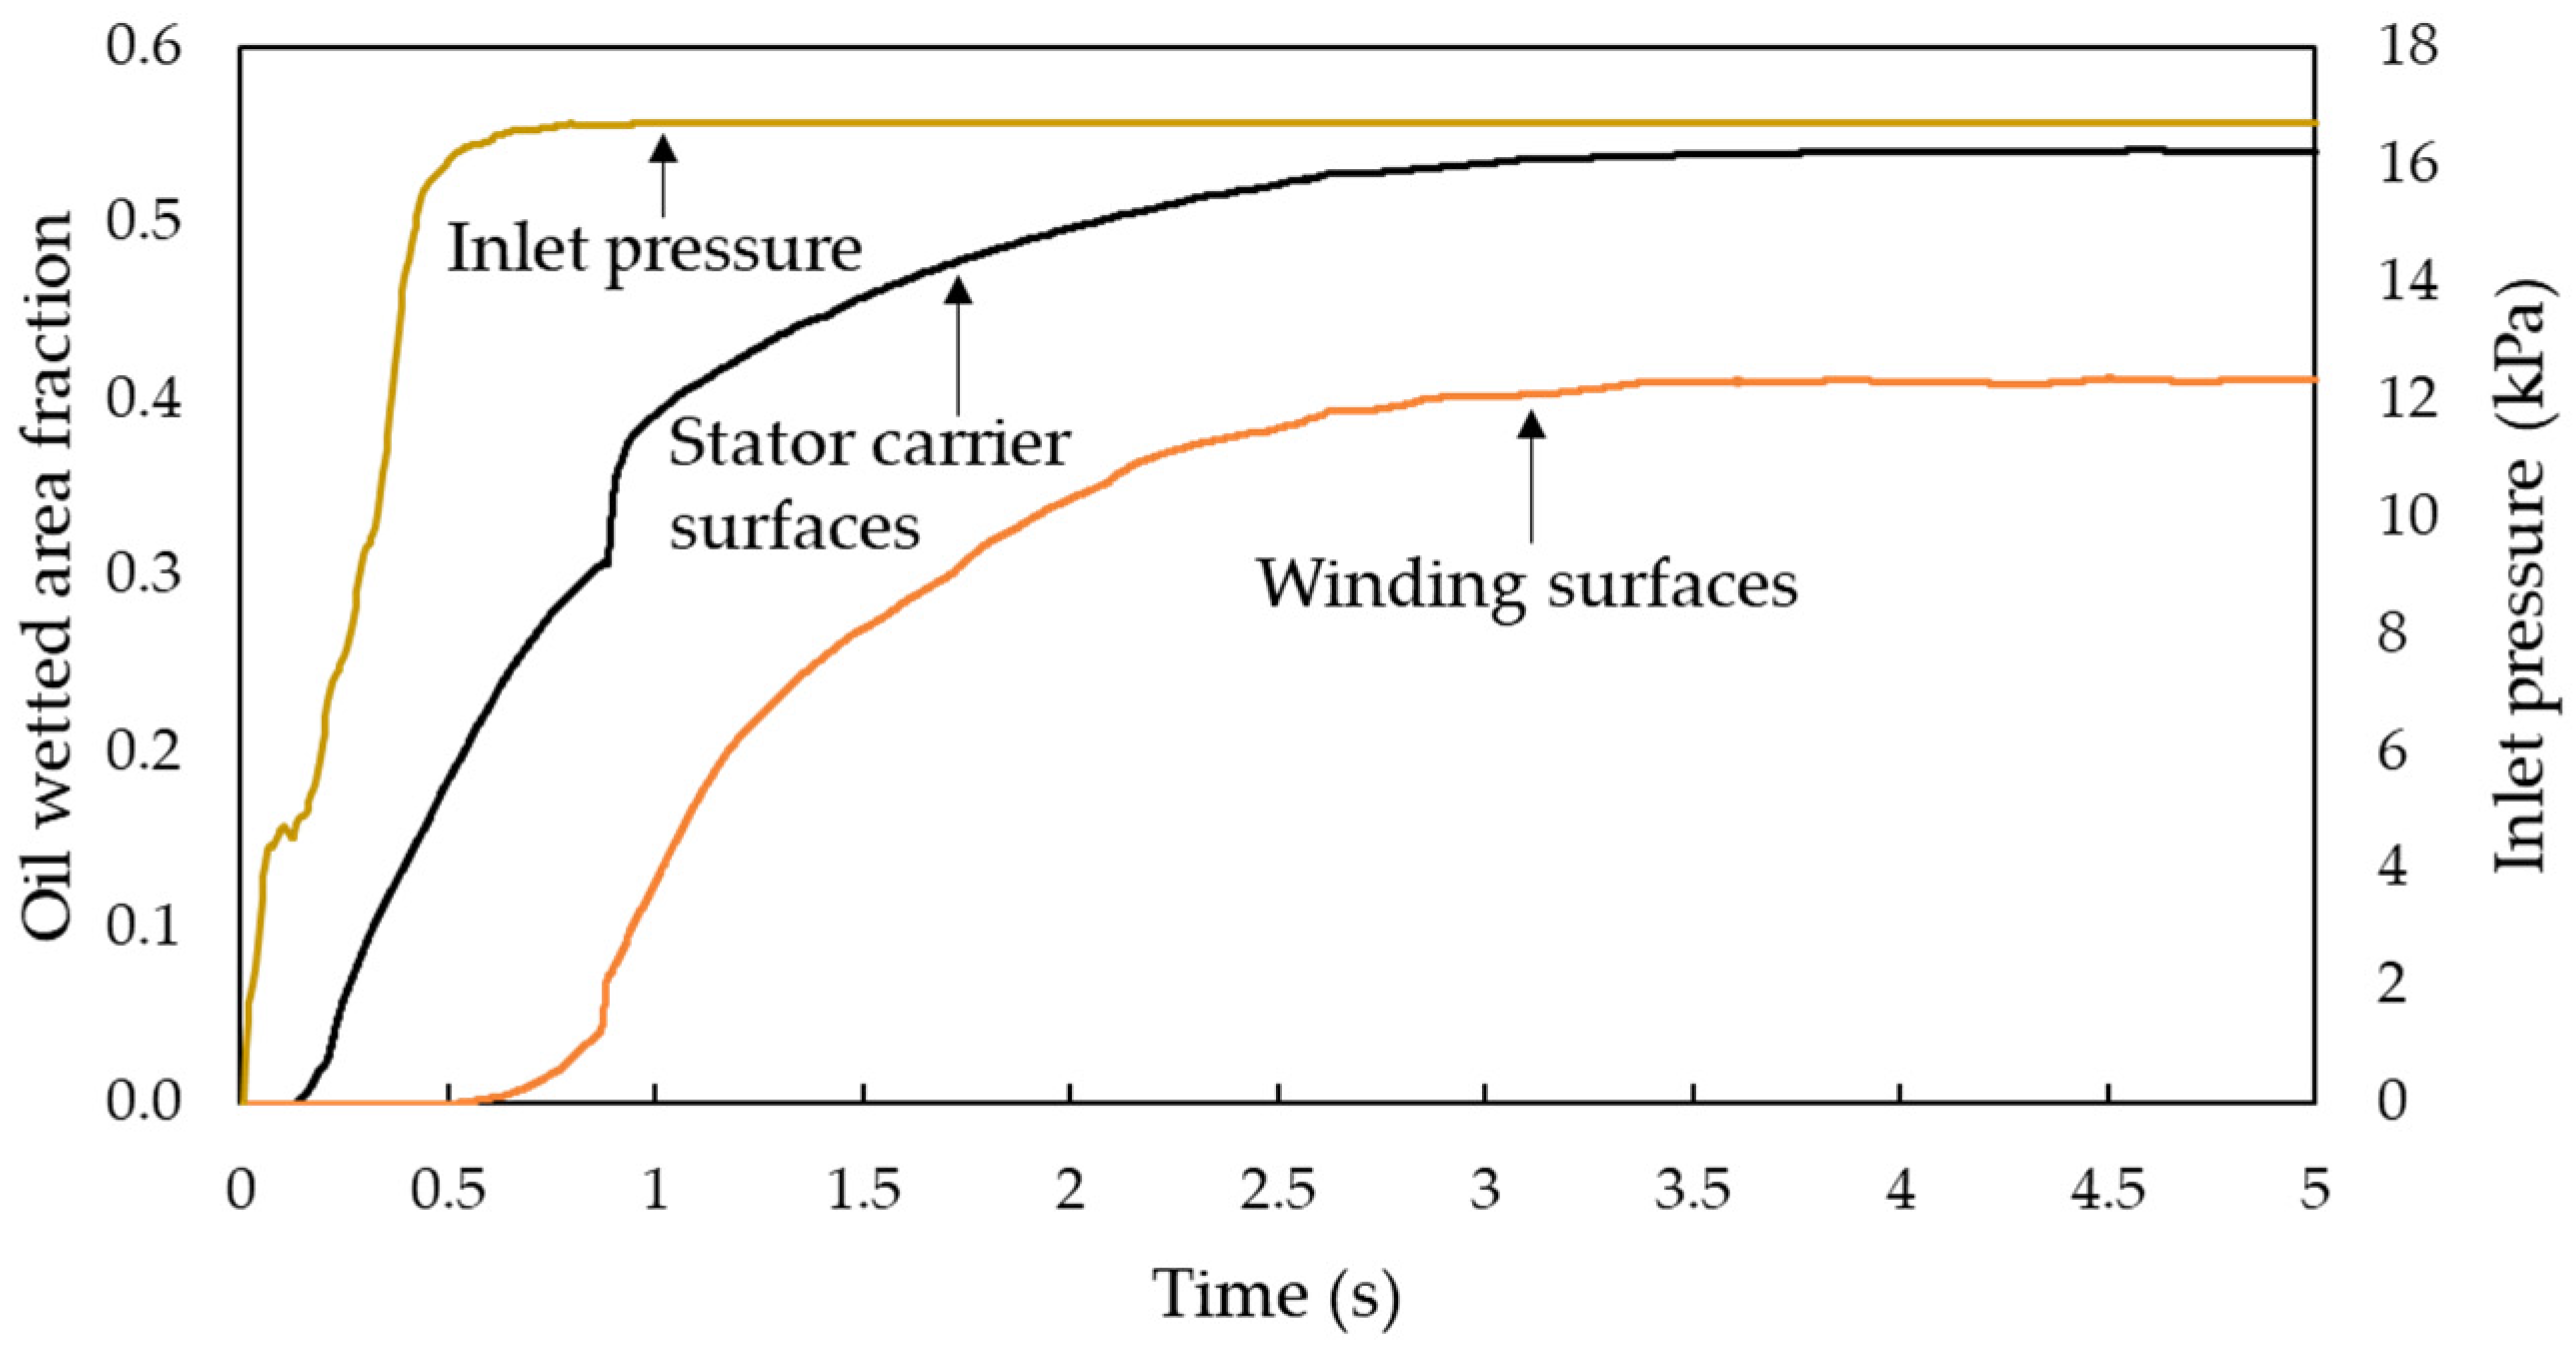
The oil-wetted area fraction, which is defined as the ratio of the area of the wetted surface to the total interface surface, quantitatively indicates this transient variation. Meanwhile the heat dissipation capability of all motor parts can be reflected by these fraction values.
Figure 7 shows the calculated curves of the most critical parts, namely the winding and stator carrier. The quasi-steady state is reached in about 3.5 s. In addition, the variation in the inlet pressure is also shown in
Figure 7. It shows that the pressure maintains a nearly constant value 16.7 kPa, starting at about 0.8 s.
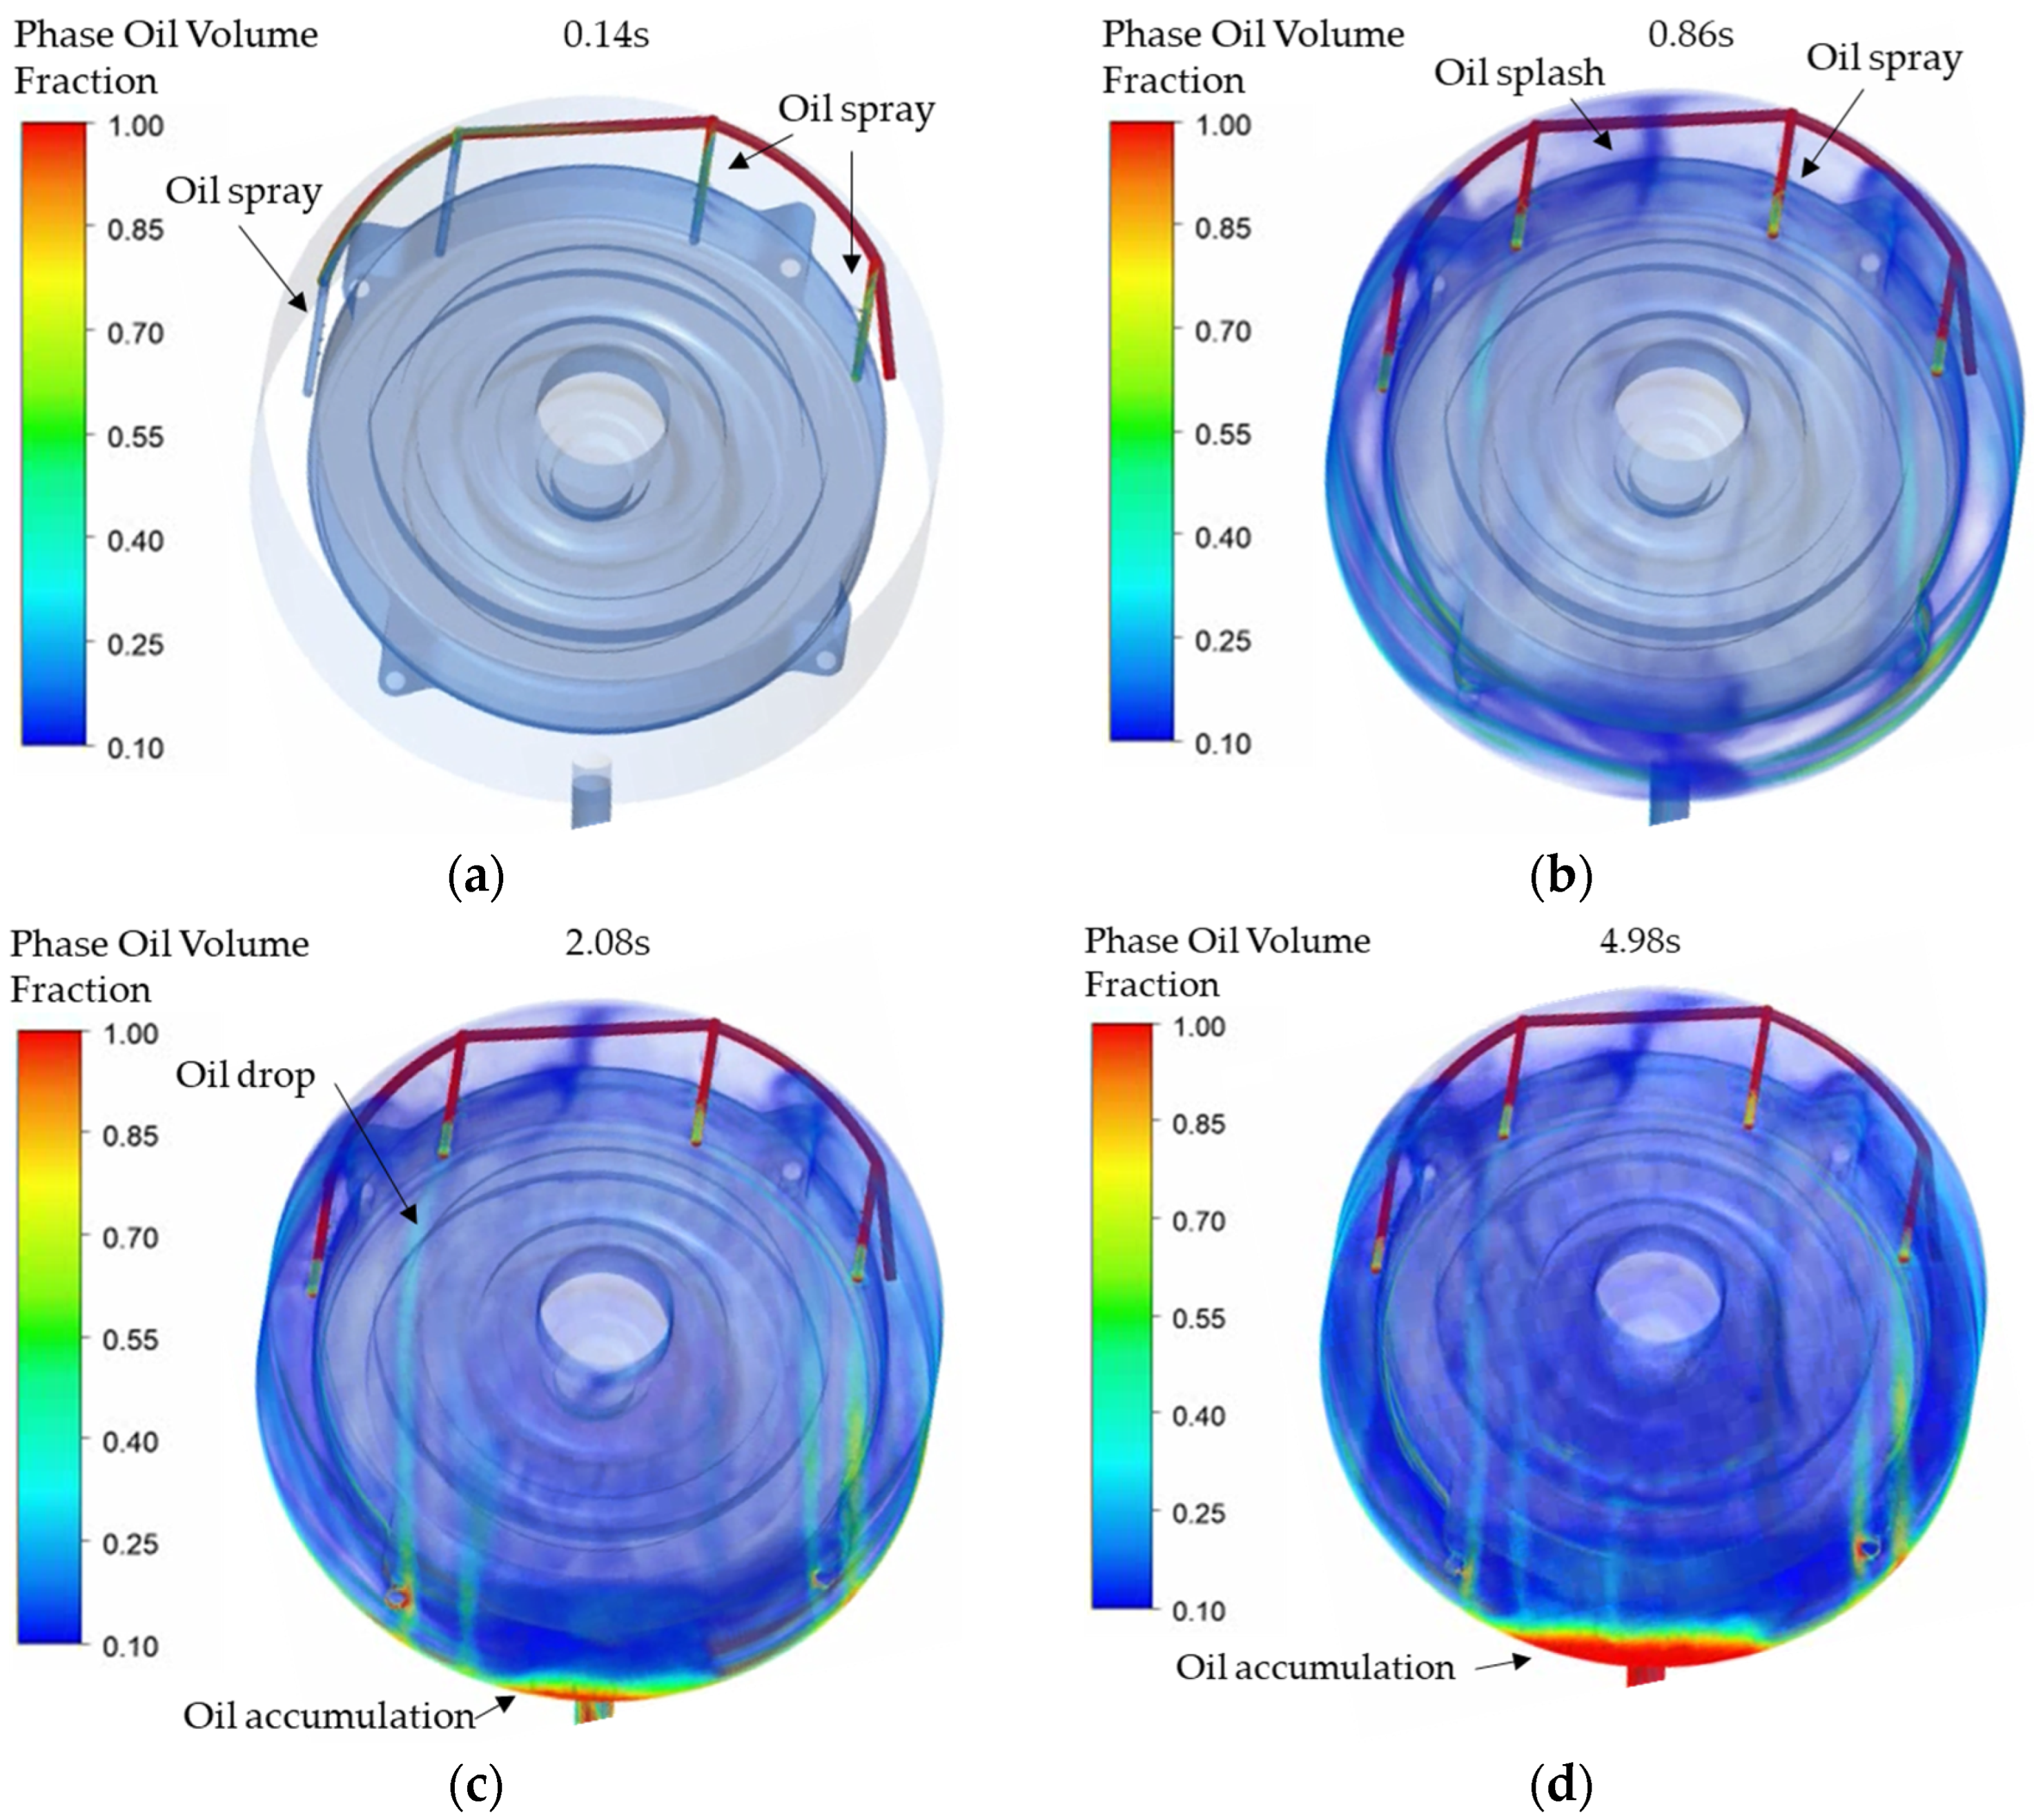
Figure 8 displays four typical moments from the initial state to the steady state of oil flow and accumulation. As shown in
Figure 8a, the oil starts spraying from nozzles at about 0.14 s. Then, at 0.86 s, as interpreted in
Figure 7, the inlet oil pressure reaches an equilibrium state, which means the pipes are nearly full of oil and all the nozzles start spraying. This moment is shown in
Figure 8b, in which the oil area fraction of the winding surfaces is just over 0.1. It can also be found that two streams of oil mainly spraying from pipe 2 and pipe 3 start colliding and splashing.
Figure 8c illustrates the moment that oil began to visibly accumulate at the bottom. The oil area fraction of the winding surfaces reached over 0.3. The height of the oil level will not stop rising until the oil reaches a balance between the inlet and outlet. This state is shown in
Figure 8d, when the oil area fractions of winding surfaces and stator carrier surfaces are about 0.41 and 0.54. It can be noticed that the final height of the oil level must not exceed the airgap height; otherwise, additional unneglected churning loss shall be incurred [
20].
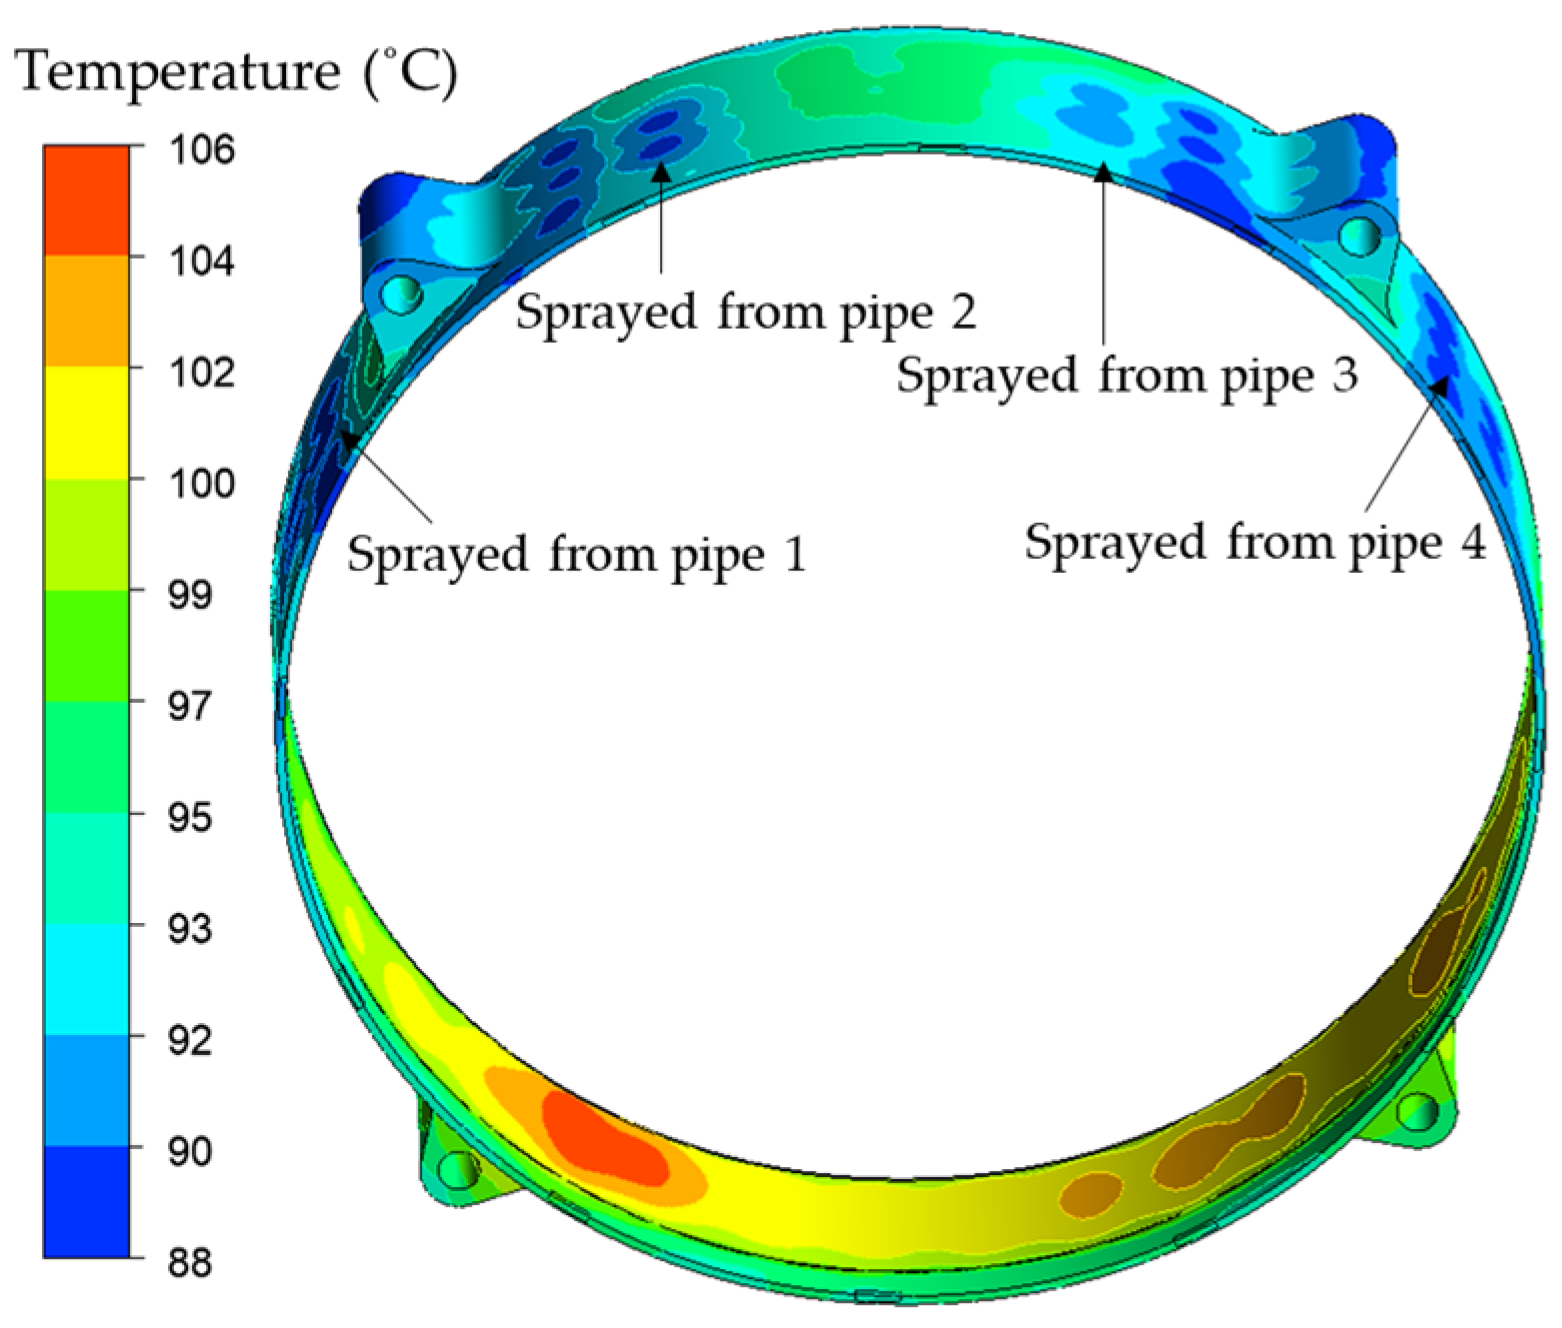
Figure 9,
Figure 10 and
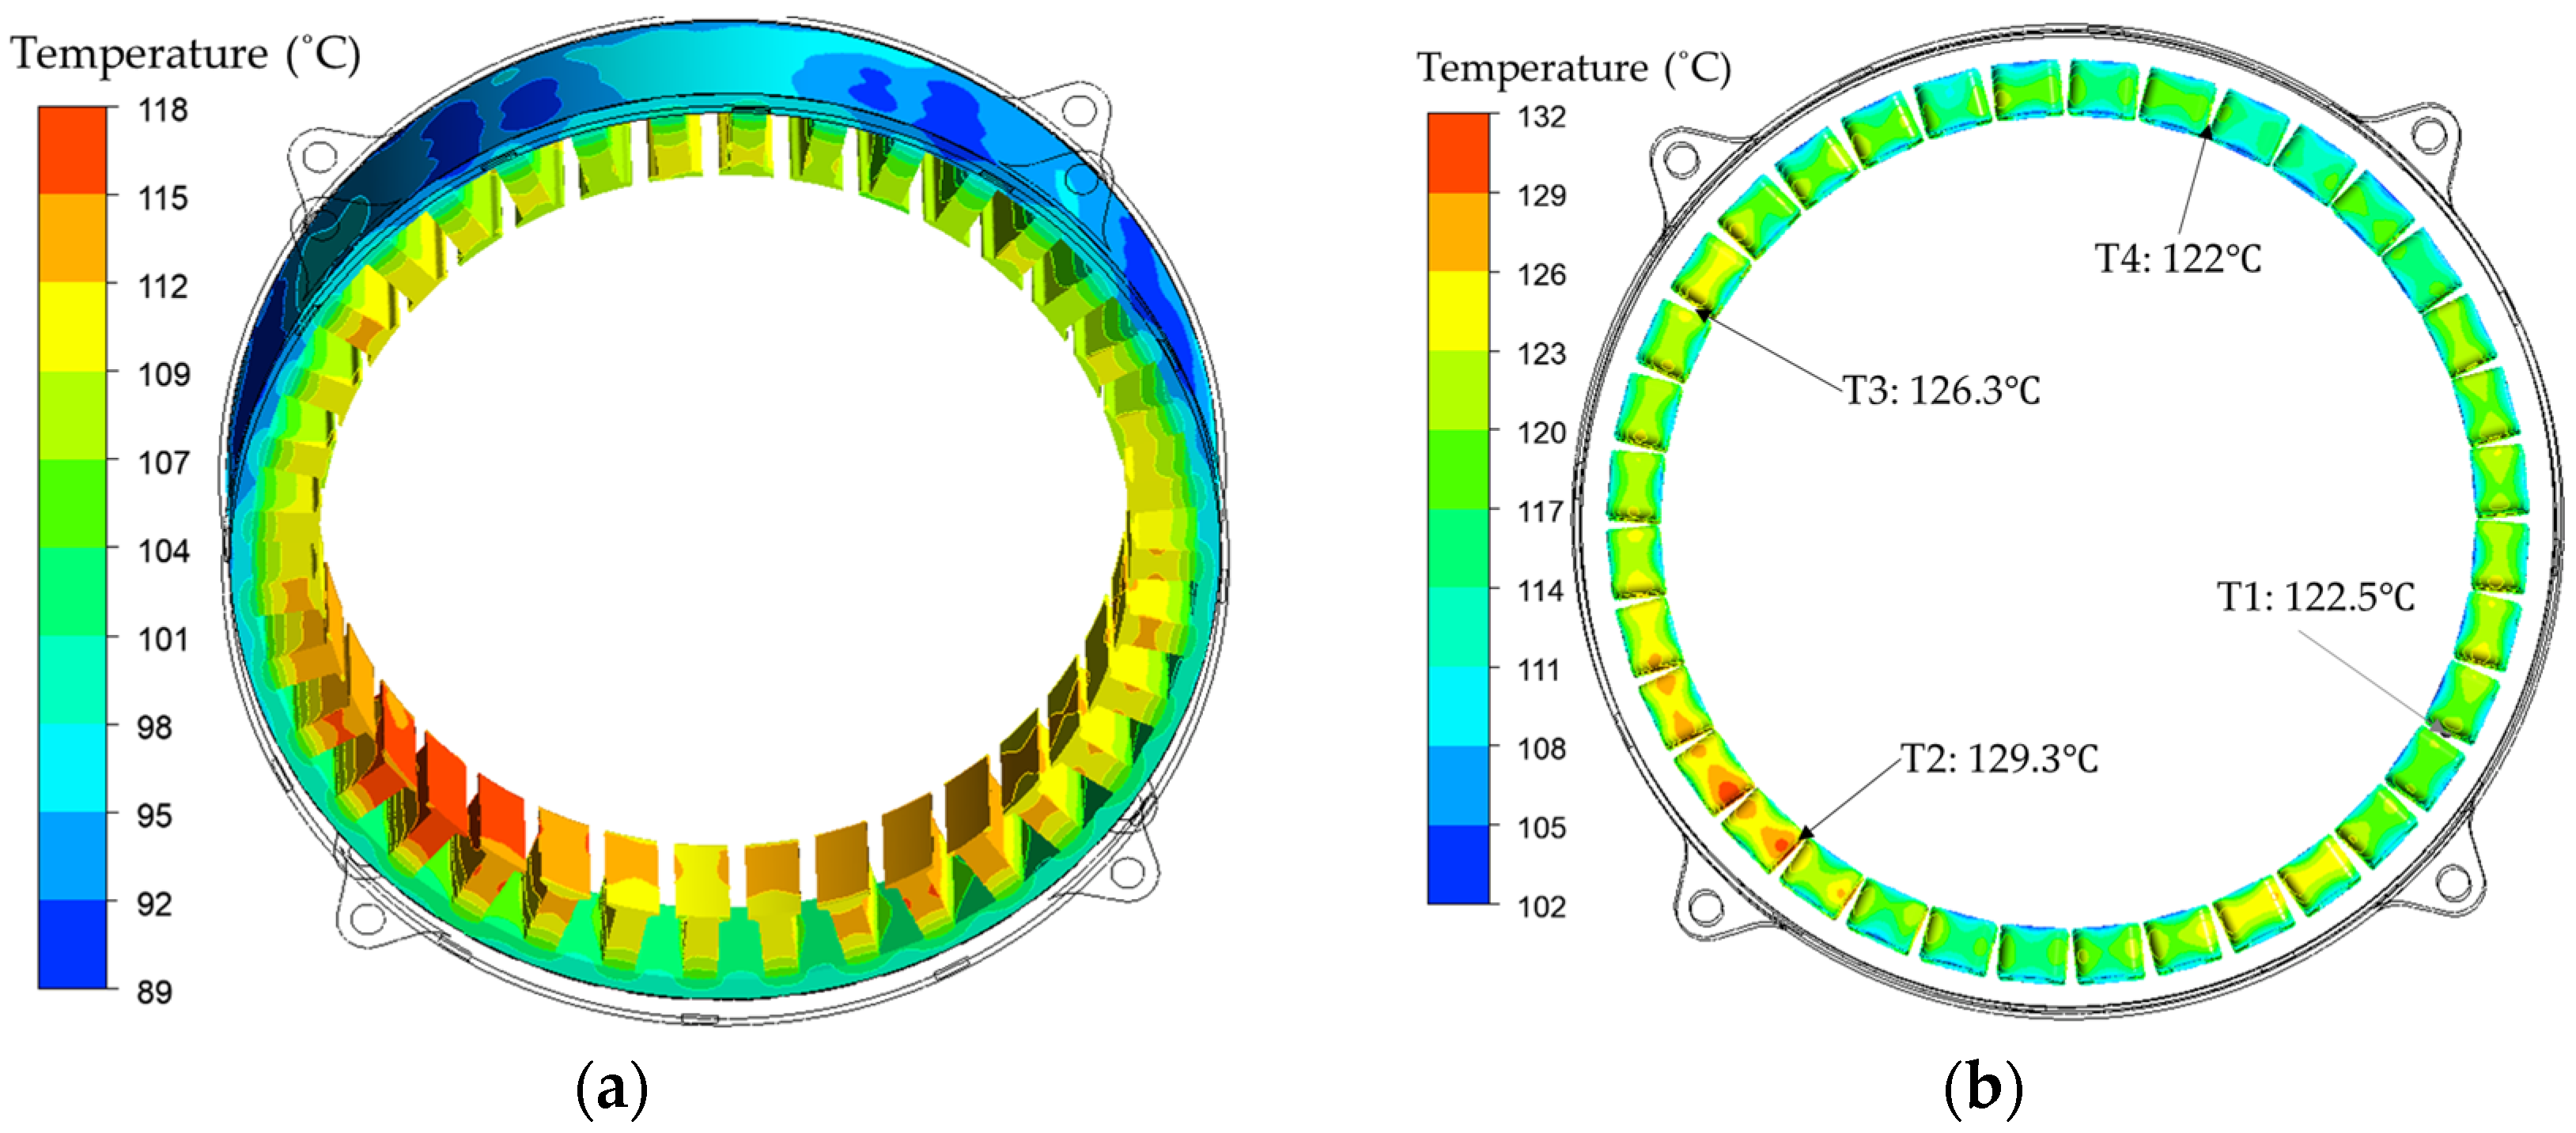
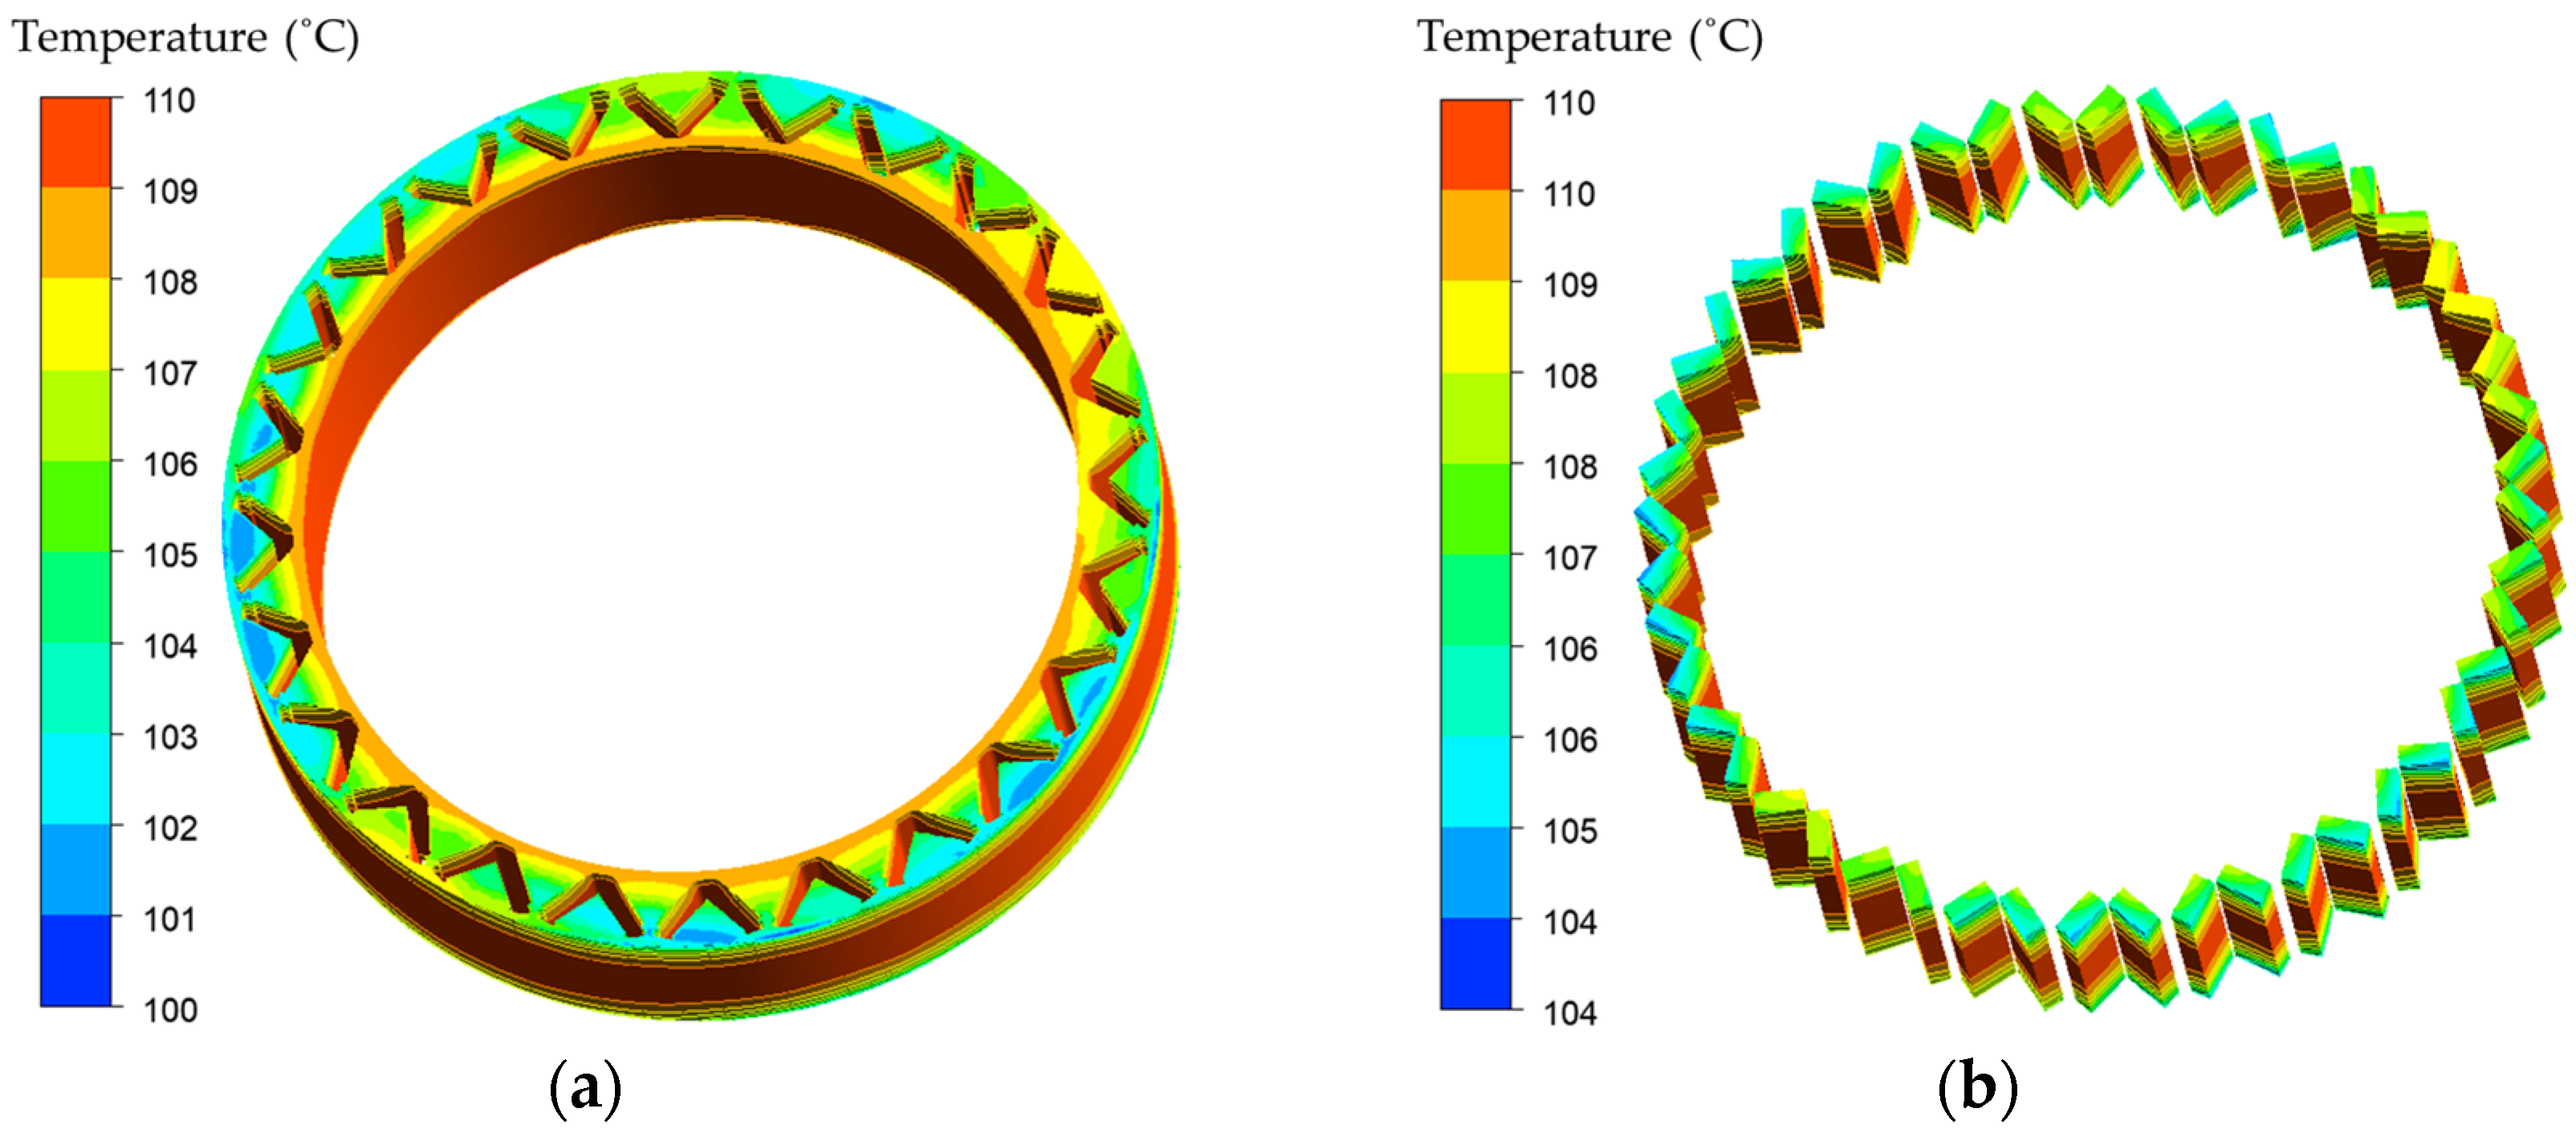
Figure 11 show the steady-state temperature distribution of IWM’s solid parts.
Figure 9 shows the temperature distribution of the stator carrier. A few areas of the surface in dark blue indicate they are first to be sprayed by oil and exhibit a low temperature. The temperature distribution of the stator and rotor is shown in
Figure 10 and
Figure 11. The hot spots are found in the lower-left area of the stator windings and reach about 130 °C, especially in the axial middle position, which is near position T2. This phenomenon is already reflected in
Figure 9. The main reason is that this area is the furthest away from the oil spray inlet but close to the outlet. Furthermore, the oil cannot directly spray this area and can only rely on gravity to shower along the carrier surfaces. The rotor rotates in a counterclockwise direction, but the temperature difference in the stator windings depends on the distance to the oil inlet or outlet. For the rotor, in addition to the temperature boundary, the maximum temperature is also found in the axial center.
5. Testing and Validation
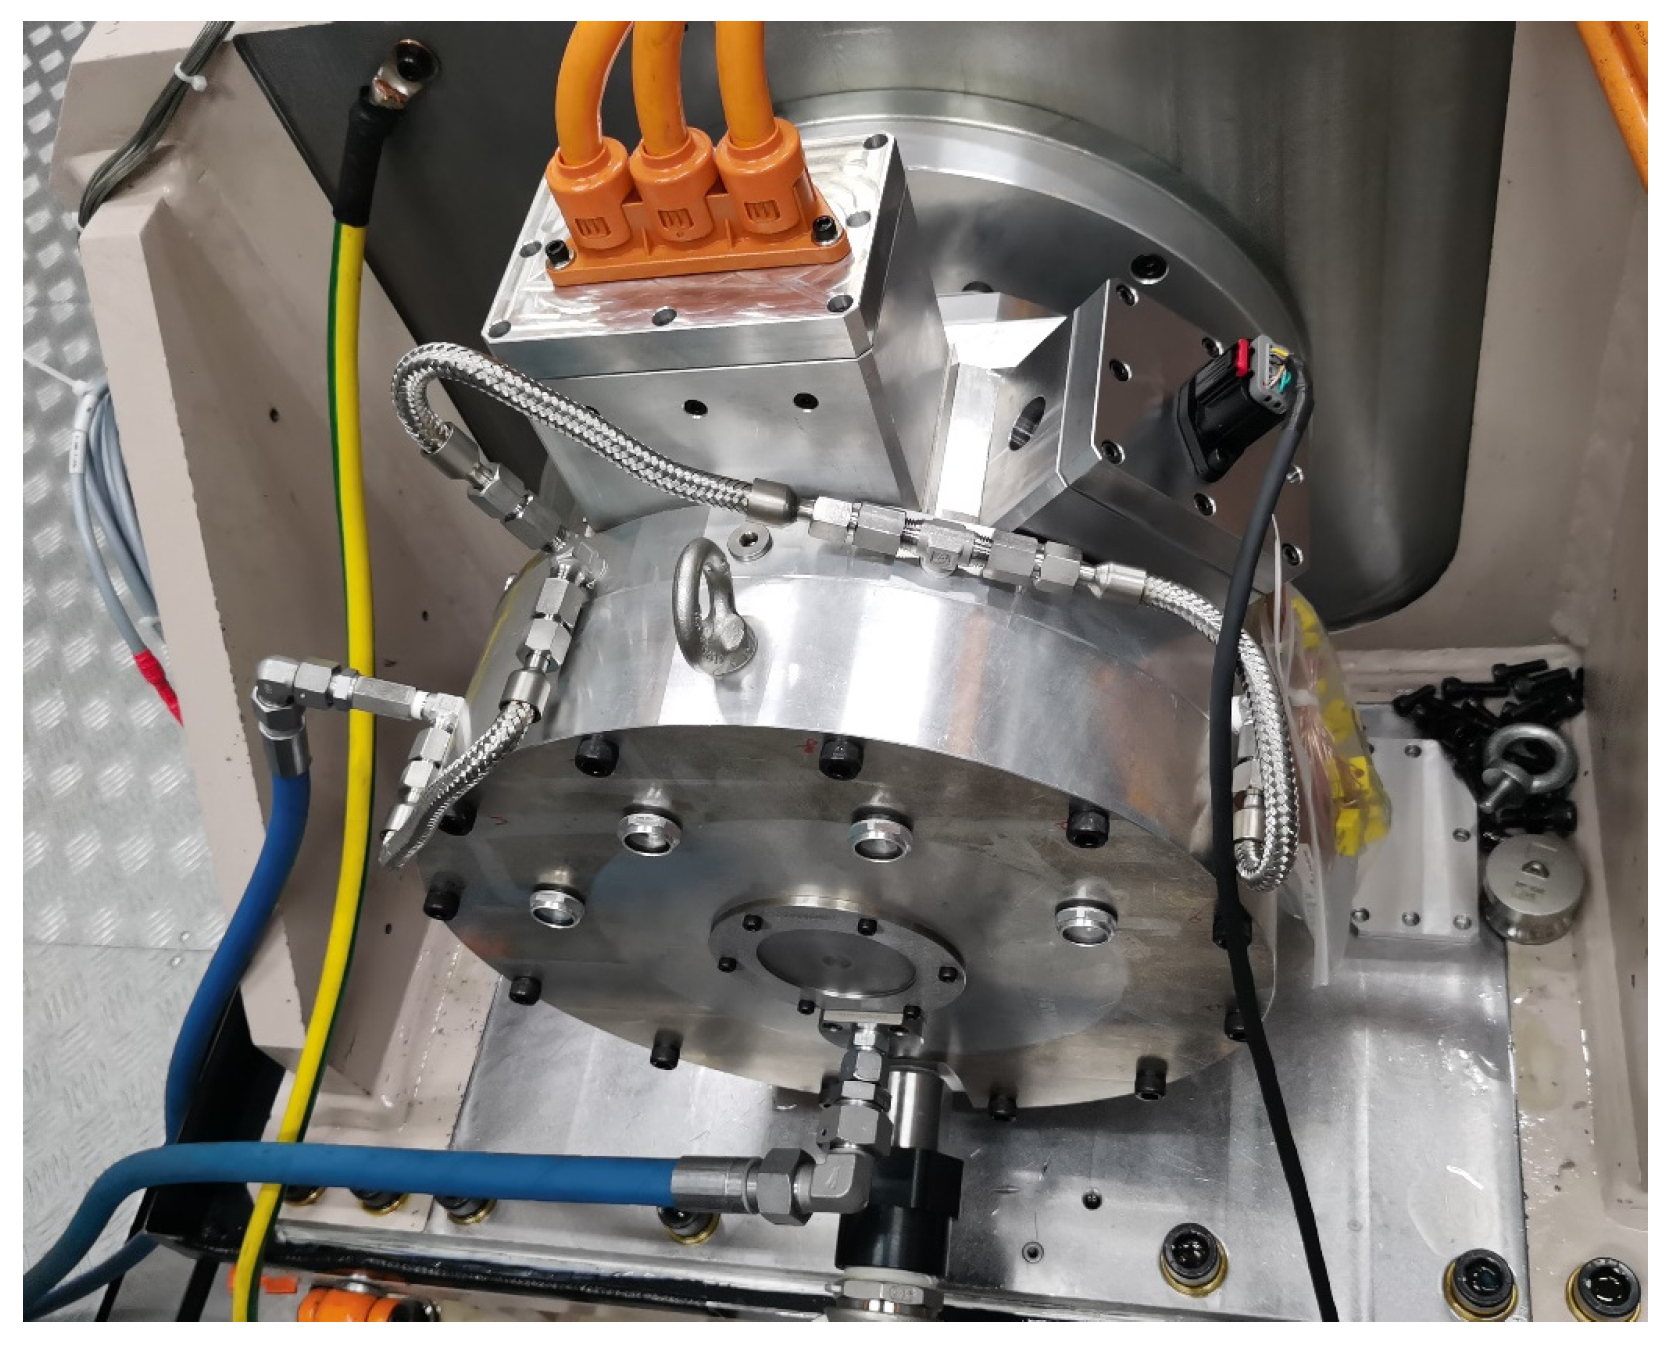
To verify the accuracy of the proposed analysis method for the designed IWM, a prototype was built and tested.
Figure 12 shows a front view of the setup. Three orange cables provide three-phase power from the inverter, and two blue tubes provide the oil channel from the inlet and to the outlet. Four thermal couples (TCs) are inset into the end windings, according to the positions shown in
Figure 10b. Before running the specified operation point, 130 Nm at 1000 rpm, the oil at a temperature of 80 °C keeps flowing to ensure that the IWM starts at about 80 °C.
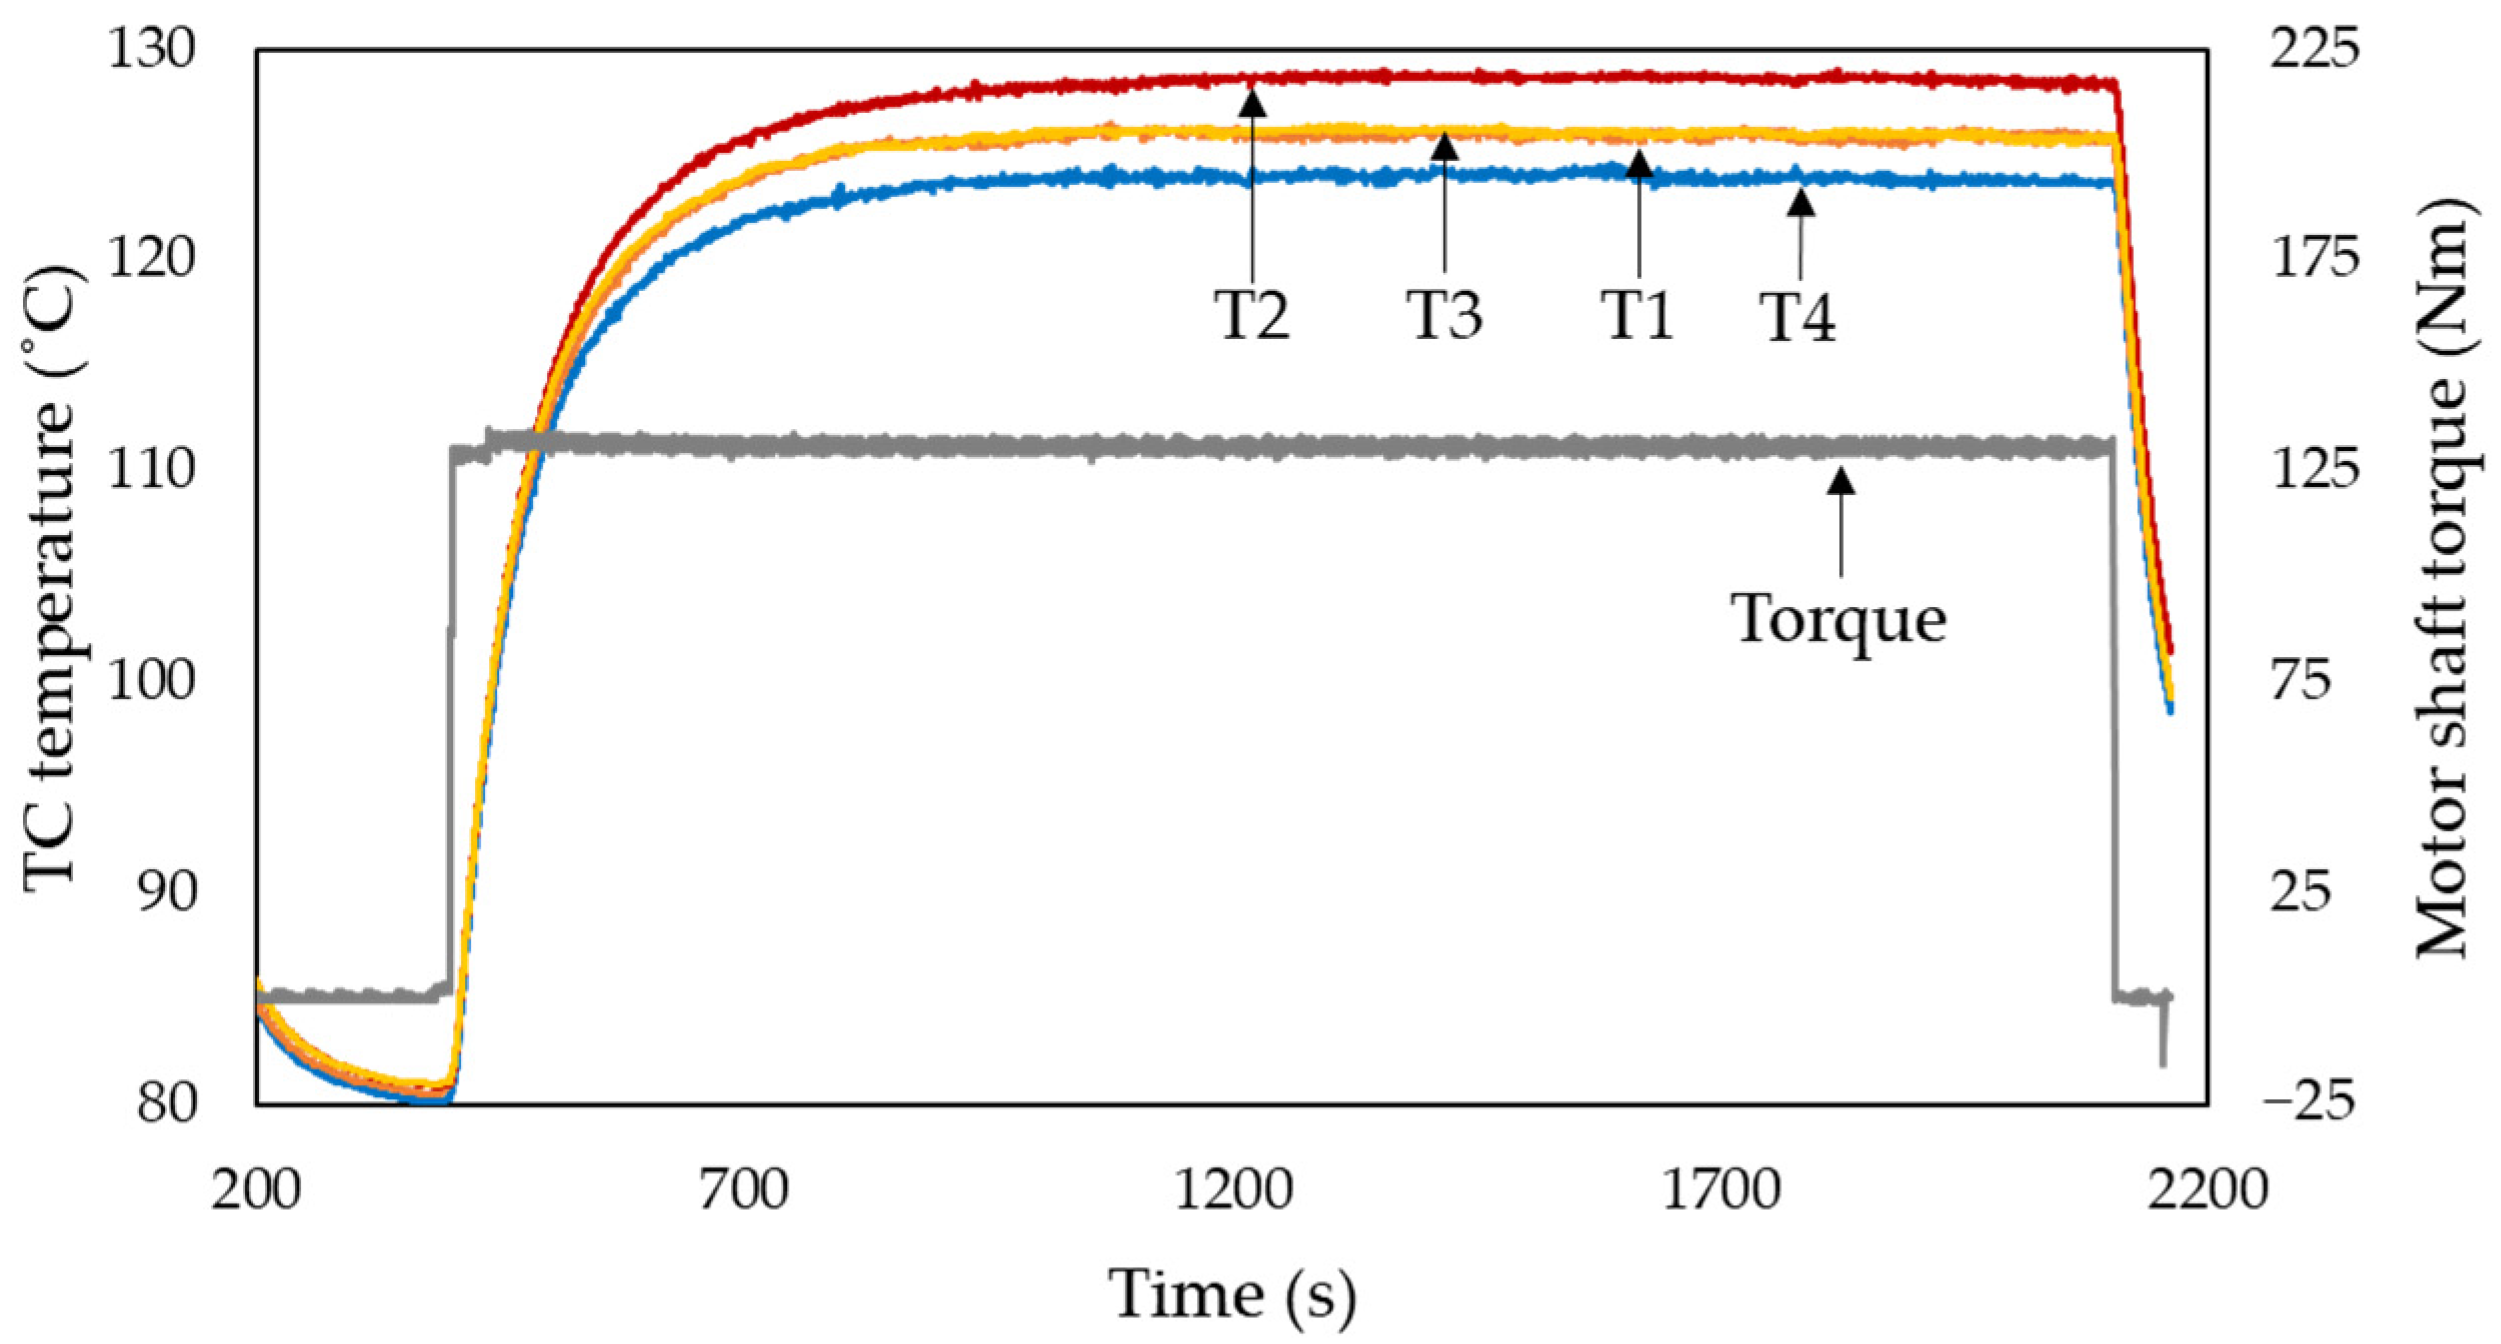
Figure 13 shows the temperature change curves of the four pre-built thermal sensors, which are numbered as T1–T4, and the applied torque curves. The temperatures of four TCs start rising once the torque is activated and reach a steady state after about 15 min.
Table 4 shows a comparison of the measurement results and the simulation results. A good agreement is found between them. The maximum error occurs at position T2, and the error is only 2.68%. Due to the space limitation for mounting the TCs, the test did not capture the real hot spot. But a reasonable value can be deduced based on the simulation results in
Figure 10b.
6. Conclusions
With the increasing torque and power density of the EMs in new energy vehicles, there is a trend, suggesting, not only for EMs in the central-drive units but also for IWMs, that it is better for the heat to be removed from winding surfaces directly. Due to the compact structure of IWMs, a new cooling design is proposed by directly crossing the stator carrier in the axial direction with only four pipes. Based on the flowchart of the calculation procedures, it is easy to extract information and iterate calculations between the unsteady solver for oil fluid and steady solver for EM solids. The transient process of oil distribution is quantitatively represented by changing oil-wetted area fraction, in which four typical moments are illustrated in contour with the color filled. Analysis and test results show that the stator surfaces, end windings, and rotor ends are well-sprayed and dripped. Even the temperatures of the axial middle part of the windings and magnets are only higher about 3 °C than both sides because of the short axial length. In summary, three conclusions can be drawn:
- (1)
An oil-spray-cooled concept for IWMs is offered. The flat structure makes the oil flow design more flexible. In this paper, both end windings and rotor ends are effectively cooled by the oil from four pipes.
- (2)
A complete geometry model without simplification is created. The combination of CFD with a two-phase VOF model and mixed timescale method was employed and proved to be accurate at predicting the temperature distribution of IWMs. The iteration procedures by mapping the temperature of the interfaces back to the fluid were implemented through programming. It could be a reference for solving similar thermal problems.
- (3)
Although the mixed timescale method is applied, this calculation is still very time consuming to simulate the transient heat rising or other complex variable cycles under current hardware conditions. However, due to the real geometry model and high numerical calculation accuracy, it provides the possibility that some simplified thermal models seriously rely on some thermal parameters that can be calibrated on the basis of analysis results.

