Article

Research on a Lightweight Panoramic Perception Algorithm for Electric Autonomous Mini-Buses

1
School of Automobile and Traffic Engineering, Liaoning University of Technology, Jinzhou 121001, China
2
Mechanical and Aerospace Engineering, Brunel University, London UB8 3PH, UK
*
Author to whom correspondence should be addressed.
World Electr. Veh. J. 2023, 14(7), 179; https://doi.org/10.3390/wevj14070179
Submission received: 13 June 2023 / Revised: 3 July 2023 / Accepted: 5 July 2023 / Published: 8 July 2023

Abstract

:
Autonomous mini-buses are low-cost passenger vehicles that travel along designated routes in industrial parks. In order to achieve this goal, it is necessary to implement functionalities such as lane-keeping and obstacle avoidance. To address the challenge of deploying deep learning algorithms to detect environmental information on low-performance computing units, which leads to difficulties in model deployment and the inability to meet real-time requirements, a lightweight algorithm called YOLOP-E based on the YOLOP algorithm is proposed. (The letter ‘E’ stands for EfficientNetV2, and YOLOP-E represents the optimization of the entire algorithm by replacing the backbone of the original model with EfficientNetV2.) The algorithm has been optimized and improved in terms of the following three aspects: Firstly, the YOLOP backbone network is reconstructed using the lightweight backbone network EfficientNet-V2, and depth-wise separable convolutions are used instead of regular convolutions. Secondly, a hybrid attention mechanism called CABM is employed to enhance the model’s feature-representation capability. Finally, the Focal EIoU and Smoothed Cross-Entropy loss functions are utilized to improve detection accuracy. YOLOP-E is the final result after the aforementioned optimizations are completed. Experimental results demonstrate that on the BDD100K dataset, the optimized algorithm achieves a 3.5% increase in mAP50 and a 4.1% increase in mIoU. During real-world vehicle testing, the detection rate reaches 41.6 FPS, achieving the visual perception requirements of the autonomous shuttle bus while maintaining a lightweight design and improving detection accuracy.

1. Introduction

In recent years, with the rapid development of driverless technology, driverless vehicles have demonstrated great potential in various fields. Specifically in industrial areas, autonomous electric mini-buses serve as important transport tools that can improve transport efficiency and reduce labor costs while playing a crucial role in traffic management. In order to implement lane-keeping and obstacle-avoiding functions, autonomous electric mini-buses need to accurately extract information such as targets, lane lines, and drivable areas to make accurate decisions and operations.
In current detection algorithms, deep learning algorithms have replaced traditional detection algorithms due to their simplicity in implementation and high computational efficiency. These algorithms achieve fast recognition of targets through unique network structures and loss functions. In deep learning, target detection algorithms are divided into R-CNN (Region-based Convolutional Neural Network) series two-stage algorithms and SSD (Single Shot Detector), YOLO series single-stage algorithms [1,2,3]. Two-stage algorithms first locate and then recognize, so their accuracy is better than single-stage algorithms, but their parameter volume and real-time performance are worse, so they cannot meet the low computing resources and high real-time requirements of roadside units. Compared with the R-CNN algorithm, SSD algorithm has faster inference speed, but its detection accuracy has certain limitations, while the YOLO series of algorithms have greatly improved detection speed compared with other algorithms while also considering accuracy. Lane-line and drivable-area recognition, on the other hand, belongs to semantic segmentation algorithms, such as Enet and SCNN are based on deep learning frameworks [4,5]. These algorithms ensure the accuracy and efficiency of segmentation through spatial convolution and context-aware modules. ENet is a lightweight semantic segmentation algorithm that uses many new technologies, such as initial point convolution and depth-wise separable convolution, to reduce model size and computational costs. The main advantages of ENet are its fast speed, lightweight, high accuracy, and suitability for real-time semantic segmentation in resource-constrained environments. SCNN is a convolutional neural-network-based semantic segmentation algorithm that uses spatial convolutional neural networks. It treats image data as two-dimensional tensors using adaptive kernel sizes and depths, thereby better preserving the spatial relationships of images. The main advantages of SCNN are its high precision, good scalability, and suitability for large-scale, high-precision semantic segmentation tasks.
However, integrating these algorithms to achieve the three tasks simultaneously requires comprehensive consideration of factors such as model structure design, dataset annotation, and training strategies, which significantly increases their complexity and makes it difficult to ensure real-time operation during algorithm deployment.
To address the aforementioned issues, this article selected the YOLOP algorithm, which can simultaneously achieve target detection, lane-line segmentation, and drivable area recognition and uses the EfficientNetV2 lightweight network to construct a network model. Due to the different focus on region-segmentation and -detection tasks, the original SE (Squeeze and Excitation) channel’s attention mechanism is replaced with the CABM (Convolutional Block Attention Module). Additionally, new loss functions are introduced, including Focal EIoU (Focal Extended Intersection over Union) Loss and Smoothed Cross-Entropy Loss. A lightweight YOLOP-E algorithm is proposed based on these modifications.

2. Algorithm YOLOP-E

2.1. Algorithm YOLOP

To achieve the goal of one model that can finish target detection, lane line segmentation, and drivable area recognition simultaneously tasks, in this paper, the YOLOP algorithm is chosen as the fundamental algorithm [6].
The YOLOP algorithm mainly consists of the encoder and decoder. The overall structure of the model is shown in Figure 1. The entire network shares the same encoder, which is composed of two parts: backbone and neck. The backbone is used to extract features from the input image and uses CSP DarkNet, which is the same as YOLOV4, as the main network [7]. It supports feature propagation and reuse. The neck is used to fuse the features generated by the backbone, which primarily consists of the SPP and FPN [8,9]. The SPP pyramid pooling module can fuse different scale features, while the FPN feature pyramid network can fuse hierarchical semantic information. This results in an output feature that includes information from different semantic levels and scales, and the feature is merged through concatenation.
The decoder consists of three different heads, and the detection head uses an anchor-based multi-scale detection method. A bottom-up feature-pyramid-network path integration network (PAN) is used to transmit location features from top to bottom [10]. This is combined with the feature pyramid network to improve feature fusion. Multi-scale features are then used for detection, predicting the position offset, height and width scaling factors, the probability of each class, and the confidence of the predictions.
The drivable area segmentation head and lane line segmentation head adopt the same network structure. In the upsampling layer, the nearest-neighbor interpolation method is used instead of deconvolution. The bottom-level output from the FPN (dimension of (W/8, H/8, 256)) is sent to the segmentation branch, and the features go through three upsampling layers. Finally, the output feature map is restored to the size of (W, H, 2).

2.2. Lightweighting of Backbone Network

YOLOP has shown excellent performance in the panoramic perception task, but its model structure is complex, and the number of parameters is huge. In practical application scenarios, meeting real-time requirements requires optimizing the network structure. The calculation of model size is shown in the following formula:
J = d × C i n × k 2 × C o u t  
Here, C i n and C o u t , respectively, represent the input and output channel numbers, d   represents the convolutional depth, and k represents the kernel size. As we can see from the formula, when the model channel number is extended n times, the model size is extended by n 2 times. When the depth d is expanded n times, the parameter size J is extended by n times.
The backbone in YOLOP uses DarkNet53 for construction, with significant optimization space for channel numbers, network layer settings, and input–output channel numbers. In order to reduce model calculations and improve real-time performance, the EfficientnetV2-s is used to replace the backbone structure of the original YOLOP model [11]. EfficientnetV2-s is a lightweight network that improves model performance by optimizing dimensions such as depth, width, and resolution. Similarly, EfficientNetV2 utilizes depth-wise separable convolutions as a replacement for regular convolutions. The depth-wise separable convolution (DSC) is an optimized method for convolution operations, which significantly improves computational efficiency and parameter quantity compared to traditional convolutions [12]. The difference between DSC and ordinary convolutions is that the process of ordinary convolutions is divided into two steps: depth-wise convolution and point-wise convolution. The depth-wise convolution step processes each channel of the input data separately. The depth-wise separable convolutions significantly reduce computational complexity compared to standard convolutions, thereby improving computational efficiency. The point-wise convolution, also known as the 1 × 1 convolution, is a special convolution operation. It uses a 1 × 1 convolution kernel to convolve the input data, which can achieve information fusion between channels. The main function of point-wise convolution is to adjust the channel number of the input data while maintaining the spatial dimensions of the data. These two convolution operations are usually used in combination to improve computational efficiency and performance. Compared with ordinary convolutions, DSC has fewer parameters.
Standard convolutions have the computational cost of
D k × D k × M × N × D F × D F                
and depend on the number of input channels M , the number of output channels N , the kernel size D k × D k , and the feature map size D F × D F .
The depth-wise convolution has a computational cost of
D k × D k × M × D F × D F              
and the point-wise convolution has a computational cost of
M × N × D F × D F
By expressing convolution as a two-step process of filtering and combining, we obtain a reduction in computation of [13]
D k × D k × M × D F × D F + M × N × D F × D F D k × D k × M × N × D F × D F = 1 N + 1 D K 2      
When the network structure is constructed, using depth-wise separable convolutions can reduce the model’s parameter size with minimal performance loss and avoid overfitting. The modified backbone structure is shown in Figure 2:

2.3. Optimization of Attention Mechanism

An attention mechanism is a computer algorithm that emulates the human visual attention process and has been widely used in natural language processing and computer vision [14]. Its core idea is to effectively focus attention on the relevant parts of the input sequence during processing by assigning different weights to different inputs in order to better understand and process the input.
Similarly, EfficientNetv2 uses the SE channel attention mechanism to enhance model performance. However, the SE attention mechanism mainly focuses on the importance of feature channels, while relatively neglecting positional information. For object detection and semantic segmentation, positional information is crucial for accurately locating targets. Therefore, in this paper, a hybrid attention mechanism CBAM is used to replace the SE attention mechanism [15]. Compared with the SE’s attention mechanism, CBAM combines channel attention and spatial attention, thus improving the modeling ability of SE attention mechanism in spatial position. The basic structure of CBAM includes two sub-modules: channel attention module and spatial attention module [16]. By concatenating the channel attention module and the spatial attention module, the CBAM module can adjust the attention distribution of the feature map in both channel and spatial dimensions, enhancing the feature representation capability. The overall structure of the attention mechanism is shown in Figure 3.
CBAM can simultaneously focus on spatial positions and channel features in images, which is more beneficial for the YOLOP model, which needs to perform both object-detection and semantic-segmentation tasks. By combining spatial attention and channel attention, the model can assign different weights to objects at different positions in the image, such as detected target vehicle and detected lane line, to improve the performance of both tasks.
MBConv is the main convolution block type in EfficientNetV2. It primarily includes the following components: Depthwise convolution, Batch Normalization, Swish activation function, Pointwise convolution, and the Squeeze-and-Excitation attention mechanism. FMBConv is another convolution block type in EfficientNetV2. It improves upon MBConv by merging Depthwise convolution and Pointwise convolution into a single operation. This operation can reduce computation and model training parameters. Structures of the MBConv module and FMBConv module with CBAM attention mechanism are shown in Figure 4 below.

2.4. Optimization of Loss Function

The loss function for object-detection models under deep learning frameworks has a significant impact on the detection performance. YOLOP model adopts CIoU loss for the detection box [17]. The formula for calculating CIoU is as follows:
L C I o U = 1 I o U + ρ b , b g t C 2 + a v                      
I o U = A B A B
v = 4 π arctan w g t h g t arctan w h 2
a = v 1 I o U + v
v w = 8 π 2 arctan w g t h g t arctan w h × h w 2 + h 2 v h = 8 π 2 arctan w g t h g t arctan w h × w w 2 + h 2
In the formula, I o U is the intersection-over-union ratio, which measures the degree of overlap between the predicted box and the true box; ρ b , b g t represents the distance between the center points of the predicted box and the true box; C   is a normalization factor that includes the diagonal length of the minimum enclosing rectangle of the predicted box and the true box; a is an adjustable parameter used to balance the effects of the center point distance and size offset; and v is a correction term used to stabilize division when C 2 approaches zero and avoid zero division.
Although CIoU Loss takes into account the size and center-point deviation of the predicted box and true box and can more comprehensively measure the difference between them, it requires manual adjustment of parameters for different detection tasks, increasing the complexity of use. To address this problem, this paper replaces CIoU Loss with Focal-EIoU Loss [18]. Focal-EIoU Loss integrates EIoU Loss and Focal L1 Loss. The formula for calculating EIoU Loss is as follows:
L E I o U = L E I o U + L d i s + L a s p = 1 I o U + ρ 2 b , b g t c 2 + ρ 2 w , w g t c w 2 + ρ 2 h , h g t c h 2
In the formula, L E I o U ,   L d i s , and L a s p represent loss functions for the overlap area, center point distance, and aspect ratio, respectively. c w and c h are the width and height of the minimum enclosing rectangle that covers both boxes.
Compared with CIoU loss, EIoU loss does not require a normalization factor for calculating diagonal length and center point distance, reducing the complexity of computation and resource consumption. At the same time, EIoU Loss does not require manual adjustment of hyperparameters. The true values of the width and height of the box can be directly calculated using ρ 2 w , w g t c w 2 and ρ 2 h , h g t c h 2 , thereby resolving the optimization bottleneck problem of CIoU loss.
The Focal-EIoU Loss is expressed as:
L F E = I o u γ L E I o U
The parameter γ is used to control the curvature of the curve and set a larger gradient for regions with larger deviations during optimization to reduce the impact of some inferior samples on the loss function.
For the binary classification problem of lane line segmentation, the original algorithm used cross-entropy loss. The formula for calculating cross-entropy loss is as follows:
L C E = 1 N i L i = 1 N i [ y i × log p i + 1 y i × log 1 p i                                
In the formula, y i represents the label of sample i , with 1 as the positive class and 0 as the negative class. p i represents the probability that sample i is predicted to be in the positive class.
Cross-entropy loss performs well in binary classification tasks, as it can directly calculate the difference between the predicted probability and the true label. However, taking into account the influence of image noise and unclear lane lines in the actual operation of the mini bus (Figure 5), a smoothed cross-entropy loss function is introduced [19]. The formula for calculating it is as follows:
L S C E = 1 N i [ y i × log p i + e p s i l o n + 1 y i × log 1 p i + e p s i l o n      
In the formula, e p s i l o n is a small positive number used to prevent division-by-zero errors in logarithmic operations. By introducing smoothed cross-entropy loss, the model’s generalization ability and robustness in the presence of noise in the labels are improved.
For the drivable-area-segmentation part, the original model introduced IoU loss in cross-entropy loss. The final loss is obtained by weighting the three types of losses mentioned above:
L a l l = L F E + L S C E + L C E + L I o U          

3. Experimental Design and Verification

This paper compares the modified model and the unmodified model on the BDDD100K dataset in terms of two metrics: mAP50 and mIoU. The performance of the detection head was compared with YOLOv5-m and EfficientDet, while the performance of the segmentation head was compared with ENet and SCNN. The models were trained according to the environment set in Section 3.1, and data augmentation was performed as shown in Section 3.3.
Subsequently, the planned experiments were conducted on a real vehicle to validate the algorithms optimized at different stages. Firstly, we calibrated the camera used. Then, we installed the camera sensor on the vehicle to capture data via USB and process it. Finally, the obtained results are compared, as shown in Section 3.4.
Finally, we input images with blurred lane lines into the model to test our optimization results. The final detection comparison and all experimental results are shown in Section 4.

3.1. Experimental Setup

The experimental environment was the Ubuntu 20.04 operating system, with an i7-12700k processor and an RTX3090 graphics card with 24 GB memory. PyTorch 2.0.1 and Python 3.8 were used, as well as extensions such as CUDA 11.8 and OpenCV 4.6.0.6. The experimental results of the proposed algorithm and the compared algorithms are obtained in this experimental environment.

3.2. Dataset Setting

BDD100K is an open-source large-scale autonomous driving dataset, which includes 100,000 multimodal (images, videos, etc.) and highly annotated street images that cover various real-life situations in urban driving, such as different weather, time, and traffic conditions, and can be used for training and testing in applications such as autonomous driving, object detection, and semantic segmentation [20]. As a result of its ability to produce algorithms with robust performance that can be generalized to new environments, the BDD100K dataset was selected for training and evaluating our network.
Meanwhile, considering that the resolution of the image data captured by the camera sensor used in subsequent real-car experiments is different from the resolution of the images collected in the BDD100K dataset, the image resolution was uniformly changed to 2448 × 2048 in the algorithm’s image-preprocessing section to facilitate subsequent real-car verification.

3.3. Implementation Details

To improve the performance of our model, we empirically adopted some practical techniques and methods for data augmentation.
For training, we implemented a step-by-step training method, where we initially trained the Encoder and Detect head, then froze them while training two Segmentation heads. Finally, all three tasks were jointly trained.
To equip our detector with more prior knowledge of objects in traffic scenes, we utilized the k-means clustering algorithm for obtaining prior anchors from all detection frames in our dataset. We utilized the Adam optimizer for training our model and set the initial learning rates of β1, β2, and β3 to be 0.001, 0.924 and 0.999, respectively. We employed warm-up and cosine annealing techniques to adjust the learning rate during training, aiming to improve and expedited model convergence.
Data augmentation was used to enhance the image variability and to improve the robustness of our model in various environments. To address both photometric and geometric distortions, a training scheme that applied mosaic augmentation was implemented [7]. For the former, adjustments to the hue, saturation, and brightness of images were made, while for the latter, images underwent random rotations, scaling, translations, shearing, and horizontal flipping.

3.4. Real-Vehicle Experimental Setup

To better understand the impact of the improvements made in this paper on the performance of YOLOP object detection and lane segmentation, we designed a set of ablation experiments. The models with different variables were deployed on industrial controllers and tested using a mini-bus. The experimental environment included a Ubuntu 20.04 operating system, an i7-6700 processor, RTX3060 graphics card with 12 GB of memory, and extensions such as PyTorch 2.0.1, Python 3.8, CUDA 11.8, and OpenCV 4.6.0.6. The Daheng Mercury Industrial Camera MER2-502-79U3M was used as the camera sensor, and real-time image data was sent to the algorithm for processing through the ROS operating system. Some camera parameters are shown in Table 1:
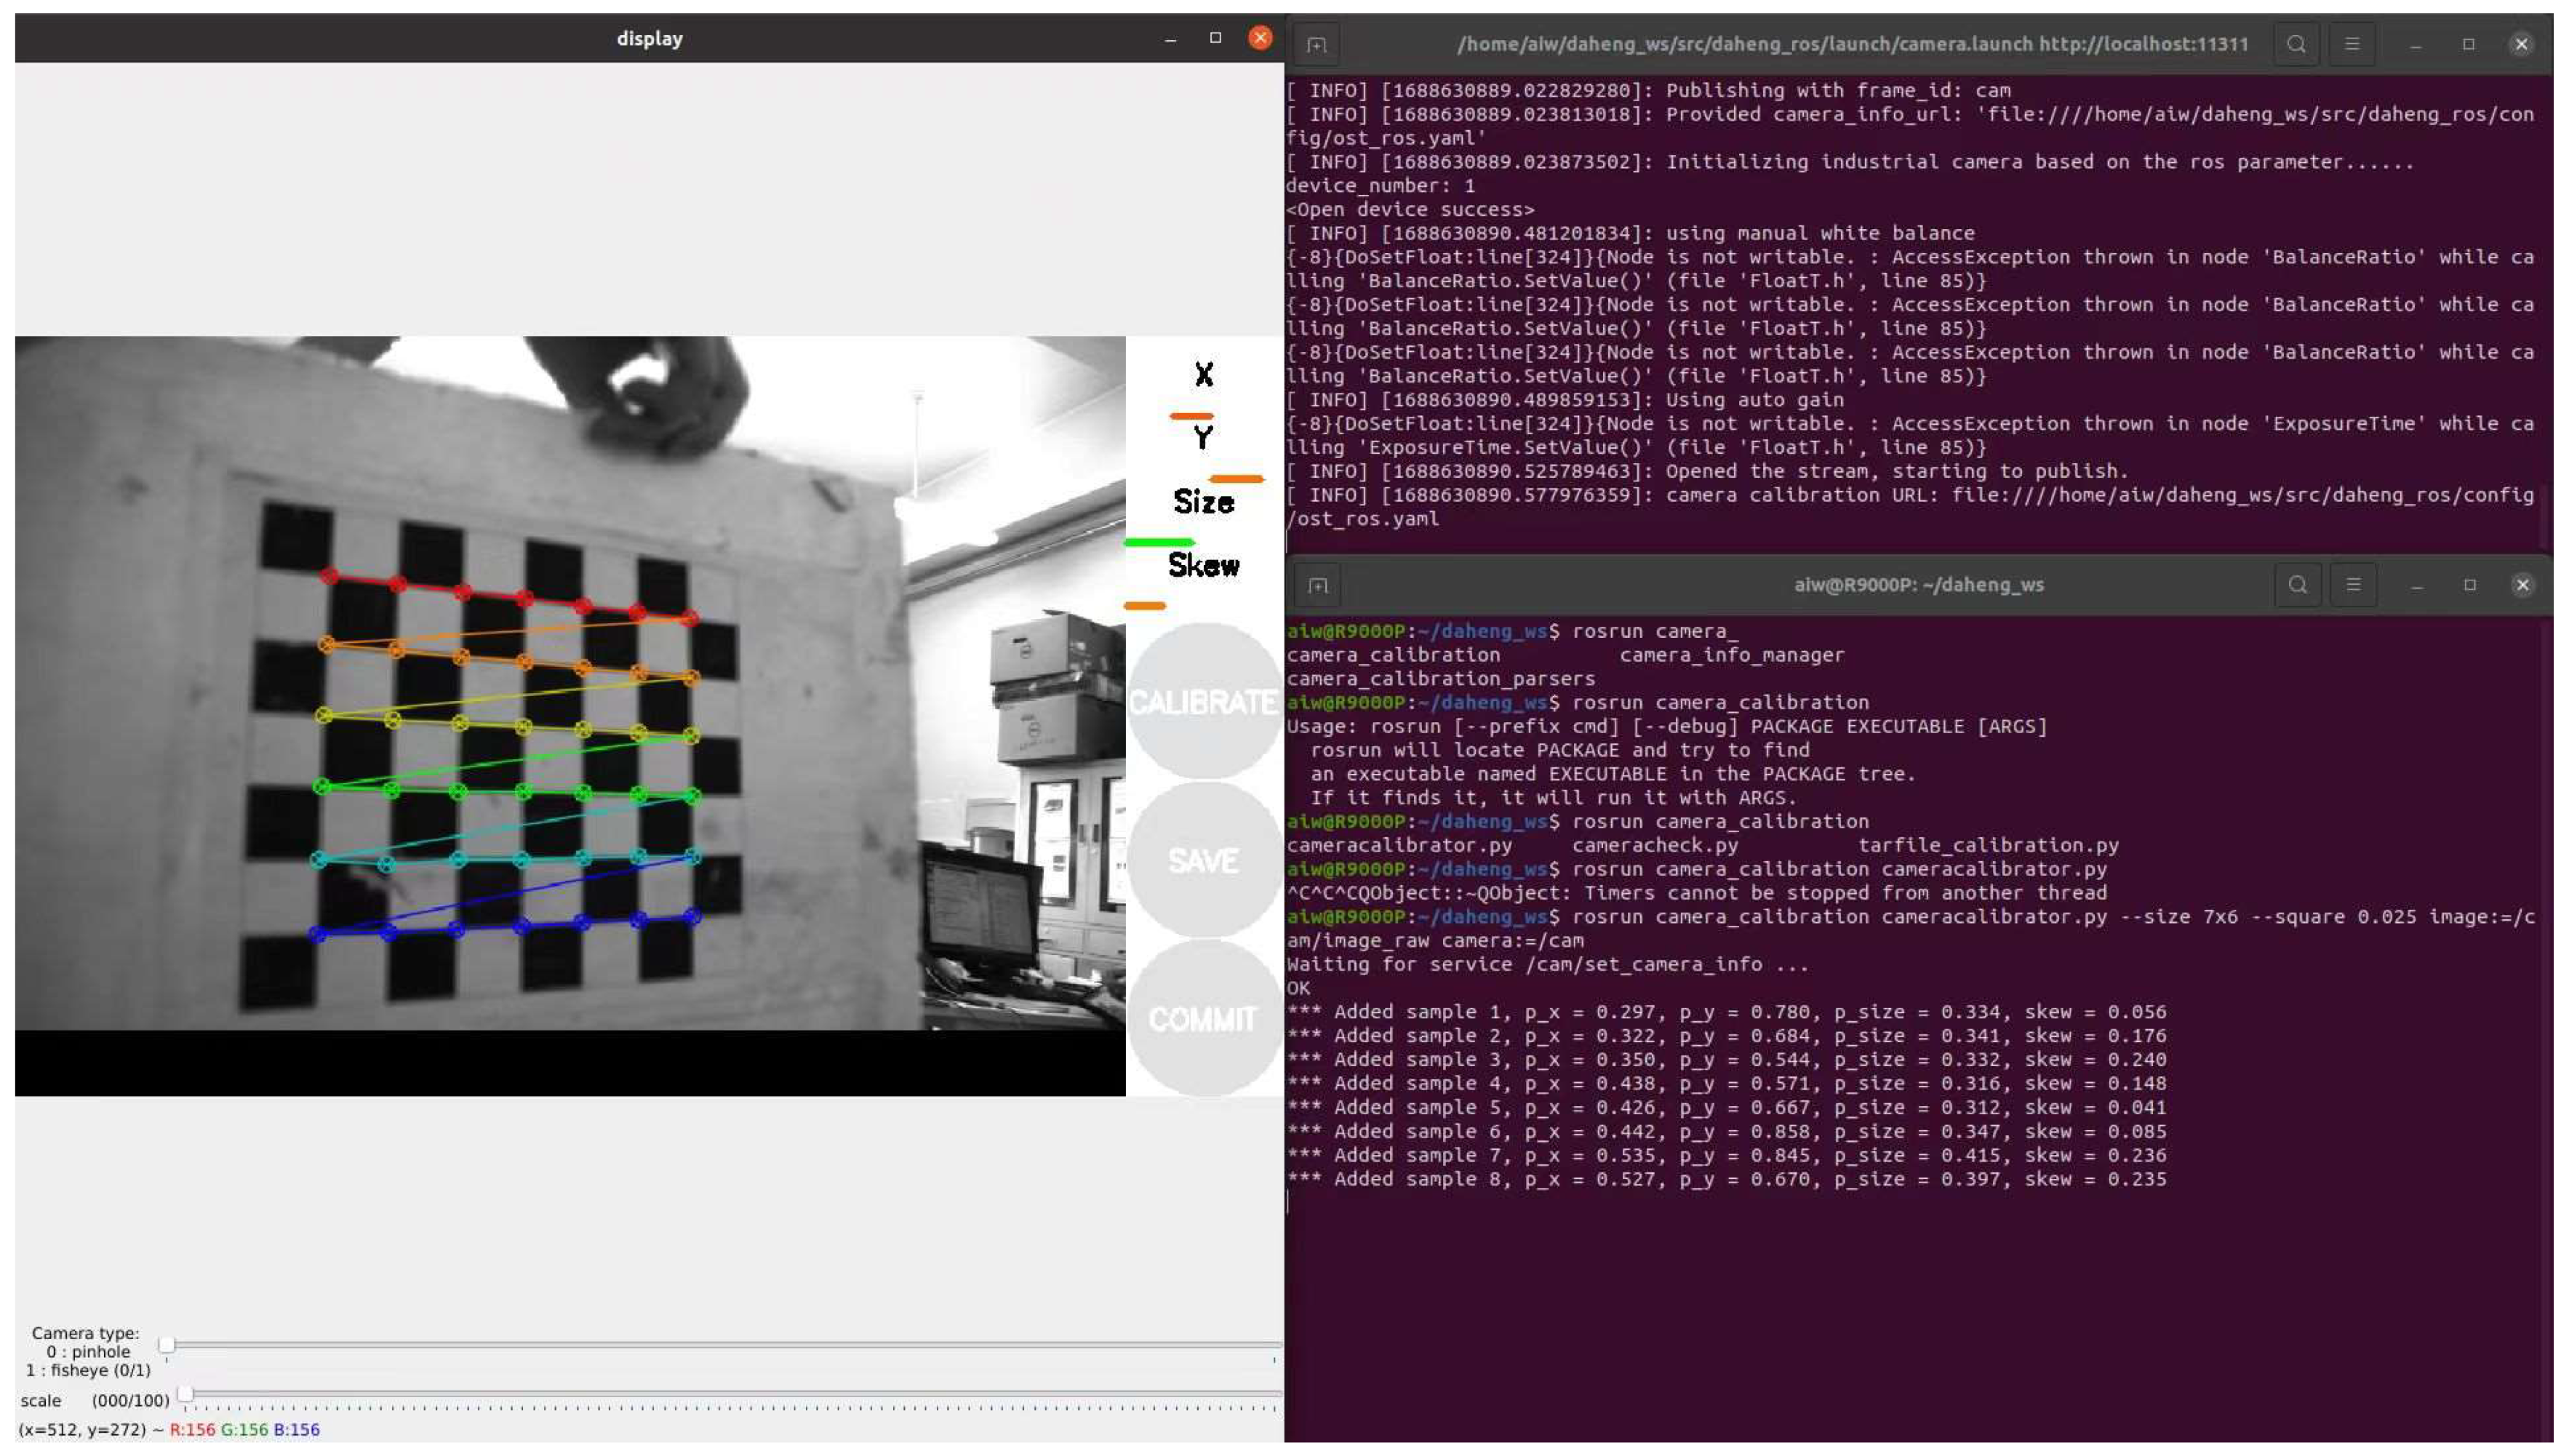
Before using a camera as an image sensor, the calibration of the camera is necessary. For the calibration of a monocular camera, Zhang’s calibration method is used, with a standard international chessboard black-and-white grid calibration board. First, a square grid with alternating black and white squares is made, with each square’s edges having a length of 25 cm. The number of black and white squares should not be too small, as the camera will detect the corners where the black and white squares meet during calibration. The length of the corner points is set to 7 and the width to 6, as shown in the figure. After the calibration board is made, it is printed on A3 paper and fixed on the board. When pasting, it is important to ensure that the paper is as flat as possible and adheres to the calibration board. The images used for camera calibration are shown in Figure 6.
The calibration of the monocular camera in this article was conducted under the ROS operating system in the Linux system. The calibration of the monocular camera was implemented using the camera calibration function package under the ROS operating system. After opening the function package, the calibration interface was entered, and the black-and-white chess-grid calibration board was slowly moved from left to right, from top to bottom and from far to near in front of the camera. Calibration is complete when the button CALIBRATE on the right side of the calibration interface turns green. Finally, SAVE is clicked to save the calibration results. Then, the calibration results are extracted and the configuration file of the camera driver is added to. Afterward, the camera driver is started to receive real-time captured image information from the camera. The camera-calibration process is shown in Figure 7:
The camera-captured data are published in the form of ROS topic through rospy. Publisher. The algorithm can subscribe to the camera-captured image data through rospy. Subscriber. However, the image data received through ROS cannot be directly processed by the algorithm. Therefore, cv_bridge is used to convert the image data in the ROS format to the OpenCV image format. With this, the camera sensor completed the acquisition of image data, and the algorithm completed the processing of the image data.
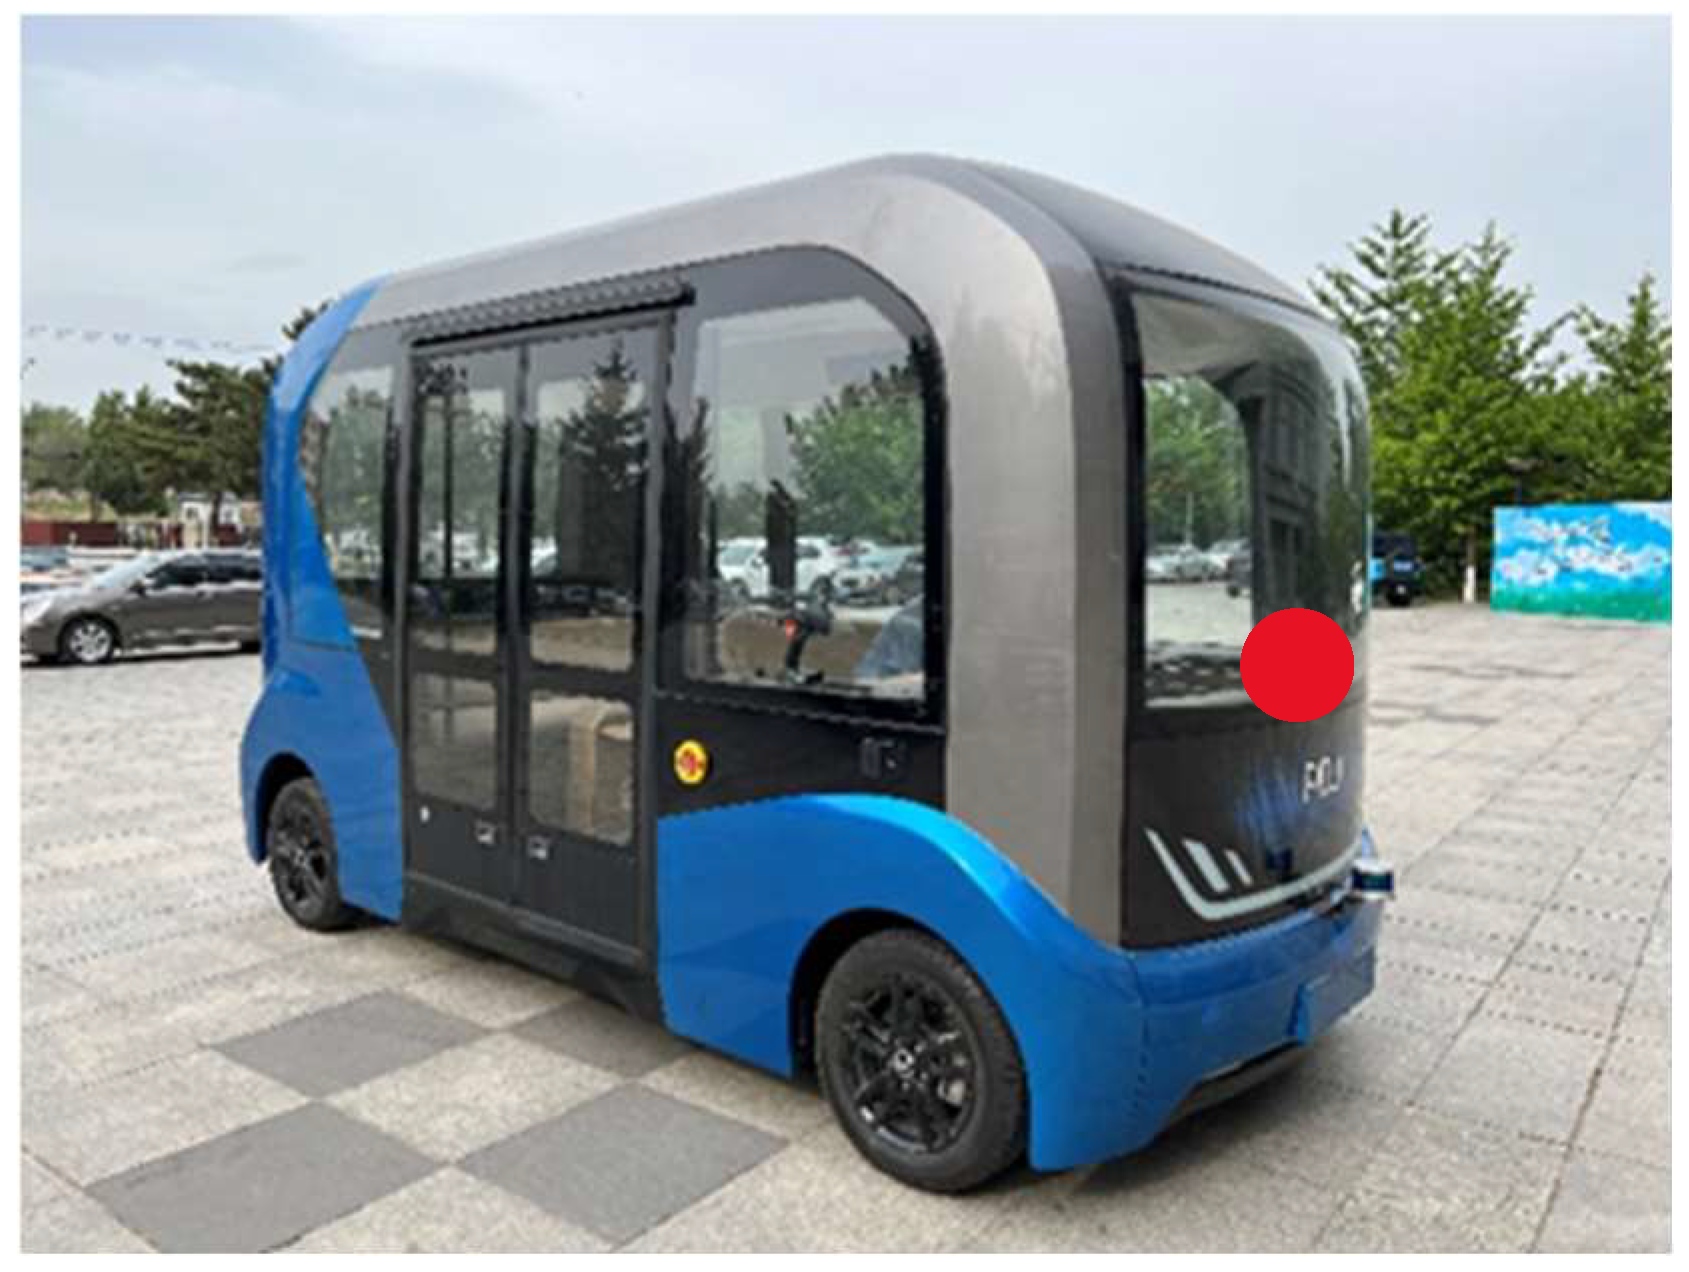
The placement of the camera sensor is shown in Figure 8.

4. Experimental Results

4.1. Experimental Results and Analysis of YOLOP-E and YOLOP

In terms of the training parameters, the training epoch was set to 100, and the training batch size was 32. The graph shows the mAP50 curve of YOLOP and YOLOP-Efficient obtained from the object-detection training. The vertical axis represents the map value, and the horizontal axis represents the number of iterations. Comparing the two curves shows that after training for more than 30 iterations, the optimized algorithm’s mAP50 and mIoUcurve are always higher than those of the YOLOP algorithm, indicating that the algorithm proposed in this article has better detection accuracy. The results are shown in Figure 9.

4.2. Comparative Experiments with other Algorithms

To verify the effectiveness of the optimized algorithm, comparative experiments are conducted on the BDD100K dataset to evaluate the performance of the proposed algorithm in two respects, object detection and lane line segmentation, compared with other algorithms. We selected some networks dedicated to a single task for comparison with our network. YOLOv5 is a single-stage network that has achieved state-of-the-art performance on the COCO dataset. EfficientDet is an efficient and accurate object-detection algorithm that uses BiFPN and a new Compound Scaling method to reduce the model size [21]. ENet is a lightweight semantic segmentation algorithm. SCNN is a convolutional neural network used for road scenes that can perform the pixel-level semantic segmentation of roads. We retrained the above networks on the BDD100k dataset and compared them with our network on object detection and lane segmentation tasks. The results are as follows (Table 2 and Table 3).
Based on the above comparison, it can be concluded that our algorithm performs better than lightweight algorithms such as EfficientDet and YOLOV5-m in terms of detection accuracy, but slightly worse in terms of detection speed. For the lane-segmentation task, the detection speed is lower than that of ENet and higher than that of SCNN. However, the accuracy is higher than both of them.

4.3. Real Vehicle Verification and Ablation Experiments

The groups consisted of (1) the original YOLOP model, (2) EfficientnetV2 replacing the backbone model, (3) replacing the CA attention mechanism on the basis of (2), (4) replacing the CIoU Loss of the original YOLOP model with Focal EIoU Loss, (5) on the basis of (3), replacing the CioU Loss with Focal EIoU Loss and replacing the Cross-Entropy Loss with Smoothed Cross-Entropy Loss. Please refer to Table 4 for specific experimental results.
Table 4 shows that our proposed algorithm performs best in terms of all metrics except the parameter volume. Replacing the YOLOP model’s Backbone with EfficientNetv2-s reduces 36.6% of its parameter volume and increases FPS by 20. However, this also causes a decrease in model accuracy. The CBAM attention mechanism and the Focal-EIoU loss and smoothed cross-entropy loss improve detection accuracy, particularly during real-car verification. Model (3) was found to improve the mAP50 value and mIoU of the original algorithm by 2.7% and 1.6%, respectively, indicating its usefulness for algorithm optimization. Furthermore, Models (2) and (3) demonstrate the significant improvement in model accuracy with the CBAM coordinate attention mechanism. Our proposed algorithm exhibits a 3.5% increase in mAP50, a 4.1% increase in mIoU, and a 25.4 f/s increase in detection speed compared to the YOLOP algorithm during real-car verification while reducing parameter volume by 34.9%.

4.4. Detection Performance

From the results, it can be observed that the final algorithm proposed in this paper is optimal in terms of the above indicators. The actual operating results and the comparison of the detection effects of the areas where the lane lines are blurred before and after optimization are shown in Figure 10.
From the above pictures, it can be seen that the optimized model has good detection performance in the real vehicle experiment and can meet the requirements of collecting and outputting environmental perception information for mini-buses.

5. Conclusions

This paper proposes a lightweight algorithm called YOLOP-E, based on the YOLOP algorithm, to achieve lane-keeping and obstacle-avoidance functions for driverless mini-buses in industrial areas. By replacing the original complex network structure with a lightweight network structure, the complexity and computational load of the network are reduced. To address the performance-degradation issue caused by using a simplified network, new attention mechanisms and loss functions are adopted. The optimized algorithm was compared with other algorithms on the BDD100K dataset, and it can be observed that YOLOP-E achieves better accuracy compared to the benchmark algorithms. Additionally, the FPS metric also meets the real-time requirement. Furthermore, comprehensive experiments were conducted on an actual mini bus to evaluate YOLOP-E. Compared to the original algorithm, the optimized algorithm outperforms in terms of FPS, mAP50, mIoU, and model size, addressing the issues of poor real-time performance and ineffective detection of fuzzy lane markings that the algorithm encountered during operation.
Despite the significant improvement in the detection accuracy and the real-time performance of the optimized algorithm, we still hope to further reduce the model size in the future by employing techniques such as model pruning or compression distillation. Additionally, we aim to enhance the detection accuracy of the model using other methods, enabling it to perform real-time detection on devices with lower computational capacity, such as embedded chips.

Author Contributions

Conceptualization, Y.L. and G.L.; methodology, Y.L.; software, Y.L.; validation, Y.L. and G.L.; formal analysis, Y.L.; investigation, Y.L.; resources, G.L.; data curation, Y.L. and Q.Y.; writing—original draft preparation, Y.L. and L.H.; writing—review and editing, Y.L. and G.L.; visualization, Y.L. and D.Z.; supervision, G.L.; project administration, G.L.; funding acquisition, G.L. All authors have read and agreed to the published version of the manuscript.

Funding

This work was supported by the Liaoning Provincial Natural Fund Grant Program Project, by the Department of Education of Liaoning Province and the Science and Technology Department of Liaoning Province (2022-MS-376); Higher Education Institutions’ Overseas Training Program Sponsored by the Department of Education of Liaoning Province (2018LNGXGJWPY-YB014).

Data Availability Statement

The data used to support the findings of this study are available from the corresponding author upon request.

Conflicts of Interest

The authors declare no conflict of interest.

References

  1. Girshick, R. Fast R-CNN. arXiv 2015, arXiv:1504.08083. [Google Scholar]
  2. Liu, W.; Anguelov, D.; Erhan, D.; Szegedy, C.; Reed, S.; Fu, C.-Y.; Berg, A.C. SSD: Single Shot MultiBox Detector. In Proceedings of the Computer Vision–ECCV 2016: 14th European Conference, Amsterdam, The Netherlands, 11–14 October 2016; Springer International Publishing: Berlin, Germany; pp. 21–37. [Google Scholar]
  3. Luo, H.; Gao, F.; Lin, H.; Ma, S.; Poor, H.V. YOLO: An Efficient Terahertz Band Integrated Sensing and Communications Scheme with Beam Squint. arXiv 2023, arXiv:2305.12064. [Google Scholar]
  4. Paszke, A.; Chaurasia, A.; Kim, S.; Culurciello, E. ENet: A Deep Neural Network Architecture for Real-Time Semantic Segmentation. arXiv 2016, arXiv:1606.02147. [Google Scholar]
  5. Pan, X.; Shi, J.; Luo, P.; Wang, X.; Tang, X. Spatial As Deep: Spatial CNN for Traffic Scene Understanding. arXiv 2017, arXiv:1712.06080. [Google Scholar] [CrossRef]
  6. Wu, D.; Liao, M.-W.; Zhang, W.-T.; Wang, X.-G.; Bai, X.; Cheng, W.-Q.; Liu, W.-Y. YOLOP: You Only Look Once for Panoptic Driving Perception. Mach. Intell. Res. 2022, 19, 550–562. [Google Scholar] [CrossRef]
  7. Bochkovskiy, A.; Wang, C.-Y.; Liao, H.-Y.M. YOLOv4: Optimal Speed and Accuracy of Object Detection. arXiv 2020, arXiv:2004.10934. [Google Scholar]
  8. He, K.; Zhang, X.; Ren, S.; Sun, J. Spatial Pyramid Pooling in Deep Convolutional Networks for Visual Recognition. Comput. Vis. {ECCV} 2014, 346–361. [Google Scholar] [CrossRef] [Green Version]
  9. Lin, T.-Y.; Dollár, P.; Girshick, R.; He, K.; Hariharan, B.; Belongie, S. Feature Pyramid Networks for Object Detection. arXiv 2017, arXiv:1612.03144. [Google Scholar]
  10. Liu, S.; Qi, L.; Qin, H.; Shi, J.; Jia, J. Path Aggregation Network for Instance Segmentation. arXiv 2018, arXiv:1803.01534. [Google Scholar]
  11. Tan, M.; Le, Q. EfficientNetV2: Smaller Models and Faster Training. arXiv 2021, arXiv:2104.00298. [Google Scholar]
  12. Gupta, S.K.; Hiray, S.; Kukde, P. Spoken Language Identification System for English-Mandarin Code-Switching Child-Directed Speech. arXiv 2023, arXiv:2306.00736. [Google Scholar]
  13. Howard, A.G.; Zhu, M.; Chen, B.; Kalenichenko, D.; Wang, W.; Weyand, T.; Andreetto, M.; Adam, H. MobileNets: Efficient Convolutional Neural Networks for Mobile Vision Applications. arXiv 2017, arXiv:1704.04861. [Google Scholar]
  14. Huang, H.; Chen, Z.; Zou, Y.; Lu, M.; Chen, C. Channel prior convolutional attention for medical image segmentation. arXiv 2023, arXiv:2306.05196. [Google Scholar]
  15. Woo, S.; Park, J.; Lee, J.-Y.; Kweon, I.S. CBAM: Convolutional Block Attention Module. arXiv 2018, arXiv:1807.06521. [Google Scholar]
  16. Chu, Y.; Li, P.; Bai, Y.; Hu, Z.; Chen, Y.; Lu, J. Group channel pruning and spatial attention distilling for object detection. Appl. Intell. 2022, 52, 16246–16264. [Google Scholar] [CrossRef]
  17. Zheng, Z.; Wang, P.; Ren, D.; Liu, W.; Ye, R.; Hu, Q.; Zuo, W. Enhancing Geometric Factors in Model Learning and Inference for Object Detection and Instance Segmentation. arXiv 2021, arXiv:2005.03572. [Google Scholar] [CrossRef] [PubMed]
  18. Zhang, Y.-F.; Ren, W.; Zhang, Z.; Jia, Z.; Wang, L.; Tan, T. Focal and Efficient IOU Loss for Accurate Bounding Box Regression. arXiv 2022, arXiv:2101.08158. [Google Scholar] [CrossRef]
  19. Wang, Y.; Ma, X.; Chen, Z.; Luo, Y.; Yi, J.; Bailey, J. Symmetric Cross Entropy for Robust Learning with Noisy Labels. arXiv 2019, arXiv:1908.06112. [Google Scholar]
  20. Yu, F.; Xian, W.; Chen, Y.; Liu, F.; Liao, M.; Madhavan, V.; Darrell, T. Bdd100k: A diverse driving video database with scalable annotation tooling. arXiv 2018, arXiv:1805.04687. [Google Scholar]
  21. Tan, M.; Pang, R.; Le, Q.V. EfficientDet: Scalable and Efficient Object Detection. arXiv 2020, arXiv:1911.09070. [Google Scholar]
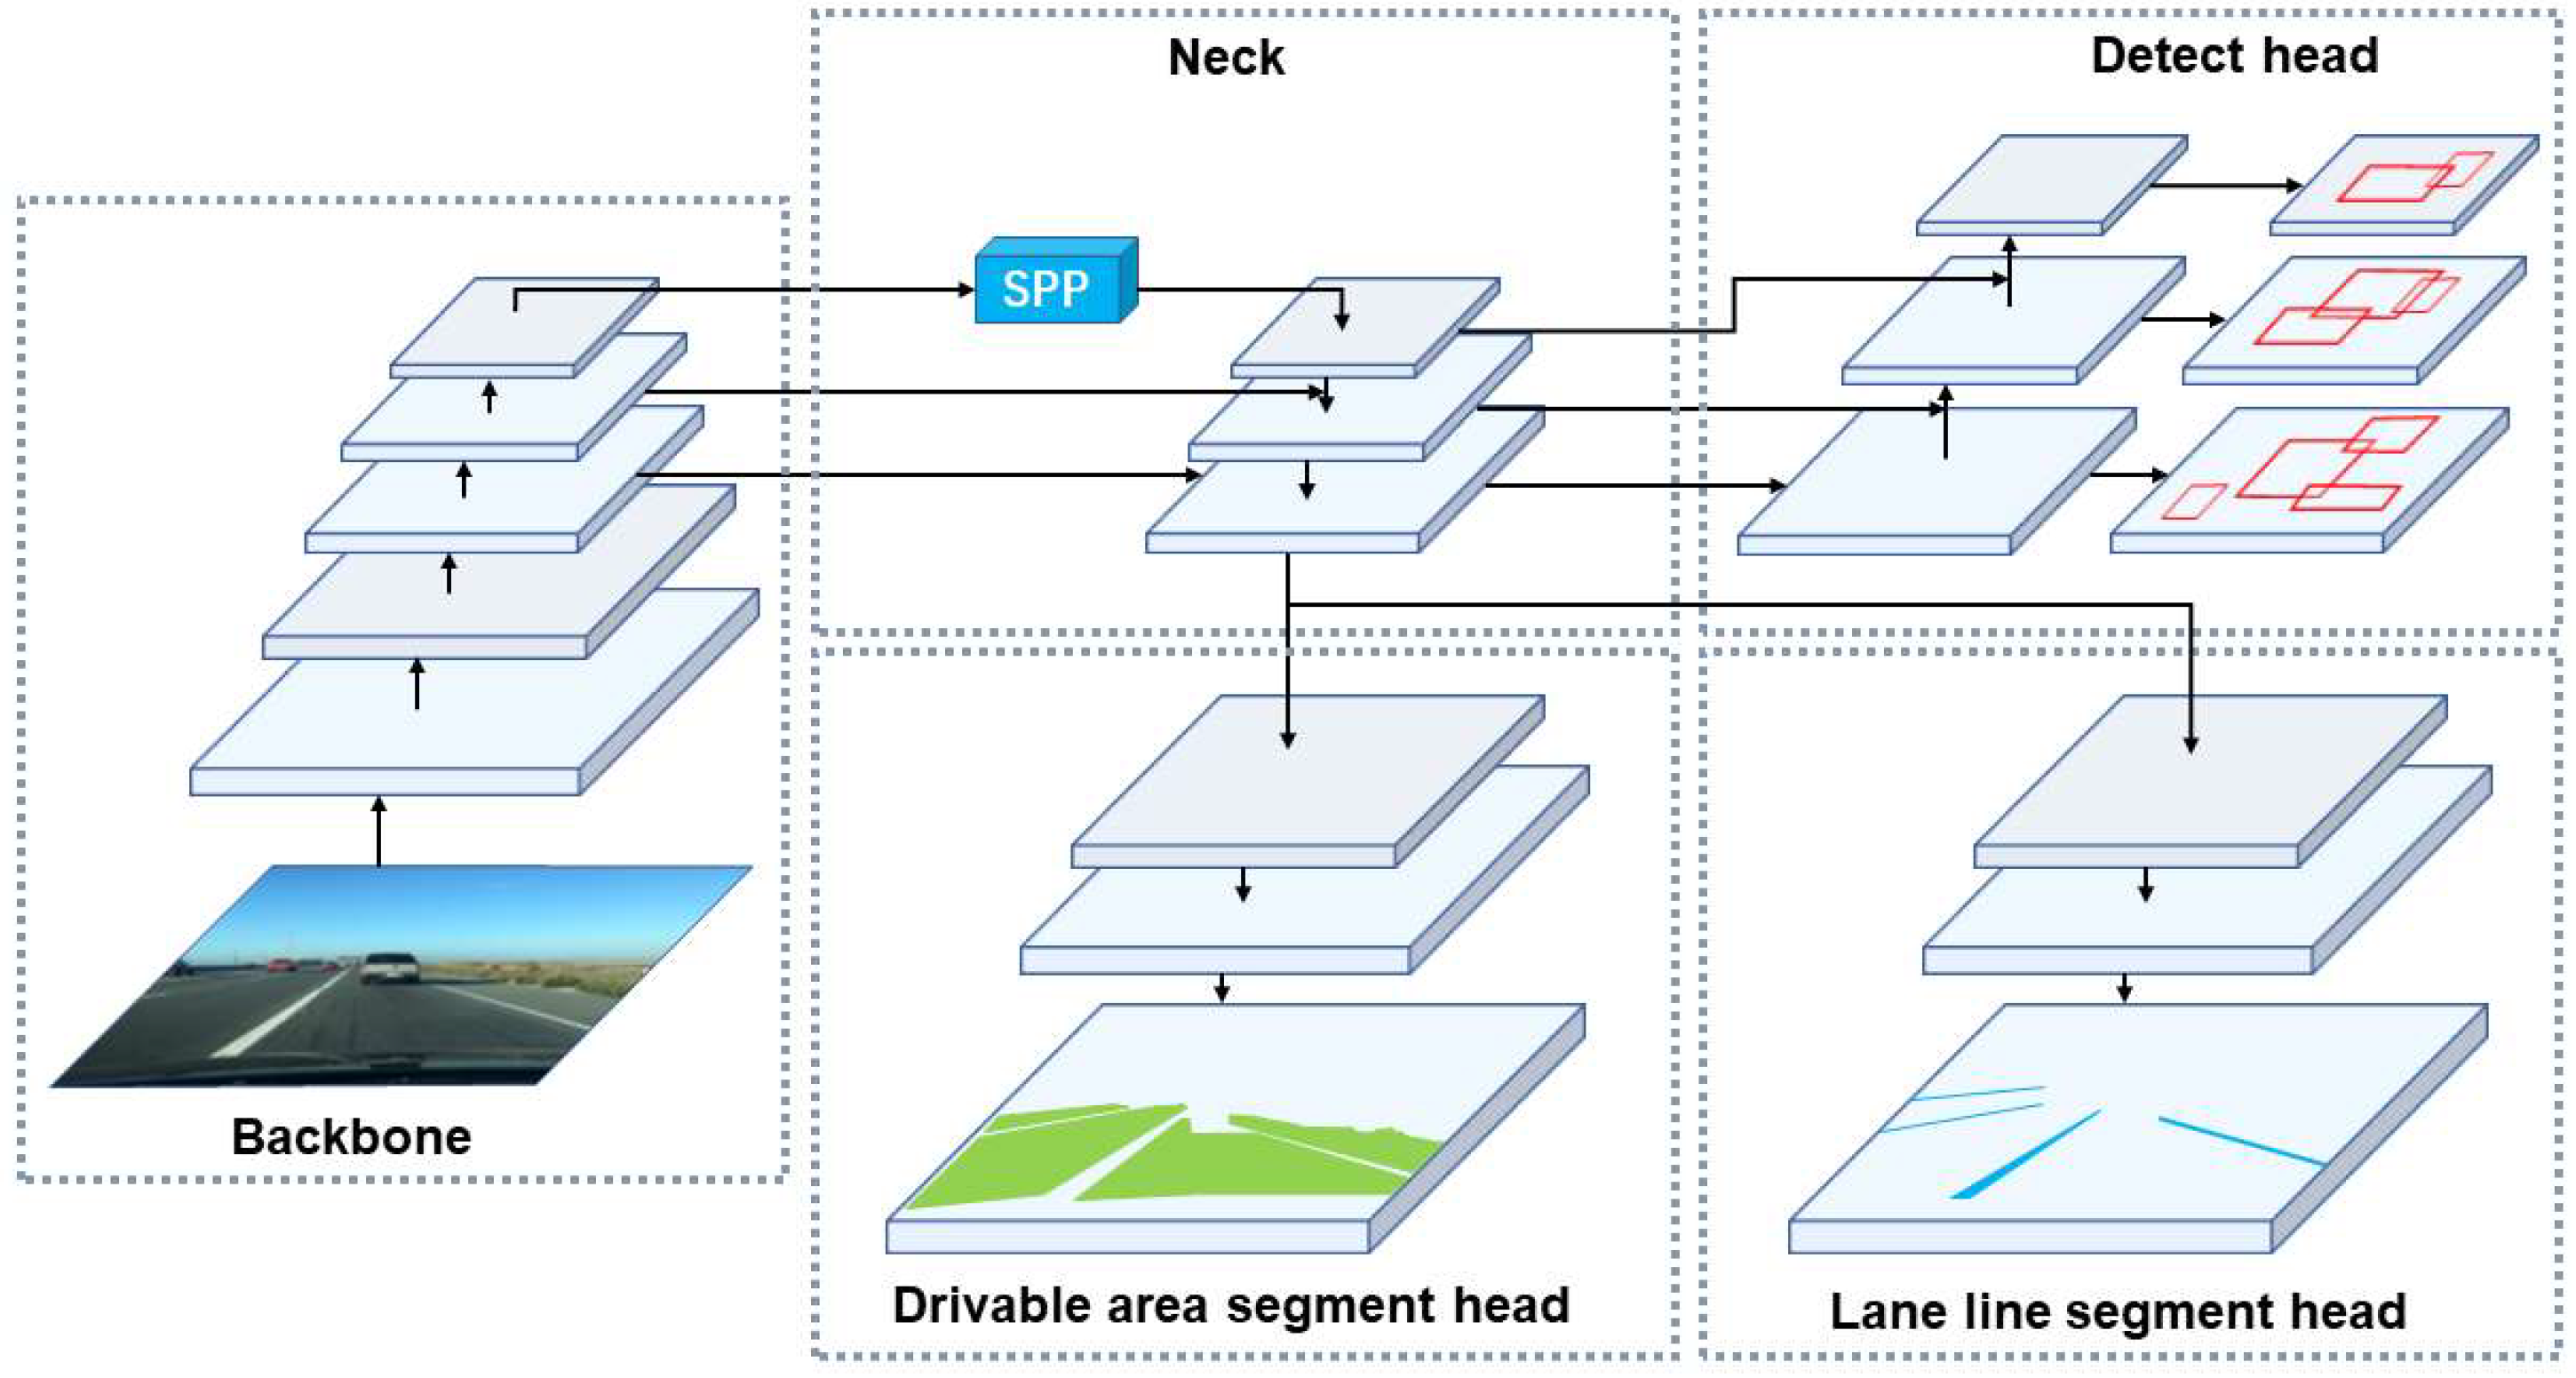
Figure 1. YOLOP neural network architecture.
Wevj 14 00179 g001
Figure 2. Backbone architecture. Old (left); new (right).
Wevj 14 00179 g002
Figure 3. Attention mechanism of CBAM.
Wevj 14 00179 g003
Figure 4. MBConv module architecture (left), FMBConv module architecture (right). (The arrow indicates the direction of convolutional operation propagation within a block, while the symbol on top represents the repetition of the previous process.).
Wevj 14 00179 g004
Figure 5. Areas with unclear lane lines.
Wevj 14 00179 g005
Figure 6. Chess board calibration board picture.
Wevj 14 00179 g006
Figure 7. Monocular camera calibration.
Wevj 14 00179 g007
Figure 8. Electric Autonomous Mini-buses. (The red point is the placement of the camera sensor.)
Wevj 14 00179 g008
Figure 9. Model comparison after training for 100 epochs. YOLOP-E (red), YOLOP (blue). (a) mAP50 of object detection. (b) mIoU of lane lines segmentation.
Wevj 14 00179 g009
Figure 10. Comparison of the final detection results in areas with unclear lane lines. (a) YOLOP. (b) YOLOP-E.
Wevj 14 00179 g010
Table 1. Camera MER2-502-79U3M parameters.
Key ParametersParameter Values
Resolution2448 × 2048
Minimum pixel size3.45 μm × 3.45 μm
Storage temperature−20–70 °C
Operating temperature0–45 °C
Operating humidity10–80%
Table 2. Comparison of object detection with other models.
FPS (f/s)mAP50 (%)Params (M)
YOLOv5-m7375.318.4
EfficientDet87.572.418.2
Ours (det only)69.479.426.4
Table 3. Comparison of lane line segmentation with other models.
FPS (f/s)mIoU (%)Params (M)
ENet8335.218.4
SCNN22.637.648.2
Ours (sgt only)61.373.726.4
Table 4. Results of ablation experiments.
FPS (f/s)mAP50 (%)mIoU (%)Params (M)
YOLOP16.276.570.542.4
Efficientnet backbone36.272.462.426.9
CBAM Attention mechanism34.477.271.227.2
Focal EIoU Loss and SCE Loss19.278.671.642.7
Ours41.679.273.427.6
Disclaimer/Publisher’s Note: The statements, opinions and data contained in all publications are solely those of the individual author(s) and contributor(s) and not of MDPI and/or the editor(s). MDPI and/or the editor(s) disclaim responsibility for any injury to people or property resulting from any ideas, methods, instructions or products referred to in the content.