Abstract
The growing use of DC/DC power converters has resulted in the requirement that their complex controllers be cheaper and smaller, thus using cost-effective implementations. For this purpose, it is necessary to decrease the computational burden in controller implementation to minimize the hardware requirements. This manuscript presents two methods for tuning an adaptive linear–quadratic–Gaussian voltage controller for a battery charger/discharger, implemented with a Sepic/Zeta converter, to work at any operating point. The first method is based on a lookup table to select, using the nearest method, both the state feedback vector and the observer gain vector, solving the Riccati’s differential equation offline for each practical operating point. The second method defines a polynomial function for each controller element that is based on the previous data corresponding to the system operating points. The adaptability of the two controllers to fixed voltage regulation and reference tracking was validated using simulations and experimental tests. The overshoot and settling time results were lower than 11% and 3.7 ms, which are in the same orders of magnitude of a control approach in which the equations are solved online. Likewise, three indices were evaluated: central processing unit capacity, cost, and performance. This evaluation confirms that the controller based on polynomial interpolation is the best option of the two examined methods due to the satisfactory balance between dynamic performance and cost. Despite the advantages of the controllers in being based on a lookup table and polynomial interpolation, the adaptive linear–quadratic–Gaussian has the benefit of not requiring an offline training campaign; however, the cost saving obtained with the lookup table controllers and polynomial interpolation controllers, due to the possible implementation on small-size microcontrollers with development tool simple and easy maintenance, will surely be desirable for a large number of deployed units, ensuring that those solutions are highly cost-effective.
1. Introduction
Power processing is the most critical activity in electric and electronic systems, and one device most used for this purpose is the DC/DC power converter. Power converters are used to drive DC sources, storage devices, and loads. Moreover, power converters require a controller for safely performing power processing tasks. Due to the wide range of controllers reported in the literature, evaluating functional and non-functional characteristics to choose the most suitable one for an industrial system is of significant relevance [1].
It is crucial to have performance criteria for controllers because they provide an objective way to assess the quality of their work. The evaluation criteria for DC/DC power converter controllers include factors such as precision of voltage regulation, system stability, efficiency, load-carrying capacity, and dynamic response [2,3,4,5]. They can also have advanced features such as overcurrent and overvoltage protection to ensure safe and reliable system operation. Moreover, some non-functional characteristics such as size, cost, and computational burden should be considered.
The viability of implementing a solution in control theory is a problem that can be solved if an algorithm with moderate computational requirements exists [6]. The moderate computational requirements mean that the computational resources (fundamentally processor and memory) that need to solve the problem are within the acceptable costs. Being inside these limits facilitates implementation and helps in reaching the system performance specifications [7]. The acronyms used here are summarized in Table 1.

Table 1.
Acronyms.
The high complexity of the current systems requires the development of advanced control strategies to achieve the performance demanded by the application. These control strategies, in turn, require devices with high power processing, thus raising energy consumption and increasing the heat dissipation and costs. In order to develop cheaper solutions, with small and efficient implementations, it is necessary to reduce the computational burden of the control strategies without significantly impacting the response accuracy; for this, it is useful to simplify the models to reduce the number of differential equations, replace some dynamic equations with lookup tables, linearize some nonlinear relations, or eliminate redundant calculations. In the particular case of power converter control, strategies frequently used, apart from classical proportional–integral–derivative (PID) topologies, are model predictive control (MPC), robust control, and adaptive control, whose implementations are generally complex and produce a significant computational burden. Some works found in reviews of the state of the art implement those controllers, but there are few reported attempts to reduce the computational burden.
For example, in [8], the computational burden of a conventional finite control set MPC applied to a T-type 3P-3L (three-phase three-level) converter is reduced by implementing three improvements: a better optimization method to determine the vector for current tracking without vector enumeration; an algorithm for capacitor charge balance with the aim of obtaining the vector for neutral point potential balance, thus eliminating weight factor; and, finally, introducing a hybrid vector output mode to give full consideration to current tracking and neutral point potential balance. With these changes in the algorithm, it an improvement factor of 1.6 was achieved in the execution time of the implementation with C-language on the DSP TMS320F28335. However, although the system performance is improved in the solution, the complexity and processor requirements are high. In [9], the authors implemented a finite control set MPC variant, named fast MPC, applied to a multilevel inverter in a photovoltaic system. In this work, the change in the algorithm avoids testing all possible states of the multilevel converter and evaluate a cost function, reducing the six-factor computation time without effecting the dynamic response (the controller was implemented on a TMS320F28335 DSP). However, the finite control set MPC proposed in that work still executes complex operations, such as Lagrange extrapolation, that still overload the processor.
A method that has recently had a huge boom is deterministic artificial intelligence, which has shown tremendous improvement of performance in systems control compared to nonlinear adaptive methods. For example, some works present the control of the DC motor or the actuator of an unmanned underwater vehicle, where it is evident that the performance improvements are not due to the coefficient estimation but to the modeling methods [10] and the discretization [11,12,13,14]. This is why the deterministic artificial intelligence method is highly recommended for applications that require high levels of accuracy, consistency, and precision, such as in power electronics, although in the reviewed works, the controller does not directly control the DC motor driver, namely the power converter. However, these works do not report performance metrics related to computational burden.
A sliding mode controller that requires a processor with high performance is presented in [15]. The strategy consists of an adaptive-gain/super twisting sliding mode controller applied to two electro-pneumatic actuators, which is a slow system. This work does not evaluate the computational complexity; however, it requires a DS1104 board from DSpace to implement the control law, which is a costly device. Other works show some practical applications utilizing bidirectional buck–boost converters: a high-gain sliding controller in a supercapacitor in [16], a sliding-mode controller of the electro-mechanical actuator current of an aircraft powered by a supercapacitor in [17], and in [18,19,20,21,22,23], a current sliding-mode controller accompanied by supervisory control that carries the charge state of the battery, its charge/discharge current, the regulation of the high-voltage side, or maximizes generator current. These works highlight the advantages of these nonlinear controllers, but they do not feature their requirements for hardware, lower [19] when implemented using an M4 processor, nor their computational burden.
A methodology for combined design of controllers, both adaptive and linear quadratic regulator (LQR), is presented in [24]. The adaptive controller portion deals with the unknown dynamics of the plant. At the same time, the LQR control, based on a Kalman filter, is used to minimize the effects of the external disturbances. Unfortunately, this work only shows simulations without experimental validation, and there are neither simplifications nor strategies that could decrease the computational burden. Similarly, proposed in [25] is a combination of adaptive and LQR control for a grid-connected inverter. The current control is frequency-adaptive, while the optimal LQR selects desirable gains for the full-state feedback controller and full-state observer. However, the computational burden of the implementation is high, requiring a DSP TMS320F28335 with a sampling period of 100 s, which is after decreasing the computational requirements by designing a discrete-time observer in the stationary reference frame.
A useful strategy to significantly reduce the computational burden is to perform any optimization process offline; this is, for example, defining the controller adjustments in several operation points before the dynamic behavior takes it there. Therefore, when the system evolves to one of those operations points, the controller parameters must be selected from a table and not dynamically calculated. This solution is reported in some practical cases. For example, the use of a lookup table for power converter control is reported in [26]; this work proposes two new lookup table methods for a three-level AC/DC converter supplied from the grid. The first method improves the nonlinear direct power control by rotating the orientation of the coordinates; the second method is an improvement of the first in which a new optimal division of the current error plane is introduced, which allows for better voltage vector assignment. Another example is reported in [27], which proposes a direct power control strategy using a switching table that can simultaneously control both active and reactive power in an electrical grid. It uses an extended p-q theory better suited for unbalanced grid voltages than the original p-q theory. The extended p-q theory is combined with voltage-oriented control to mitigate the influence of grid voltage unbalances. Nevertheless, the disadvantages of direct power control are evident: small scalability, requirement for high synchronization, does not work well with interference, and limited range [28,29].
Adaptive lookup table-based variable on-time control is proposed in [30] for critical mode boost power factor corrector converters, which combines the advantages of both the conventional lookup table method and the real-time calculation method. The paper realizes the adaptability of proposed control within the universal AC input, and the entire load range through a simple linear calculation. Furthermore, the proposed controller reduces the required memory space for variable on-time tables and significantly shortens the computation time, leading to low system cost.
In general, the parameters of PID controllers for nonlinear industrial systems are dynamically tuned using lookup tables. A method based on a cost function to tune the lookup table parameters used in gain-scheduled PID control is proposed in [31], where the L2 norm is adopted to prevent overlearning. This strategy allows the controller to work at any operation point.
Presented in [32] is a lookup table of maximun power point tracking (MPPT) algorithm for boost converters in photovoltaic systems, which has lower accuracy than a perturbed and observer (P&O) algorithm but a better response to sudden changes in temperature or irradiance. Instead, the works reported in [33,34] describe a digital PID for regulating the voltage on class E buck–boost converter and buck converter, respectively. The compensator is based on a lookup table and implemented with multi-phase digital pulsewidth modulation.
Lookup tables are also used in MPC implementations. For example, ref. [35] proposes an offline optimization and online lookup table for a two-layer model predictive control to reduce the computational burden. The work examines the properties of computation complexity, steady-state operation, and robustness of the proposed strategy through detailed simulations.
Although the works reported in [26,27,28,29,30,31,32,33,34,35] use controllers based on a lookup table, none is applied on an adaptive LQR controller nor for a Sepic/Zeta converter-like charger/discharger battery.
A longitudinal movement/optimal controller for heavy-duty vehicles is solved offline in [36] using a mixed integer quadratic program. Then, if the position is known, those trajectories can be used as lookup tables to find the reference for both velocity and freewheeling. However, this solution does not directly act on the actuators in the vehicle, limiting its accuracy. Another work that does not involve the actuator was reported [37], in which an adaptive lookup table algorithm is introduced that can accurately and automatically update the static table of an air compressor system. The algorithm has better dynamic performance, such as shorter regulating time and lower overshoot in comparison with the traditional control method (PI + static feedforward strategy).
Presented in this paper are similar strategies to reduce the computational burden of complex controllers applied to battery charger/dischargers. In particular, this works focuses on the battery charger/discharger discussed in [38], which is based on a Sepic/Zeta converter interfacing a battery with the DC bus of a microgrid. The implementation consists of a linear–quadratic–Gaussian (LQG) controller designed to adapt to any operation, with the aim of regulating the DC bus voltage to ensure safe microgrid operation. This controller uses an adaptive law to adjust the controller parameters depending on the operating point; it also requires a full-state observer to reduce the number of sensors, thus reducing the cost. The implementation reported in [38] has a high computational burden due to the online calculation of both the adaptive part and the observer in which a DSP TMS320F28379D is required for experimental deployment.
Therefore, this work proposes using an offline process to calculate the adaptive controller described in [38], thus preserving the required operation range. Two methods were designed to calculate the state matrix, calculate the input matrix, and to solve the Ricatti differential equations: the lookup table method and the polynomial interpolation method. The first method requires calculating the matrices, solving the Ricatti equation once for each operating point, and storing the controller parameters in a lookup table. The second method defines a polynomial function representing the changes in the state feedback vector and the observer gain vector. The polynomial degree is defined to achieve a significantly small root mean square error. Both solutions are evaluated using numerical metrics, circuital simulations, and experimental implementations. Moreover, the performance/cost balance is also analyzed and contrasted with the original implementation reported in [38], which provides a selection guide depending on the charger/discharger requirements in terms of dynamic performance and implementation cost.
This manuscript is divided into five parts: Section 2 presents the power stage and the mathematical model; Section 3 presents the design of the adaptive LQG voltage controller, describing the controller processing using both the lookup table and the polynomial interpolation methods. Section 4 presents a design example and simulation results, and Section 5 reports the experimental validation, comparison, and discussion of the two solutions. Finally, the conclusions of the work are reported in Section 6.
2. Modeling of the Power Stage
The battery charger/discharger based on a bidirectional Sepic/Zeta converter is shown in Figure 1. This charger/discharger circuit is discussed in [38], where deep circuit and mathematical analyses are provided. The variables used for the circuit analysis are summarized in Table 2.
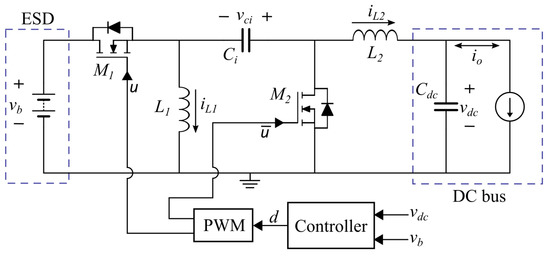
Figure 1.
Sepic/Zeta-based circuital interface for bidirectional power flow.

Table 2.
Variables.
In this circuit, the main objective is to regulate the output voltage , which corresponds to the voltage at the DC bus of a microgrid. In this way, the charger/discharger ensures the safe operation of all the devices connected to the DC bus.
For realistic purposes, the parasitic resistances in both the MOSFETs and inductors are considered for the analysis. A control-oriented model for this charger/discharger circuit is provided in [38]. In summary, the modeling procedure consists of obtaining the differential equations for the inductor currents and capacitor voltages, which are extracted from circuital analyses (charge and volt-second balances). Such a process is performed when the MOSFET control signal has ON () and OFF () states; then, those equations are combined using the control signal u to obtain the following switched model:
It is difficult to use the previous switched model in the design of continuous controllers. Therefore, such a discontinuous model is averaged within the switching period , which is performed by replacing the binary control signal u by the continuous duty cycle d. Moreover, for the sake of simplicity, the ON resistances of the MOSFETs are considered equal (). The resulting averaged model is nonlinear; thus, it is described in terms of small-signal variables in state space representations, which will be used to design the controller. Applying the previous procedure leads to the small-signal model given in (5) and (6), where (state matrix), (input matrix), and (output matrix) must be evaluated in the desired operating point. The quantities , , and are the small-signal changes in the state vector, output, and duty cycle, respectively. Finally, the state vector variables are , , and .
The previous small-signal model is used in the following section to design the controller, aimed at regulating the DC bus voltage in a microgrid.
3. Adaptive LQG Voltage Controller
The controller aims to regulate the DC bus voltage under any operation condition, which are battery charge and discharge and standby modes. Moreover, the control system must remain stable over the entire operating range, and this means for different relations among battery and DC bus voltages. To achieve this performance, a linear–quadratic–Gaussian (LQG) controller with adaptive parameters is proposed. The LQG consists of three fundamental blocks: a linear quadratic integral (LQI) to regulate the DC bus, an optimal state observer to estimate the system states, and a dynamic process to determine the LQG parameters according to the operating point. Two methods are proposed to calculate the parameters values of controller in any operating condition: lookup table and polynomial interpolation.
3.1. LQI Controller Design
The regulation of the DC bus is defined as an optimal control problem, and its analytical design procedure was developed in [38]. In short, the quadratic cost function given in (7) is defined, which is solved using the linear quadratic regulator (LQR) approach [39], and an integrator is added to eliminate the steady-state error.
In Equation (7) r is a positive scalar value, Q is positive matrix, and is the extended state vector resulting from the inclusion of the error integral, named . The state feedback law is defined in (8), where is a gain vector that multiplies the states , and is a scalar that multiplies . Then, the extended system is defined as reported in (9).
The optimization problem is solved using the Hamiltonian matrix, the equation of states and co-states, and the stable state values, all of which are described in [38]. In such a procedure, the optimal value of is calculated as given in (10).
Then, K is defined as (11); to perform the calculation of K, the matrix must be solved from the Riccati differential equation reported in (12).
Finally, this problem is formulated as an optimal regulator of infinite time, hence corresponds to the steady-state solution of (12).
3.2. State Observer
In order to reduce the number of sensors required in the state feedback control system, the observer described by (13) and (14) is used. The design of the observer considers the linear model of the system (5) and (6) and the state feedback control law (8) [40]. The outputs of the observer are the estimated states , and the inputs of the observer are y and d, which correspond to the measured DC bus voltage and the duty cycle, respectively.
The observer gain ℓ is calculated using an optimization process, which guarantees the convergence of the estimated states to the real values. The calculation of ℓ, given in (15), requires solving the Riccati differential equation reported in (16). In such an expression, corresponds to the optimal error covariance matrix of the state observer, and is a scalar used to adjust the convergence speed of the observer states as explained in [41].
3.3. Adaptive Parameters of the LQG Controller
In this section, two adaptive methods to adjust the control parameters under any operating condition are proposed. Unlike the approach presented in [38], which consists of online iterative calculation of the parameters, in this work the parameters are selected from a lookup table or calculated using polynomial interpolation. Since the parameters are calculated offline, both proposed methods require lower computational resources than the method presented in [38], as no online solutions of matrix differential equations are needed.
3.3.1. Adaptive Lookup Table Method
This method consists of calculating both the state feedback vector and the observer gain vector, solving the Riccati’s differential equation offline for each practical operating point ( and combinations). Subsequently, the controller parameters are stored in a lookup table to be inserted into the implementation device. The selection of the parameters from the lookup table consists of searching the closest value (nearest method) according to the measurements of both the bus reference and the battery voltage .
3.3.2. Adaptive Polynomial Interpolation Method
This method consists of defining a polynomial function that represents the variation of each element of both the state feedback and the observer gain vectors, being in agreement with the operating point. This polynomial interpolation is performed using the data calculated in the lookup table method. The order of the polynomial functions is defined in such a way that the root mean square error (RMSE) is significantly small. As a result, after calculating the value of the polynomial coefficients, functions depending on and are obtained for each adaptive parameter, which are subsequently implemented in a control device.
3.4. Structure of the Adaptive LQG Voltage Controller
The control scheme is shown in Figure 2, where the adaptive tuning block provides the matrices of the LGQ controller (), the observer gain (ℓ), and the control parameters (), all according to the operating point (). Then, the LQG controller uses those parameters to calculate the optimal duty cycle d in real time.
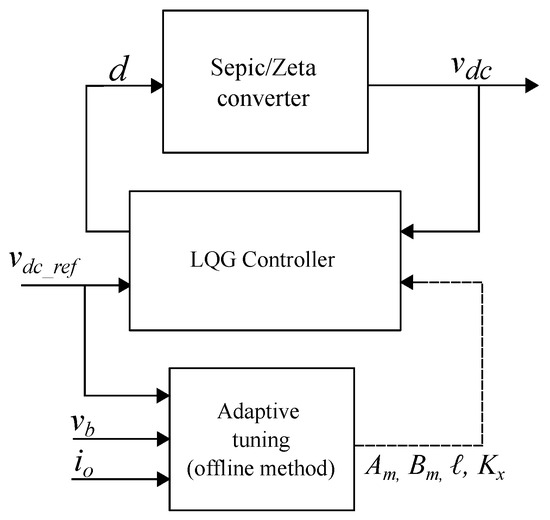
Figure 2.
Structure of the adaptive LQG voltage controller.
4. Design Example and Simulation Results
This section carries out a design example, applying the proposed strategies to reduce the computational burden of adaptive controller implementation and verifying those solutions using detailed circuital simulations. The application example considers a power converter of 26 W, a switching frequency of 40 kHz, and battery and DC bus voltages between 10 and 26 volts. The application also requires a minimum efficiency of , a maximum ripple of on the inductor currents, and a maximum bus voltage ripple of . The converter parameters to achieve those requirements are inductors (, ) of and capacitors (, ) of . Those values are the same ones calculated in the design procedure reported in [38], with the objective of performing a comparison under the same operating conditions.
4.1. Calculation of Controller Parameters
The values of the matrices and of the observer are computed offline using Equation (5) of the state space system. The controller parameters K and ℓ are also calculated offline for both the lookup table and polynomial interpolation methods.
4.1.1. Adaptive Lookup Table
To generate the data for the lookup table, the controller parameters were obtained by varying the battery voltage and the DC bus voltage inside the established operating range. This calculation was performed using the LQR function of the Control System toolbox package from Matlab, and the controller parameters were calculated by varying and every 2 V. The adopted search algorithm is nearest, which returns the value of the table corresponding to the closest data according to the combination of the inputs (, ). The data obtained for this method are reported in Appendix A.
4.1.2. Adaptive Polynomial Interpolation
To establish the polynomial functions that represent the variation of the state feedback vector, polynomial interpolation was performed using the data generated in the lookup table method. Therefore, for each element of the vector, a function of the voltages and is generated. This process was conducted with the Curve Fitter tool from Matlab, which calculates the coefficients according to the polynomial degree selected for the inputs. In this application, the linear least squares method was selected to calculate those coefficients. Moreover, the results show that a fourth order polynomial for the state feedback vector and a third order polynomial for the observer gain vector were sufficient in such a way that a maximum RMSE equal to was obtained. This means that the resulting polynomial functions represent the state feedback vector in the operation range with satisfactory accuracy.
Figure 3 shows an example of the polynomial fit for the third element of the state feedback vector (). It is evident that the resulting surface adequately represents the set of points generated for all the combinations of and in the defined range.
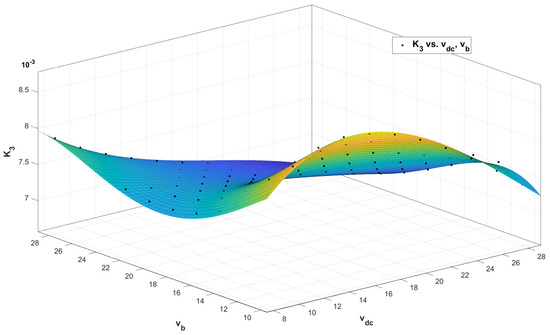
Figure 3.
Fit plot of .
The previous procedure is also executed to calculate the coefficients of the polynomial functions related to the observer gain vector. Figure 4 shows the polynomial fit for the third element of the observer gain vector () as an example, obtaining a surface that adequately represents the variation of this observer parameter. Finally, the polynomials and coefficients for this method are reported in Appendix A.
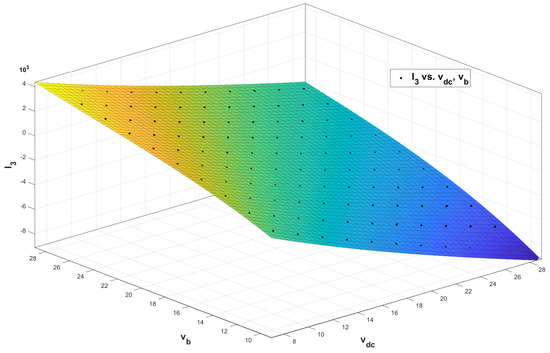
Figure 4.
Fit plot of .
4.2. Simulations Results
The charger/discharger and control system performance in the regulation of the DC bus voltage is tested using circuital simulations. The tests are conducted at multiple operating points within the defined operating range. The simulations were executed in Simulink® from Matlab® using the Simscape™ Electrical™ toolbox [42]. The adaptive parameter methods were implemented using a three-dimensional lookup table (first method), and using Matlab® functions for the polynomial interpolation (second method). The simulations evaluate the solution performance in two scenarios: voltage regulation for a fixed reference value, which is the most common application; and reference tracking, which introduces a strong perturbation to test the system stability.
4.2.1. Bus Voltage Regulation for a Fixed Reference Value
This is the most common operation of any microgrid (fixed DC bus voltage), where the disturbances in the bus are generated by changes in the current (and power) profiles of both the loads and sources connected to the bus. Therefore, the simulations consider a current profile imposing the different modes of operation to the batteries, including charging, discharging, and standby. In addition, the tests are conducted with one and two batteries connected in series to test the scalability of the solution.
The first tests are carried out using the adaptive adjustment method based on the lookup table. Figure 5, Figure 6 and Figure 7 show the performance of the lookup table solution considering a 12 V battery. Those simulation consider step changes in bus current every 50 ms: first, it starts in standby mode ( A), then switches to discharge mode ( A), followed by switching to charge mode ( A), and finally returning to standby mode. The simulations confirm that the adaptive LQG with lookup table provides the desired performance, in terms of voltage regulation, under any battery operating condition. Similarly, such results also illustrate the bus voltage stability in any operation condition. Moreover, the tests also evaluate the solution under different ratios between the batteries and the DC bus voltages (buck, boost, unitary gain), where satisfactory (and stable) performance is also evident. Finally, the lookup table solution does not saturate the duty cycle, thus ensuring the correct operation of system.
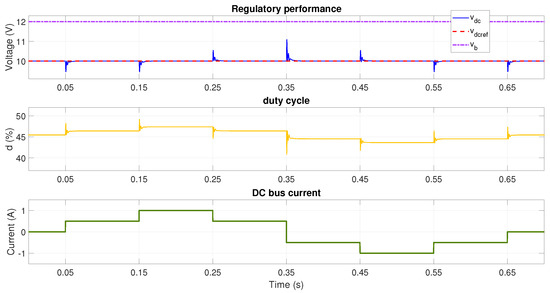
Figure 5.
Performance with V and reference voltage V using adaptive LQG with lookup table (buck mode).
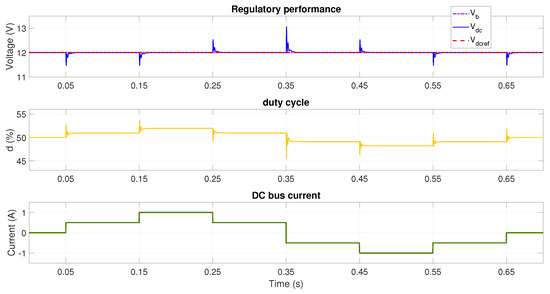
Figure 6.
Performance with V and reference voltage V using adaptive LQG with lookup table (unitary gain mode).
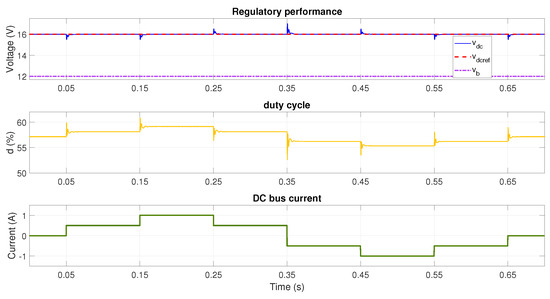
Figure 7.
Performance with V and reference voltage V using adaptive LQG with lookup table (boost mode).
In order to test the adaptability of the controller to large changes in battery voltage, the tests are repeated considering two batteries connected in series, thus V. In this case, to validate the buck, boost, and unity gain modes, the bus voltage references are set to 20 V, 24 V, and 26 V. The results of the simulations are shown in Figure 8, Figure 9 and Figure 10, where satisfactory DC bus voltage regulation is achieved. In this way, the adaptability of the controller is verified under any condition, and it can thus be used in applications with different numbers of batteries as long as the voltage of the batteries is considered for the lookup table calculation. Therefore, it is useful to perform such a lookup table calculation for the rated limits of the power converter.
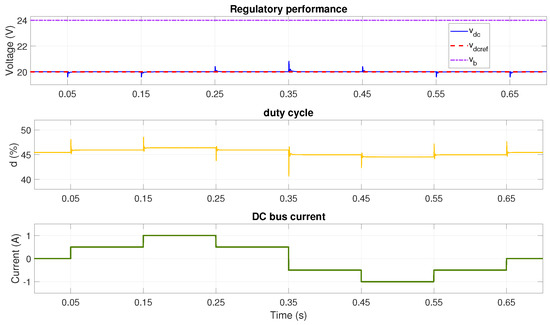
Figure 8.
Performance with V and reference voltage V using adaptive LQG with lookup table (buck mode).
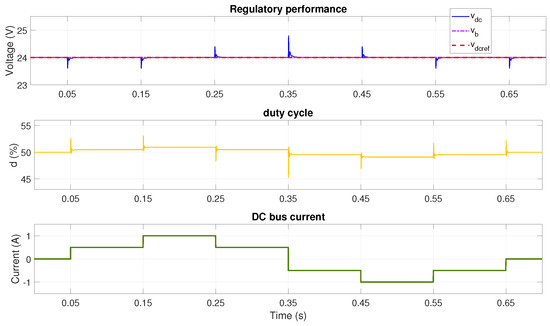
Figure 9.
Performance with V and reference voltage V using adaptive LQG with lookup table (unitary gain mode).
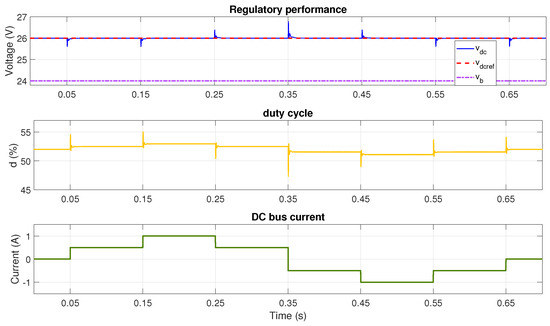
Figure 10.
Performance with V and reference voltage V using adaptive LQG with lookup table (boost mode).
The same tests are performed for the adaptive parameter method based on polynomial interpolation. The tests are carried out with one and two batteries connected in series and testing the different modes of the converter. The simulation results are reported in Figure 11 (buck mode), Figure 12 (unitary gain mode) and Figure 13 (boost mode) for a single battery ( V) and in Figure 14 (buck mode), Figure 15 (unitary gain mode), and Figure 16 (boost mode) for two series-connected batteries ( V).
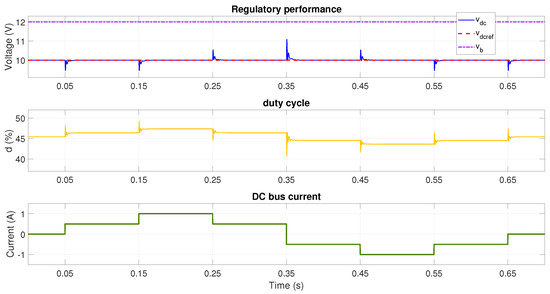
Figure 11.
Performance with V and reference voltage V using adaptive lqg with polynomial interpolation (buck mode).
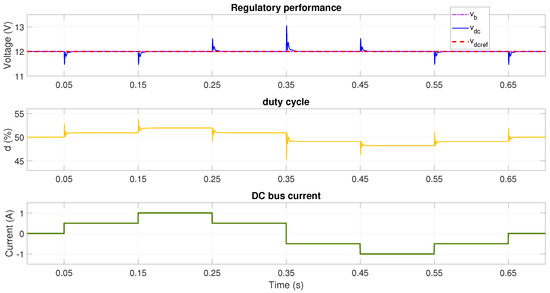
Figure 12.
Performance with V and reference voltage V using adaptive LQG with polynomial interpolation (unitary gain mode).
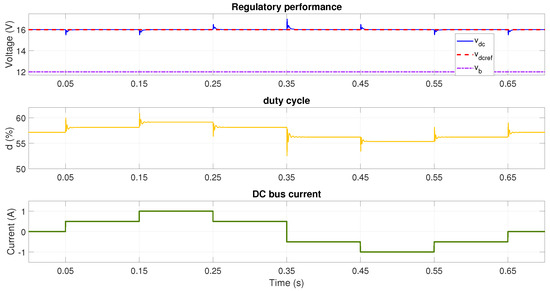
Figure 13.
Performance with V and reference voltage V using adaptive LQG with polynomial interpolation (boost mode).
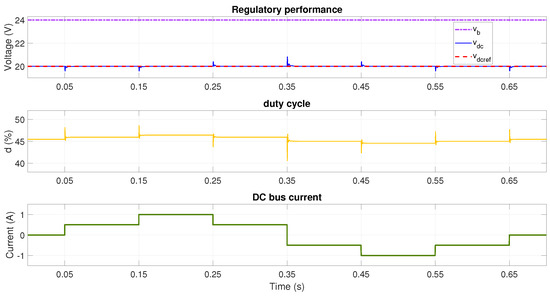
Figure 14.
Performance with V and reference voltage V using adaptive LQG with polynomial interpolation (buck mode).
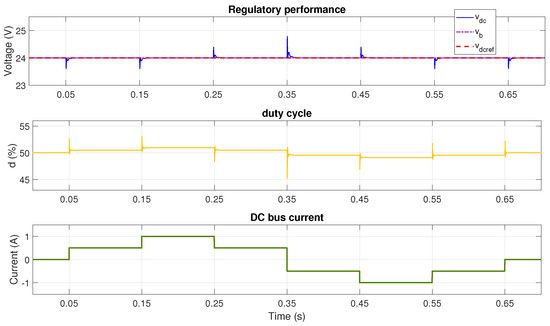
Figure 15.
Performance with V and reference voltage V using adaptive LQG with polynomial interpolation (unitary gain mode).
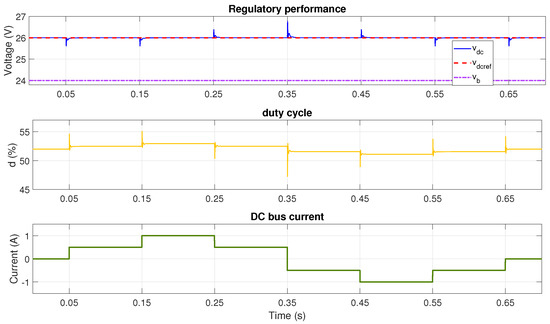
Figure 16.
Performance with V and reference voltage V using adaptive LQG with polynomial interpolation (boost mode).
The tests of the adaptive controller with polynomial interpolation also show satisfactory voltage regulation in response to perturbations in the DC bus current in all the different modes of both the converter and battery. Hence, there are no significant differences in the transient behavior in contrast with the Lookup table method. Nevertheless, the choice of the method may be due to the limitations of the hardware to be implemented, since the lookup table method consumes more memory, but the polynomial interpolation method consumes more mathematical operations.
Table 3 summarizes the dynamic performance results of the tests in Figure 5, Figure 6, Figure 7, Figure 8, Figure 9, Figure 10, Figure 11, Figure 12, Figure 13, Figure 14, Figure 15 and Figure 16. In addition, the table also reports the results of the online adaptive method reported in [38], which enables a fair comparison since all the simulations are conducted in the same operation conditions: the results show that the online solution exhibits a maximum overshoot of and settling times under 10 ms in all cases, while the maximum overshoot is and the settling times are under 10 ms for the offline adaptive LQG methods; hence, all the solutions fulfill the design requirements. It is noted that the online adaptive LQG method provides lower overshoot in the tests at V in comparison with the offline methods, and there is also a longer settling time. This is caused by small tolerances in the controller parameters obtained with the offline adaptive methods; thus, an error in the settling time is expected. However, the offline methods provide a close performance in terms of both overshoot and settling time and, hence, the lookup table and polynomial interpolation methods are suitable for practical (experimental) applications.

Table 3.
Summary of the dynamic performance for bus voltage regulation.
On the other hand, mean error and relative standard deviation percentages of the DC voltage of the tests in Figure 5, Figure 6, Figure 7, Figure 8, Figure 9, Figure 10, Figure 11, Figure 12, Figure 13, Figure 14, Figure 15 and Figure 16 are presented in Table 4. It is observed that the lowest error is obtained by the polynomial interpolation method at reference DC voltage of 16 V. Moreover, the mean percentage error of polynominal interpolation is lower than those of lookup table method for all tested cases. In terms of relative standard deviation, the two proposed methods present similar values, which means that a low number of points of the dynamic voltage response deviate from the desired value.

Table 4.
Mean error and relative standard deviation of the tests.
4.2.2. Reference Tracking
To evaluate the tracking of the bus voltage references and thereby evaluate the robustness of the solutions to large changes in the bus voltage value, changes were made at a rate of 60 V/s regarding the battery voltage. First, the system starts in discharge mode with a bus voltage higher than the battery voltage, then the reference is changed to a voltage lower than the battery voltage, then returning back to the initial voltage. At 35 ms, the DC bus current is switched from 1 A to A, which forces switching between the discharge and charge modes of the batteries. Finally, the test conditions are repeated to test the reference tracking in both charge and discharge modes, and in both boost and bock modes.
Figure 17 shows the simulation results for the lookup table method considering a singe battery and a reference profile changing between V and V. The tests show adequate tracking of the reference in all the conditions; however, unexpected small transients occur when the reference changes. This is caused by the sudden changes in the controller parameters when the operating point changes significantly; this is a consequence of the discretization introduced by the nearest method.
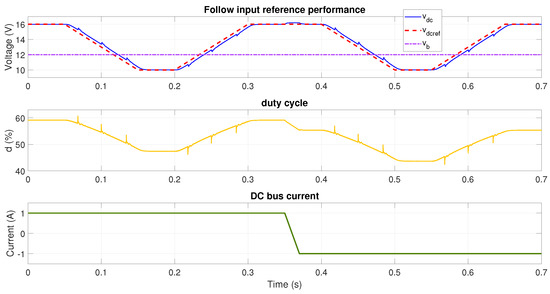
Figure 17.
Reference tracking performance at V using adaptive LQG with lookup table.
Next, the behavior of the lookup table solution is evaluated with the connection of two batteries in series, and in this case the voltage references changes between V and V. The results, reported in Figure 18, confirm that the controller ensures satisfactory tracking of the reference at any condition, but there are unexpected transients in the ramp zones, thus exhibiting the same discretization observed in the previous test, i.e., of a single battery.
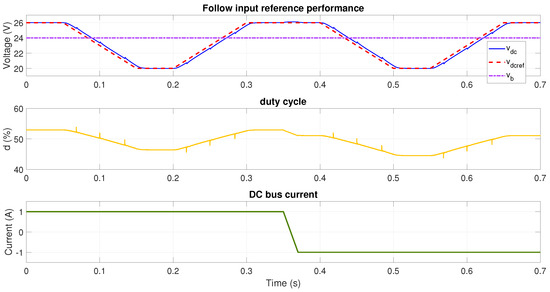
Figure 18.
Reference tracking performance at V using adaptive LQG with lookup table.
The next two simulations evaluate the performance of the adaptive method based on the polynomial interpolation. Figure 19 and Figure 20 show the results for one and two batteries, respectively, where the polynomial interpolation method provides correct tracking of the reference in the different operation conditions. It is observed that, for this method, there are no unexpected transients in the ramp zones. This is achieved since the adaptive adjustment of the parameters correspond to non-discontinuous functions, unlike the lookup table method.
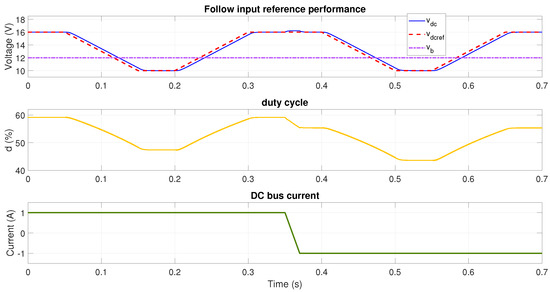
Figure 19.
Reference tracking performance at V using adaptive LQG with polynomial interpolation.
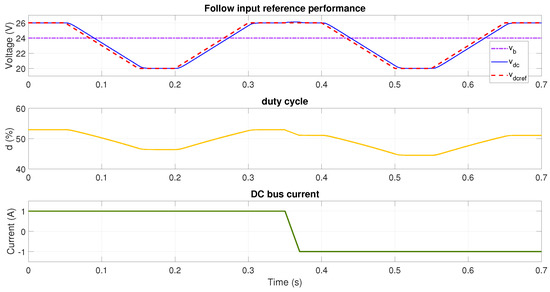
Figure 20.
Reference tracking performance at V using adaptive LQG with polynomial interpolation.
The tests performed on both offline adaptive methods, and reported in Figure 17, Figure 18, Figure 19 and Figure 20, confirm the correct reference tracking under changes in the operating conditions. Finally, the following section validates the previous simulation results using an experimental prototype.
5. Experimental Validation
This section reports validations of the previous simulations using an experimental prototype of the Sepic/Zeta charger/discharger and adaptive control systems.
5.1. Experimental Implementation
The experimental scheme used to validate the proposed offline solutions is reported in Figure 21. The system includes one or two commercial batteries (12 V or 24 V), the Sepic/Zeta bidirectional converter, and a DC bus emulator constructed with a DC electronic load and electronic power supply, emulating the loads and sources connected to the microgrid bus, respectively. The battery and DC bus voltages are measured with LV25P sensors and signal conditioning circuits. The control card Delfino TMS320F28379D is used to implement the control system and adaptive method. It is worth noting that the control card uses an internal analog-to-digital converter (ADC) to digitize the measurements, and it uses an internal PWM module to produce the control signal for the MOSFETS drivers.
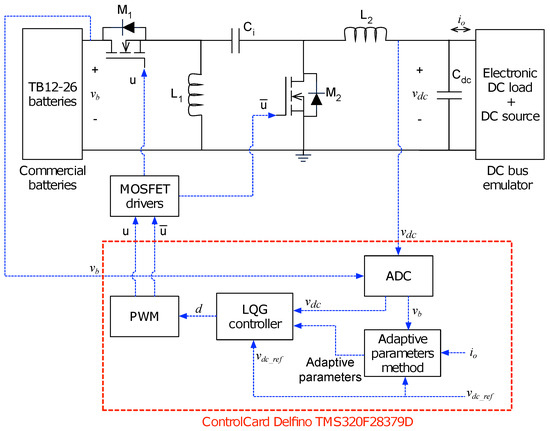
Figure 21.
Scheme of the experimental test.
The experimental implementation of both the adaptive controller and charger/discharger is shown in Figure 22, where the Sepic/Zeta converter, sensors, and control card are highlighted. Figure 23 shows the complete experimental test bench, which also exhibits the commercial batteries and the practical implementation of the DC bus emulator.
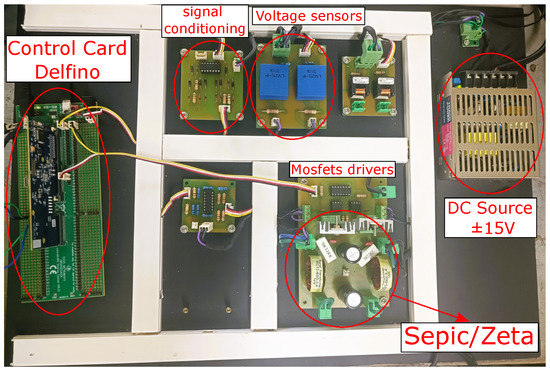
Figure 22.
Experimental implementation.
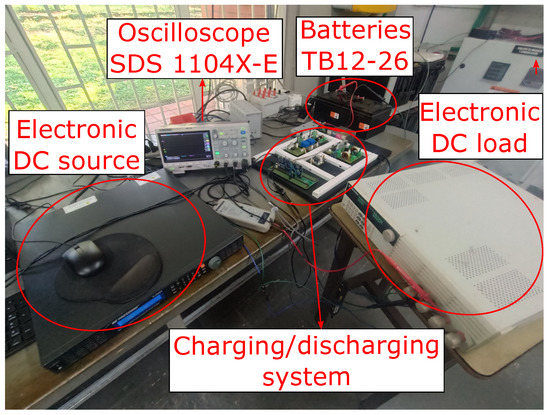
Figure 23.
Experimental test bench.
5.2. Experimental Validation of the Bus Voltage Regulation
The same test conditions adopted for the simulations are implemented in this experimental validation. Thus, the DC bus current profile includes increments and decrements and shifts between charge, discharge, and standby modes. Figure 24a,b show the performance of the adaptive LQG with both the lookup table and polynomial interpolation methods. In this experiment, the bus voltage is regulated at 10 V (buck mode) for the charging, discharging, and standby modes of the battery. These experiments demonstrate the correct operation of the two offline parameter adjustment methods in terms of regulation, and no appreciable differences are observed between them in terms of their performance.

Figure 24.
Bus regulation with V and reference V (buck mode) using a LQG by (a) lookup table and (b) polynomial interpolation. Magenta: battery voltage ; yellow: duty cycle d; cyan: bus voltage ; green: bus current .
The previous tests were executed with bus voltages equal to 12 V (unitary gain mode) and 16 V (boost mode). The experimental data, reported in Figure 25 and Figure 26 for both offline methods, confirm the adequate performance under different operation conditions of the DC bus current (green trace) and for both unitary gain and boost modes.

Figure 25.
Bus regulation with V and reference V (unitary gain mode) using adaptive LQG by (a) lookup table and (b) polynomial interpolation. Magenta: battery voltage ; yellow: duty cycle d; cyan: bus voltage ; green: bus current .

Figure 26.
Bus regulation with V and reference V (boost mode) using adaptive LQG by (a) lookup table and (b) polynomial interpolation. Magenta: battery voltage ; yellow: duty cycle d; cyan: bus voltage ; green: bus current .
In the same way, Figure 27, Figure 28 and Figure 29 report a good performance in terms of DC bus regulation at 20 V (buck mode), 24 V (unitary gain mode) and 26 V (boost mode), respectively, considering two series-connected commercial batteries ( V). Therefore, the robustness of both offline methods is confirmed for large changes in the battery voltage.

Figure 27.
Bus regulation with V and reference V (buck mode) using adaptive LQG by (a) lookup table and (b) polynomial interpolation. Magenta: battery voltage ; yellow: duty cycle d; cyan: bus voltage ; green: bus current .

Figure 28.
Bus regulation with V and reference V (unitary gain mode) using adaptive LQG by (a) lookup table and (b) polynomial interpolation. Magenta: battery voltage ; yellow: duty cycle d; cyan: bus voltage ; green: bus current .

Figure 29.
Bus regulation with V and reference V (boost mode) using adaptive LQG by (a) lookup table and (b) polynomial interpolation. Magenta: battery voltage ; yellow: duty cycle d; cyan: bus voltage ; green: bus current .
In general, in the experimental data concerning DC bus voltage regulation, both offline adaptation methods exhibit correct performance under charge, discharge, and standby conditions under different voltage conversion ratios (buck, boost, and unitary gain modes). In addition, the voltage variation of the battery pack enable the stability of both solutions at different operating points to be confirmed.
Table 5 summarizes the performance criteria (overshoot and settling time) obtained with the proposed adaptive offline methods. For comparative purposes, the adaptive online LQG approach presented in [38] was also implemented and experimentally tested, and its performance criteria are included in Table 5. The results with a single battery ( V) show that the adaptive online LQG exhibits lower overshoot and shorter stabilization time than the offline methods. However, in the test considering two batteries connected in series ( V), the proposed offline methods provide better dynamic performance, except for the lookup table method in standby mode. Those experiments confirm that the proposed offline methods are a suitable option to adapt the LQG parameters in practical application, since the difference with the online option is small.

Table 5.
Dynamic performance in bus voltage regulation tests.
5.3. Experimental Validation of Reference Tracking
Several experiments were conducted to validate the adaptability of the offline methods to changes in the operating point by considering dynamic changes in the reference value. The changes in the bus reference are given in such a way that the converter changes between buck and boost modes. In the same way, the tests were repeated for the charge, discharge, and standby modes of the batteries. The experimental data of the reference tracking, for both lookup table and polynomial interpolation methods, are shown in the Figure 30, where a single battery ( V) is considered in those experiments. The proposed offline adaptive methods guarantee correct tracking of the references under different operating points for different modes of the converter (buck and boost modes).
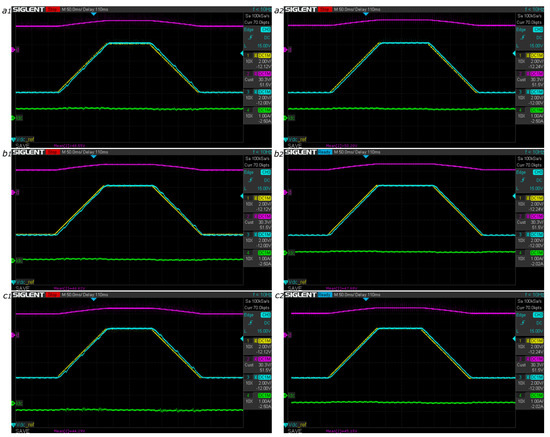
Figure 30.
Reference tracking performance at V using adaptive LQG with lookup table: (a1) discharge mode, (b1) standby mode, and (c1) charge mode; and with polynomial interpolation: (a2) discharge mode, (b2) standby mode, and (c2) charge mode. Magenta: duty cycle d; yellow: bus voltage reference ; cyan: bus voltage ; green: bus current .
In addition, the tracking performance was evaluated with two batteries connected in series ( V). For this experiment, the bus voltage reference starts at 20 V (buck mode), changes to 26 V (boost mode), and finally returns to 20 V. Figure 31 shows the experimental behavior of both proposed offline methods; similarly to the previous experiments, the results indicate the correct performance of the adaptive methods for different operating points.
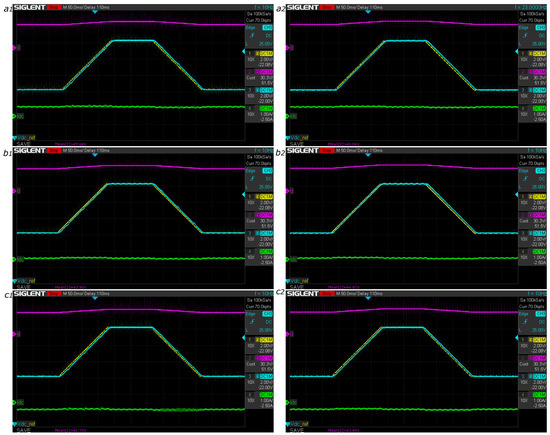
Figure 31.
Reference tracking performance at V using adaptive LQG with lookup table: (a1) discharge mode, (b1) standby mode, and (c1) charge mode; and with polynomial interpolation: (a2) discharge mode, (b2) standby mode, and (c2) charge mode. Magenta: duty cycle d; yellow: bus voltage reference ; cyan: bus voltage ; green: bus current .
In agreement with the simulation results, the lookup table method exhibits unexpected voltage transients when the reference voltage changes continuously, which is caused by the discretization of the method. However, these transients are more notable for a battery of 12 V, since the bus voltage is lower. This phenomenon can be reduced by increasing the resolution of the data stored in the lookup table; however, this increases the memory required in the control device and, also, the parametrization time for the method.
5.4. Performance and Cost Comparison
Since the main objective of the proposed offline methods is to reduce the computational resources required for the implementation of the adaptive LQG controller, this section evaluates the computational burden of the new solutions.
The control card TMS320F28379D has two cores, each providing 400 millions of instructions per second (MIPS), which means that the total capacity of the card is 800 MIPS. In the implementation, each adaptive offline proposed method is required to use a core at a time. Using the Matlab® report, the processor load for each of the adaptive solutions was extracted, which includes the online approach reported in [38]. This information is summarized in Table 6, where the two proposed (offline) solutions require almost the same CPU utilization (MIPS required). Instead, the online method [38] requires between 7 and 8 times the MIPS for the adaptive process.

Table 6.
Overall CPU utilization.
Taking into consideration the maximum MIPS required by proposed method, a suitable control card available in the market is selected to evaluate the implementation cost. Control cards from TI C2000 MCU series are suitable due to the available PWM, ADC modules, and high processing capacity. For example, the TMS320F2800157 control card provides 120 MIPS, which is enough to implement the adaptive offline methods. Moreover, this control card also provides the additional hardware required to execute the control strategy for the battery charger/discharger, such as programming ports and communication ports, among others. The cost of this card is USD 59; instead, the control card required to implement the online method (with 714 MIPS required) is the TMS320F28379D, which costs USD 159 and is thus significantly more expensive.
The previous practical considerations were analyzed by proposing three indices: designed CPU capacity index (), cost index () and performance index (). The index is calculated from the performance data reported in Table 5 using Equation (17), where a higher implies greater performance. In such an expression, is the overshoot or stabilization time, and corresponds to the lowest value of the data under comparison. In this way, the solution with the lower overshoot or shortest stabilization time will always have , and the other solutions will have lower value. Finally, the values for each method are averaged to obtain a general performance index for each adaptive method.
The index uses the data reported in Table 6 and Equation (18), where the higher , the lower the required MIPS. In (18), and correspond to the MIPS required by the solution and the minimum CPU consumption of methods under comparison, respectively. In this way, the method with the lower MIPS requirement will have , while the other methods will exhibit a lower value.
Finally, the index is given in Equation (19), where is the price of the corresponding control card, and is the price of the cheaper control card for all the implementations. As in the previous cases, the higher the index, the lower the required cost, where the solution with the lower cost will have an index equal to 1.
The results of applying three proposed indices to the solutions under comparison are reported in Table 7. A higher index value of implies a better dynamic performance, a higher value of indicates lower computational requirement, and a higher value of means lower cost of the control card required to implement the adaptive method. It is observed that the polynomial interpolation method exhibits a better overall performance, also requiring the lowest CPU consumption and cost; therefore, that method is the best alternative for commercial implementation of the adaptive LQG controller for battery charger/dischargers.

Table 7.
Comparative summary of the indices.
The previous data can be further processed to contrast both the offline (proposed) and online solutions. For this purpose, combined indicators are proposed: the performance–cost, which adds both and ; and the performance–CPU, which adds both and . Table 8 reports both combined indicators, where the polynomial interpolation method provides the best relation between performance of the charger/discharger and implementation cost. The second best method in this category is the lookup table, and the last is the online method reported in [38]. Similarly, the polynomial interpolation method provides the best relation between performance and CPU utilization, the second best method is the lookup table, and the last, again, is the online method. This last category is interesting, since it enables analyzing which method will leave higher resources, thus providing computing power for other tasks such as data logging, cloud storage, state of charge management, etc.

Table 8.
Advantage comparison.
Finally, this practical analysis confirms that both offline solutions provide an acceptable performance with much lower implementation costs. In particular, the polynomial interpolation method provides the best tradeoff and is thus the best solution for commercial applications.
6. Conclusions
Two adaptive offline methods for adjusting the parameters of a LQG controller and regulating the DC bus of a battery charger/discharger are proposed. The charger/discharger is based on the Sepic/Zeta converter, and the parameters of the controller are determined taking into account the conditions of both the batteries and converter. For the former, conditions may vary between charge, discharge, or standby modes. Moreover, depending on the voltage requirements of the input and output, the converter can be in boost, buck, or equal gain mode. For the LQG controller, a state feedback vector and an observer gain vector must be determined in an adaptive way. The first method consists of calculating the parameters of vectors for several operating points of load and input reference voltage, and those are stored in a lookup table. In the second method, an interpolation is developed among the values of the lookup table. In simulation and experimental results, for several operating conditions, the control signal remains far away from saturation, and the control system is stable, thus providing satisfactory results.
Three indices have been proposed to evaluate the performance of the proposed adaptive methods, which are suitable to evaluate dynamic performance, CPU capacity, and cost. These indices show that the lookup table and polynomial interpolation methods present similar dynamic performance and CPU requirements, but the combined indices show that polynomial interpolation is the best option for practical and commercial application. In addition, compared with the lookup table method, that method exhibits satisfactory performance over the entire operating range, and it does not introduce unexpected transients under any operating conditions. Moreover, polynomial interpolation requires low computational consumption in contrast to the online LQG method, which means considerably lower implementation costs.
The main drawback of both proposed offline solutions is the need for an offline training campaign, which is not needed in the online alternative already reported in the literature. However, with the aim of developing low-cost solutions for deployment in commercial applications, it could be acceptable to spend the time required for training if there is significant reduction of the implementation cost. Finally, for future improvement, evaluating more deployment-oriented platforms for implementation, such as FPGA or ASIC devices, could provide a much better cost/performance ratio.
Author Contributions
Conceptualization, J.A.M.-O., C.A.R.-P., M.L.O.-G., E.F.-M. and S.I.S.-G.; methodology, J.A.M.-O., C.A.R.-P., M.L.O.-G., E.F.-M. and S.I.S.-G.; software, J.A.M.-O., C.A.R.-P., M.L.O.-G., E.F.-M. and S.I.S.-G.; validation, J.A.M.-O., C.A.R.-P., M.L.O.-G., E.F.-M. and S.I.S.-G.; writing—original draft preparation, J.A.M.-O., C.A.R.-P., M.L.O.-G., E.F.-M. and S.I.S.-G.; writing—review and editing, J.A.M.-O., C.A.R.-P., M.L.O.-G., E.F.-M. and S.I.S.-G. All authors have read and agreed to the published version of the manuscript.
Funding
This research was funded by Minciencias, Universidad del Valle, Universidad Nacional de Colombia, and Instituto Tecnológico Metropolitano under the research project “Métodos y Herramientas para el Diseño, Dimensionamiento y Control de Sistemas de Almacenamiento de Energía en sistemas eléctricos basados en fuentes renovables no convencionales, para zonas urbanas y rurales”, (Minciencias code 70634, Sicop Code C.I. 21154), which belongs to the research program “Estrategias para el desarrollo de sistemas energéticos sostenibles, confiables, eficientes y accesibles para el futuro de Colombia”, (Minciencias code 1150-852-70378, Hermes code 46771, Sicop codes C.I. 21154, 21173, 21174, ITM code RC 80740-178-2021-1).
Institutional Review Board Statement
Not applicable.
Informed Consent Statement
Not applicable.
Data Availability Statement
The data used in this study are reported in the paper figures and tables.
Conflicts of Interest
The authors declare no conflict of interest.
Appendix A
This appendix reports the lookup table data used in the first proposed offline method. The data are distributed in eight tables, one for each parameter of both the controller and observer.

Table A1.
Lookup table .
Table A1.
Lookup table .
| 10 | 12 | 14 | 16 | 18 | 20 | 22 | 24 | 26 | 28 | ||
|---|---|---|---|---|---|---|---|---|---|---|---|
| 8 | 0.02513 | 0.02462 | 0.02421 | 0.02388 | 0.02359 | 0.02334 | 0.02311 | 0.02289 | 0.02268 | 0.02248 | |
| 10 | 0.02569 | 0.02520 | 0.02480 | 0.02447 | 0.02419 | 0.02394 | 0.02371 | 0.02350 | 0.02330 | 0.02310 | |
| 12 | 0.02600 | 0.02555 | 0.02518 | 0.02487 | 0.02461 | 0.02438 | 0.02417 | 0.02397 | 0.02378 | 0.02359 | |
| 14 | 0.02614 | 0.02573 | 0.02541 | 0.02514 | 0.02490 | 0.02470 | 0.02450 | 0.02432 | 0.02415 | 0.02398 | |
| 16 | 0.02618 | 0.02582 | 0.02554 | 0.02530 | 0.02510 | 0.02492 | 0.02475 | 0.02459 | 0.02443 | 0.02428 | |
| 18 | 0.02616 | 0.02584 | 0.02560 | 0.02540 | 0.02522 | 0.02507 | 0.02492 | 0.02478 | 0.02465 | 0.02452 | |
| 20 | 0.02612 | 0.02582 | 0.02561 | 0.02544 | 0.02529 | 0.02516 | 0.02504 | 0.02493 | 0.02481 | 0.02470 | |
| 22 | 0.02606 | 0.02578 | 0.02559 | 0.02545 | 0.02533 | 0.02522 | 0.02512 | 0.02503 | 0.02493 | 0.02483 | |
| 24 | 0.02600 | 0.02572 | 0.02555 | 0.02543 | 0.02533 | 0.02525 | 0.02517 | 0.02509 | 0.02501 | 0.02493 | |
| 26 | 0.02594 | 0.02566 | 0.02550 | 0.02539 | 0.02532 | 0.02525 | 0.02519 | 0.02513 | 0.02507 | 0.02500 | |
| 28 | 0.02588 | 0.02559 | 0.02544 | 0.02535 | 0.02529 | 0.02524 | 0.02519 | 0.02515 | 0.02510 | 0.02505 | |

Table A2.
Lookup table .
Table A2.
Lookup table .
| 10 | 12 | 14 | 16 | 18 | 20 | 22 | 24 | 26 | 28 | ||
|---|---|---|---|---|---|---|---|---|---|---|---|
| 8 | 0.06072 | 0.06116 | 0.06110 | 0.06075 | 0.06025 | 0.05967 | 0.05905 | 0.05842 | 0.05780 | 0.05720 | |
| 10 | 0.05981 | 0.06010 | 0.05996 | 0.05956 | 0.05903 | 0.05843 | 0.05779 | 0.05716 | 0.05653 | 0.05593 | |
| 12 | 0.05888 | 0.05906 | 0.05886 | 0.05844 | 0.05789 | 0.05728 | 0.05664 | 0.05601 | 0.05538 | 0.05478 | |
| 14 | 0.05796 | 0.05807 | 0.05782 | 0.05738 | 0.05682 | 0.05621 | 0.05558 | 0.05495 | 0.05433 | 0.05373 | |
| 16 | 0.05708 | 0.05712 | 0.05684 | 0.05639 | 0.05583 | 0.05522 | 0.05460 | 0.05397 | 0.05336 | 0.05277 | |
| 18 | 0.05622 | 0.05623 | 0.05593 | 0.05546 | 0.05490 | 0.05430 | 0.05369 | 0.05307 | 0.05247 | 0.05189 | |
| 20 | 0.05541 | 0.05538 | 0.05506 | 0.05459 | 0.05404 | 0.05345 | 0.05284 | 0.05224 | 0.05165 | 0.05107 | |
| 22 | 0.05462 | 0.05458 | 0.05425 | 0.05378 | 0.05323 | 0.05265 | 0.05205 | 0.05146 | 0.05088 | 0.05032 | |
| 24 | 0.05387 | 0.05381 | 0.05348 | 0.05301 | 0.05247 | 0.05190 | 0.05131 | 0.05073 | 0.05016 | 0.04961 | |
| 26 | 0.05314 | 0.05309 | 0.05276 | 0.05229 | 0.05176 | 0.05119 | 0.05062 | 0.05005 | 0.04949 | 0.04895 | |
| 28 | 0.05244 | 0.05240 | 0.05207 | 0.05161 | 0.05109 | 0.05053 | 0.04997 | 0.04941 | 0.04886 | 0.04833 | |

Table A3.
Lookup table .
Table A3.
Lookup table .
| 10 | 12 | 14 | 16 | 18 | 20 | 22 | 24 | 26 | 28 | ||
|---|---|---|---|---|---|---|---|---|---|---|---|
| 8 | 0.00814 | 0.00790 | 0.00768 | 0.00754 | 0.00748 | 0.00748 | 0.00753 | 0.00763 | 0.00775 | 0.00789 | |
| 10 | 0.00845 | 0.00815 | 0.00787 | 0.00766 | 0.00753 | 0.00746 | 0.00746 | 0.00750 | 0.00758 | 0.00768 | |
| 12 | 0.00862 | 0.00831 | 0.00799 | 0.00774 | 0.00756 | 0.00745 | 0.00740 | 0.00740 | 0.00744 | 0.00750 | |
| 14 | 0.00868 | 0.00838 | 0.00806 | 0.00778 | 0.00757 | 0.00743 | 0.00735 | 0.00731 | 0.00732 | 0.00736 | |
| 16 | 0.00865 | 0.00839 | 0.00807 | 0.00779 | 0.00756 | 0.00740 | 0.00730 | 0.00724 | 0.00722 | 0.00724 | |
| 18 | 0.00855 | 0.00834 | 0.00804 | 0.00776 | 0.00754 | 0.00736 | 0.00724 | 0.00717 | 0.00713 | 0.00713 | |
| 20 | 0.00839 | 0.00824 | 0.00798 | 0.00771 | 0.00749 | 0.00731 | 0.00718 | 0.00709 | 0.00704 | 0.00703 | |
| 22 | 0.00819 | 0.00812 | 0.00789 | 0.00764 | 0.00743 | 0.00725 | 0.00711 | 0.00702 | 0.00696 | 0.00693 | |
| 24 | 0.00796 | 0.00797 | 0.00778 | 0.00756 | 0.00735 | 0.00718 | 0.00704 | 0.00694 | 0.00688 | 0.00684 | |
| 26 | 0.00770 | 0.00780 | 0.00765 | 0.00746 | 0.00726 | 0.00710 | 0.00697 | 0.00687 | 0.00680 | 0.00675 | |
| 28 | 0.00742 | 0.00762 | 0.00752 | 0.00734 | 0.00717 | 0.00701 | 0.00689 | 0.00679 | 0.00672 | 0.00667 | |

Table A4.
Lookup table .
Table A4.
Lookup table .
| 10 | 12 | 14 | 16 | 18 | 20 | 22 | 24 | 26 | 28 | ||
|---|---|---|---|---|---|---|---|---|---|---|---|
| 8 | 0.04164 | 0.04310 | 0.04443 | 0.04562 | 0.04666 | 0.04758 | 0.04838 | 0.04910 | 0.04973 | 0.05029 | |
| 10 | 0.04490 | 0.04608 | 0.04717 | 0.04815 | 0.04902 | 0.04979 | 0.05047 | 0.05107 | 0.05160 | 0.05207 | |
| 12 | 0.04762 | 0.04860 | 0.04950 | 0.05032 | 0.05105 | 0.05169 | 0.05227 | 0.05278 | 0.05323 | 0.05364 | |
| 14 | 0.04990 | 0.05073 | 0.05149 | 0.05218 | 0.05280 | 0.05335 | 0.05384 | 0.05428 | 0.05467 | 0.05501 | |
| 16 | 0.05185 | 0.05256 | 0.05321 | 0.05380 | 0.05433 | 0.05480 | 0.05523 | 0.05560 | 0.05593 | 0.05623 | |
| 18 | 0.05351 | 0.05415 | 0.05471 | 0.05522 | 0.05567 | 0.05608 | 0.05645 | 0.05677 | 0.05706 | 0.05732 | |
| 20 | 0.05495 | 0.05553 | 0.05603 | 0.05647 | 0.05687 | 0.05722 | 0.05754 | 0.05782 | 0.05807 | 0.05829 | |
| 22 | 0.05620 | 0.05675 | 0.05719 | 0.05758 | 0.05793 | 0.05824 | 0.05852 | 0.05876 | 0.05898 | 0.05917 | |
| 24 | 0.05730 | 0.05782 | 0.05822 | 0.05857 | 0.05888 | 0.05915 | 0.05940 | 0.05961 | 0.05980 | 0.05997 | |
| 26 | 0.05827 | 0.05878 | 0.05915 | 0.05946 | 0.05974 | 0.05998 | 0.06019 | 0.06038 | 0.06055 | 0.06070 | |
| 28 | 0.05913 | 0.05964 | 0.05998 | 0.06027 | 0.06051 | 0.06073 | 0.06092 | 0.06109 | 0.06123 | 0.06136 | |

Table A5.
Lookup table .
Table A5.
Lookup table .
| 10 | 12 | 14 | 16 | 18 | 20 | 22 | 24 | 26 | 28 | ||
|---|---|---|---|---|---|---|---|---|---|---|---|
| 8 | 7.26 | 8.08 | 8.88 | 9.68 | 1.05 | 1.13 | 1.21 | 1.29 | 1.37 | 1.46 | |
| 10 | 8.11 | 8.96 | 9.78 | 1.06 | 1.14 | 1.22 | 1.30 | 1.39 | 1.47 | 1.55 | |
| 12 | 8.95 | 9.82 | 1.07 | 1.15 | 1.23 | 1.31 | 1.40 | 1.48 | 1.56 | 1.65 | |
| 14 | 9.77 | 1.07 | 1.15 | 1.24 | 1.32 | 1.41 | 1.49 | 1.57 | 1.66 | 1.74 | |
| 16 | 1.06 | 1.15 | 1.24 | 1.33 | 1.41 | 1.49 | 1.58 | 1.66 | 1.75 | 1.83 | |
| 18 | 1.14 | 1.24 | 1.32 | 1.41 | 1.50 | 1.58 | 1.67 | 1.75 | 1.84 | 1.92 | |
| 20 | 1.22 | 1.32 | 1.41 | 1.50 | 1.59 | 1.67 | 1.76 | 1.84 | 1.93 | 2.01 | |
| 22 | 1.30 | 1.40 | 1.49 | 1.58 | 1.67 | 1.76 | 1.85 | 1.93 | 2.02 | 2.10 | |
| 24 | 1.38 | 1.49 | 1.58 | 1.67 | 1.76 | 1.85 | 1.93 | 2.02 | 2.11 | 2.19 | |
| 26 | 1.47 | 1.57 | 1.66 | 1.76 | 1.85 | 1.93 | 2.02 | 2.11 | 2.20 | 2.28 | |
| 28 | 1.55 | 1.65 | 1.75 | 1.84 | 1.93 | 2.02 | 2.11 | 2.20 | 2.28 | 2.37 | |

Table A6.
Lookup table .
Table A6.
Lookup table .
| 10 | 12 | 14 | 16 | 18 | 20 | 22 | 24 | 26 | 28 | ||
|---|---|---|---|---|---|---|---|---|---|---|---|
| 8 | 5.51 | 6.46 | 7.38 | 8.28 | 9.18 | 1.01 | 1.09 | 1.18 | 1.27 | 1.36 | |
| 10 | 6.19 | 7.17 | 8.12 | 9.05 | 9.96 | 1.09 | 1.18 | 1.26 | 1.35 | 1.44 | |
| 12 | 6.87 | 7.89 | 8.87 | 9.81 | 1.07 | 1.17 | 1.26 | 1.35 | 1.44 | 1.52 | |
| 14 | 7.57 | 8.62 | 9.61 | 1.06 | 1.15 | 1.24 | 1.34 | 1.43 | 1.52 | 1.61 | |
| 16 | 8.27 | 9.35 | 1.04 | 1.13 | 1.23 | 1.32 | 1.42 | 1.51 | 1.60 | 1.69 | |
| 18 | 8.97 | 1.01 | 1.11 | 1.21 | 1.31 | 1.40 | 1.50 | 1.59 | 1.68 | 1.77 | |
| 20 | 9.68 | 1.08 | 1.19 | 1.29 | 1.39 | 1.48 | 1.58 | 1.67 | 1.76 | 1.86 | |
| 22 | 1.04 | 1.16 | 1.26 | 1.37 | 1.47 | 1.56 | 1.66 | 1.75 | 1.85 | 1.94 | |
| 24 | 1.11 | 1.23 | 1.34 | 1.44 | 1.55 | 1.64 | 1.74 | 1.83 | 1.93 | 2.02 | |
| 26 | 1.18 | 1.31 | 1.42 | 1.52 | 1.62 | 1.72 | 1.82 | 1.92 | 2.01 | 2.10 | |
| 28 | 1.26 | 1.38 | 1.50 | 1.60 | 1.70 | 1.80 | 1.90 | 2.00 | 2.09 | 2.19 | |

Table A7.
Lookup table .
Table A7.
Lookup table .
| 10 | 12 | 14 | 16 | 18 | 20 | 22 | 24 | 26 | 28 | ||
|---|---|---|---|---|---|---|---|---|---|---|---|
| 8 | −1.06 | −3.46 | 3.00 | 8.92 | 1.44 | 1.95 | 2.43 | 2.89 | 3.32 | 3.73 | |
| 10 | −1.92 | −1.17 | −4.95 | 1.20 | 6.89 | 1.22 | 1.72 | 2.19 | 2.63 | 3.06 | |
| 12 | −2.74 | −1.95 | −1.25 | −6.12 | −2.54 | 5.20 | 1.03 | 1.52 | 1.97 | 2.41 | |
| 14 | −3.53 | −2.70 | −1.97 | −1.31 | −7.07 | −1.46 | 3.79 | 8.74 | 1.34 | 1.79 | |
| 16 | −4.29 | −3.41 | −2.66 | −1.98 | −1.36 | −7.85 | −2.48 | 2.57 | 7.37 | 1.19 | |
| 18 | −5.03 | −4.11 | −3.32 | −2.62 | −1.99 | −1.40 | −8.52 | −3.36 | 1.52 | 6.16 | |
| 20 | −5.75 | −4.78 | −3.96 | −3.24 | −2.59 | −1.99 | −1.43 | −9.08 | −4.12 | 5.99 | |
| 22 | −6.46 | −5.43 | −4.58 | −3.84 | −3.18 | −2.56 | −2.00 | −1.46 | −9.58 | −4.79 | |
| 24 | −7.15 | −6.07 | −5.19 | −4.42 | −3.74 | −3.12 | −2.54 | −2.00 | −1.49 | −1.00 | |
| 26 | −7.84 | −6.69 | −5.77 | −4.99 | −4.29 | −3.66 | −3.07 | −2.52 | −2.00 | −1.51 | |
| 28 | −8.52 | −7.30 | −6.35 | −5.54 | −4.83 | −4.18 | −3.58 | −3.02 | −2.50 | −2.00 | |

Table A8.
Lookup table .
Table A8.
Lookup table .
| 10 | 12 | 14 | 16 | 18 | 20 | 22 | 24 | 26 | 28 | ||
|---|---|---|---|---|---|---|---|---|---|---|---|
| 8 | 5.78 | 6.26 | 6.69 | 7.09 | 7.46 | 7.81 | 8.15 | 8.47 | 8.77 | 9.07 | |
| 10 | 6.12 | 6.59 | 7.02 | 7.41 | 7.77 | 8.11 | 8.44 | 8.75 | 9.06 | 9.35 | |
| 12 | 6.45 | 6.92 | 7.33 | 7.71 | 8.07 | 8.40 | 8.72 | 9.03 | 9.33 | 9.61 | |
| 14 | 6.77 | 7.23 | 7.63 | 8.01 | 8.36 | 8.69 | 9.00 | 9.30 | 9.59 | 9.87 | |
| 16 | 7.08 | 7.53 | 7.93 | 8.29 | 8.63 | 8.96 | 9.27 | 9.56 | 9.85 | 1.01 | |
| 18 | 7.37 | 7.82 | 8.21 | 8.57 | 8.91 | 9.22 | 9.53 | 9.82 | 1.01 | 1.04 | |
| 20 | 7.66 | 8.10 | 8.48 | 8.84 | 9.17 | 9.48 | 9.78 | 1.01 | 1.03 | 1.06 | |
| 22 | 7.94 | 8.37 | 8.75 | 9.10 | 9.43 | 9.73 | 1.00 | 1.03 | 1.06 | 1.08 | |
| 24 | 8.21 | 8.64 | 9.01 | 9.36 | 9.68 | 9.98 | 1.03 | 1.05 | 1.08 | 1.11 | |
| 26 | 8.47 | 8.90 | 9.27 | 9.61 | 9.92 | 1.02 | 1.05 | 1.08 | 1.10 | 1.13 | |
| 28 | 8.72 | 9.15 | 9.52 | 9.85 | 1.02 | 1.05 | 1.07 | 1.10 | 1.13 | 1.15 | |
Similarly, the polynomial interpolation data are also reported. First, the polynomial for the controller is reported in (A1), and the parameters for such an interpolation are given in Table A9. In the same way, the polynomial for the observer is reported in (A2), and the parameters for such an interpolation are given in Table A10.

Table A9.
Polynomial function coefficients of K.
Table A9.
Polynomial function coefficients of K.
| Coefficient | ||||
|---|---|---|---|---|
| 2.70 | 4.75 | 4.70 | 6.08 | |
| 7.29 | 1.29 | 7.08 | 4.10 | |
| −9.49 | 3.35 | 3.07 | 2.17 | |
| −4.28 | −1.18 | −4.24 | −1.20 | |
| 6.81 | −9.29 | −1.15 | −1.46 | |
| 4.78 | −2.09 | −3.77 | −4.28 | |
| 7.20 | 1.41 | 4.65 | 1.29 | |
| 5.49 | 1.73 | 2.34 | 4.15 | |
| −3.83 | 2.78 | −1.79 | 1.70 | |
| −1.24 | 5.41 | 2.12 | 4.83 | |
| −1.74 | −1.30 | −2.18 | −3.43 | |
| 9.53 | −2.07 | −1.73 | −3.75 | |
| −1.10 | −2.97 | 3.54 | 1.59 | |
| 1.36 | −5.28 | −3.40 | −4.72 |

Table A10.
Polynomial function coefficients of ℓ.
Table A10.
Polynomial function coefficients of ℓ.
| Coefficient | ||||
|---|---|---|---|---|
| −3.73 | −2.21 | −1.82 | 9.83 | |
| 3.96 | 2.50 | −6.31 | 2.32 | |
| 4.43 | 5.70 | 6.13 | 4.03 | |
| −2.29 | 6.64 | 5.90 | −2.35 | |
| 8.02 | 1.04 | 1.39 | −2.81 | |
| −4.83 | −8.88 | −1.90 | −8.43 | |
| 3.73 | 6.63 | −5.50 | 1.70 | |
| −2.58 | −4.04 | −9.80 | 2.59 | |
| −1.22 | −1.52 | −2.45 | 1.19 | |
| 1.05 | 1.58 | 2.94 | 1.01 |
References
- Payne, J. How to select the Correct Factory Automation Controller for your application: Picking the right hardware is critical, but users also need to make sure they include controller programming software in the evaluation process. Control Eng. 2018, 65, 22. [Google Scholar]
- Jithin, S.; Rajeev, T. A novel stability index-based virtual synchronous machine droop scheme for performance improvement of hybrid AC/DC microgrid under volatile loading conditions. Electr. Power Syst. Res. 2023, 214, 108901. [Google Scholar]
- Babu, N.R.; Saikia, L.C. Optimal location of accurate HVDC and energy storage devices in a deregulated AGC integrated with PWTS considering HPA-ISE as performance index. Eng. Sci. Technol. Int. J. 2022, 33, 101072. [Google Scholar] [CrossRef]
- Mousakazemi, S.M.H. Comparison of the error-integral performance indexes in a GA-tuned PID controlling system of a PWR-type nuclear reactor point-kinetics model. Prog. Nucl. Energy 2021, 132, 103604. [Google Scholar] [CrossRef]
- Balestrino, A.; Landi, A.; Sani, L. Performance indices and controller design for switching converters. In Proceedings of the International Symposium on Power Electronics, Electrical Drives, Automation and Motion, Taormina, Italy, 23–26 May 2006; SPEEDAM 2006. IEEE: Taormina, Italy, 2006; pp. 1316–1321. [Google Scholar]
- Blondel, V.D.; Tsitsiklis, J.N. A survey of computational complexity results in systems and control. Automatica 2000, 36, 1249–1274. [Google Scholar] [CrossRef]
- Ribeiro, L.D.; Secchi, A.R. A Methodology to Obtain Analytical Models That Reduce the Computational Complexity Faced in Real Time Implementation of Nmpc Controllers. Braz. J. Chem. Eng. 2019, 36, 1255–1278. [Google Scholar] [CrossRef]
- Yan, S.; Cui, Y.; Li, C.; Gao, X.; Cai, Y. An Improved FCS-MPC Based on Novel Sector Optimization and Capacitor Charge Balance Algorithm for T-Type 3P-3L Converters. IEEE Trans. Power Electron. 2023, 38, 4559–4571. [Google Scholar] [CrossRef]
- Silva, J.J.; Espinoza, J.R.; Rohten, J.A.; Pulido, E.S.; Villarroel, F.A.; Torres, M.A.; Reyes, M.A. MPC Algorithm With Reduced Computational Burden and Fixed Switching Spectrum for a Multilevel Inverter in a Photovoltaic System. IEEE Access 2020, 8, 77405–77414. [Google Scholar] [CrossRef]
- Sands, T. Control of DC Motors to Guide Unmanned Underwater Vehicles. Appl. Sci. 2021, 11, 2144. [Google Scholar] [CrossRef]
- Menezes, J.; Sands, T. Discerning Discretization for Unmanned Underwater Vehicles DC Motor Control. J. Mar. Sci. Eng. 2023, 11, 436. [Google Scholar] [CrossRef]
- Wang, Z.; Sands, T. Artificial Intelligence-Enhanced UUV Actuator Control. AI 2023, 4, 270–288. [Google Scholar] [CrossRef]
- Koo, S.M.; Travis, H.; Sands, T. Impacts of Discretization and Numerical Propagation on the Ability to Follow Challenging Square Wave Commands. J. Mar. Sci. Eng. 2022, 10, 419. [Google Scholar] [CrossRef]
- Shah, R.; Sands, T. Comparing Methods of DC Motor Control for UUVs. Appl. Sci. 2021, 11, 4972. [Google Scholar] [CrossRef]
- Shtessel, Y.; Taleb, M.; Plestan, F. A novel adaptive-gain supertwisting sliding mode controller: Methodology and application. Automatica 2012, 48, 759–769. [Google Scholar] [CrossRef]
- Canciello, G.; Cavallo, A.; Guida, B. Control of Energy Storage Systems for Aeronautic Applications. J. Control Sci. Eng. 2017, 2017, 1–9. [Google Scholar] [CrossRef]
- Russo, A.; Cavallo, A. Supercapacitor stability and control for More Electric Aircraft application. In Proceedings of the 2020 European Control Conference (ECC), Saint Petersburg, Russia, 12–15 May 2020; IEEE: Saint Petersburg, Russia, 2020; pp. 1909–1914. [Google Scholar]
- Cavallo, A.; Canciello, G.; Russo, A. Integrated supervised adaptive control for the more Electric Aircraft. Automatica 2020, 117, 108956. [Google Scholar] [CrossRef]
- Canciello, G.; Cavallo, A.; Schiavo, A.L.; Russo, A. Multi-objective adaptive sliding manifold control for More Electric Aircraft. Isa Trans. 2020, 107, 316–328. [Google Scholar] [CrossRef] [PubMed]
- Cavallo, A.; Russo, A.; Canciello, G. Hierarchical control for generator and battery in the more electric aircraft. Sci. China Inf. Sci. 2019, 62, 192207. [Google Scholar] [CrossRef]
- Canciello, G.; Russo, A.; Guida, B.; Cavallo, A. Supervisory Control for Energy Storage System Onboard Aircraft. In Proceedings of the 2018 IEEE International Conference on Environment and Electrical Engineering and 2018 IEEE Industrial and Commercial Power Systems Europe (EEEIC/I&CPS Europe), Palermo, Italy, 12–15 June 2018; IEEE: Palermo, Italy, 2018; pp. 1–6. [Google Scholar]
- Cavallo, A.; Canciello, G.; Russo, A. Supervised Energy Management in Advanced Aircraft Applications. In Proceedings of the 2018 European Control Conference (ECC), Limassol, Cyprus, 12–15 June 2018; IEEE: Limassol, Cyprus, 2018; pp. 2769–2774. [Google Scholar]
- Cavallo, A.; Canciello, G.; Guida, B. Supervisory control of DC-DC bidirectional converter for advanced aeronautic applications. Int. J. Robust Nonlinear Control 2018, 28, 1–15. [Google Scholar] [CrossRef]
- Kanieski, J.M.; Tambara, R.V.; Pinheiro, H.; Cardoso, R.; Gründling, H.A. Robust Adaptive Controller Combined With a Linear Quadratic Regulator Based on Kalman Filtering. IEEE Trans. Autom. Control 2016, 61, 1373–1378. [Google Scholar] [CrossRef]
- Bimarta, R.; Tran, T.V.; Kim, K.H. Frequency-Adaptive Current Controller Design Based on LQR State Feedback Control for a Grid-Connected Inverter under Distorted Grid. Energies 2018, 11, 2674. [Google Scholar] [CrossRef]
- Kulikowski, K.; Sikorski, A. New DPC Look-Up Table Methods for Three-Level AC/DC Converter. IEEE Trans. Ind. Electron. 2016, 63, 7930–7938. [Google Scholar] [CrossRef]
- Zhang, Y.; Qu, C. Table-Based Direct Power Control for Three-Phase AC/DC Converters Under Unbalanced Grid Voltages. IEEE Trans. Power Electron. 2015, 30, 7090–7099. [Google Scholar] [CrossRef]
- Yan, S.; Yang, Y.; Hui, S.Y.; Blaabjerg, F. A Review on Direct Power Control of Pulsewidth Modulation Converters. IEEE Trans. Power Electron. 2021, 36, 11984–12007. [Google Scholar] [CrossRef]
- Alonso-Martínez, J.; Carrasco, J.E.; Arnaltes, S. Table-Based Direct Power Control: A Critical Review for Microgrid Applications. IEEE Trans. Power Electron. 2010, 25, 2949–2961. [Google Scholar] [CrossRef]
- Ren, X.; Guo, Z.; Wu, Y.; Zhang, Z.; Chen, Q. Adaptive LUT-Based Variable On-Time Control for CRM Boost PFC Converters. IEEE Trans. Power Electron. 2018, 33, 8123–8136. [Google Scholar] [CrossRef]
- Yahagi, S.; Kajiwara, I. Direct Data-Driven Tuning of Look-Up Tables for Feedback Control Systems. IEEE Control Syst. Lett. 2022, 6, 2966–2971. [Google Scholar] [CrossRef]
- Udavalakshmi, J.K.; Sheik, M.S. Comparative Study of Perturb & Observe and Look -Up Table Maximum Power Point Tracking Techniques using MATLABISimulink. In Proceedings of the 2018 International Conference on Current Trends towards Converging Technologies (ICCTCT), Coimbatore, India, 1–3 March 2018; IEEE: Coimbatore, India, 2018; pp. 1–5. [Google Scholar]
- Tu, S.H.L.; Yeh, H.W. A PWM controller with table look-up for DC-DC class E buck/boost conversion. In Proceedings of the 2013 IEEE International Conference of Electron Devices and Solid-state Circuits, Hong Kong, China, 3–5 June 2013; IEEE: Hong Kong, China, 2013; pp. 1–2. [Google Scholar]
- Chiu, M.M.H.; Tu, S.H.L. A Novel DPWM Based on Fully Table Look-Up for High-Frequency Power Conversion. In Proceedings of the APCCAS 2006 IEEE Asia Pacific Conference on Circuits and Systems, Singapore, 4–7 December 2006; IEEE: Singapore, 2006; pp. 678–681. [Google Scholar]
- Zheng, H.; Zou, T.; Hu, J.; Yu, H. An Offline Optimization and Online Table Look-Up Strategy of Two-Layer Model Predictive Control. IEEE Access 2018, 6, 47433–47441. [Google Scholar] [CrossRef]
- Held, M.; Flärdh, O.; Mårtensson, J. Experimental evaluation of a look-ahead controller for a heavy-duty vehicle with varying velocity demands. Control Eng. Pract. 2021, 108, 104720. [Google Scholar] [CrossRef]
- Su, Z.; Shen, X.; Chen, F. Flow Control of Air Compressor in Fuel Cell System Based on Adaptive Look-Up Table Algorithm. In Proceedings of the 2010 International Conference on Electrical and Control Engineering, Wuhan, China, 25–27 June 2010; IEEE: Wuhan, China, 2010; pp. 3761–3766. [Google Scholar]
- Montenegro-Oviedo, J.A.; Ramos-Paja, C.A.; Orozco-Gutierrez, M.L.; Franco-Mejía, E.; Serna-Garcés, S.I. Adaptive Controller for Bus Voltage Regulation on a DC Microgrid Using a Sepic/Zeta Battery Charger/Discharger. Mathematics 2023, 11, 793. [Google Scholar] [CrossRef]
- Agrawal, N.; Samanta, S.; Ghosh, S. Modified LQR Technique for Fuel-Cell-Integrated Boost Converter. IEEE Trans. Ind. Electron. 2021, 68, 5887–5896. [Google Scholar] [CrossRef]
- Hwang, C.K.; Huang, K.S.; Lin, K.B.; Lee, B.K. Observer base linear quadratic regulation with estimated state feedback control. In Proceedings of the 2010 International Conference on Machine Learning and Cybernetics, Qingdao, China, 11–14 July 2010; Volume 6, pp. 2802–2805. [Google Scholar]
- Brogan, W.L. Modern Control Theory, 3rd ed.; Prentice-Hall: London, UK, 1990. [Google Scholar]
- MATLAB, version 9.12.0.188 (R2022a); The MathWorks Inc.: Natick, MA, USA, 2022.
Disclaimer/Publisher’s Note: The statements, opinions and data contained in all publications are solely those of the individual author(s) and contributor(s) and not of MDPI and/or the editor(s). MDPI and/or the editor(s) disclaim responsibility for any injury to people or property resulting from any ideas, methods, instructions or products referred to in the content. |
© 2023 by the authors. Licensee MDPI, Basel, Switzerland. This article is an open access article distributed under the terms and conditions of the Creative Commons Attribution (CC BY) license (https://creativecommons.org/licenses/by/4.0/).