Construction of Nitrogen Content Observer for Fuel Cell Hydrogen Circuit Based on Anode Recirculation Mode
Abstract
1. Introduction
2. System Model Establishment
- (1)
- The hydrogen in the hydrogen storage tank can be regarded as pure hydrogen, and the mixed gas in the anode circuit is applicable to the ideal gas law and Fick’s law;
- (2)
- The gas pressure is constant along the channel, and the pressure drop can be ignored for shorter straight channels;
- (3)
- The fuel cell stack and anode pipe are insulated systems, with each part at the same temperature and humidity;
- (4)
- The humidity of the proton exchange membrane is good, and the relative humidity of the gas in the pipeline and flow path is maintained at 95%;
- (5)
- The permeability coefficient of the stack membrane is related to the humidity and temperature of the membrane. When the stack operates stably, and the temperature is stable at around 70–80, C, the humidity of the membrane is stable at 95%. Therefore, the nitrogen permeability coefficient can be approximately constant.
2.1. Proportional Valve Model
2.2. Hydrogen Consumption Model
2.3. Nitrogen Crossover Model
2.4. Purge Valve Model
2.5. Recirculation Pump Model
2.6. Integrated Models
3. Experiment and Validation
3.1. Experiments and Model Parameter Calibration
3.2. Analysis of Experimental Results
3.3. Validation and Simulation of the Model
4. Discussion
5. Conclusions
- (1)
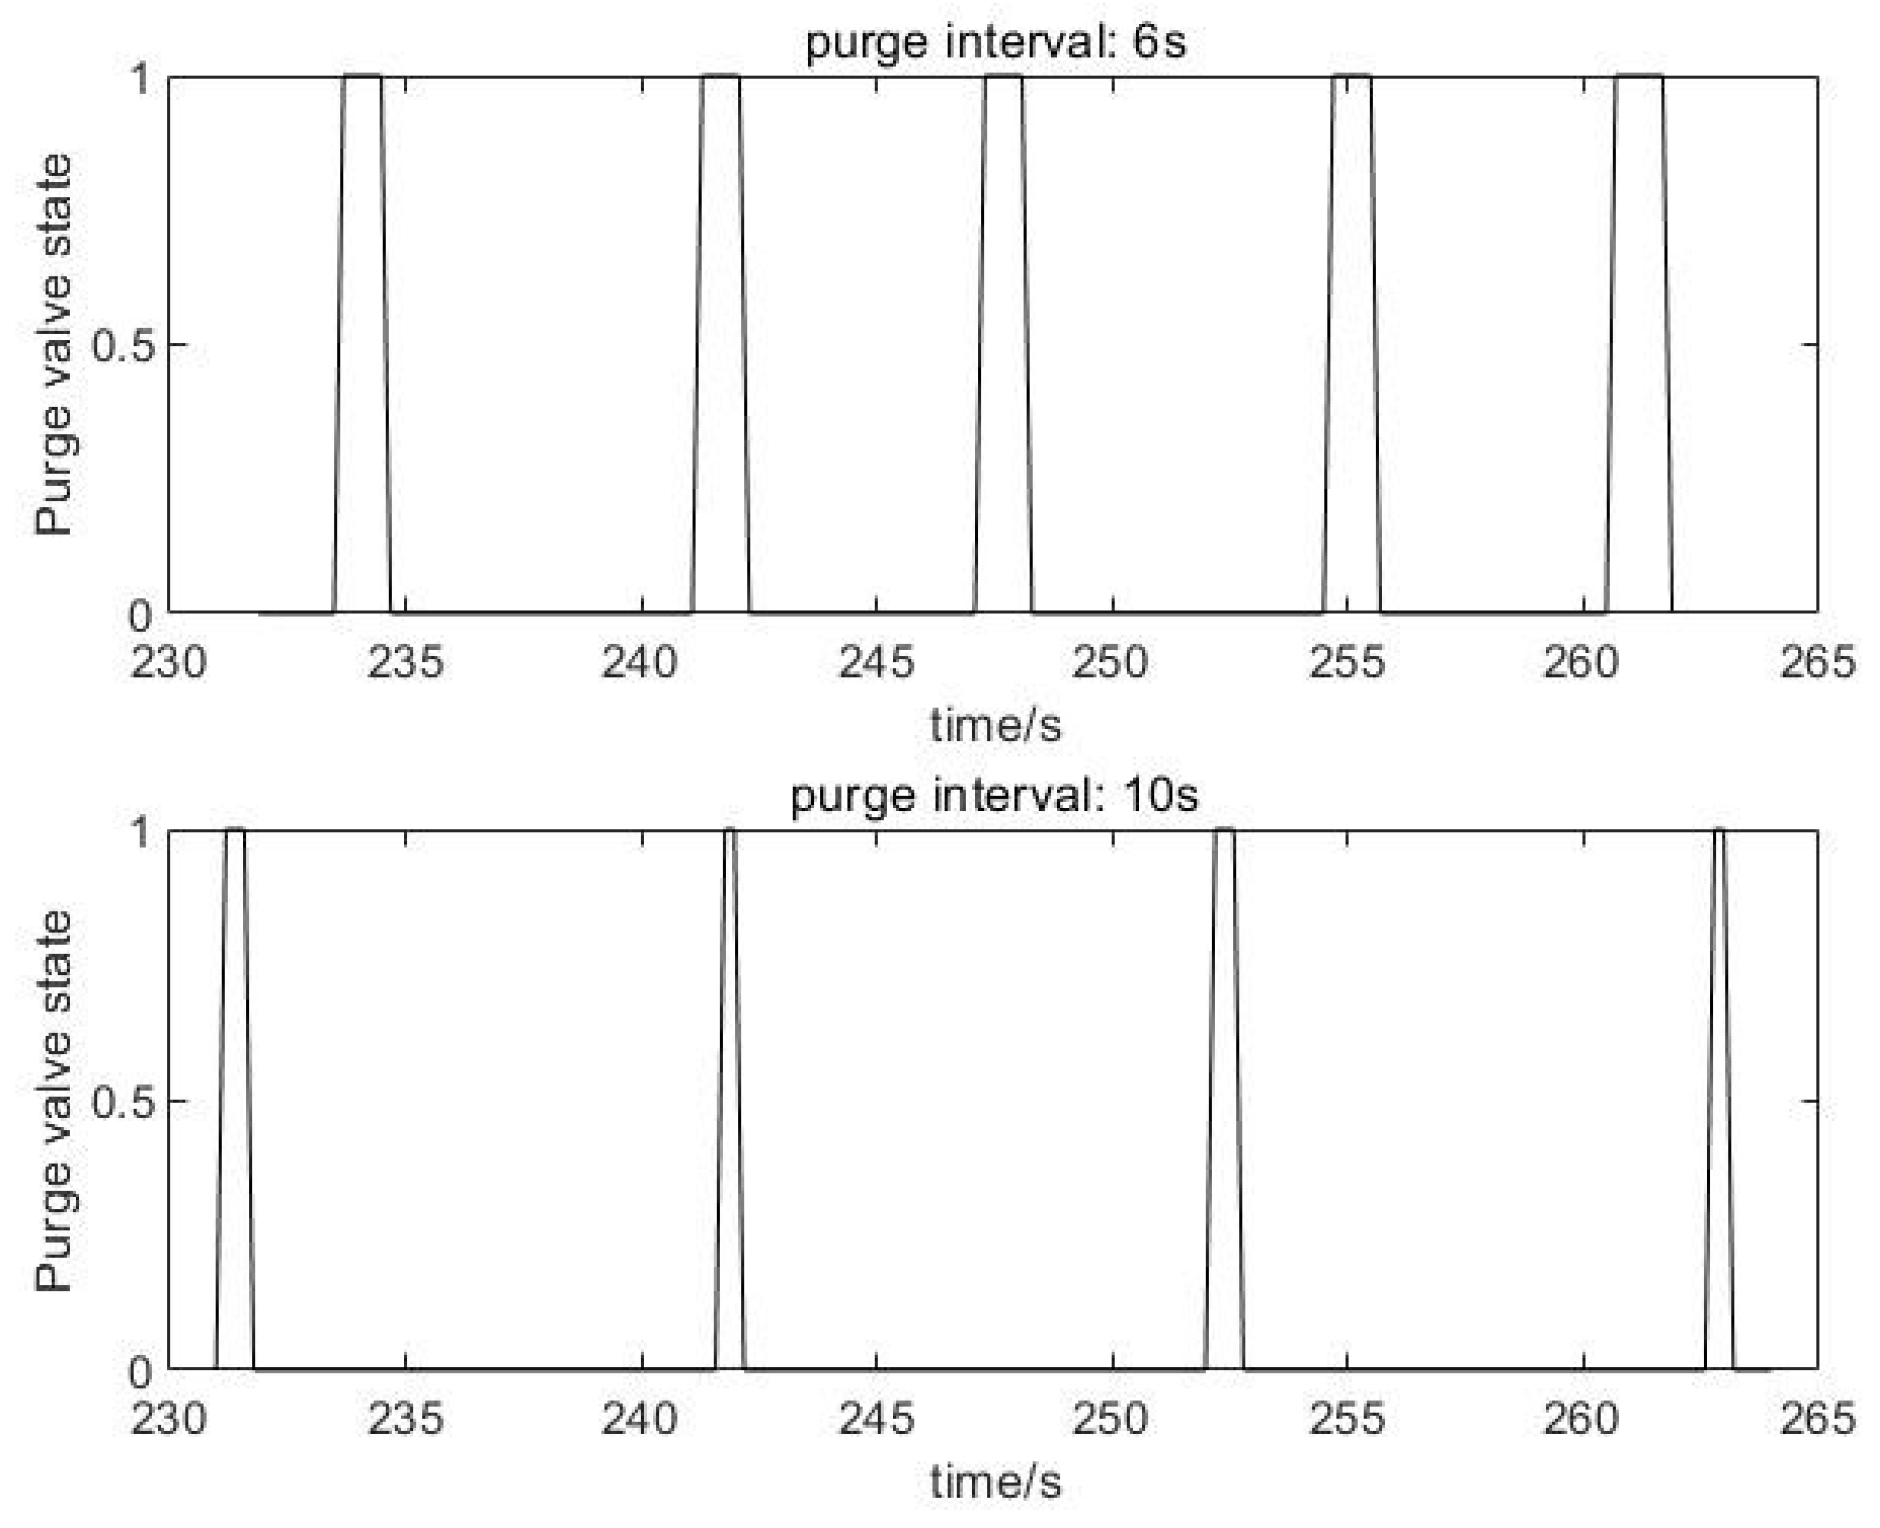
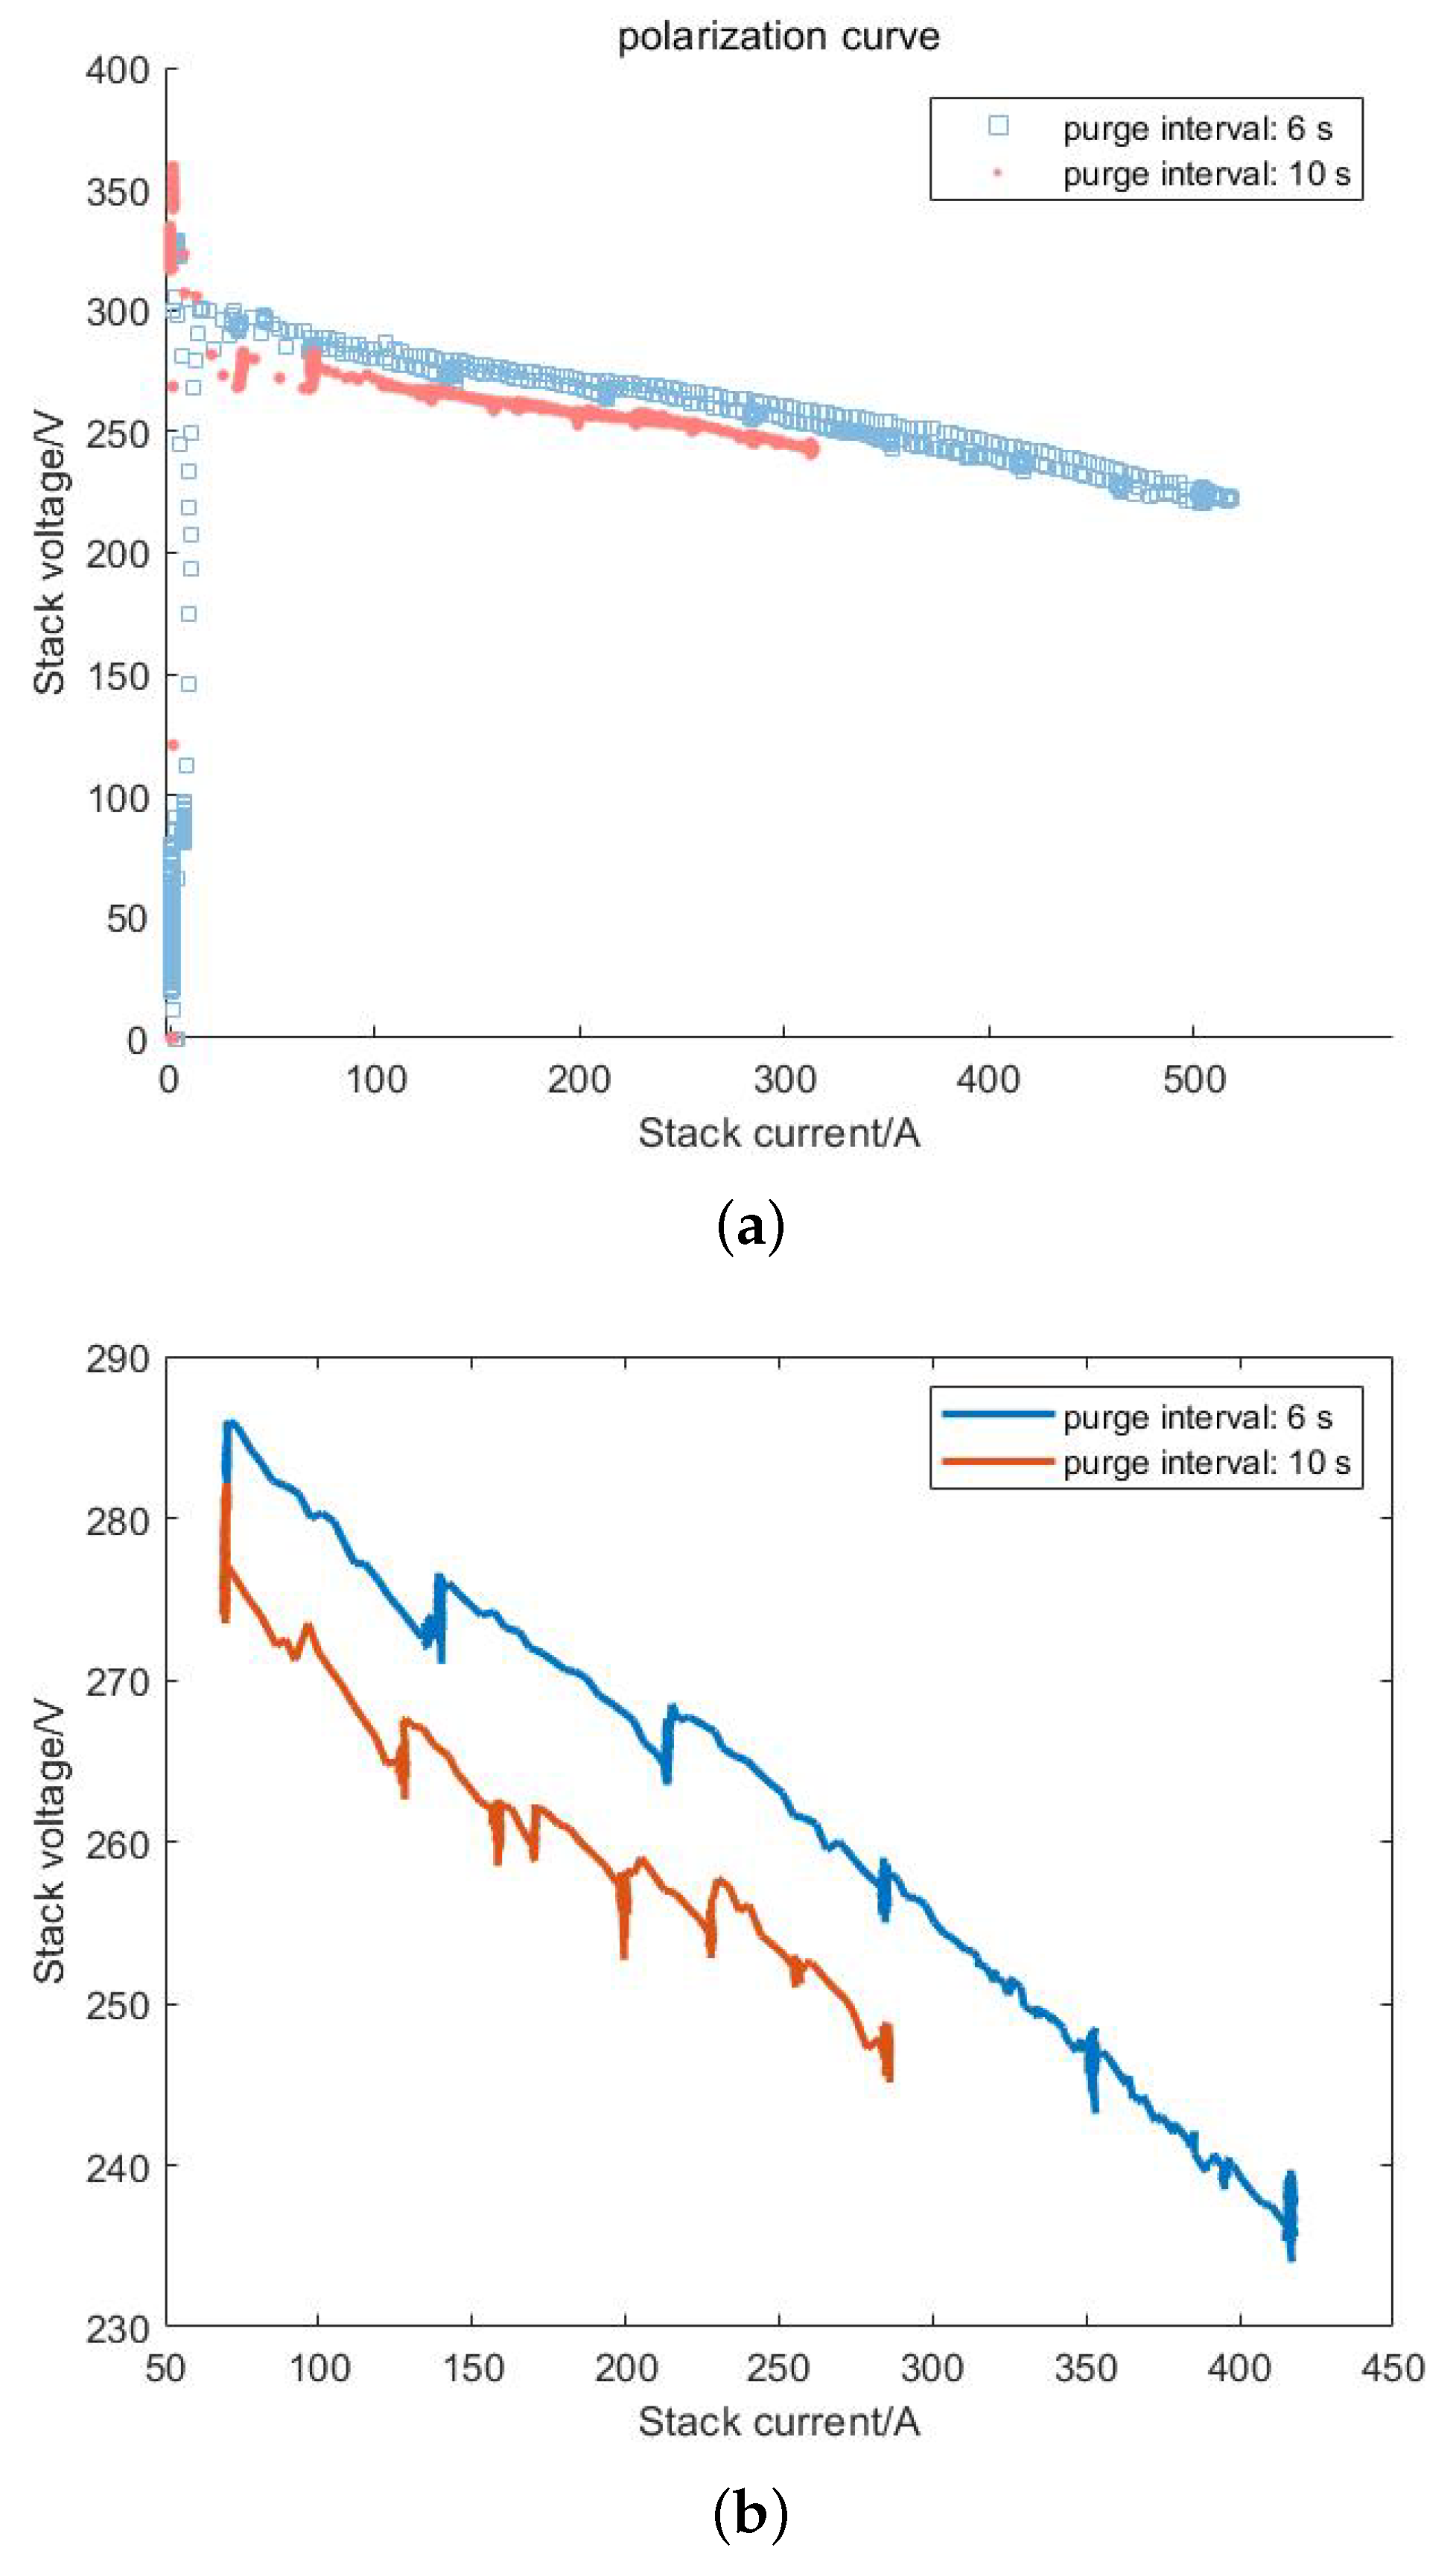
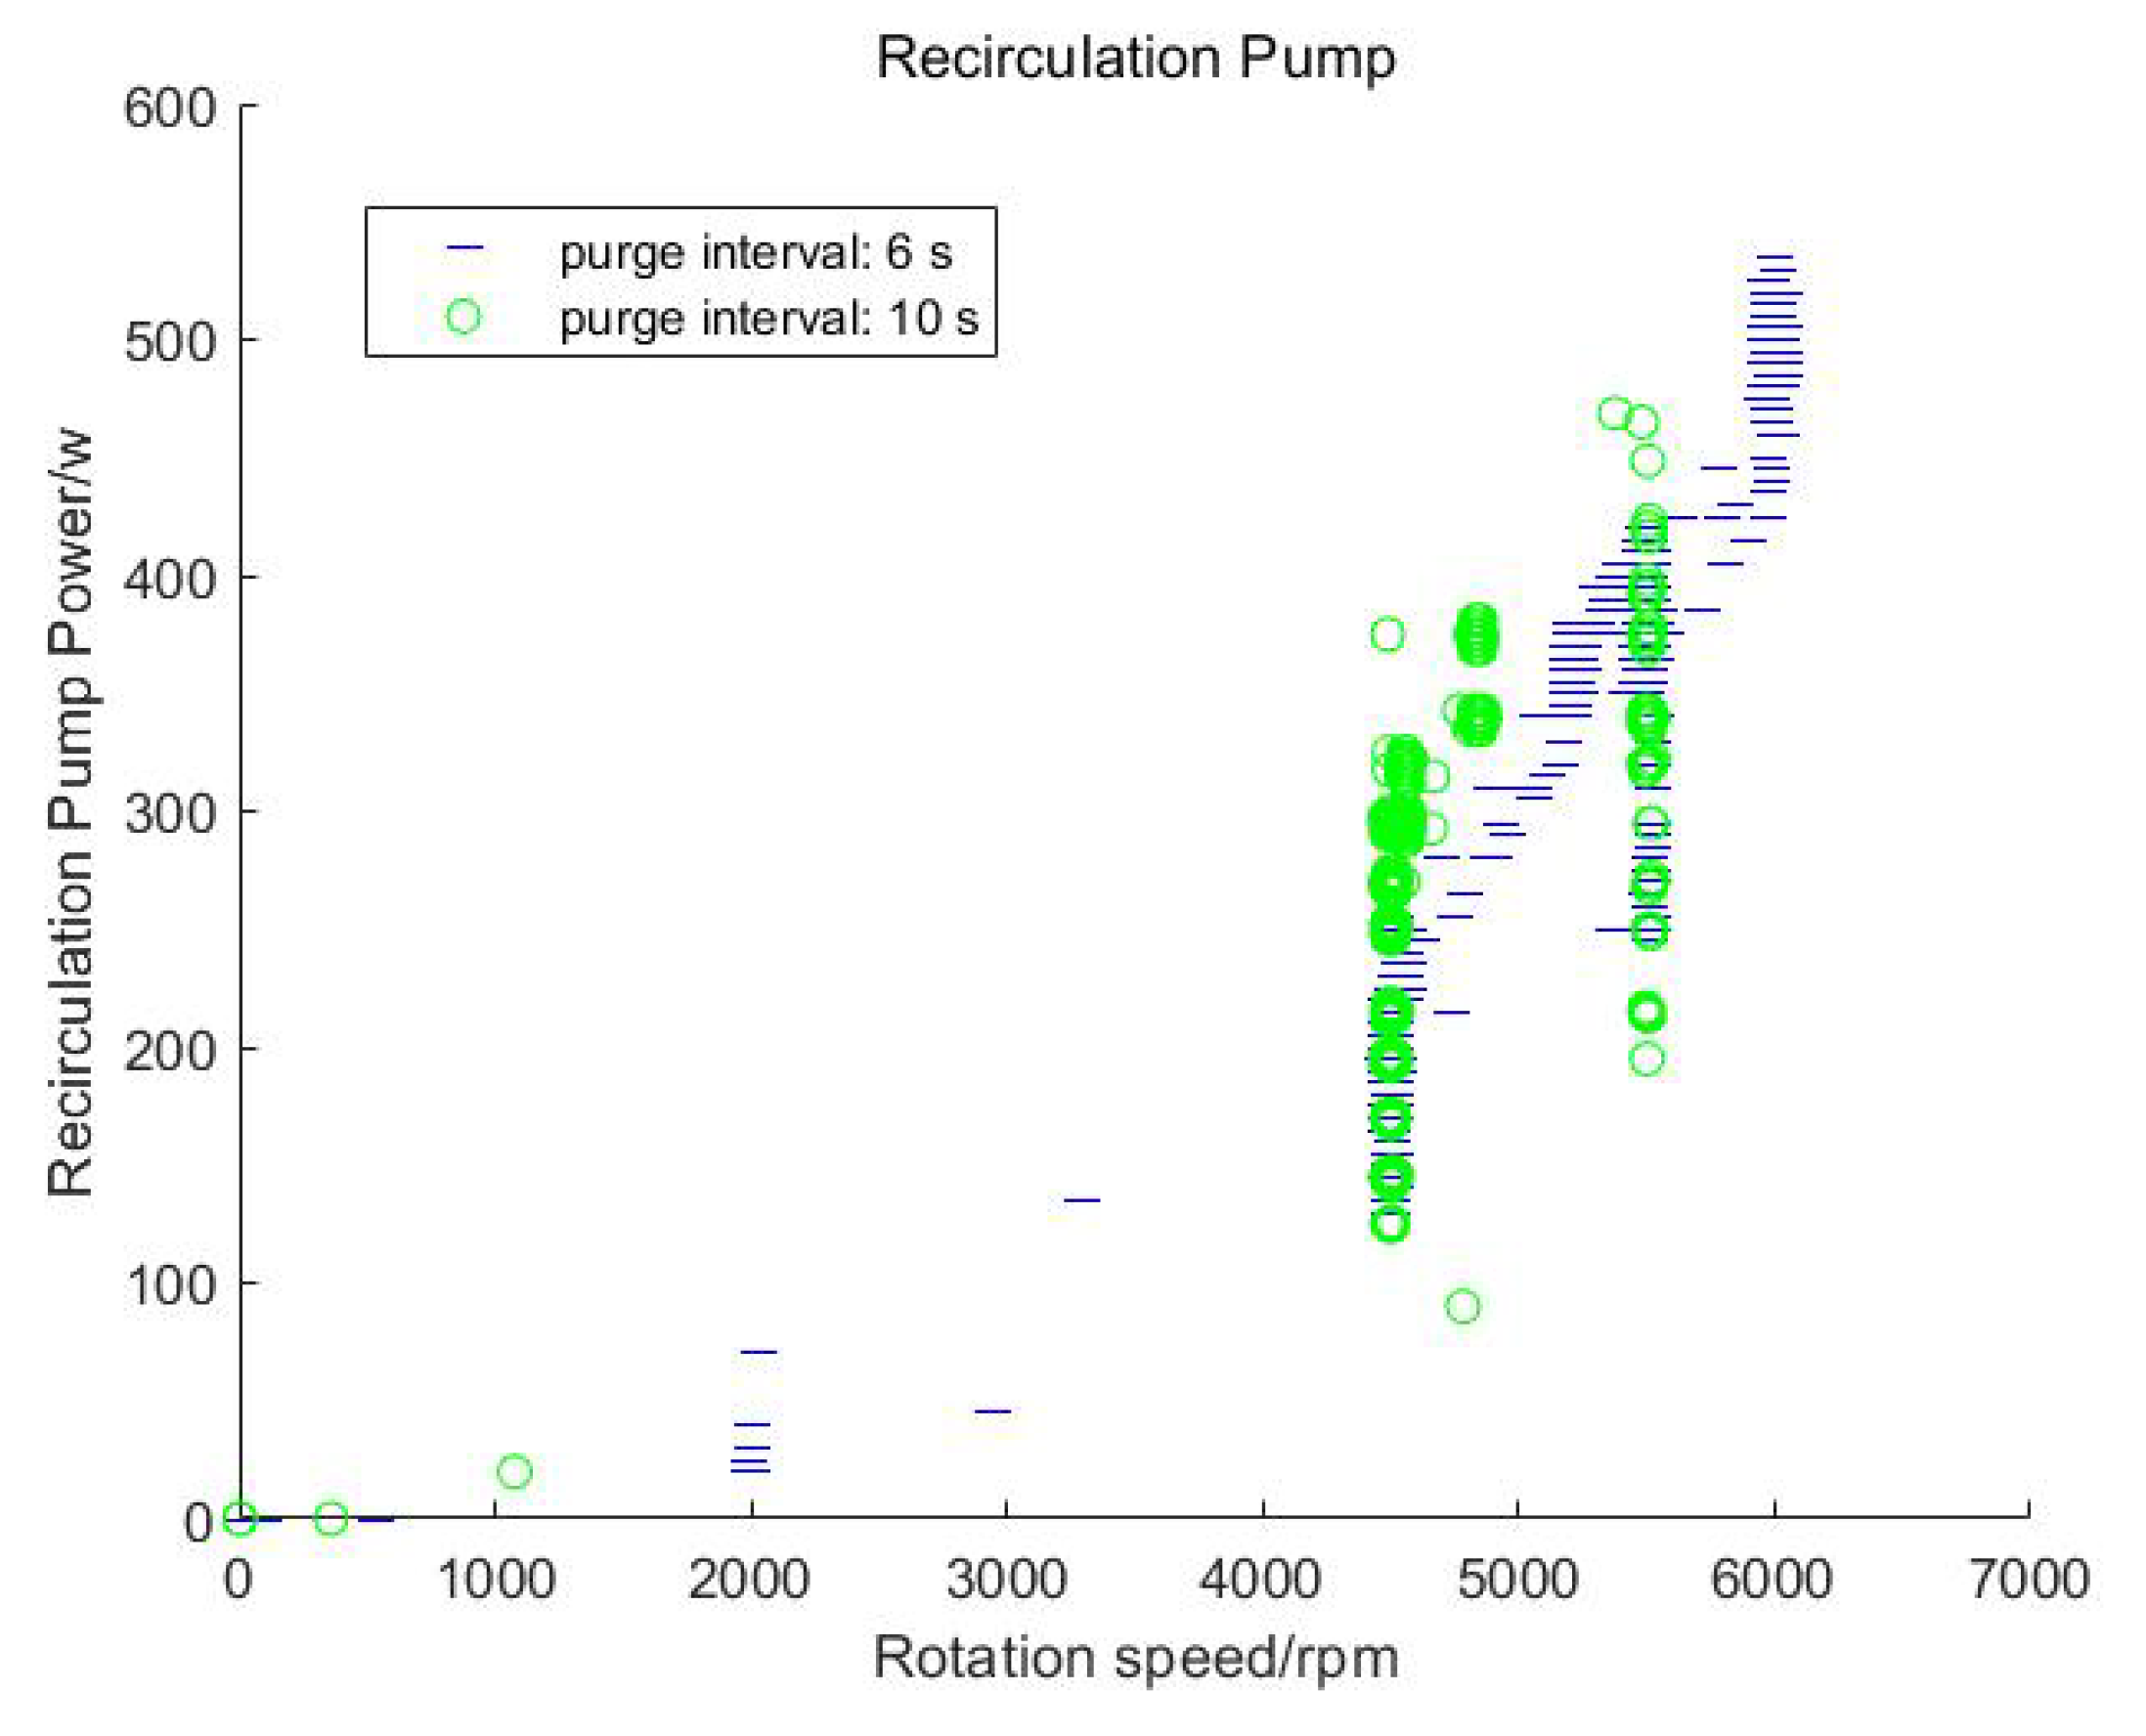
- According to experimental data, when the stack adopts two different scavenging intervals (6 s and 10 s), compared to the 10 s scavenging interval, the 6 s scavenging interval can reduce the energy consumption of the hydrogen circulation pump by 20%. Under the same current conditions, the output voltage of the stack is increased by 10 V. Purging can effectively reduce the nitrogen content in the anode, thereby restoring the stack performance.
- (2)
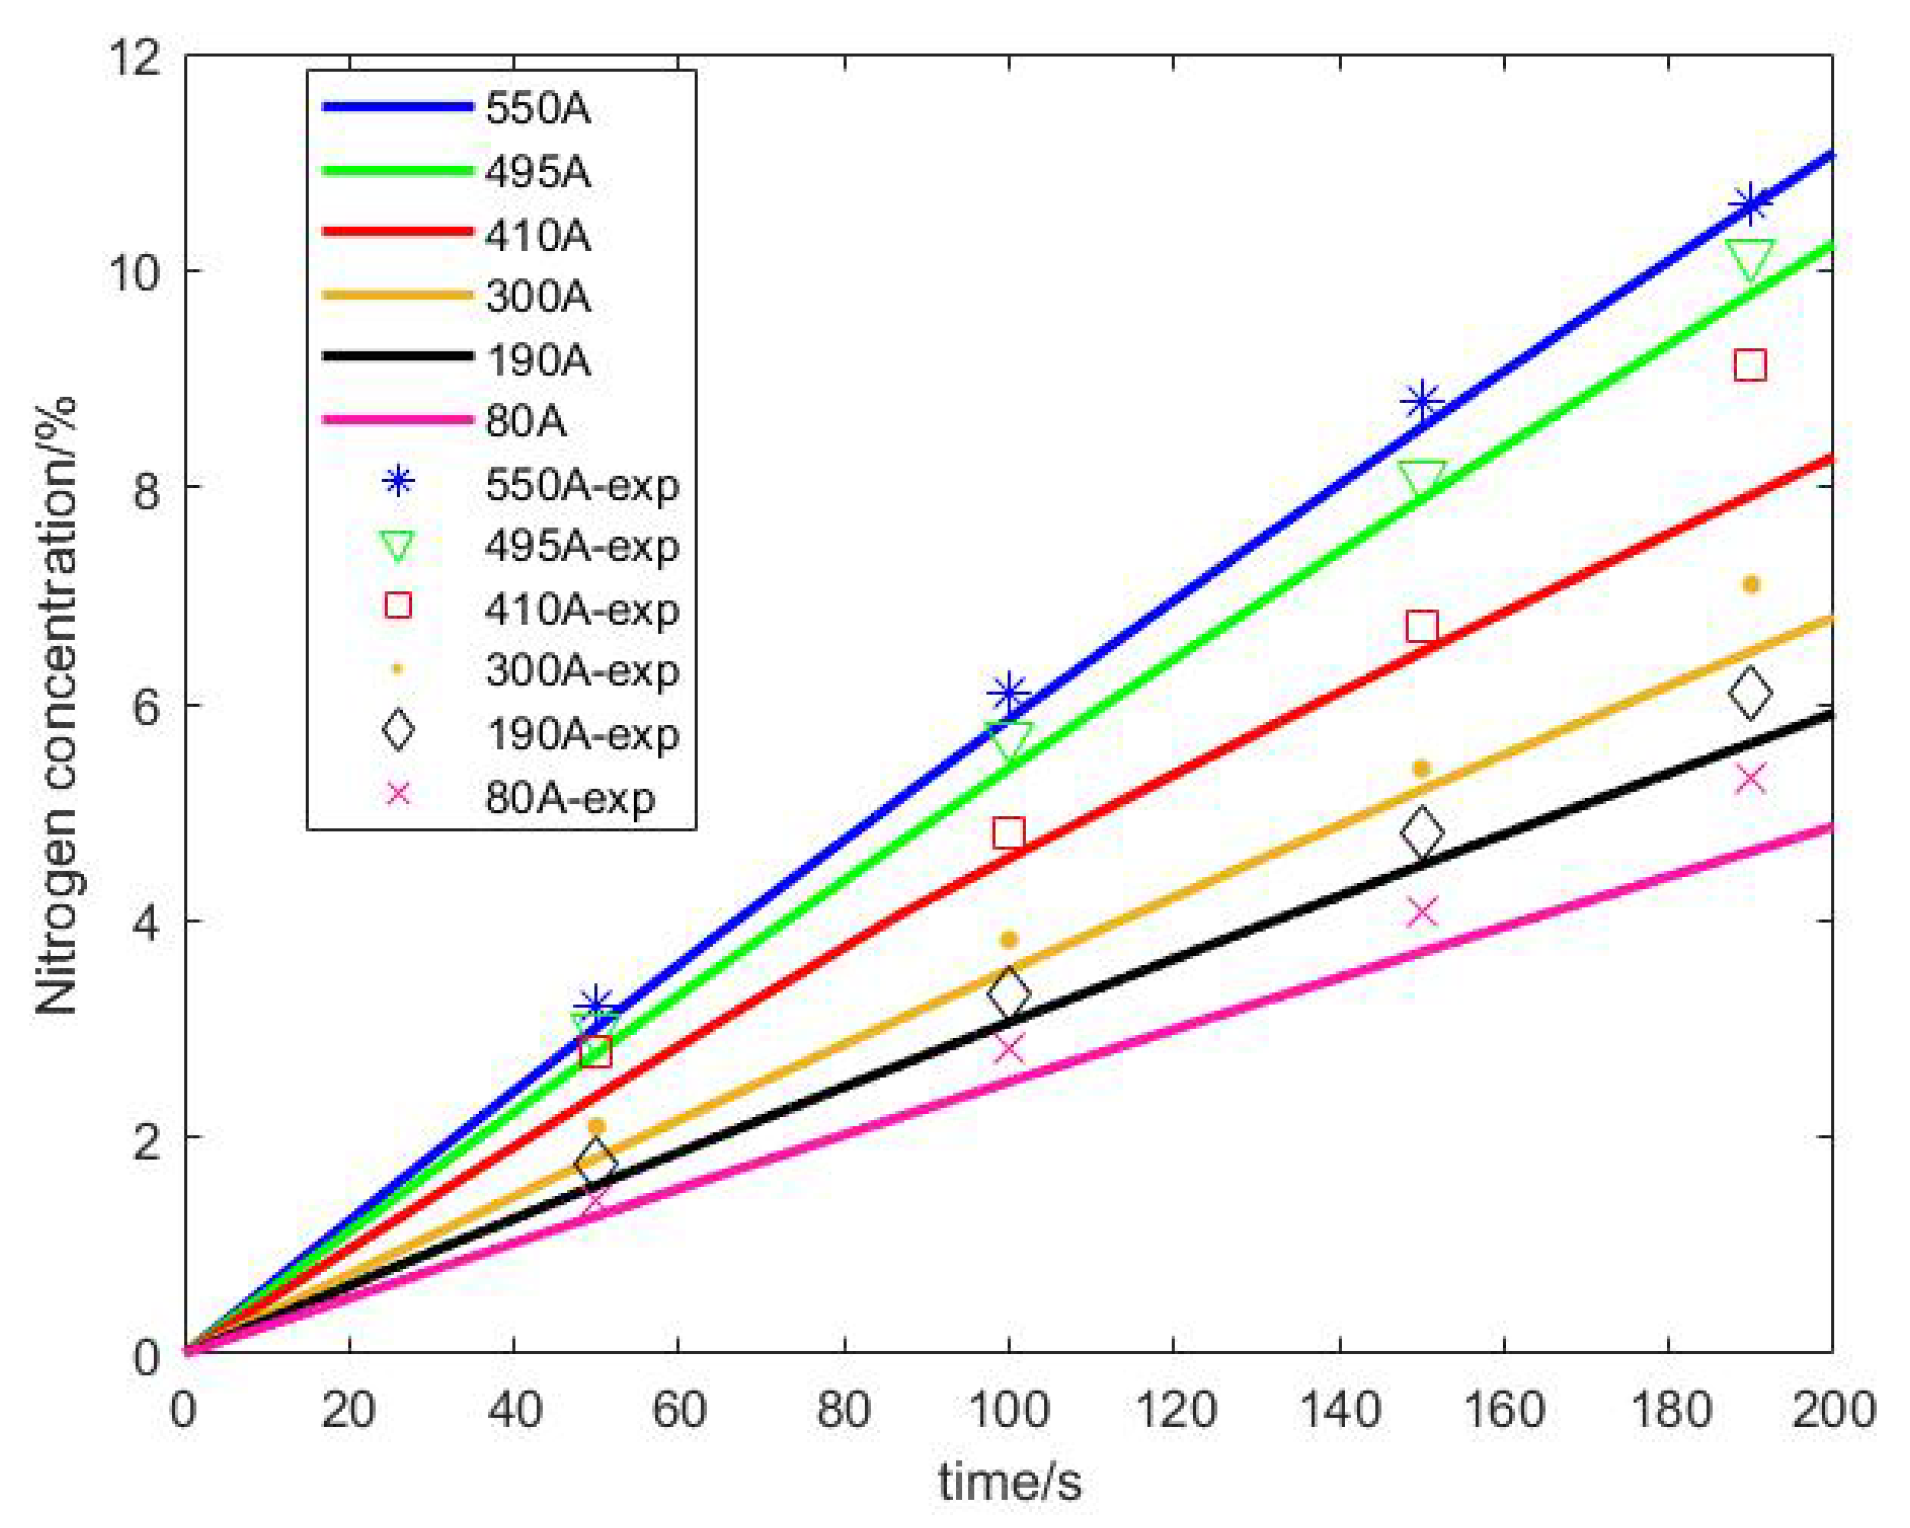
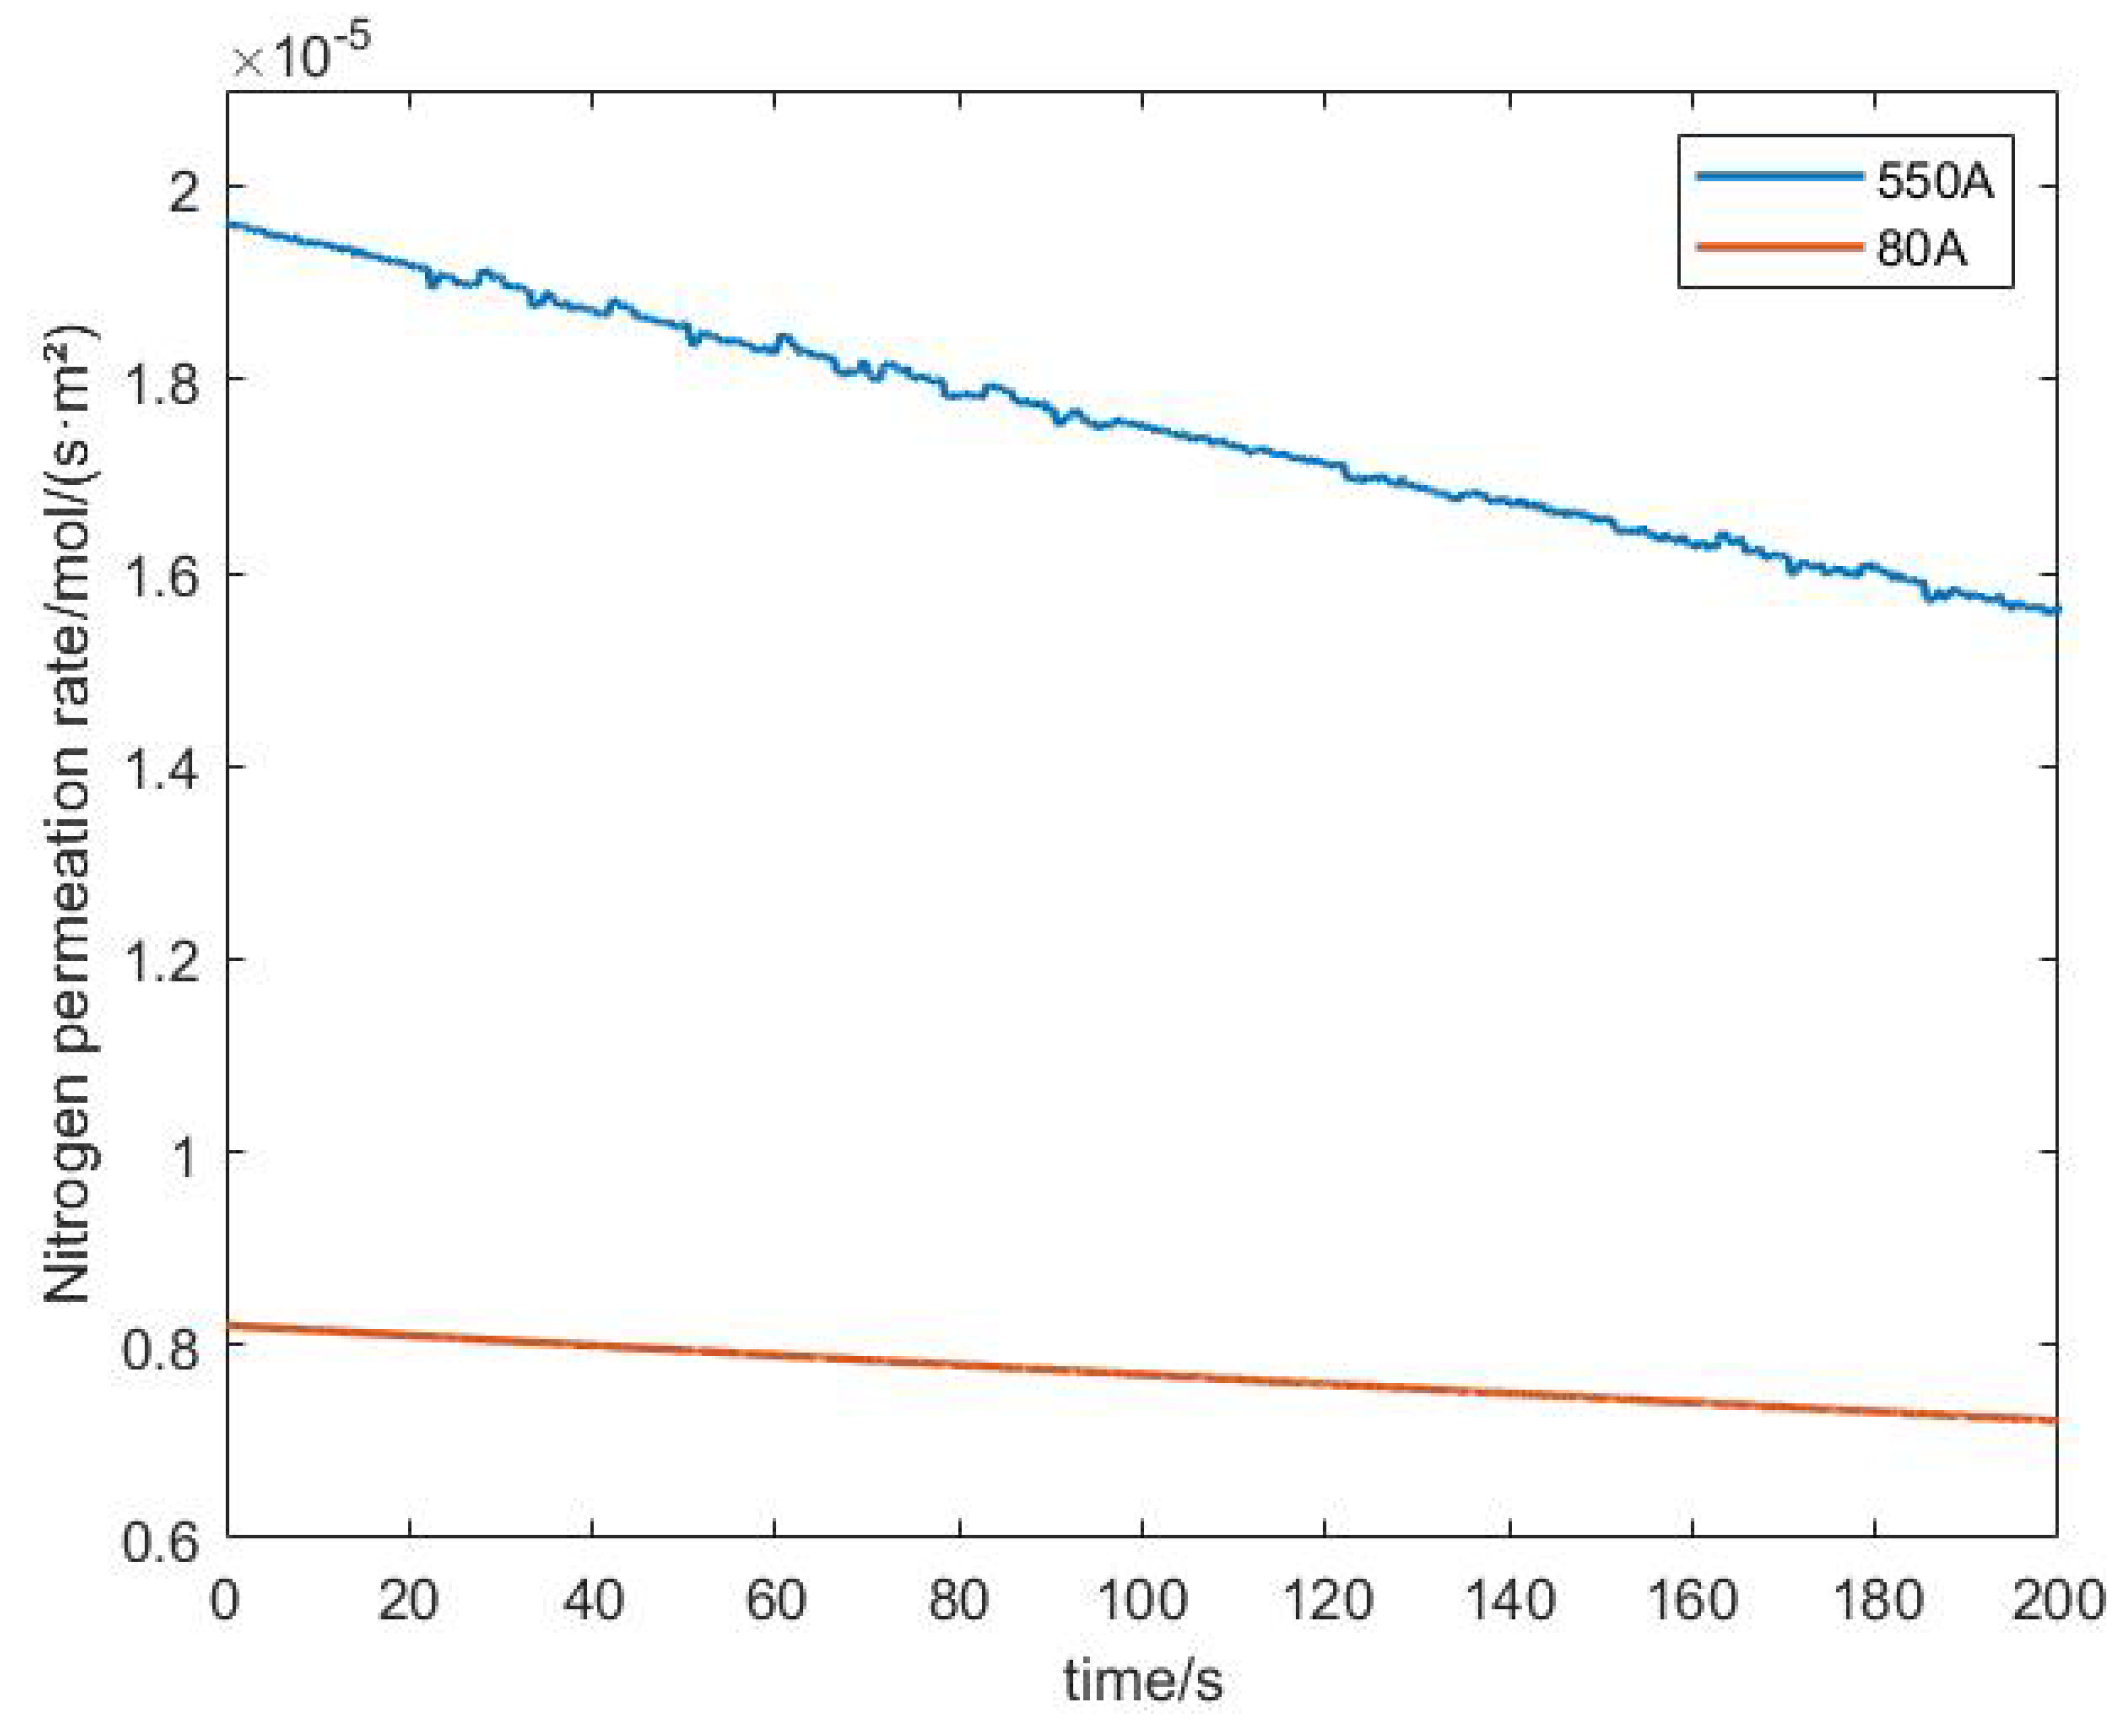
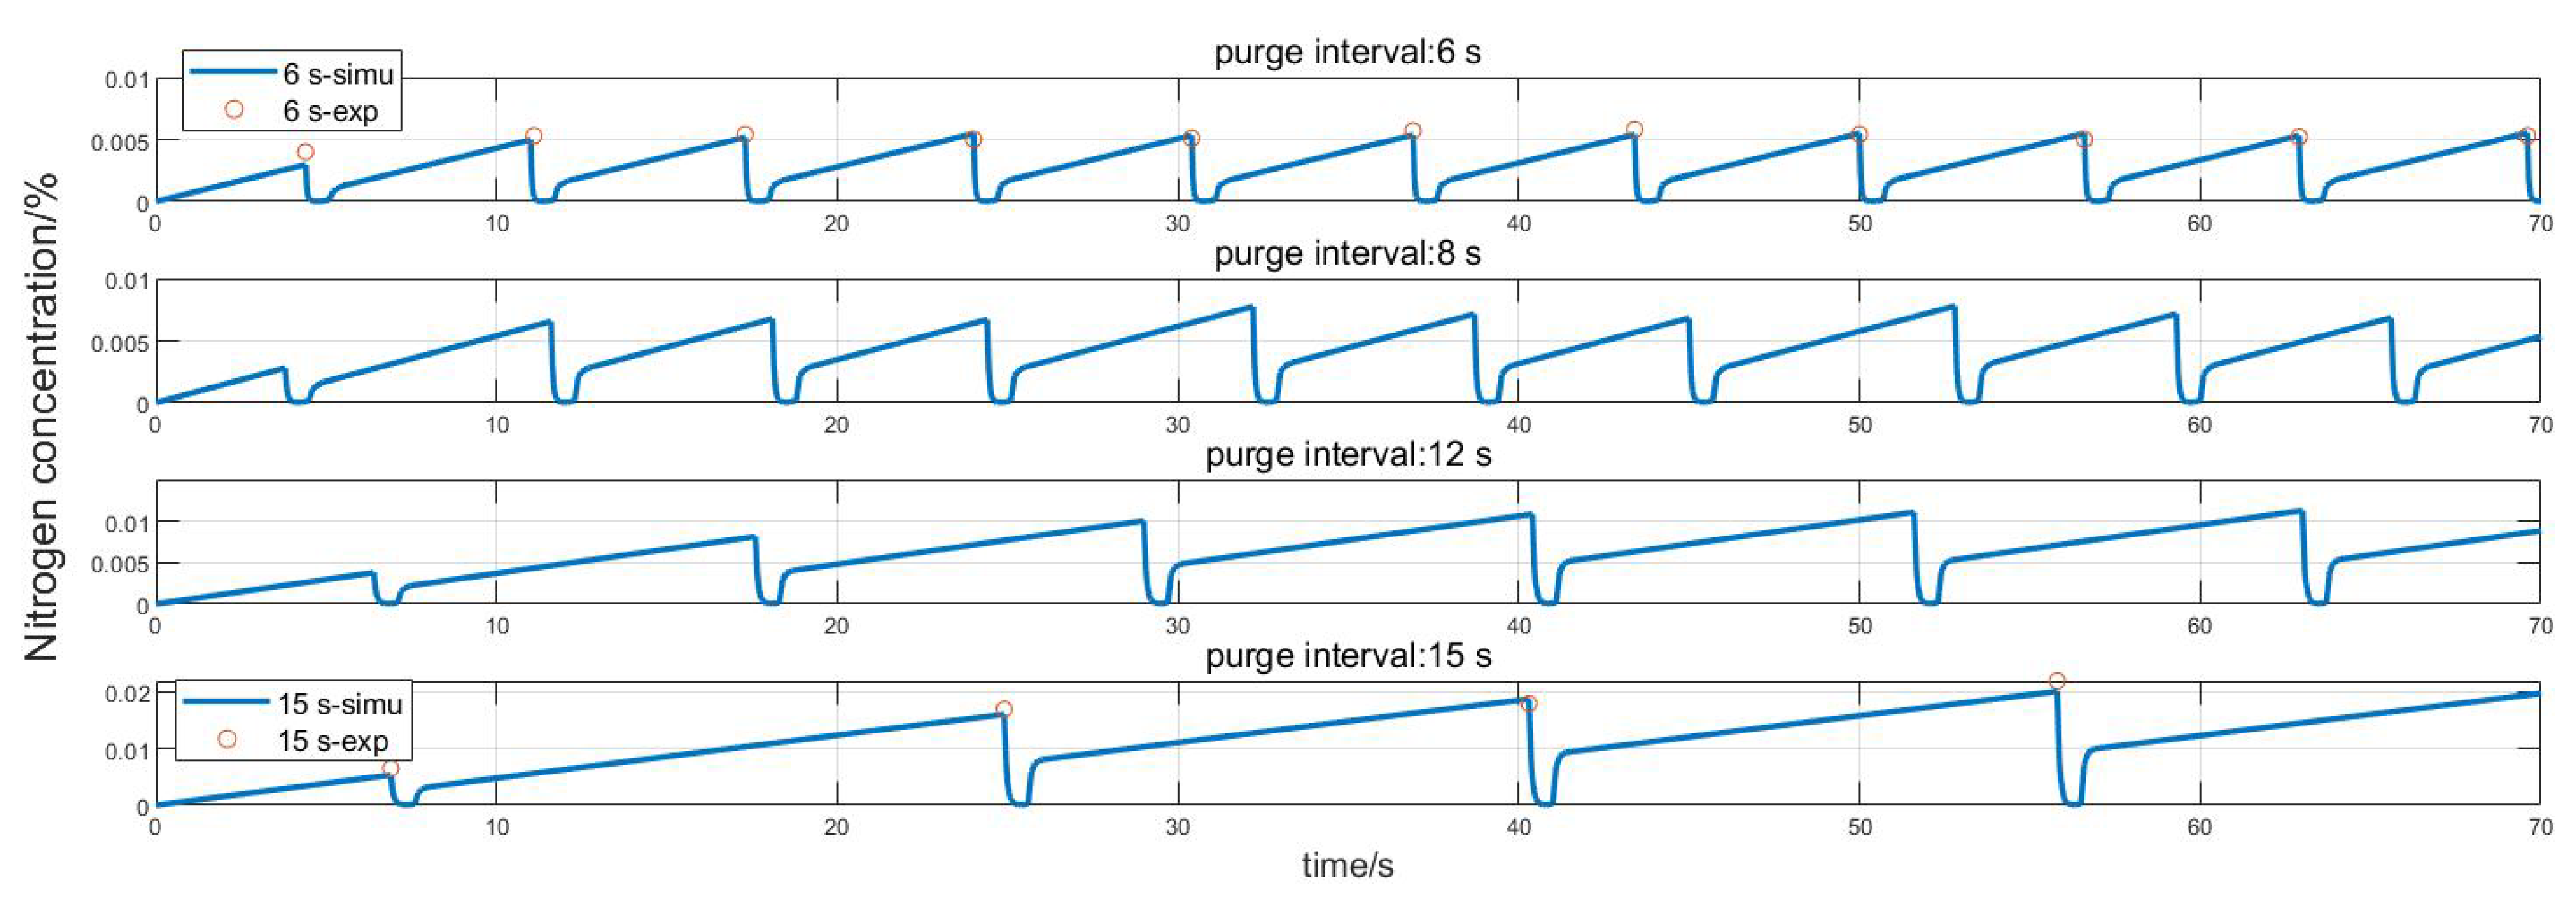
- Under different current densities, the rate of nitrogen accumulation varies. Under high load, the nitrogen permeation rate at an output current of 500 A is more than twice that at a low load of 30 A, and the nitrogen permeation rate linearly decreases with the accumulation of nitrogen. Compared to low loads, the nitrogen permeation rate decreases faster under high loads. Additionally, under the condition of 300 A output current, the purge interval gradually increases by 6 s, 8 s, 12 s, and 15 s, and the exponential growth of the nitrogen concentration approximately increases by 0.5%, 0.7%, 1.1%, and 2%, respectively.
- (3)
- The nitrogen content observer proposed in this article is compared with the experimental results, and the error is less than 5.5%, which can effectively observe the nitrogen content in the anode. The nitrogen observation model combined with Equation (19) can calculate the hydrogen loss rate in a purge cycle, which can be used as a quantitative basis for formulating purge strategies.
Author Contributions
Funding
Data Availability Statement
Conflicts of Interest
References
- Mohtadi, R.; Lee, W.K.; Cowan, S.; Zee, J.V.; Murthy, M. Effects of Hydrogen Sulfide on the Performance of a PEMFC. Electrochem. Solid-State Lett. 2003, 6, A272. [Google Scholar] [CrossRef]
- Hwang, J.-J. Passive hydrogen recovery schemes using a vacuum ejector in a proton exchange membrane fuel cell system. J. Power Sources 2014, 247, 256–263. [Google Scholar] [CrossRef]
- Kurnia, J.C.; Sasmito, A.P.; Shamim, T. Advances in proton exchange membrane fuel cell with dead-end anode operation: A review. Appl. Energy 2019, 252, 113416. [Google Scholar] [CrossRef]
- Li, S.; Wei, X.; Dai, H.; Yuan, H.; Ming, P. Voltammetric and galvanostatic methods for measuring hydrogen crossover in fuel cell. iScience 2022, 25, 103576. [Google Scholar] [CrossRef]
- Müller, E.A.; Kolb, F.; Guzzella, L.; Stefanopoulou, A.G.; McKay, D.A. Correlating Nitrogen Accumulation With Temporal Fuel Cell Performance. J. Fuel Cell Sci. Technol. 2010, 7, 021013. [Google Scholar] [CrossRef]
- Kocha, S.; Yang, J.; Yi, J. Characterization of gas crossover and its implications in PEM fuel cells. AIChE J. 2006, 52, 1916–1925. [Google Scholar] [CrossRef]
- Zhao, D.; Huangfu, Y.; Dou, M.; Fei, G. Cathode partial pressures estimation of a proton exchange membrane fuel cell for transportation applications. In Proceedings of the 2014 IEEE Transportation Electrification Conference and Expo, Asia-Pacific (ITEC Asia-Pacific), Beijing, China, 31 August–3 September 2014. [Google Scholar]
- Baik, K.D.; Kim, M.S. Characterization of nitrogen gas crossover through the membrane in proton-exchange membrane fuel cells. Int. J. Hydrog. Energy 2011, 36, 732–739. [Google Scholar] [CrossRef]
- Mittelsteadt, C.K.; Staser, J. Simultaneous Water Uptake, Diffusivity and Permeability Measurement of Perfluorinated Sulfonic Acid Polymer Electrolyte Membranes. ECS Trans. 2011, 41, 101. [Google Scholar] [CrossRef]
- Pukrushpan, J.; Peng, H.; Stefanopoulou, A. Control-Oriented Modeling and Analysis for Automotive Fuel Cell Systems. J. Dyn. Syst. Meas. Control 2004, 126, 14–25. [Google Scholar] [CrossRef]
- Yang, C.-W.; Chen, Y.-S. A mathematical model to study the performance of a proton exchange membrane fuel cell in a dead-ended anode mode. Appl. Energy 2014, 130, 113–121. [Google Scholar] [CrossRef]
- Chen, Y.-S.; Yang, C.-W.; Lee, J.-Y. Implementation and evaluation for anode purging of a fuel cell based on nitrogen concentration. Appl. Energy 2014, 113, 1519–1524. [Google Scholar] [CrossRef]
- Liu, Z.; Chen, J.; Liu, H.; Yan, C.; Hou, Y.; He, Q.; Zhang, J.; Hissel, D. Anode purge management for hydrogen utilization and stack durability improvement of PEM fuel cell systems. Appl. Energy 2020, 275, 115110. [Google Scholar] [CrossRef]
- Belvedere, B.; Bianchi, M.; Borghetti, A.; De Pascale, A.; Paolone, M.; Vecci, R. Experimental analysis of a PEM fuel cell performance at variable load with anodic exhaust management optimization. Int. J. Hydrog. Energy 2013, 38, 385–393. [Google Scholar] [CrossRef]
- Nishizawa, A.; Kallo, J.; Garrot, O.; Weiss-Ungethüm, J. Fuel cell and Li-ion battery direct hybridization system for aircraft applications. J. Power Sources 2013, 222, 294–300. [Google Scholar] [CrossRef]
- Wang, B.; Deng, H.; Jiao, K. Purge strategy optimization of proton exchange membrane fuel cell with anode recirculation. Appl. Energy 2018, 225, 1–13. [Google Scholar] [CrossRef]
- Pérez-Page, M.; Pérez-Herranz, V. Effect of the Operation and Humidification Temperatures on the Performance of a PEM Fuel Cell Stack. ECS Trans. 2009, 25, 733. [Google Scholar] [CrossRef]
- Siegel, J.B.; McKay, D.A.; Stefanopoulou, A.G.; Hussey, D.S.; Jacobson, D.L. Measurement of Liquid Water Accumulation in a PEMFC with Dead-Ended Anode. J. Electrochem. Soc. 2008, 155, B1168. [Google Scholar] [CrossRef]
- Rahimi-Esbo, M.; Ramiar, A.; Ranjbar, A.A.; Alizadeh, E. Design, manufacturing, assembling and testing of a transparent PEM fuel cell for investigation of water management and contact resistance at dead-end mode. Int. J. Hydrog. Energy 2017, 42, 11673–11688. [Google Scholar] [CrossRef]
- Pedicini, R.; Romagnoli, M.; Santangelo, P.E. A Critical Review of Polymer Electrolyte Membrane Fuel Cell Systems for Automotive Applications: Components, Materials, and Comparative Assessment. Energies 2023, 16, 3111. [Google Scholar] [CrossRef]
- Sasmito, A.P.; Ali, M.I.; Shamim, T. A Factorial Study to Investigate the Purging Effect on the Performance of a Dead-End Anode PEM Fuel Cell Stack. Fuel Cells 2015, 15, 160–169. [Google Scholar] [CrossRef]
- Okedi, T.I.; Meyer, Q.; Hunter, H.M.A.; Shearing, P.R.; Brett, D.J.L. Development of a polymer electrolyte fuel cell dead-ended anode purge strategy for use with a nitrogen-containing hydrogen gas supply. Int. J. Hydrog. Energy 2017, 42, 13850–13859. [Google Scholar] [CrossRef]
- Nikiforow, K.; Karimäki, H.; Keränen, T.M.; Ihonen, J. Optimization study of purge cycle in proton exchange membrane fuel cell system. J. Power Sources 2013, 238, 336–344. [Google Scholar] [CrossRef]
- Gomez, A.; Sasmito, A.P.; Shamim, T. Investigation of the purging effect on a dead-end anode PEM fuel cell-powered vehicle during segments of a European driving cycle. Energy Convers. Manag. 2015, 106, 951–957. [Google Scholar] [CrossRef]
- Type 2875-Direct-Acting 2 Way Standard Solenoid Control Valve. Available online: https://www.burkert.com/en/type/2875 (accessed on 12 May 2023).
- Rabbani, A.; Rokni, M. Effect of nitrogen crossover on purging strategy in PEM fuel cell systems. Appl. Energy 2013, 111, 1061–1070. [Google Scholar] [CrossRef]
- Mittelsteadt, C.; Umbrell, M. Gas Permeability in Perfluorinated Sulfonic Acid Polymer Electrolyte Membranes. ECS Meet. Abstr. 2006, 18, 770. [Google Scholar] [CrossRef]





| Symbol | Parameter | Value |
|---|---|---|
| Proportional valve flow coefficient | m3/h | |
| n | Cell number | 396 |
| s | Active area of the single cell | 275 cm2 |
| Membrane thickness | 60 | |
| Nitrogen permeability coefficient | × 10−15 mol/(m s Pa) | |
| V | Stack anode volume | m3 |
| Purge valve flow coefficient | m3/h | |
| R | Gas constant | K/(mol K) |
| F | Faraday constant | C/mol |
| Density of hydrogen | g/L | |
| Molar volume of gas | L/mol |
Disclaimer/Publisher’s Note: The statements, opinions and data contained in all publications are solely those of the individual author(s) and contributor(s) and not of MDPI and/or the editor(s). MDPI and/or the editor(s) disclaim responsibility for any injury to people or property resulting from any ideas, methods, instructions or products referred to in the content. |
© 2023 by the authors. Licensee MDPI, Basel, Switzerland. This article is an open access article distributed under the terms and conditions of the Creative Commons Attribution (CC BY) license (https://creativecommons.org/licenses/by/4.0/).
Share and Cite
Li, W.; Wei, X.; Wang, J.; Wang, X. Construction of Nitrogen Content Observer for Fuel Cell Hydrogen Circuit Based on Anode Recirculation Mode. World Electr. Veh. J. 2023, 14, 131. https://doi.org/10.3390/wevj14050131
Li W, Wei X, Wang J, Wang X. Construction of Nitrogen Content Observer for Fuel Cell Hydrogen Circuit Based on Anode Recirculation Mode. World Electric Vehicle Journal. 2023; 14(5):131. https://doi.org/10.3390/wevj14050131
Chicago/Turabian StyleLi, Weisong, Xuezhe Wei, Jiayuan Wang, and Xueyuan Wang. 2023. "Construction of Nitrogen Content Observer for Fuel Cell Hydrogen Circuit Based on Anode Recirculation Mode" World Electric Vehicle Journal 14, no. 5: 131. https://doi.org/10.3390/wevj14050131
APA StyleLi, W., Wei, X., Wang, J., & Wang, X. (2023). Construction of Nitrogen Content Observer for Fuel Cell Hydrogen Circuit Based on Anode Recirculation Mode. World Electric Vehicle Journal, 14(5), 131. https://doi.org/10.3390/wevj14050131


