Energy Management Strategy for P1 + P3 Plug-In Hybrid Electric Vehicles
Abstract
1. Introduction
2. Materials and Methods
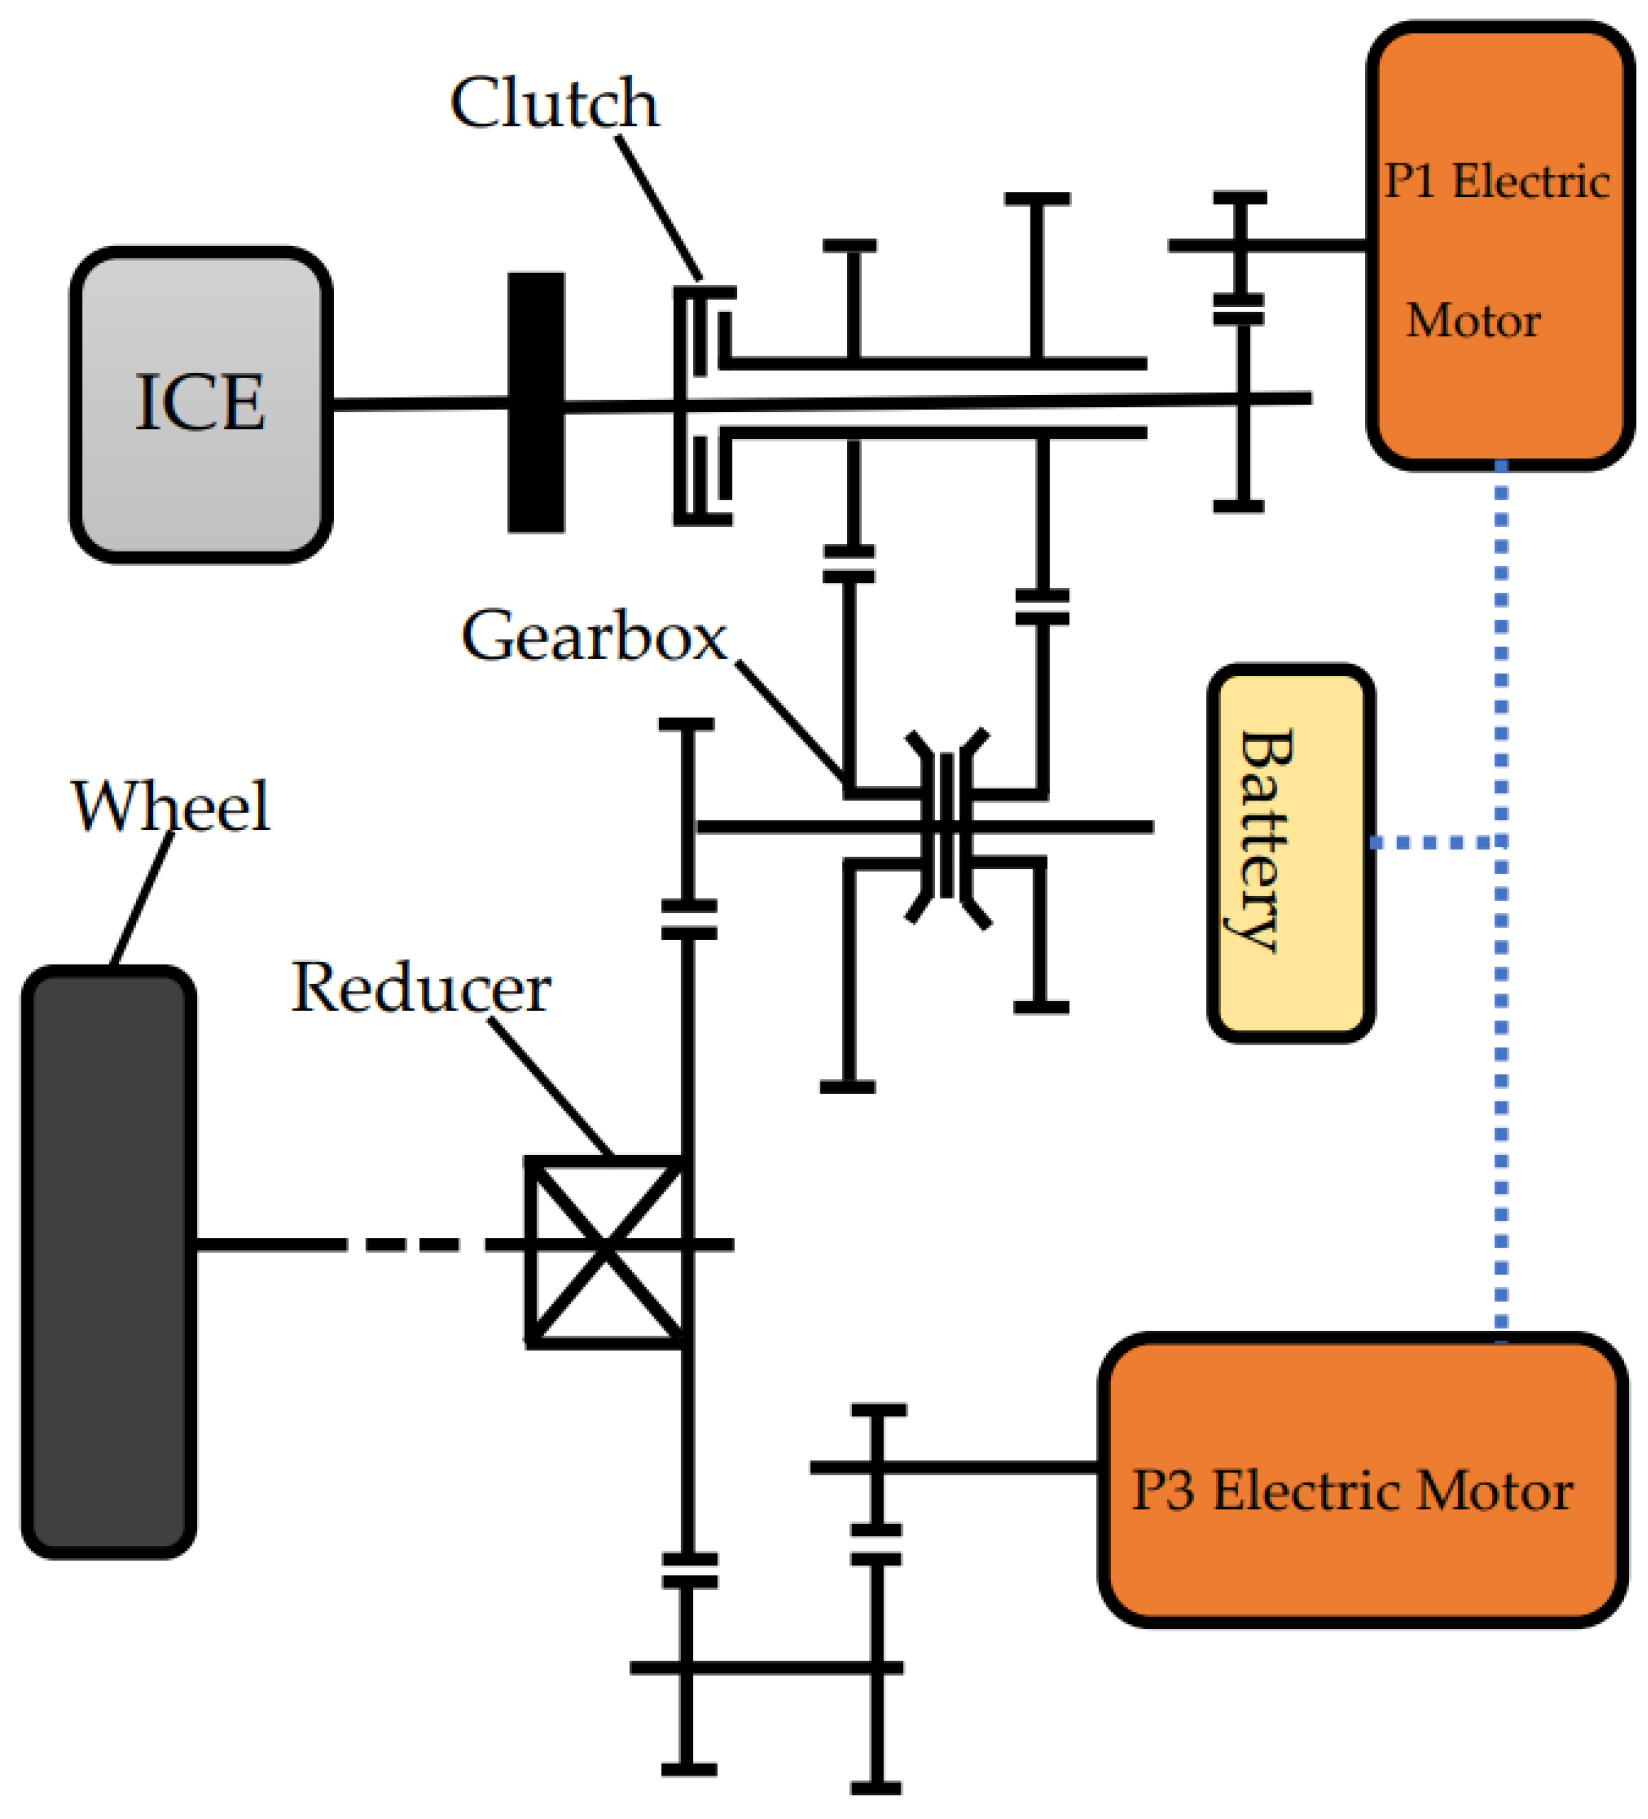
2.1. Structure of the P1 + P3 Plug-in Hybrid Powertrain System
2.2. Rule-Based Energy Management Strategy
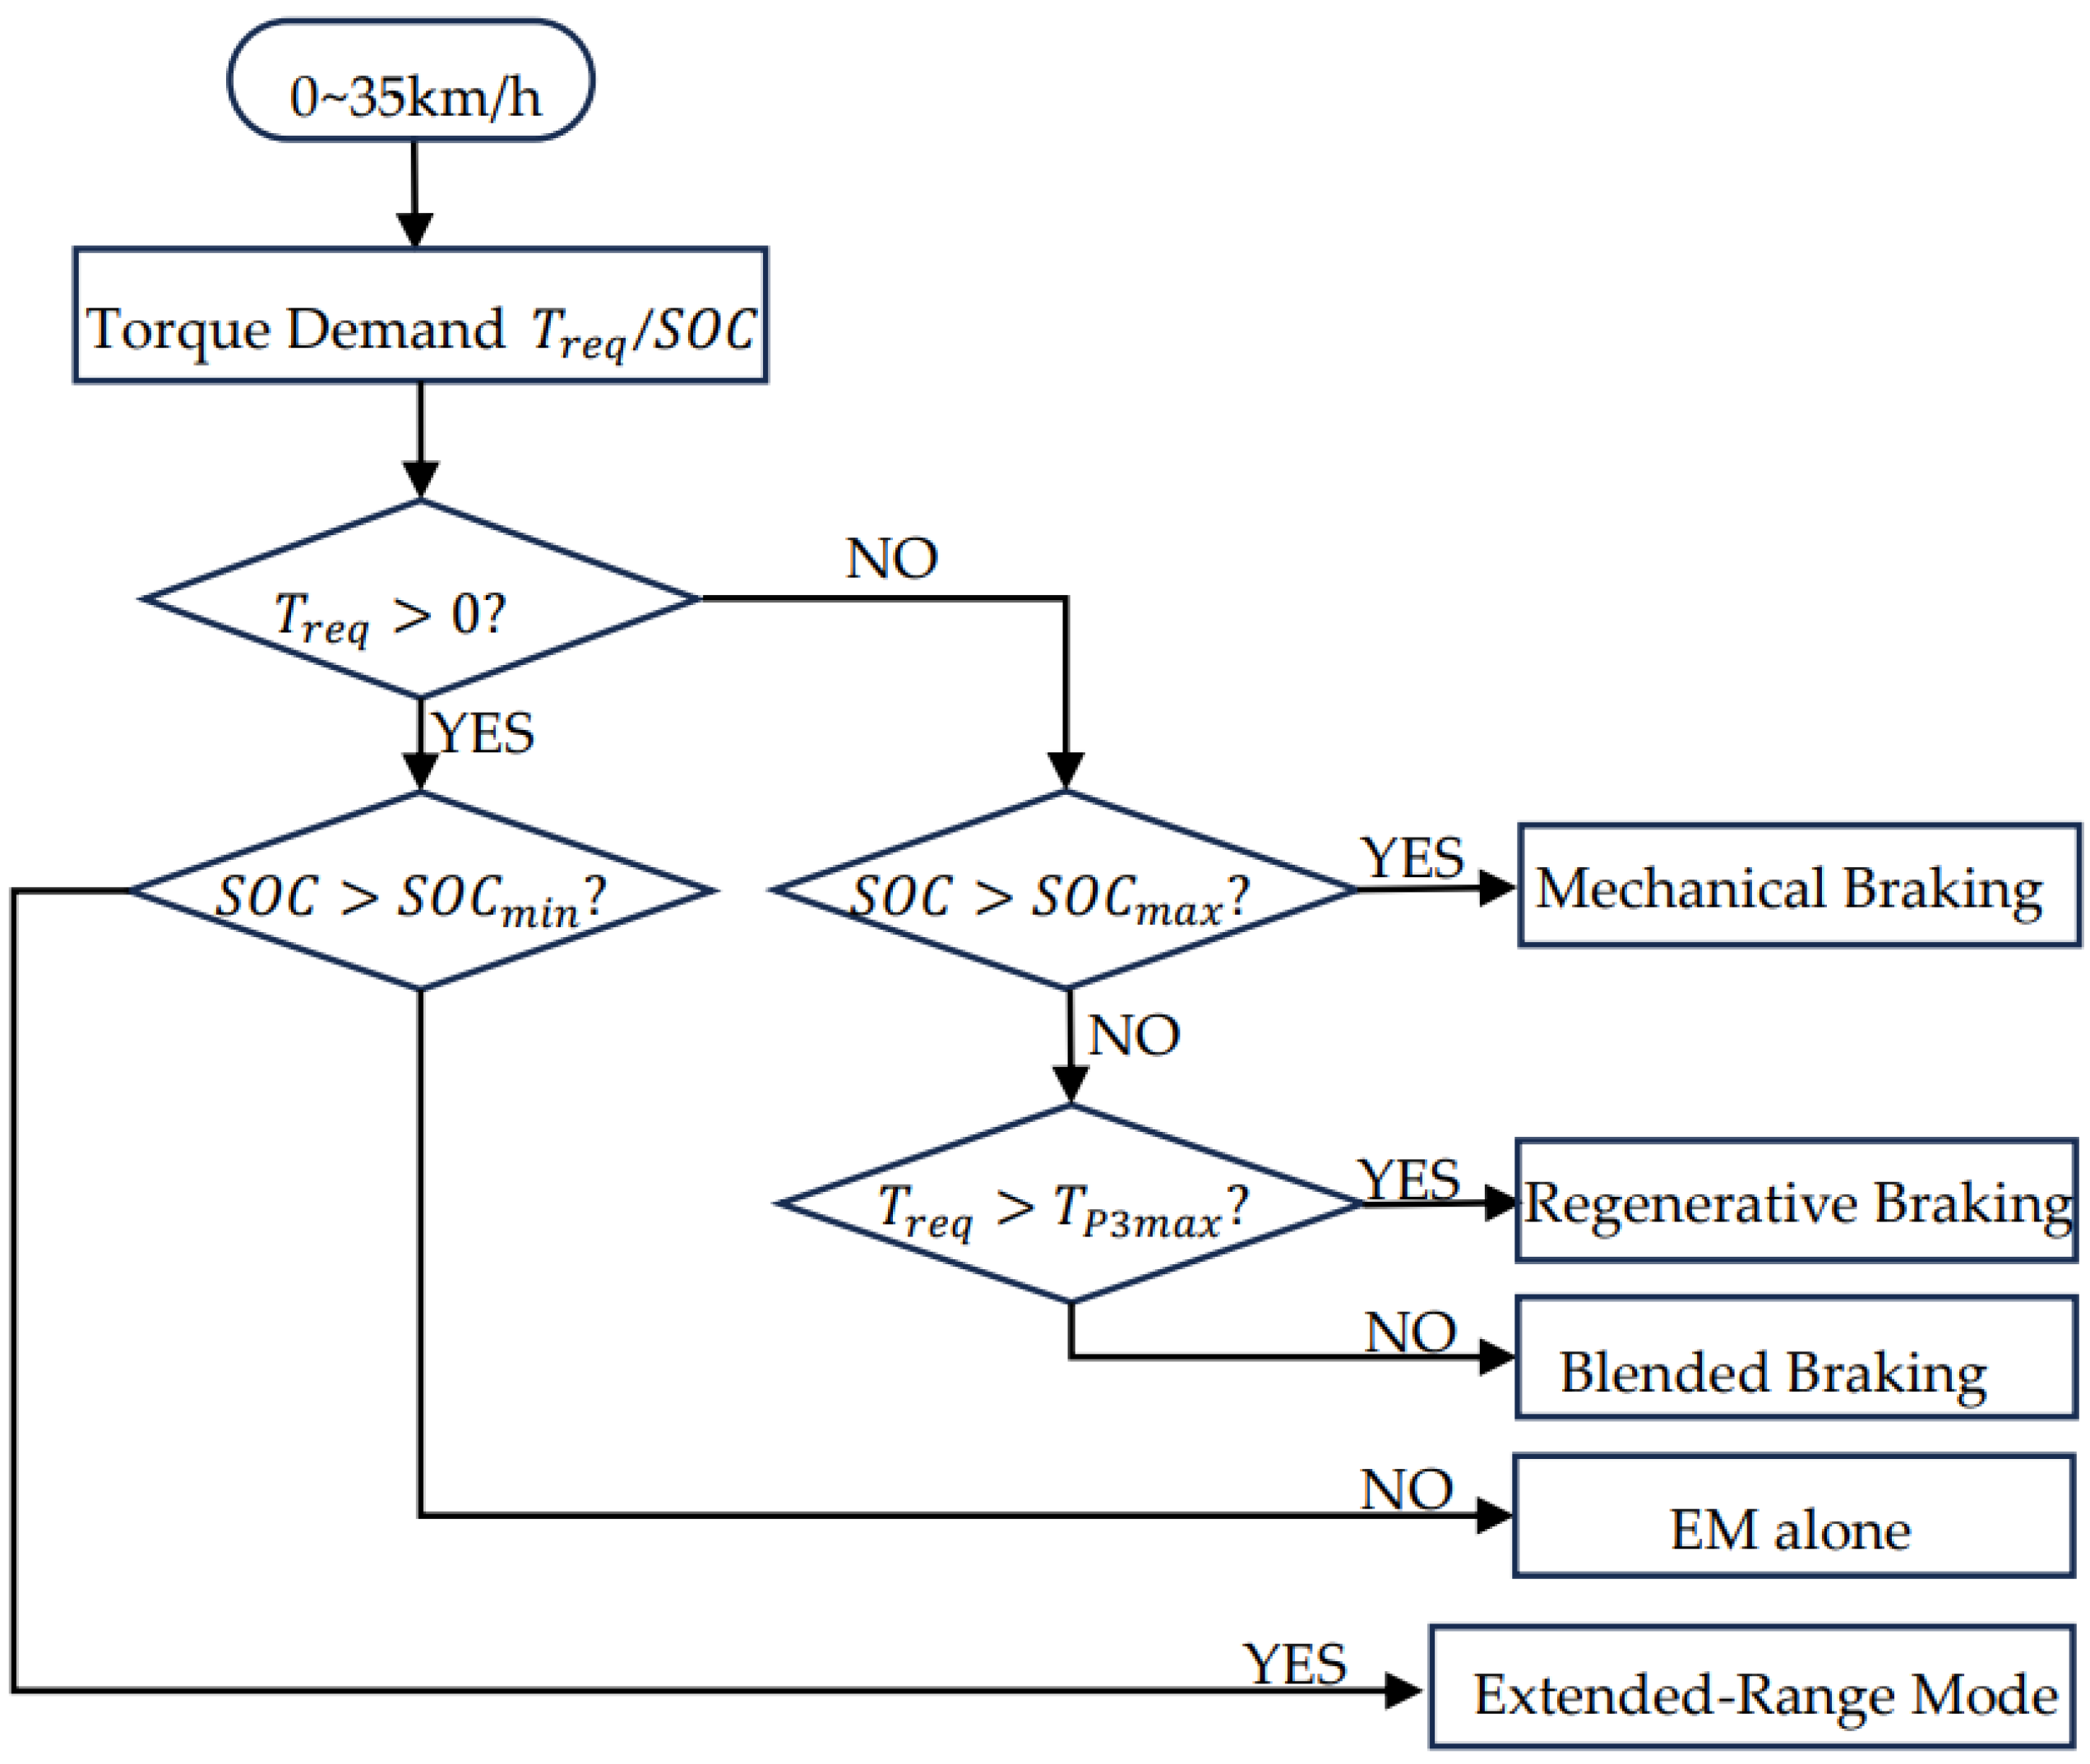
2.2.1. Low- to Mid-Speed Phase
- Determining whether the vehicle operates in driving mode or regenerative braking mode based on the overall vehicle torque demand.
- Deciding whether to enter EM alone or extended-range mode and whether to engage energy recovery based on SOC status.
- Based on the maximum regenerative braking capability of the P3 motor, determining whether to engage in blended braking.
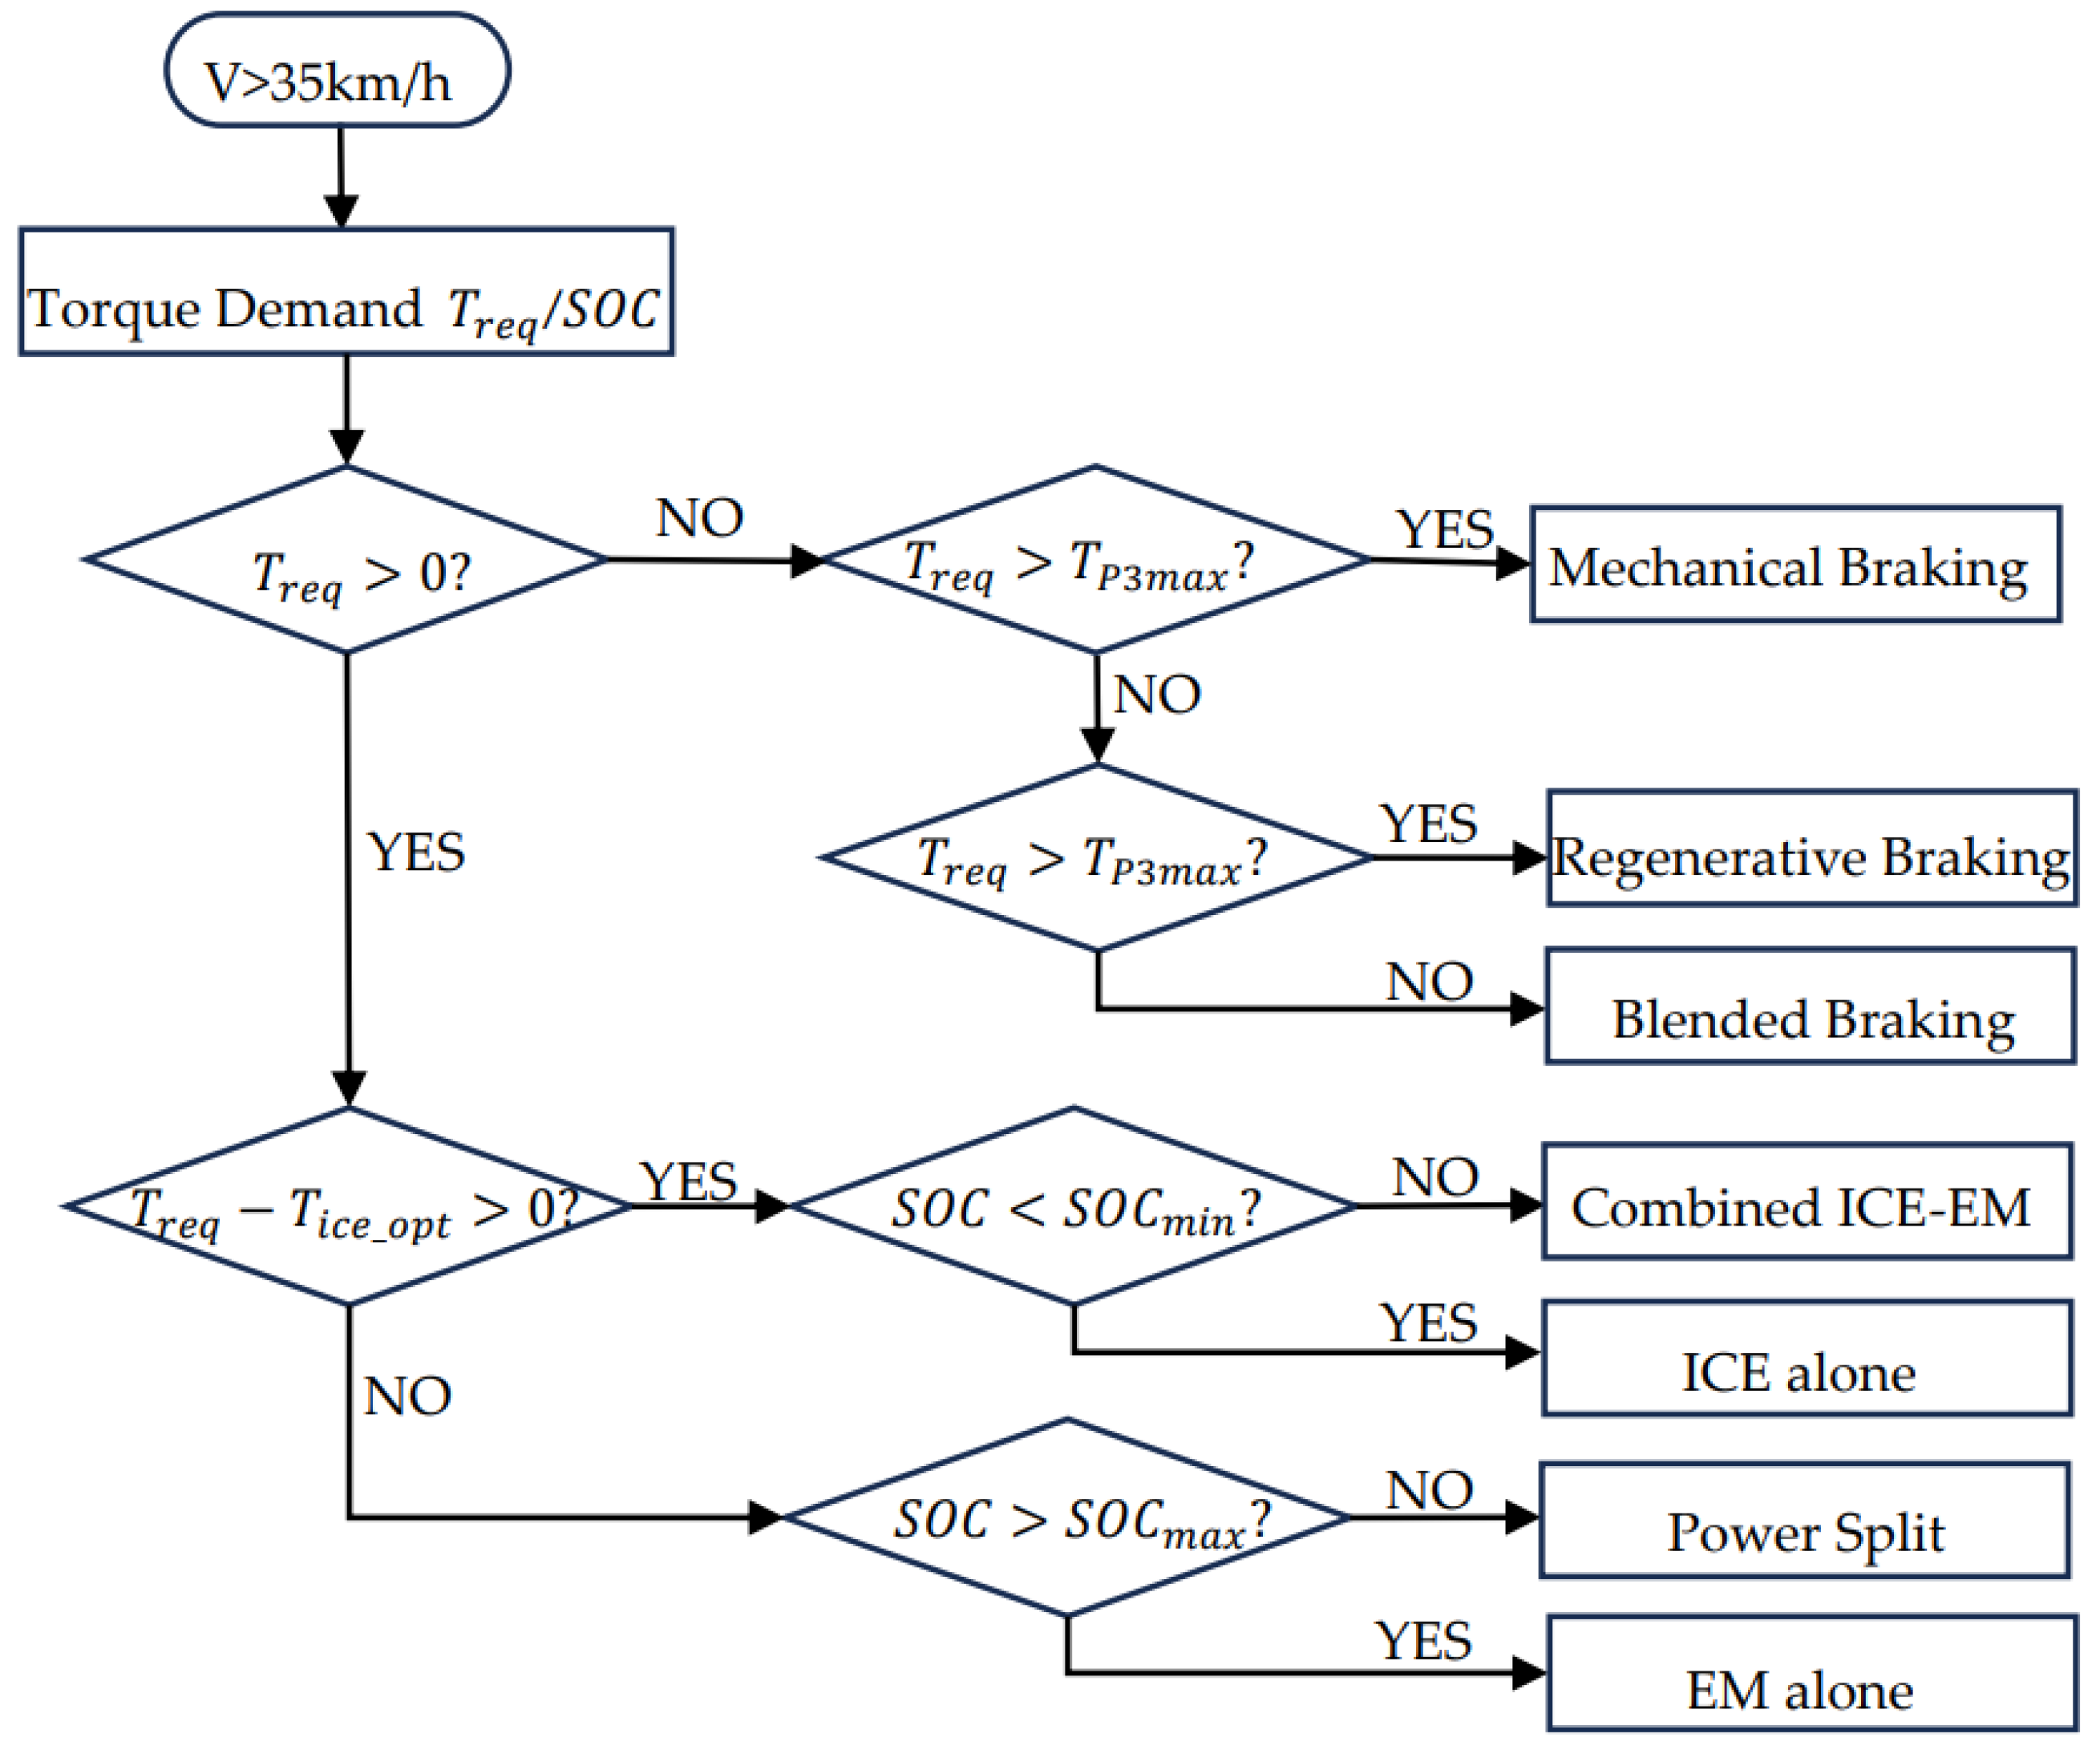
2.2.2. High-Speed Phase
3. Modeling
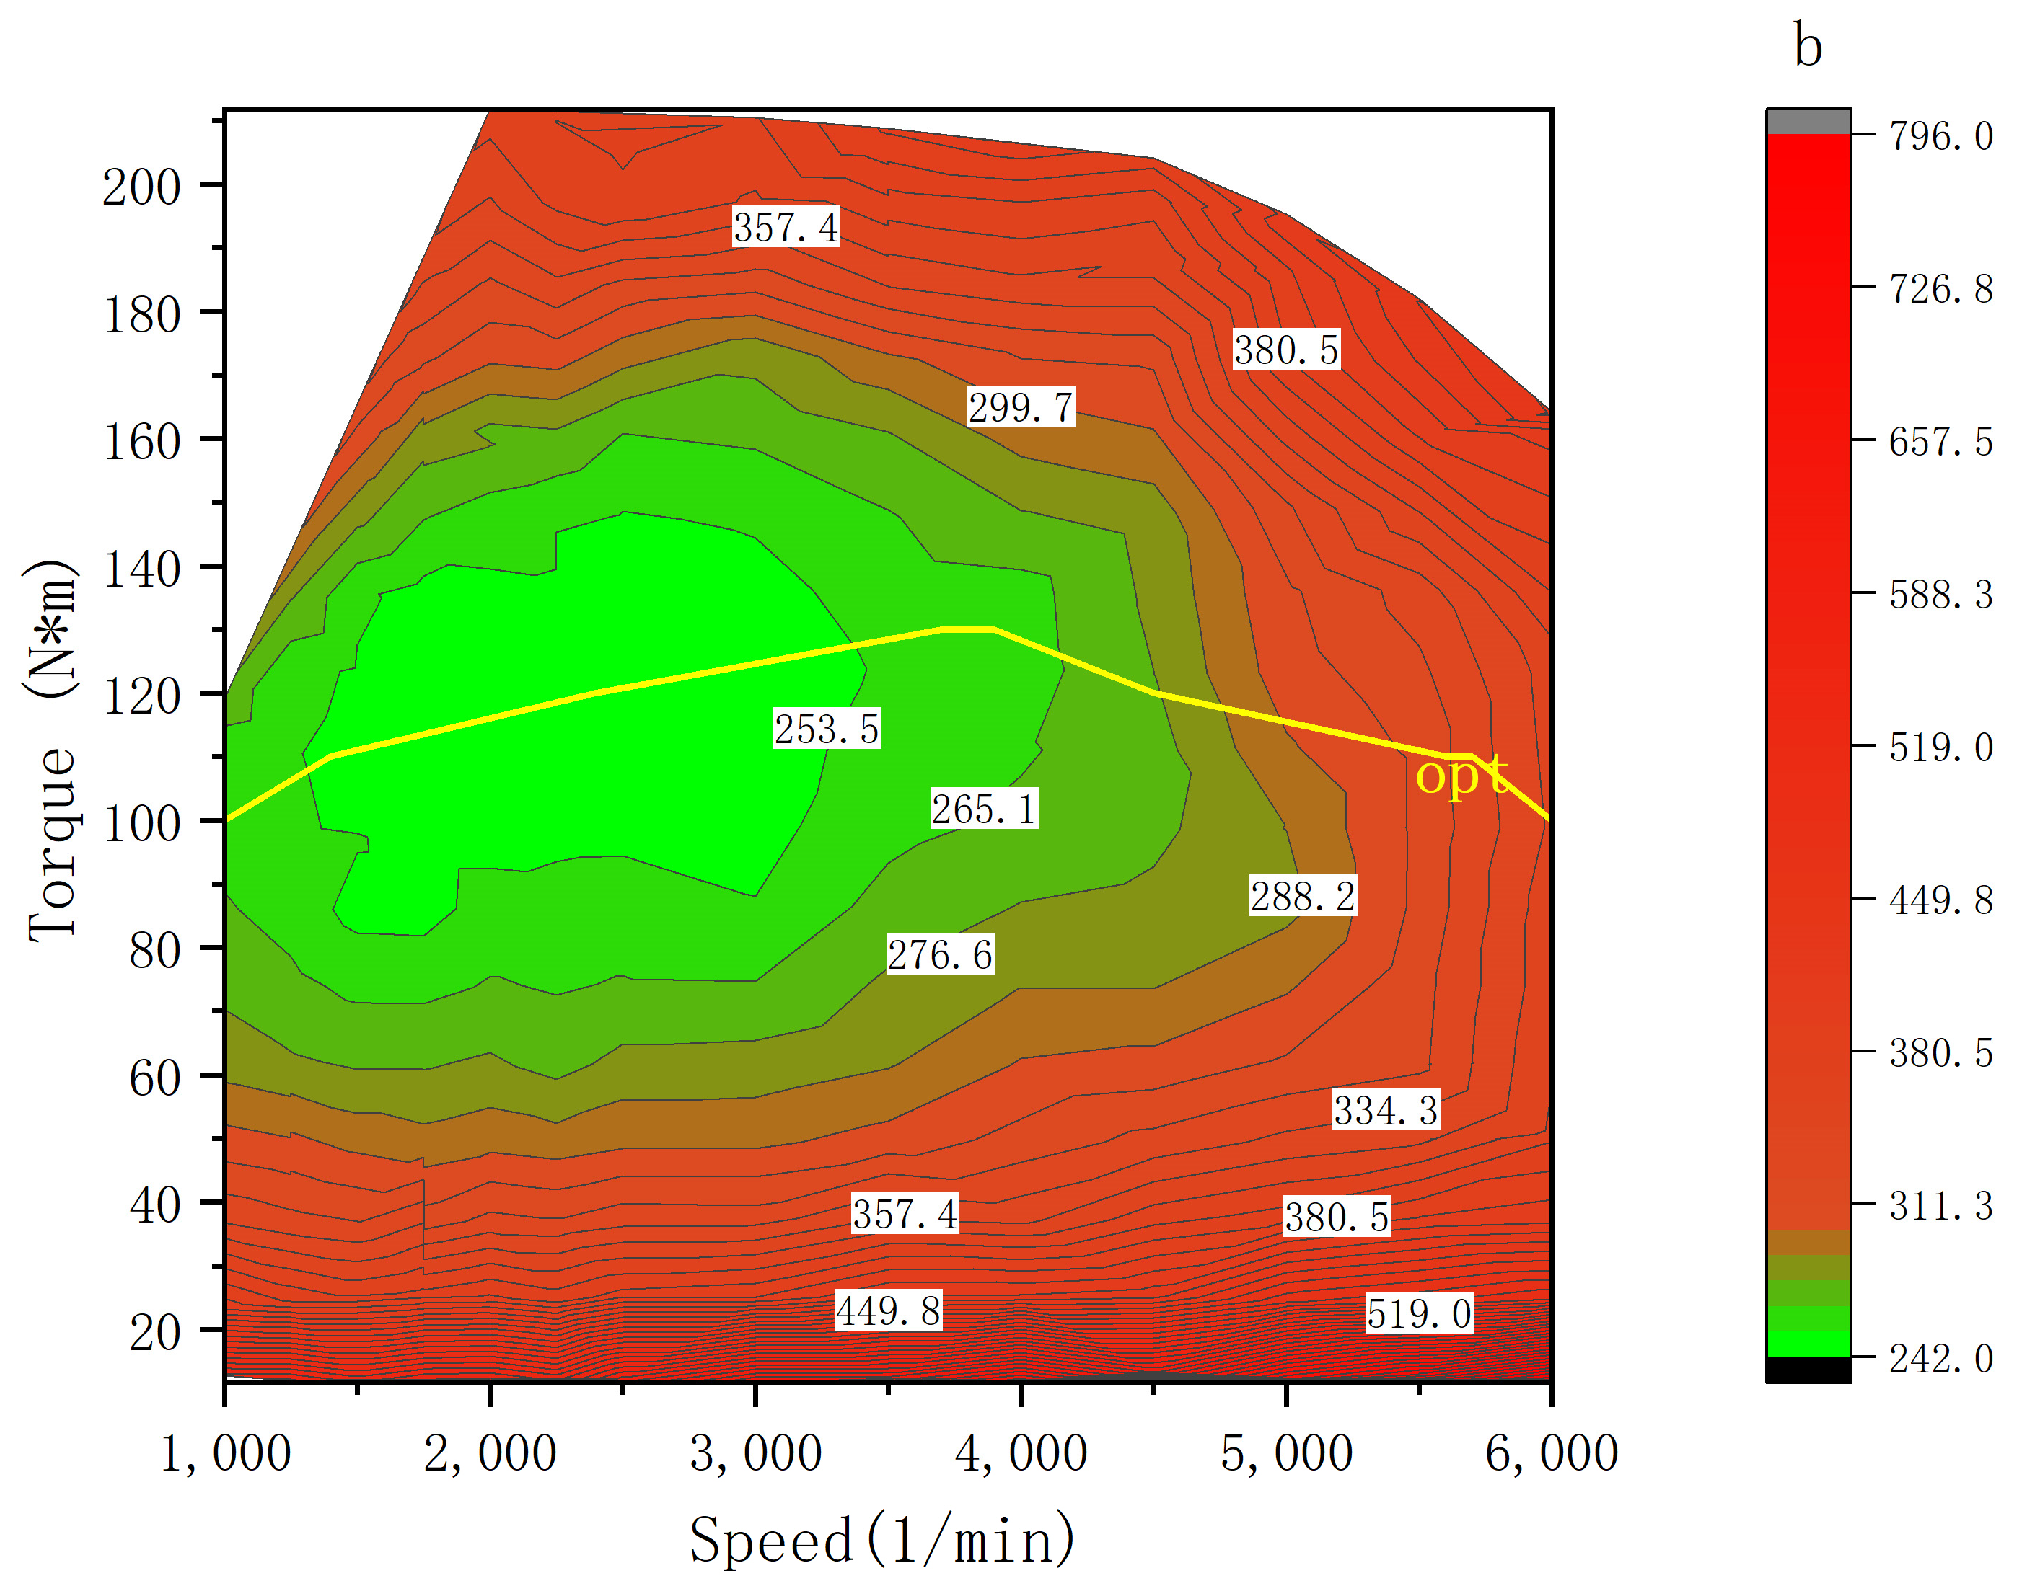
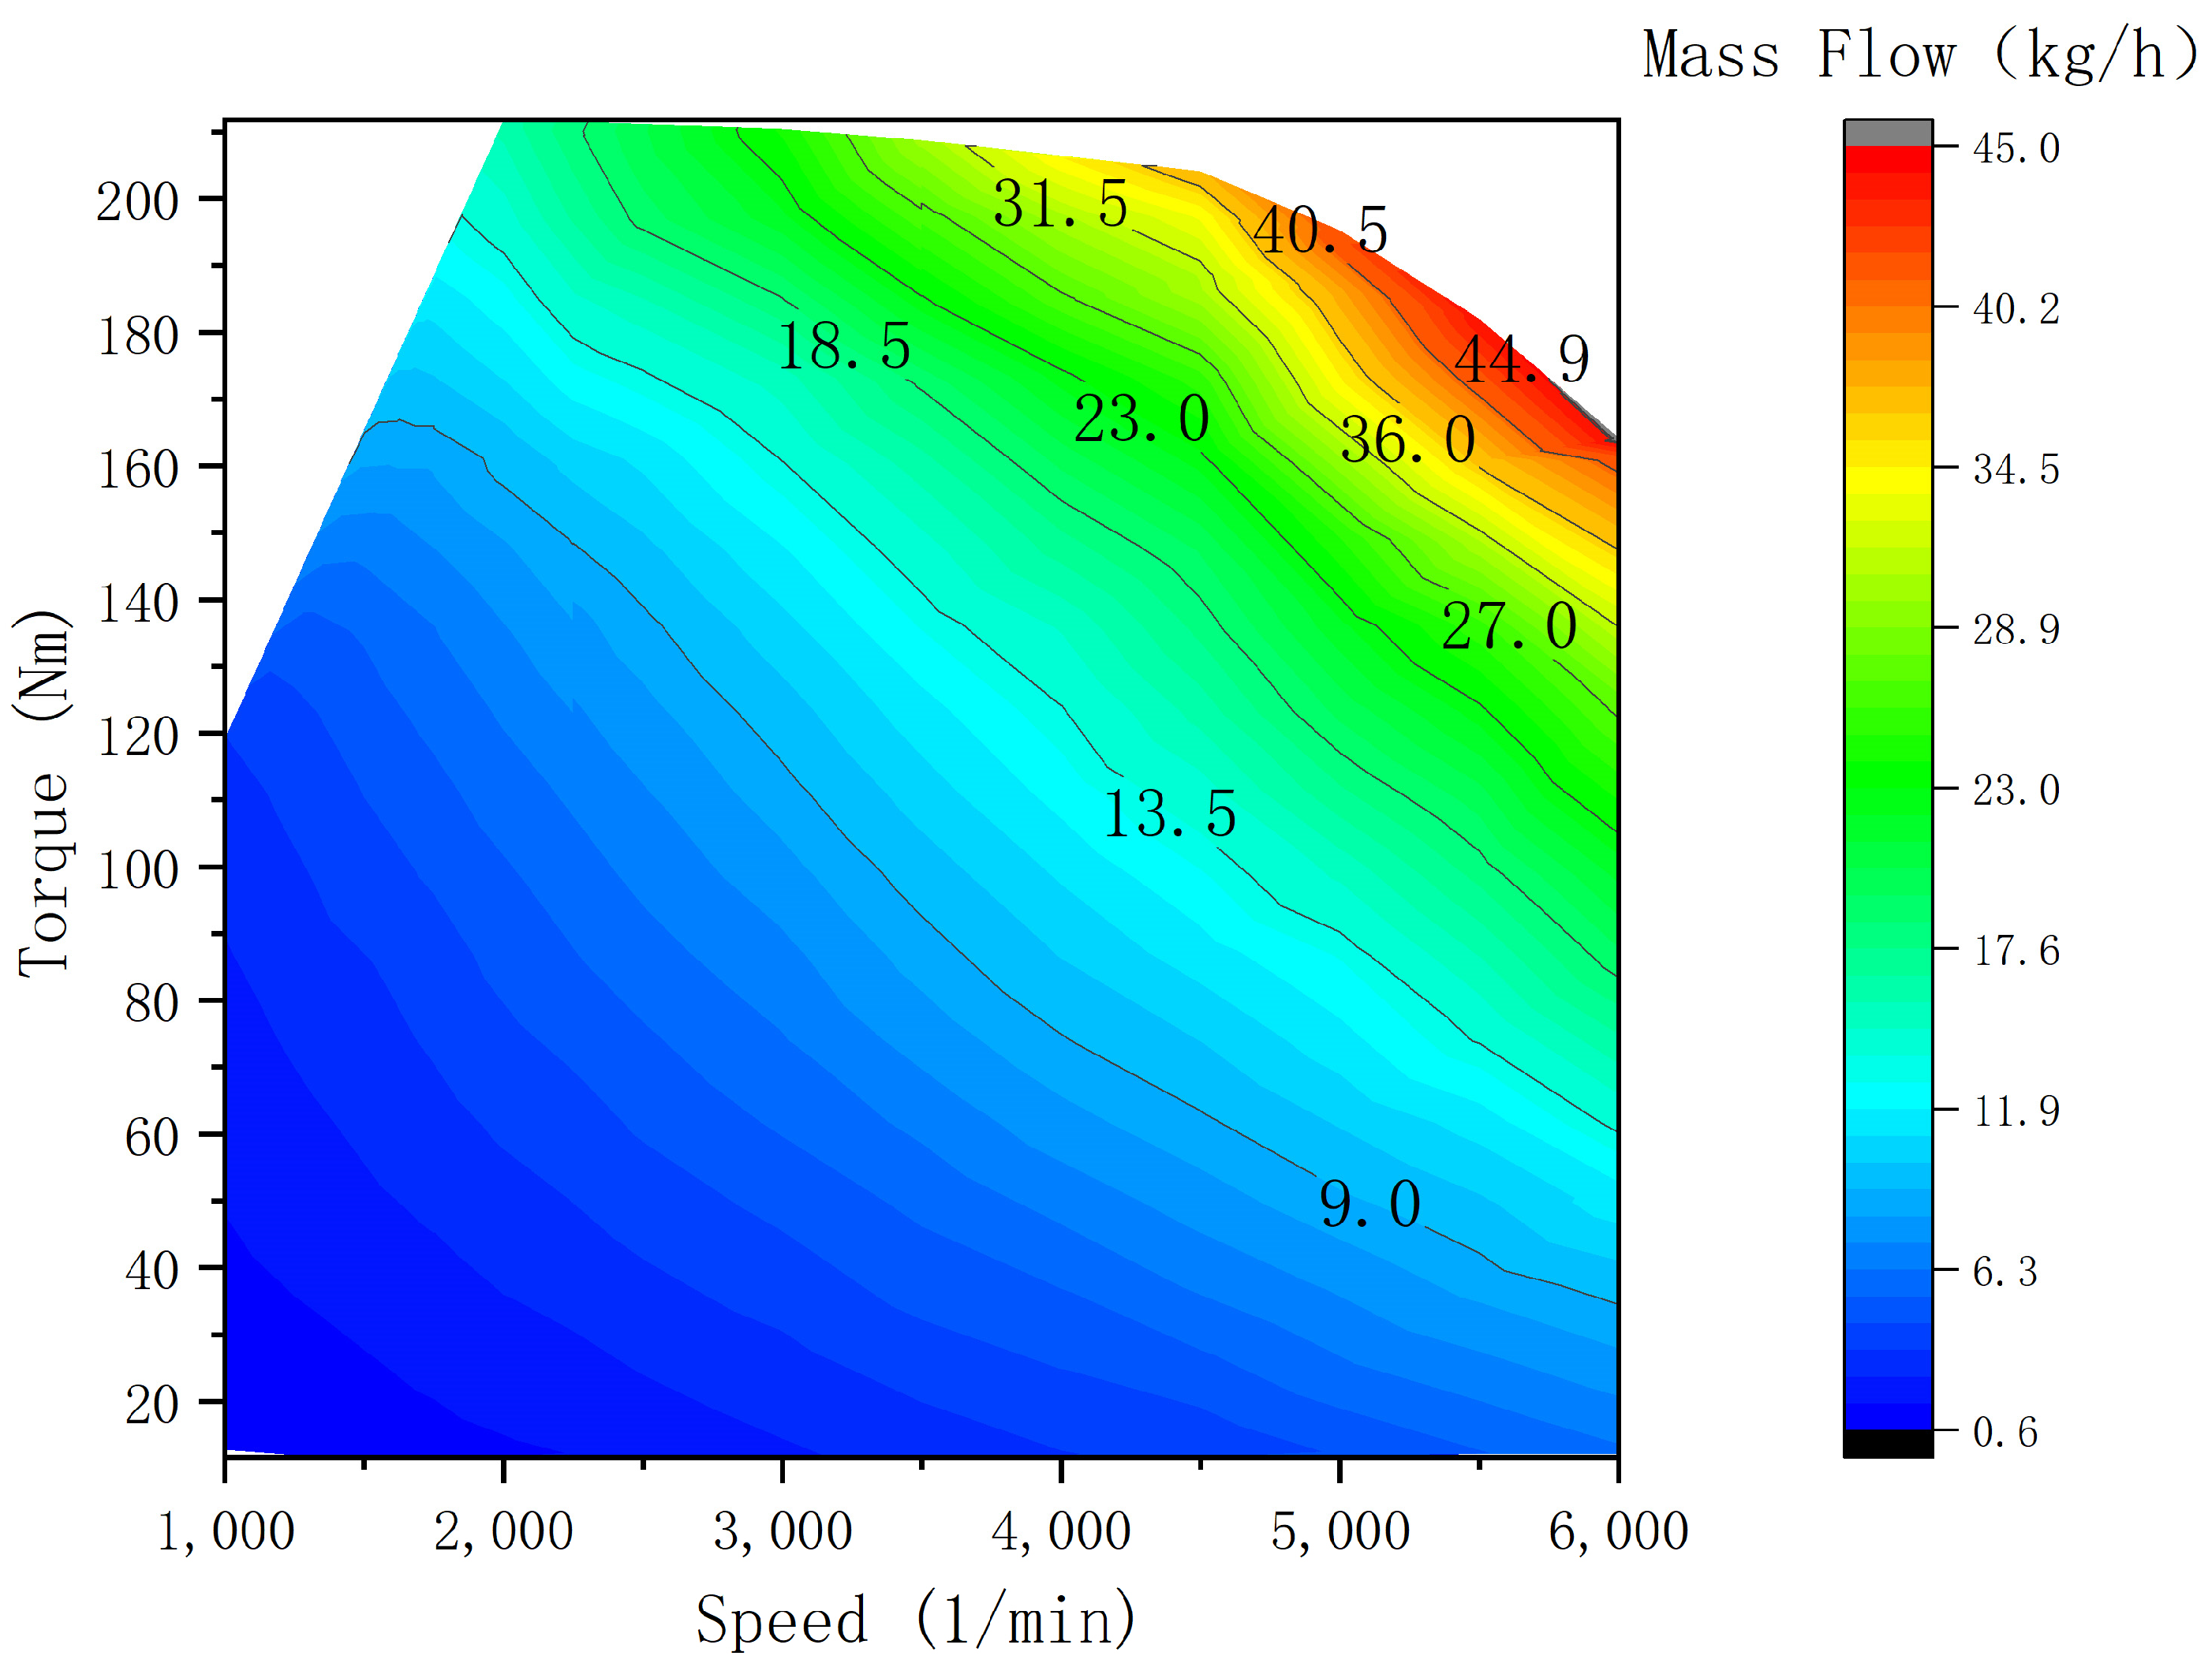
3.1. Engine Characteristic Model
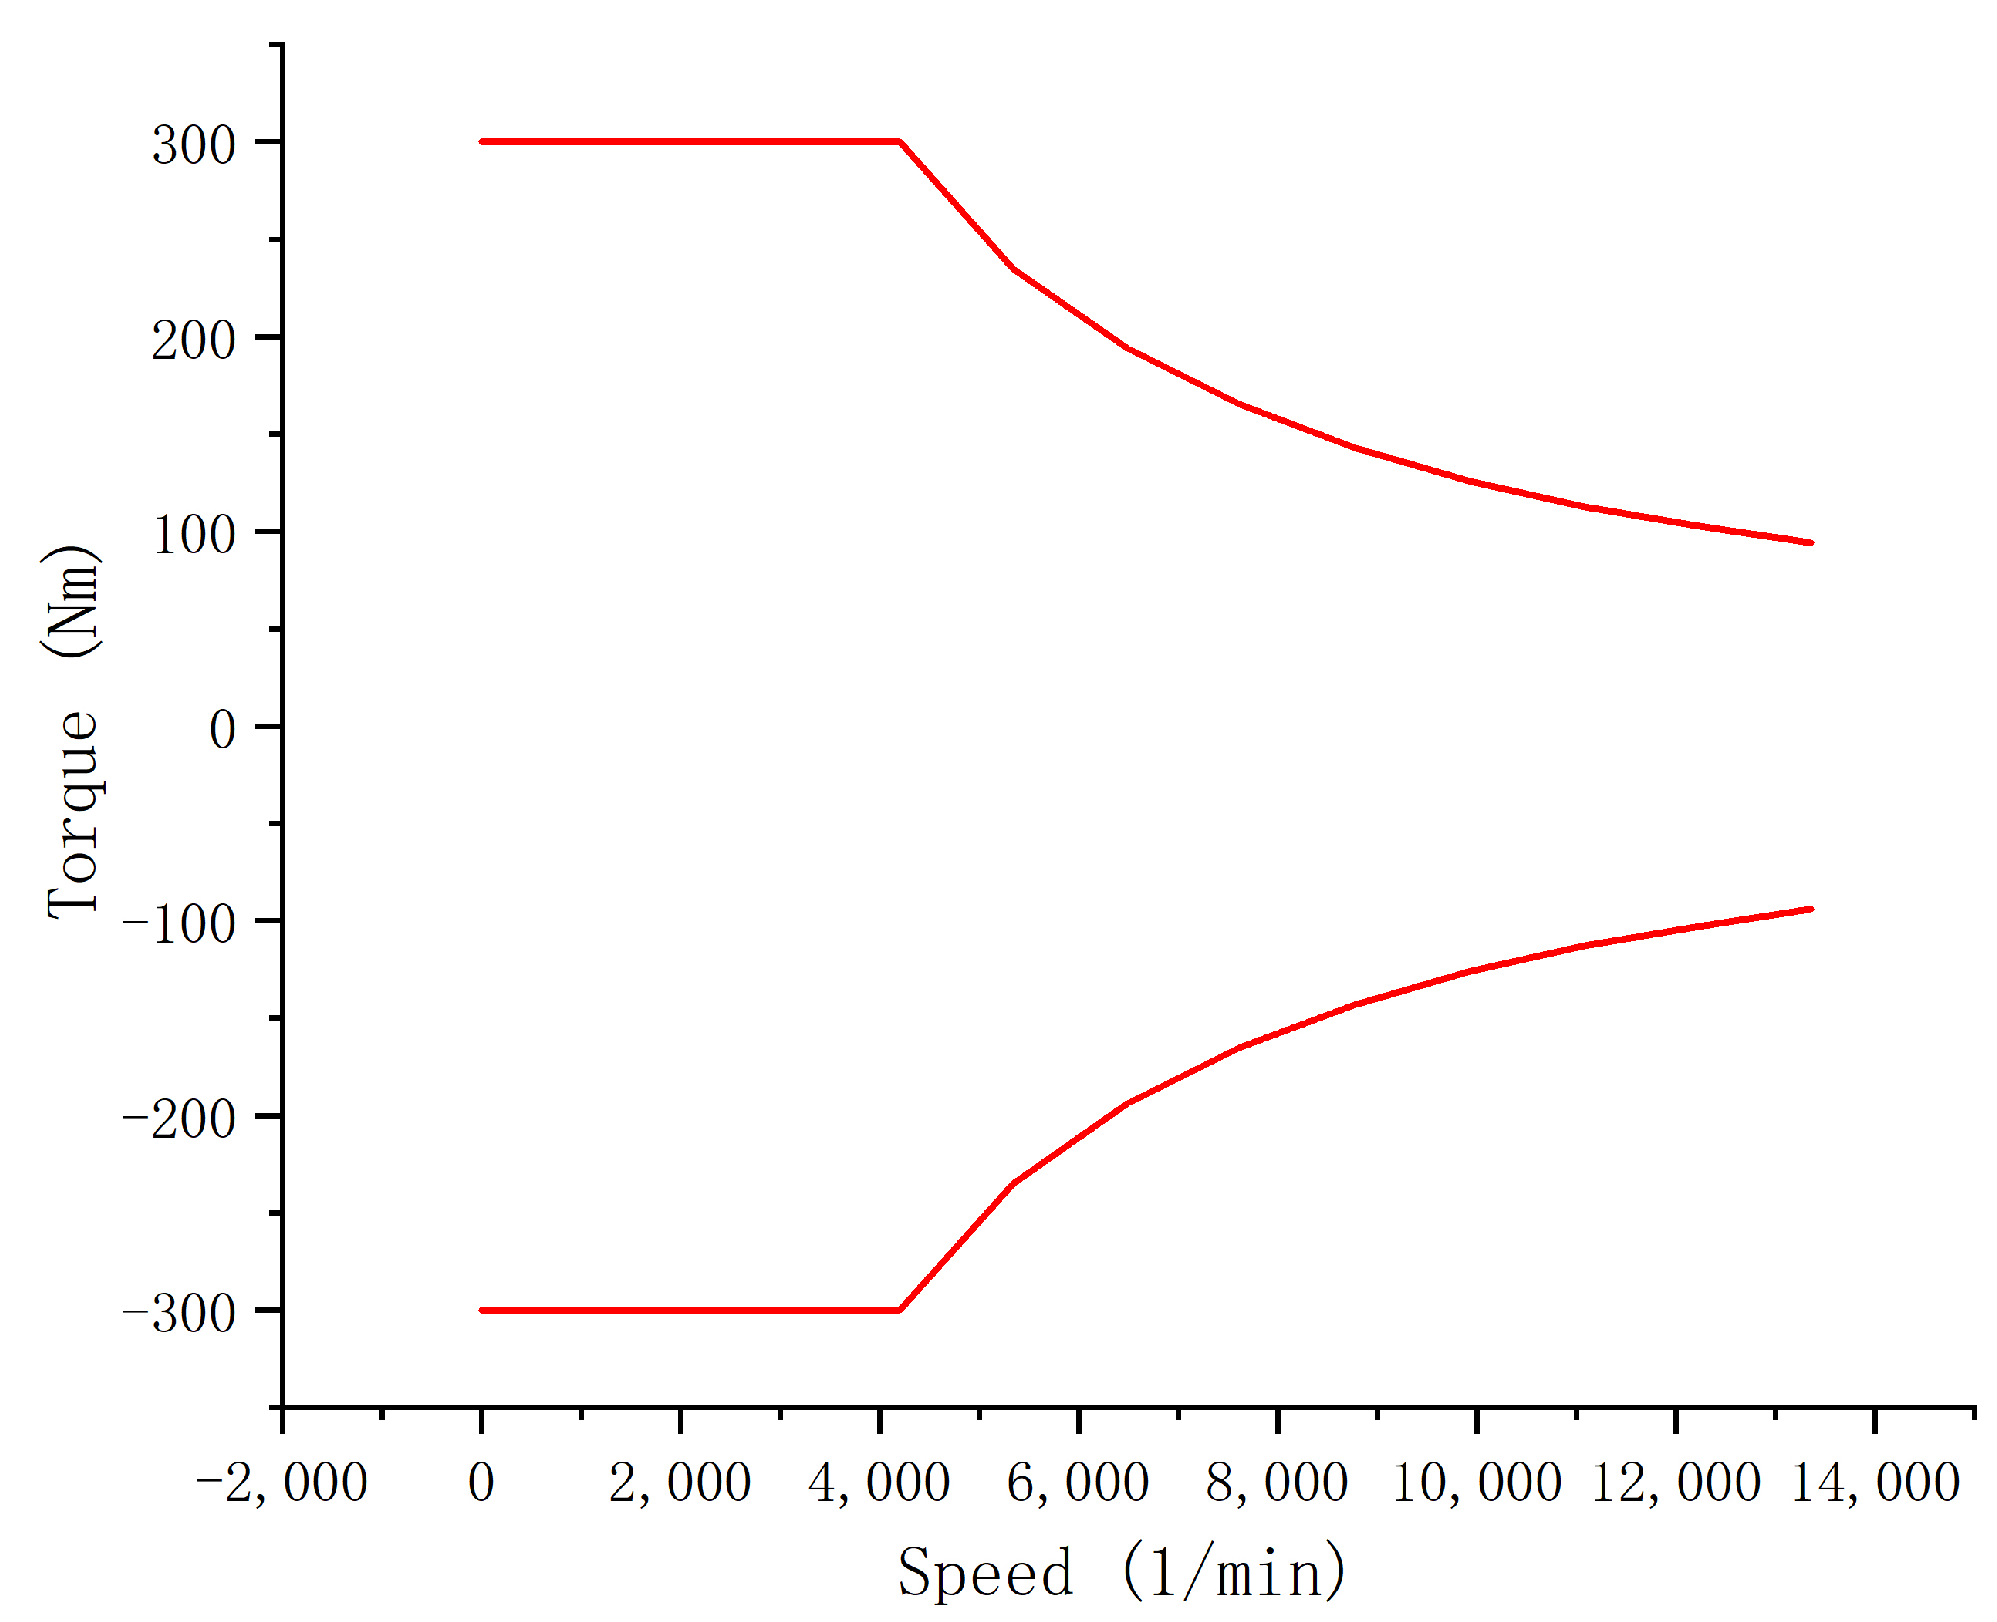
3.2. Drive Motor Characteristic Model
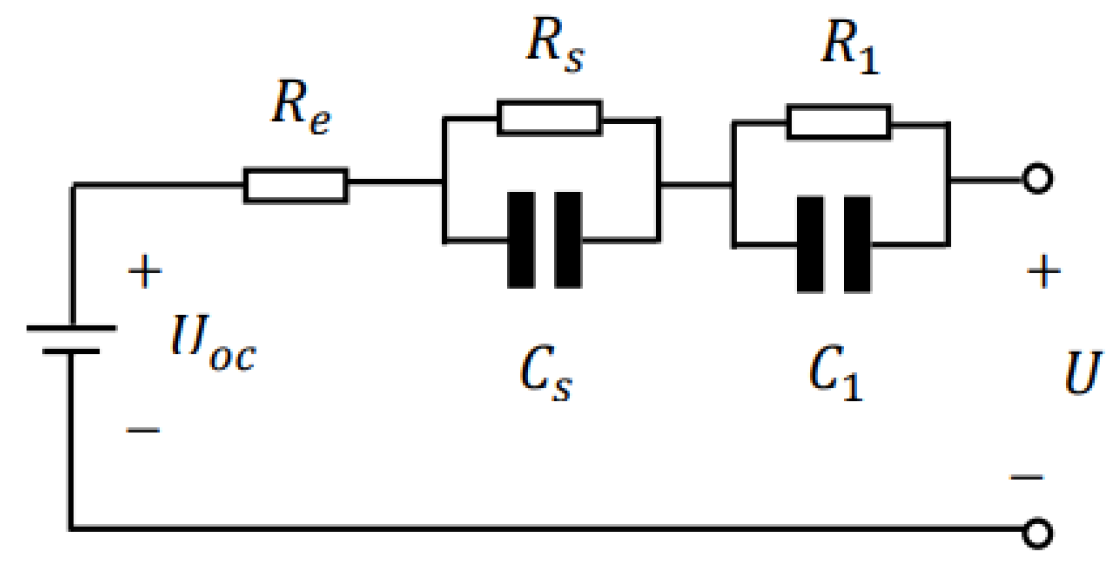
3.3. Power Battery Pack Model
3.4. Vehicle Dynamics Model
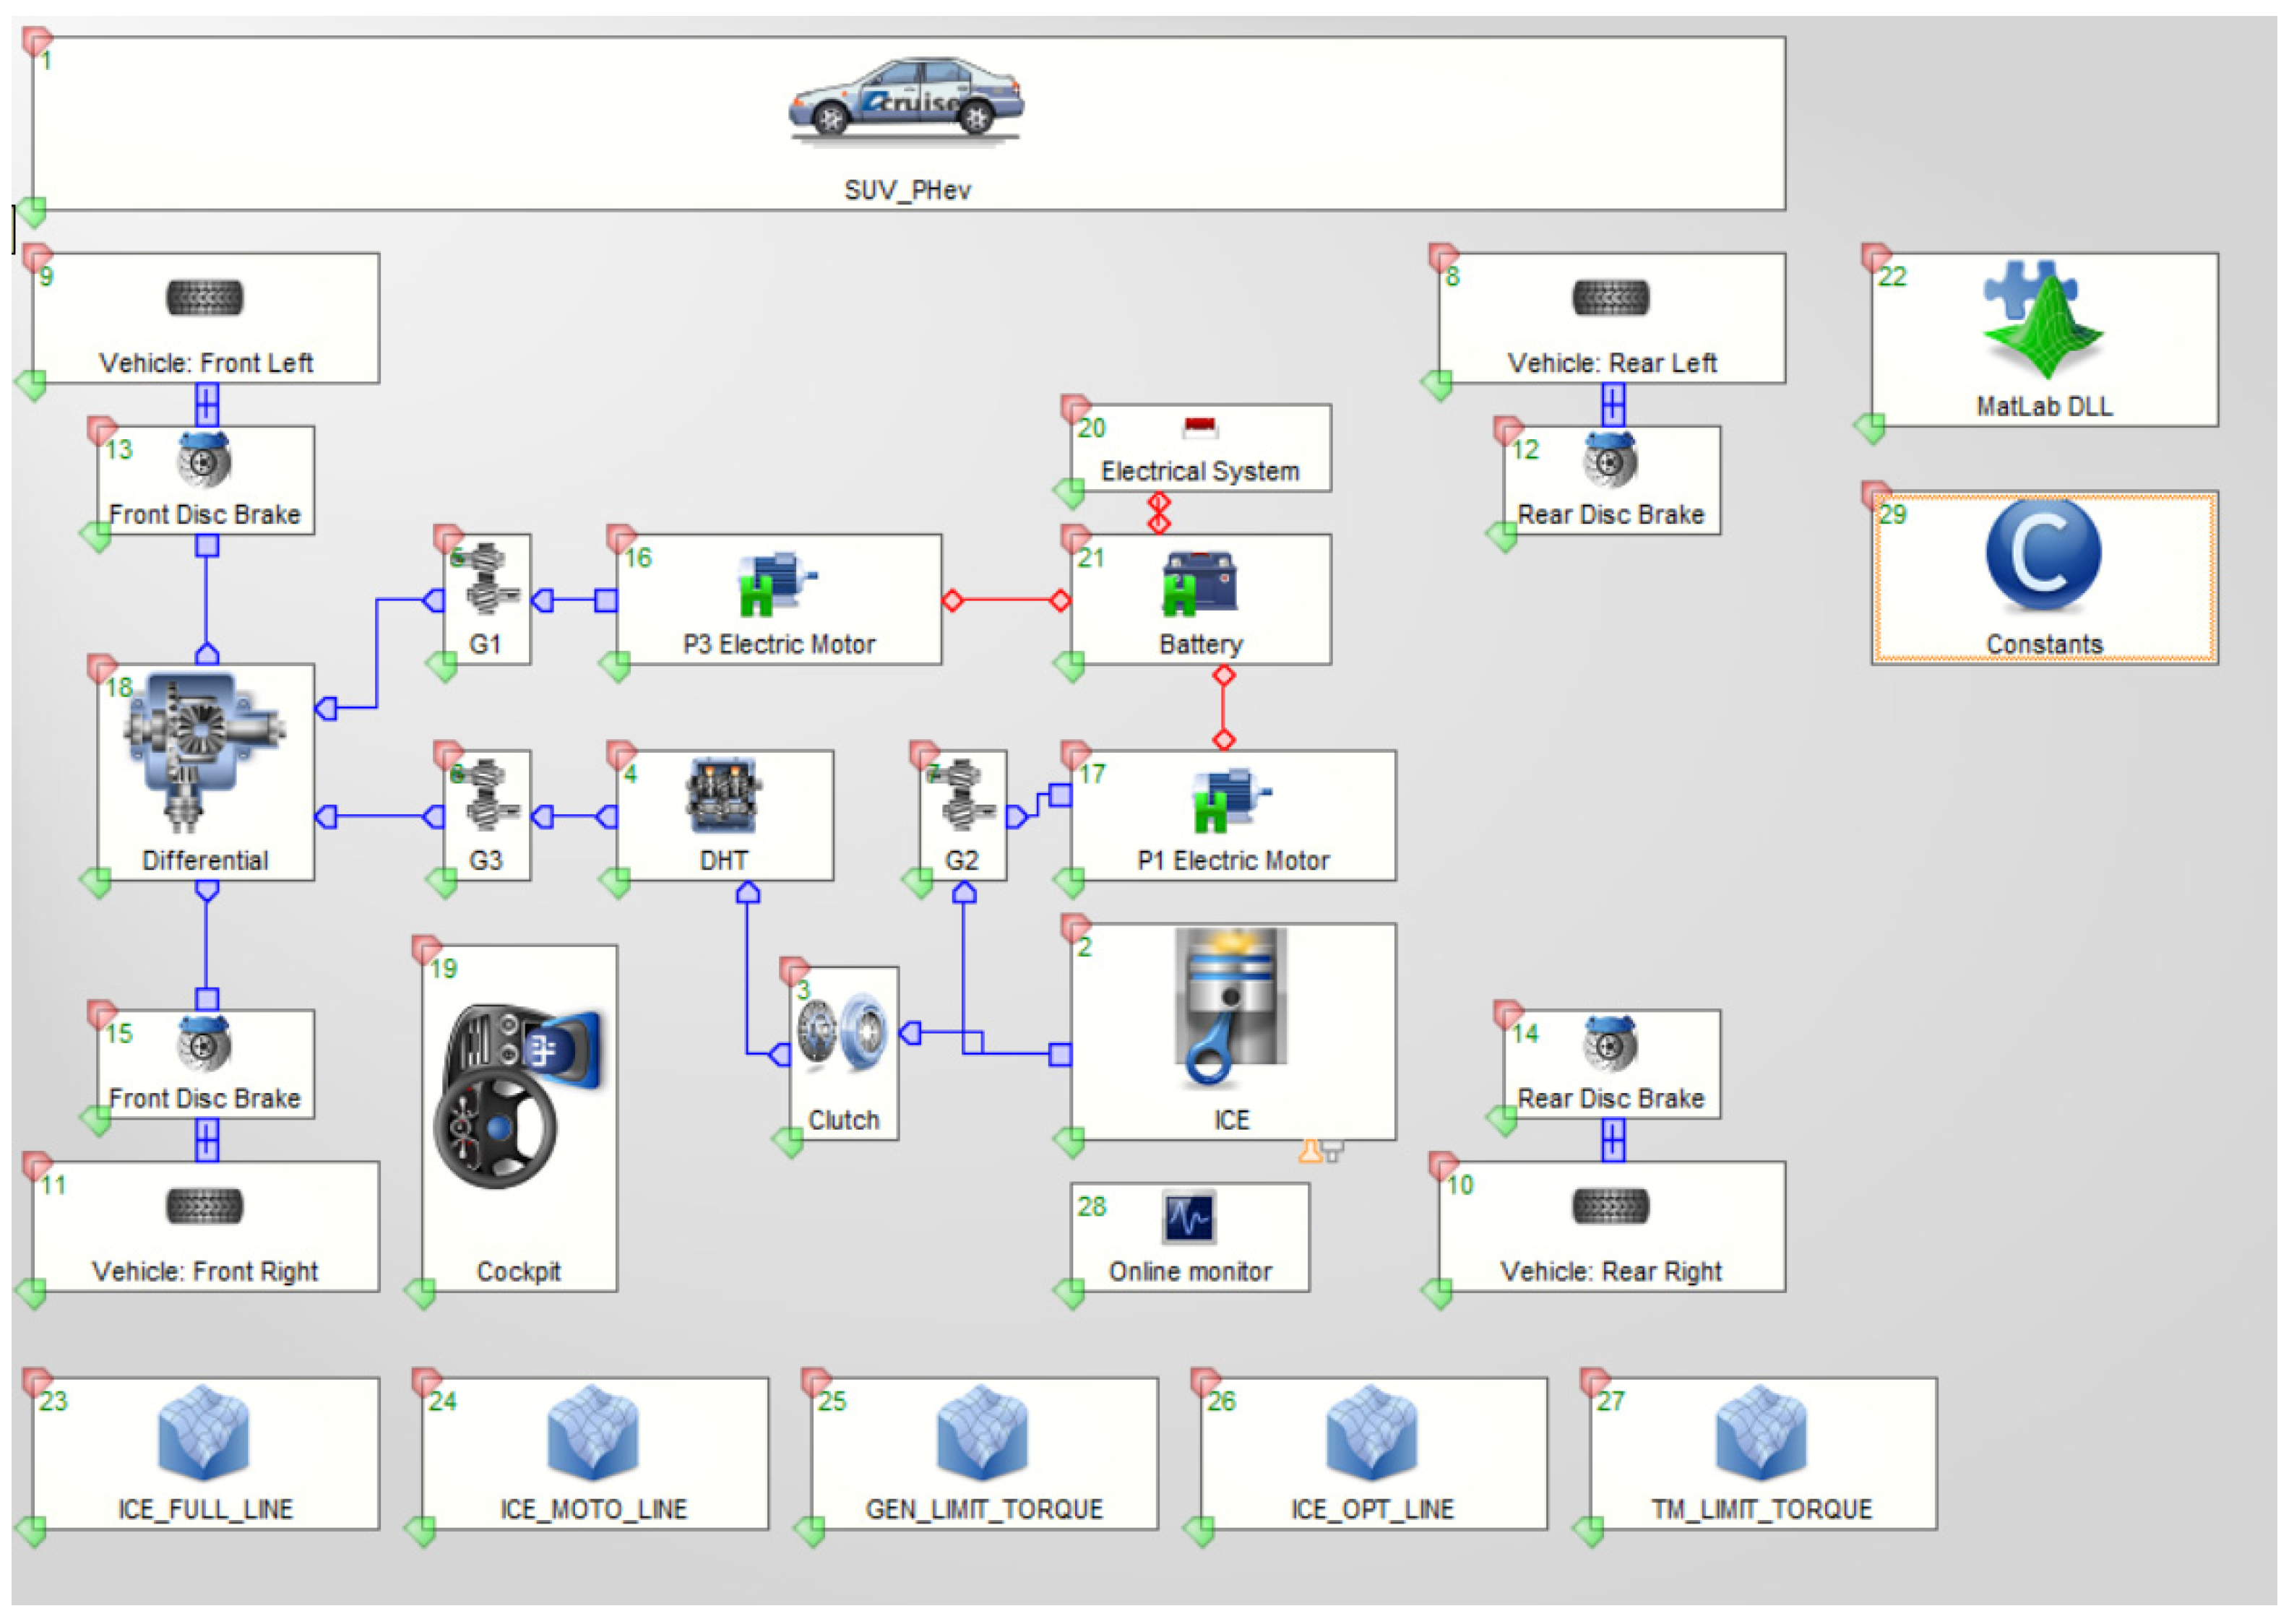
4. Results and Discussion
5. Conclusions
Author Contributions
Funding
Data Availability Statement
Conflicts of Interest
References
- Chen, L.; Gao, R. Analysis on the Current Status of China’s New Energy Vehicle Technology Development. Transp. Energy Conserv. Environ. Prot. 2021, 17, 14–19. [Google Scholar]
- Dižo, J.; Blatnický, M.; Semenov, S.; Mikhailov, E.; Kostrzewski, M.; Droździel, P.; Št’astniak, P. Electric and plug-in hybrid vehicles and their infrastructure in a particular European region. Transp. Res. Procedia 2021, 55, 629–636. [Google Scholar] [CrossRef]
- He, H.; Meng, X. A Review on Energy Management Technology of Hybrid Electric Vehicles. Trans. Beijing Inst. Technol. 2022, 42, 773–783. [Google Scholar]
- Sun, C.; Liu, B.; Sun, F. Review of energy-saving planning and control technology for new energy vehicles. J. Automot. Saf. Energy 2021, 17, 14–19. [Google Scholar]
- Huang, Y.; Surawski, N.C.; Organ, B.; Zhou, J.L.; Tang, O.H.H.; Chan, E.F.C. Fuel consumption and emissions performance under real driving: Comparison between hybrid and conventional vehicles. Sci. Total Environ. 2019, 659, 275–282. [Google Scholar] [CrossRef] [PubMed]
- Tran, D.-D.; Vafaeipour, M.; El Baghdadi, M.; Barrero, R.; Van Mierlo, J.; Hegazy, O. Thorough state-of-the-art analysis of electric and hybrid vehicle powertrains: Topologies and integrated energy management strategies. Renew. Sustain. Energy Rev. 2020, 119, 109596. [Google Scholar] [CrossRef]
- Panday, A.; Bansal, H.O. A review of optimal energy management strategies for hybrid electric vehicle. Int. J. Veh. Technol. 2014, 2014, 510. [Google Scholar] [CrossRef]
- Sabri, M.M.; Danapalasingam, K.; Rahmat, M. A review on hybrid electric vehicles architecture and energy management strategies. Renew. Sustain. Energy Rev. 2016, 53, 1433–1442. [Google Scholar] [CrossRef]
- Shabbir, W. Control Strategies for Series Hybrid Electric Vehicles. Ph.D. Thesis, Imperial College London, London, UK, 2015. [Google Scholar]
- Shabbir, W.; Evangelou, S.A. Exclusive operation strategy for the supervisory control of series hybrid electric vehicles. IEEE Trans. Control. Syst. Technol. 2016, 24, 2190–2198. [Google Scholar] [CrossRef]
- Hou, C.; Ouyang, M.; Xu, L.; Wang, H. Approximate Pontryagin’s minimum principle applied to the energy management of plug-in hybrid electric vehicles. Appl. Energy 2014, 115, 174–189. [Google Scholar] [CrossRef]
- Liu, T.; Hu, X.; Li, S.E.; Cao, D. Reinforcement learning optimized look-ahead energy management of a parallel hybrid electric vehicle. IEEE/ASME Trans. Mechatron. 2017, 22, 1497–1507. [Google Scholar] [CrossRef]
- Johannesson, L.; Asbogard, M.; Egardt, B. Assessing the potential of predictive control for hybrid vehicle powertrains using stochastic dynamic programming. IEEE Trans. Intell. Transp. Syst. 2007, 8, 71–83. [Google Scholar] [CrossRef]
- Ren, C.; Liu, H. Optimal energy management strategy of plug-in parallel hybrid electric vehicle based on dynamic programming algorithm. J. Hefei Univ. Technol. (Nat. Sci.) 2021, 44, 1157–1164. [Google Scholar]
- Pei, D.; Leamy, M.J. Dynamic programming-informed equivalent cost minimization control strategies for hybrid-electric vehicle. J. Dyn. Syst. Meas. Control. 2013, 135, 051013. [Google Scholar] [CrossRef]
- Zeng, X.; Wang, J. A parallel hybrid electric vehicle energy management strategy using stochastic model predictive control with road grade preview. IEEE Trans. Control. Syst. Technol. 2015, 23, 2416–2423. [Google Scholar] [CrossRef]
- Guercioni, G.R.; Galvagno, E.; Tota, A.; Vigliani, A. Adaptive equivalent consumption minimization strategy with rule-based gear selection for the energy management of hybrid electric vehicles equipped with dual clutch transmission. IEEE Access 2020, 8, 190017–190038. [Google Scholar] [CrossRef]
- Guan, J.C.; Chen, B.C. Adaptive power management strategy based on equivalent fuel consumption minimization strategy for a mild hybrid electric vehicle. In Proceedings of the IEEE Vehicle Power and Propulsion Conference (VPPC), Hanoi, Vietnam, 14–17 October 2019; IEEE: New York, NY, USA, 2019; pp. 1–4. [Google Scholar]
- Yu, K.; Yang, H.; Tan, X.; Kawabe, T.; Guo, Y.; Liang, Q.; Fu, Z.; Zheng, Z. Model predictive control for hybrid electric vehicle platooning using slope information. IEEE Trans. Intell. Transp. Syst. 2016, 17, 1894–1909. [Google Scholar] [CrossRef]
- Vidal-Naquet, F.; Zito, G. Adapted optimal energy management strategy for drivability. In IEEE Vehicle Power and Propulsion Conference; IEEE: New York, NY, USA, 2012; pp. 358–363. [Google Scholar]
- Hannan, M.A.; Azidin, F.A.; Mohamed, A. Multi-sources model and control algorithm of an energy management system for light electric vehicles. Energy Convers. Manag. 2012, 62, 123–130. [Google Scholar] [CrossRef]
- Kim, M.; Jung, D.; Min, K. Hybrid thermostat strategy for enhancing fuel economy of series hybrid intracity bus. IEEE Trans. Veh. Technol. 2014, 63, 3569–3579. [Google Scholar] [CrossRef]
- Panday, A.; Bansal, H.O.; Srinivasan, P. Thermoelectric modeling and online SOC estimation of Li-ion battery for plug-in hybrid electric vehicles. Model. Simul. Eng. 2016, 2016, 2353521. [Google Scholar] [CrossRef]
- Panday, A.; Bansal, H.O. Hybrid electric vehicle performance analysis under various temperature conditions. Energy Procedia 2015, 75, 1962–1967. [Google Scholar] [CrossRef][Green Version]
- Wang, E.; Ouyang, M.; Zhang, F.; Zhao, C. Performance evaluation and control strategy comparison of supercapacitors for a hybrid electric vehicle. In Science, Technology and Advanced Application of Supercapacitors; IntechOpen: London, UK, 2019. [Google Scholar]
- Li, Q.; Yang, H.; Han, Y.; Li, M.; Chen, W. A state machine strategy based on droop control for an energy management system of PEMFC-battery-supercapacitor hybrid tramway. Int. J. Hydrog. Energy 2016, 41, 16148–16159. [Google Scholar] [CrossRef]
- Song, K.; Li, F.; Hu, X.; He, L.; Niu, W.; Lu, S.; Zhang, T. Multi-mode energy management strategy for fuel cell electric vehicles based on driving pattern identification using learning vector quantization neural network algorithm. J. Power Sources 2018, 389, 230–239. [Google Scholar] [CrossRef]
- Singh, K.V.; Bansal, H.O.; Singh, D. Feed-forward modeling and real-time implementation of an intelligent fuzzy logic-based energy management strategy in a series–parallel hybrid electric vehicle to improve fuel economy. Electr. Eng. 2020, 102, 967–987. [Google Scholar] [CrossRef]
- Panday, A.; Bansal, H.O. Energy management strategy implementation for hybrid electric vehicles using genetic algorithm tuned Pontryagin’s minimum principle controller. Int. J. Veh. Technol. 2016, 2016, 4234261. [Google Scholar] [CrossRef]
- Chen, J.; Xu, C.; Wu, C.; Xu, W. Adaptive fuzzy logic control of fuel-cell-battery hybrid systems for electric vehicles. IEEE Trans. Ind. Inform. 2016, 14, 292–300. [Google Scholar] [CrossRef]
- Singh, K.V.; Bansal, H.O.; Singh, D. Hardware-in-the-loop implementation of ANFIS based adaptive SoC estimation of lithium-ion battery for hybrid vehicle applications. J. Energy Storage 2020, 27, 101124. [Google Scholar] [CrossRef]
- Singh, K.V.; Bansal, H.O.; Singh, D. Development of an adaptive neuro-fuzzy inference system–based equivalent consumption minimisation strategy to improve fuel economy in hybrid electric vehicles. IET Electr. Syst. Transp. 2021, 11, 171–185. [Google Scholar] [CrossRef]
- Hajimiri, M.H.; Salmasi, F.R. A fuzzy energy management strategy for series hybrid electric vehicle with predictive control and durability extension of the battery. In IEEE Conference on Electric and Hybrid Vehicles; IEEE: New York, NY, USA, 2006; pp. 1–5. [Google Scholar]
- Guo, L. Real-time Optimal Automotive Control for Intelligent Energy Conservation and Road Test. Ph.D. Thesis, Jilin University, Changchun, China, 2019. [Google Scholar]
- Wang, B. Research on the Construction of Hybrid Electric Vehicle Driving Condition and the Optimization of Energy Management Strategy. Master’s Thesis, Hebei University of Technology, Tianjin, China, 2022. [Google Scholar]





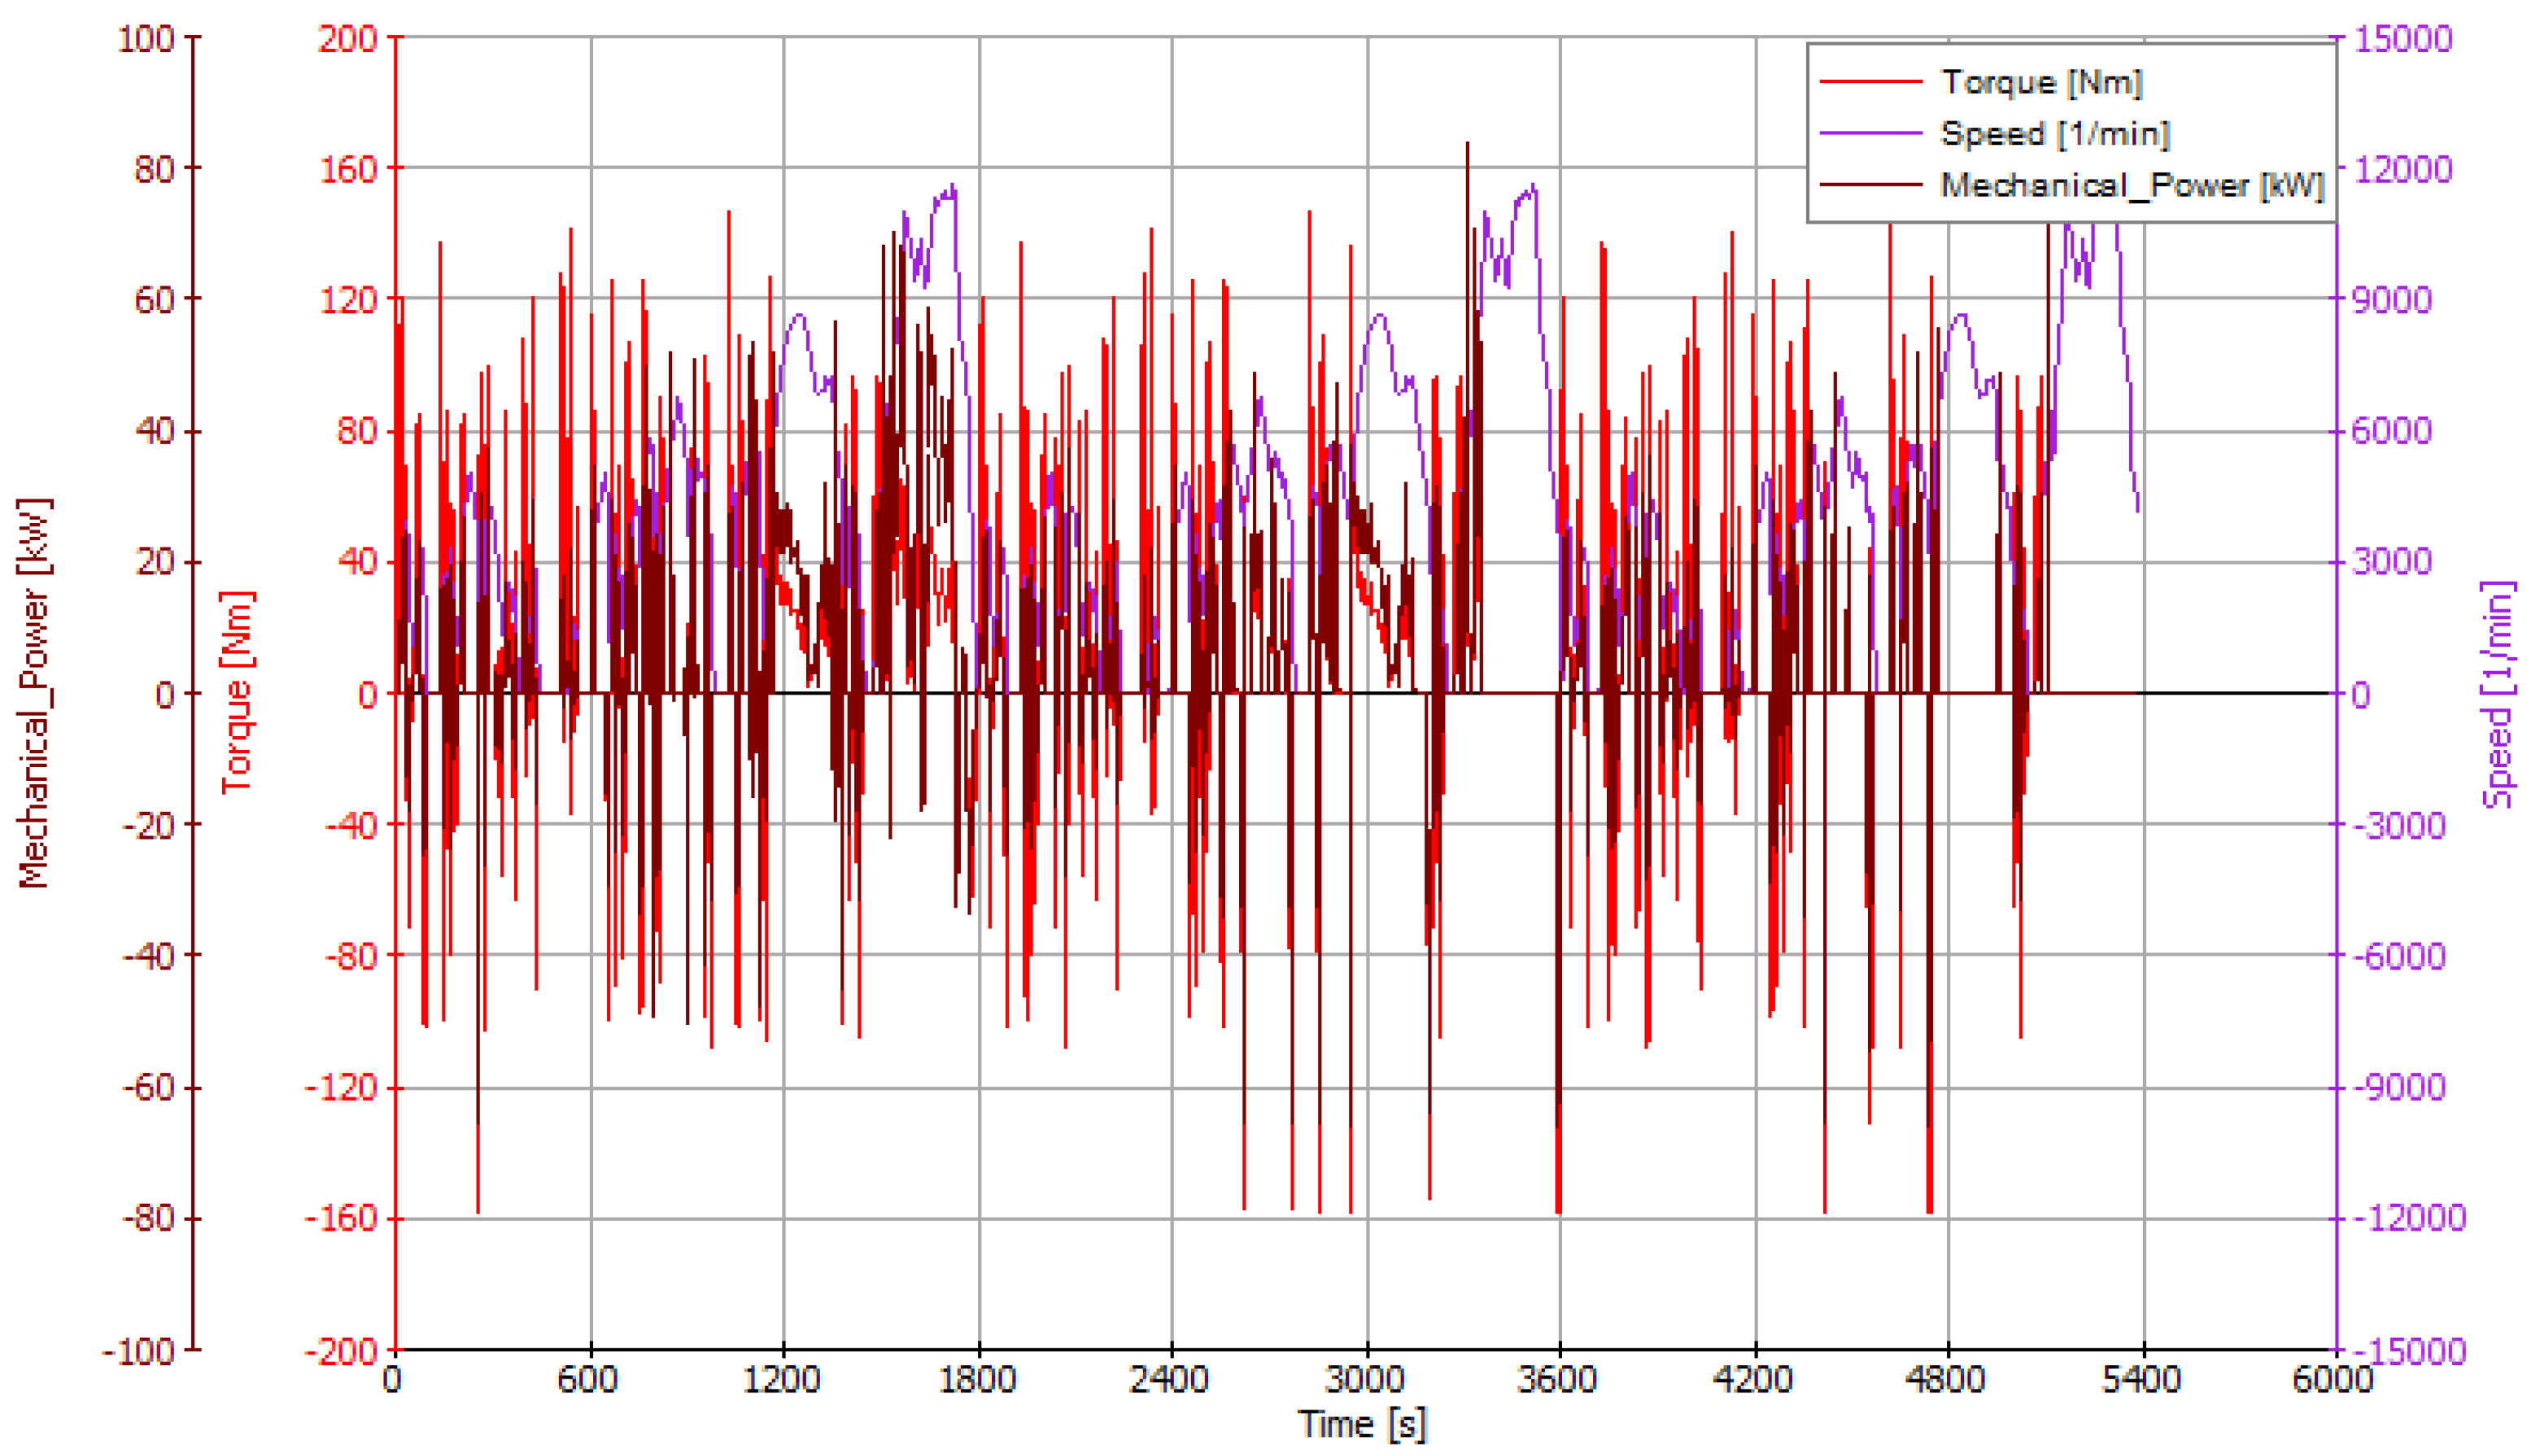

| Operating Modes | Status of Key Components | ||||
|---|---|---|---|---|---|
| Engine | P1 Motor | P3 Motor | Power Battery | Clutch | |
| EM alone | OFF | OFF | ON | discharged | disengaged |
| Extended-range mode | ON | ON | ON | charged | engaged |
| ICE alone | ON | OFF | OFF | idle | engaged |
| Combined ICE-EM | ON | ON | OFF | discharged | engaged |
| Power split | ON | ON | OFF | charged | engaged |
| Regenerative braking | OFF | OFF | ON | charged | disengaged |
| Operating Modes | Switching Logic | Torque Allocation | |
|---|---|---|---|
| Condition 1 | Condition 2 | ||
| EM alone | |||
| Extended-range mode | — | ||
| Regenerative braking | |||
| Operating Modes | Switching Logic | Torque Allocation | |
|---|---|---|---|
| Condition 1 | Condition 2 | ||
| ICE alone | |||
| Combined ICE-EM | |||
| - | |||
| Power split | |||
| Regenerative braking | |||
| Variable Names | Variable Descriptions |
|---|---|
| Minimum SOC threshold value | |
| Maximum SOC threshold value | |
| Vehicle wheel-end torque demand | |
| Engine maximum torque | |
| Engine minimum operating torque threshold value | |
| Engine high-efficiency zone optimal torque | |
| P1 motor maximum regenerative torque | |
| P1 motor maximum drive torque | |
| P3 motor maximum regenerative torque | |
| P3 motor maximum drive torque |
| Project | Parameters | Numerical |
|---|---|---|
| Vehicle | Curb weight | 2130 kg |
| Total mass | 2545 kg | |
| Frontal area | 2.26 m2 | |
| Drag coefficient | 0.33 | |
| Engine | Engine displacement | 1.5 L |
| Engine power | 105 kW | |
| P1 motor | Peak power | 47 kW |
| Peak torque | 75 Nm | |
| Maximum RPM | 11,000 rpm | |
| P3 motor | Peak power | 300 kW |
| Peak torque | 300 Nm | |
| Maximum RPM | 14,500 rpm | |
| Tires | Rolling radius | 287 mm |
| Transmission | Gear ratio | 1:0.75 |
| Power battery | Battery pack capacity | 11.52 kWh |
| Battery pack rated voltage | 320 V |
| Vehicle Models | Fuel Consumption Per Hundred Kilometers (L) | Fuel Efficiency Gain |
|---|---|---|
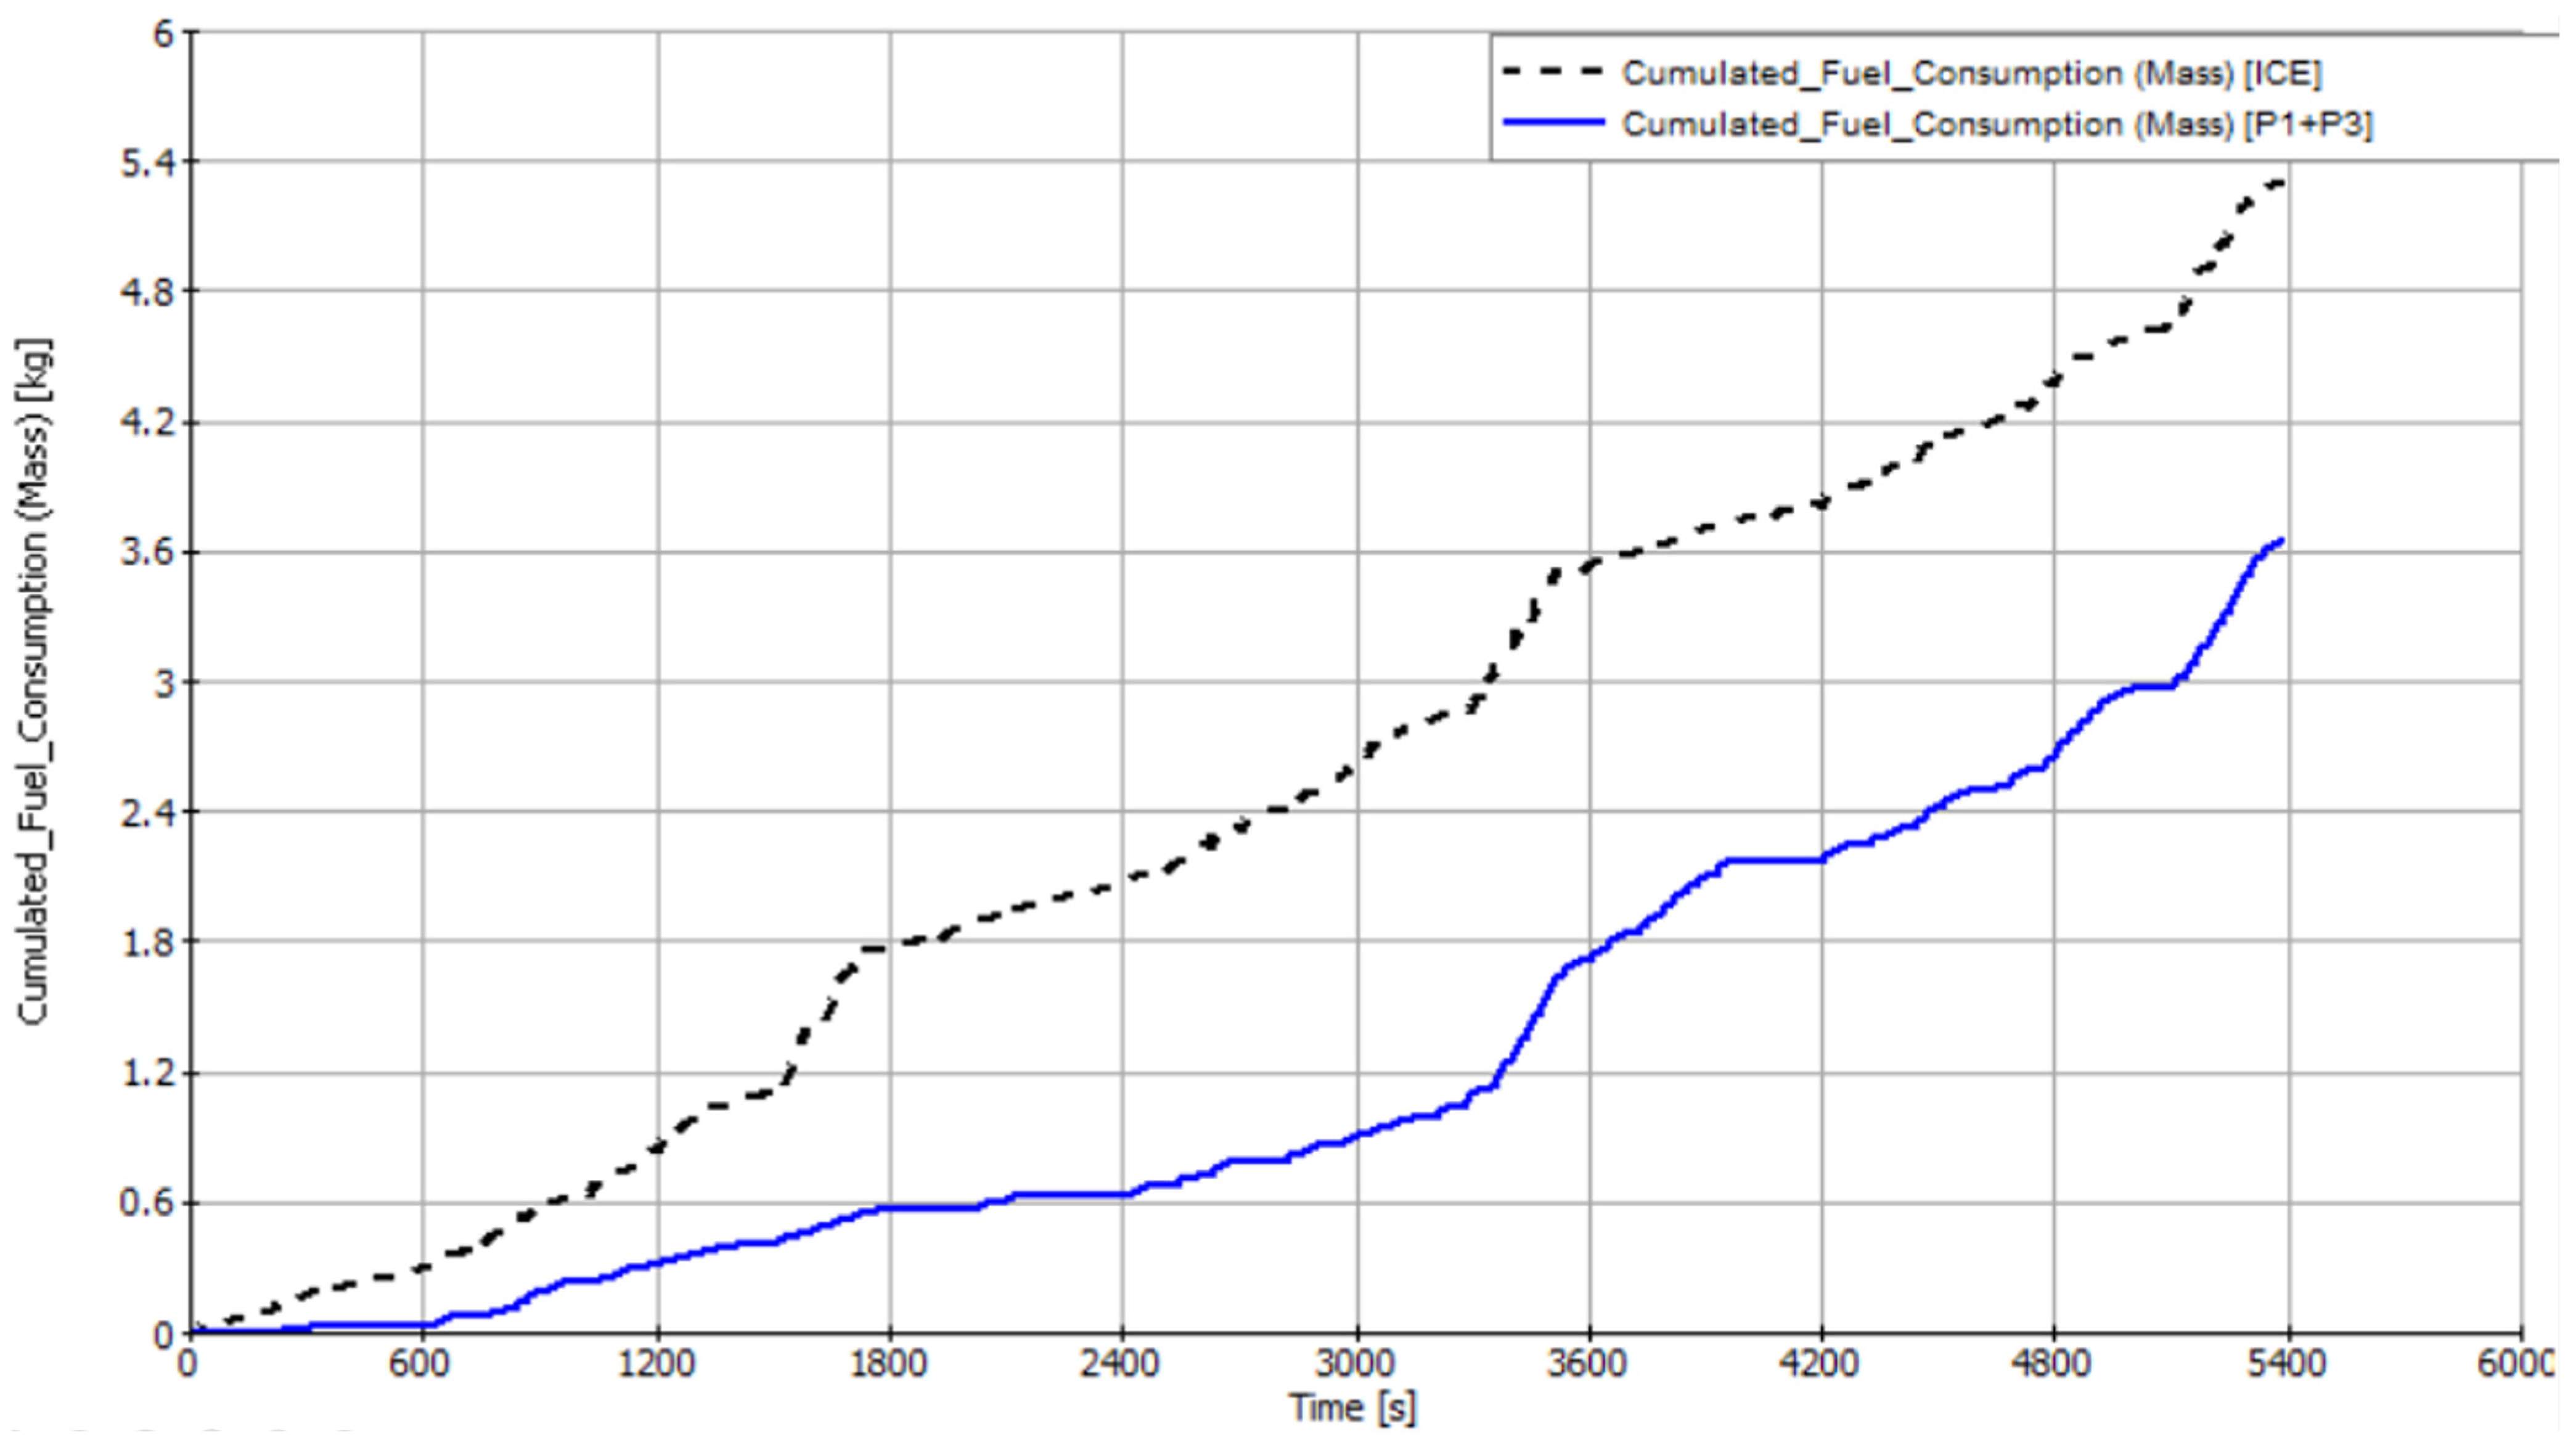
| Conventional vehicle | 10.00 | — |
| P1 + P3 hybrid electric vehicle | 6.74 | 67.4% |
Disclaimer/Publisher’s Note: The statements, opinions and data contained in all publications are solely those of the individual author(s) and contributor(s) and not of MDPI and/or the editor(s). MDPI and/or the editor(s) disclaim responsibility for any injury to people or property resulting from any ideas, methods, instructions or products referred to in the content. |
© 2023 by the authors. Licensee MDPI, Basel, Switzerland. This article is an open access article distributed under the terms and conditions of the Creative Commons Attribution (CC BY) license (https://creativecommons.org/licenses/by/4.0/).
Share and Cite
Zhang, B.; Shi, P.; Mou, X.; Li, H.; Zhao, Y.; Zheng, L. Energy Management Strategy for P1 + P3 Plug-In Hybrid Electric Vehicles. World Electr. Veh. J. 2023, 14, 332. https://doi.org/10.3390/wevj14120332
Zhang B, Shi P, Mou X, Li H, Zhao Y, Zheng L. Energy Management Strategy for P1 + P3 Plug-In Hybrid Electric Vehicles. World Electric Vehicle Journal. 2023; 14(12):332. https://doi.org/10.3390/wevj14120332
Chicago/Turabian StyleZhang, Bo, Peilin Shi, Xiangli Mou, Hao Li, Yushuai Zhao, and Liaodong Zheng. 2023. "Energy Management Strategy for P1 + P3 Plug-In Hybrid Electric Vehicles" World Electric Vehicle Journal 14, no. 12: 332. https://doi.org/10.3390/wevj14120332
APA StyleZhang, B., Shi, P., Mou, X., Li, H., Zhao, Y., & Zheng, L. (2023). Energy Management Strategy for P1 + P3 Plug-In Hybrid Electric Vehicles. World Electric Vehicle Journal, 14(12), 332. https://doi.org/10.3390/wevj14120332


