Article

Tuning Window Size to Improve the Accuracy of Battery State-of-Charge Estimations Due to Battery Cycle Addition

by
Dewi Anggraeni
1,
Budi Sudiarto
1,
Ery Fitrianingsih
2 and
Purnomo Sidi Priambodo
1,*
1
Department of Electrical Engineering, Faculty of Engineering, Universitas Indonesia, Depok 16424, Indonesia
2
Research Center for Satellite Technology, National Research and Innovation Agency, Bogor 16310, Indonesia
*
Author to whom correspondence should be addressed.
World Electr. Veh. J. 2023, 14(11), 307; https://doi.org/10.3390/wevj14110307
Submission received: 14 September 2023 / Revised: 13 October 2023 / Accepted: 17 October 2023 / Published: 8 November 2023
(This article belongs to the Topic Battery Design and Management)

Abstract

:
The primary indicator of battery level in a battery management system (BMS) is the state of charge, which plays a crucial role in enhancing safety in terms of energy transfer. Accurate measurement of SoC is essential to guaranteeing battery safety, avoiding hazardous scenarios, and enhancing the performance of the battery. To improve SoC accuracy, first-order and second-order adaptive extended Kalman filtering (AEKF) are the best choices, as they have less computational cost and are more robust in uncertain circumstances. The impact on SoC estimation accuracy of increasing the cycle and its interaction with the size of the tuning window was evaluated using both models. The research results show that tuning the window size ( M ) greatly affects the accuracy of SoC estimation in both methods. M provides a quick response detection measurement and adjusts the estimation’s character with the actual value. The results indicate that the precision of SoC improves as the value of M decreases. In addition, the application of first-order AEKF has practical advantages because it does not require pre-processing steps to determine polarization resistance and polarization capacity, while second-order AEKF has better capabilities in terms of SoC estimation. The robustness of the two techniques was also evaluated by administering various initial SoCs. The examination findings demonstrate that the estimated trajectory can approximate the actual trajectory of the SoC.

1. Introduction

Rechargeable batteries are an electrical power source extensively used in portable electrical tools, electric vehicles, and satellites [1]. The charging–discharging process of a battery may cause damage to the battery or electric devices due to an undercurrent or overvoltage state. To avoid potentially dangerous circumstances, a safe energy transfer process is required [2]. Mission activities at a given moment necessitate the availability of battery data from many completed missions as well as the effective execution of operational missions, which is one of the critical factors gained from accessible battery health. A system is required to monitor battery levels to optimize subsidized system performance, efficiency, and reliability [3]. In order to monitor and enhance battery safety and behavior, the electrification system needs a BMS [4].

Theoretical Review

A BMS has indicators that can determine the condition of a battery, namely, the state of charge (SoC), the state of health (SoH), the state of function (SoF), and the state of temperature (SoT) [5]. The SoC is one of the essential parameters offered by a BMS, and reflects a battery’s remaining capacity [6]. SoC is determined according to the battery model. Battery models are classified into three types: (a) electrochemical models, (b) machine learning (ML) models, and (c) equivalent-circuit models [7]. Implementing an electrochemical model is a complicated process [8] because it is based on electrochemical impedance spectroscopy (EIS) with observation of the frequency width of the spectrum, and it takes a long time to achieve balance in data collection experiments [9]. Furthermore, electrochemical models are typically built on partial differential algebraic equation systems (PDAEs), which result in sophisticated high-level computations due to the presentation of the concentration and distribution of ion particles in lithium-ion batteries. Furthermore, because the estimation process is performed offline, researchers are looking for approaches that are simpler and can be used for estimation in real time [10].
In recent years, an estimation of SoC in real time has been researched and explored. One method adopts a single particle model (SPM) to reduce the intrinsic mathematical complexities, which often presents a challenge in the field of electrochemistry, particularly for batteries [11]. The SPM and the extended single particle model (ESPM) have found application in real-time SoC estimation [12]. Nonetheless, it is important to acknowledge that the SPM does possess a limitation in that it relies on the assumption that electrodes consist of uniform-sized spherical particles. Furthermore, it is necessary to solve radial-domain PDEs within the single-particle model to attain the solid-phase Li-ion concentration. Meanwhile, the ESPM provides a description of the kinetic behavior of the electrolyte, which is used to describe battery dynamics; this can increase the complexity of the model [13].
In estimating the SoC, the machine learning model could offer better accuracy, and it is mathematically simpler compared to the electrochemical model. To attain high estimation accuracy, the model relies on a huge quantity of data, which is trained, verified, and tested throughout the process [14], meaning that the model must be trained, validated, and tested. Furthermore, the learning process is performed on data that fit the model’s parameters, and the final stage of the model is evaluated frequently [15]. This strategy does not need sophisticated mathematical models but may regulate unpredictable states in systems labeled as black boxes [16], eliminating the use of costly mathematical methods, such as electrochemical methods. However, the procedure necessitates a significant quantity of memory as well as technology with high-level specs for processing massive volumes of data [10].
Electrical equivalent-circuit methods (ECMs) are model-based methods that are commonly used in the development of BMS software [17]. ECMs use electrical circuit components, such as voltage, resistors, and capacitors, to represent the behavior of a battery in a relatively simple and computationally effective manner [18]. The battery characteristics of the model are determined by the current, voltage, capacity, number of cycles, and temperature [19]. The general ECM consists of Rint, the Partnership for a New Generation of Vehicles (PNGV), and an nRC (n parallel resistor–capacitor) [20]. First- and second-order models are the most commonly used SoC estimation models since they can comply with dynamic battery behavior [16]. Furthermore, to improve the accuracy of SoC estimation, the Kalman filter family is required. Kalman filters have lower computational costs [21] than the data-driven techniques, which require a large amount of high-quality data and therefore results in large computational calculations [22].
The Kalman filter (KF) algorithm is usually used for linear systems resulting in hysterical effects and cannot be applied to lithium-ion batteries that have non-linear properties. For non-linear systems, the extended Kalman filter (EKF) algorithm is utilized. The EKF employs Taylor’s first-order equation and can operate in real time, but its error rate is larger due to its low SoC precision compared to the adaptive extended Kalman filter (AEKF), which employs the same first-order ECM battery model [23]. In [24], the fractional-order unscented Kalman filter (FO-UKF) is used to estimate SoC. Fractional-order models involve electrochemical impedance spectroscopy (EIS) theory, in which capacity variation is indicated by the constant phase element’s (CPE’s) impedance. However, to make the model simpler, FO models occasionally overlook the effect of EIS frequency data, which lower the accuracy of the SoC calculation [25]. FO models are typically used in conjunction with H-infinity observers [26], resulting in complicated computations [27].
The unscented Kalman filter (UKF) is a method that employs pre-specified sample points to execute test runs of systems with very high estimation accuracy [28]. However, the UKF needs longer computing times and more sophisticated algorithms in comparison to the adaptive extended Kalman filter (AEKF) [29]. In addition, the AEKF is more robust under uncertainty conditions [30]. In the study conducted in [31], AEKF demonstrated capabilities to adapt to the error values that arose, allowing it to update the covariance matrix, which adjusts the predicted value to improve accuracy. SoC estimation using AEKF yields higher-accuracy results by adjusting the residual window size parameter. The experiment was carried out using a 2.1 Ah battery from NASA’s RW9 data set. The second-order AEKF technique used the second-order Taylor series equation derived from the first-order ECM equation. This results in complicated algorithms that require time to calculate, for which we could shorten the estimating procedure. According to the study in [32], window size, or sliding-window length (SWL), is the sum of the squares of the error values at the specified width divided by the length to obtain an error covariance measurement matrix in the system. Using AEKF based on the residual or error value and tweaking the window size value resulted in better estimate performance. However, the impact of the cycle was not investigated. The accuracy of the Kalman filter approach declines with increased battery cycle processes, affecting the performance of the BMS indicator [33]. Furthermore, the tuning window size is considered an issue that cannot be determined with certainty, making it difficult to give a minimum error value in the online estimation process [34]. Even though the method is considered an art form, statistical data should be used to properly assess estimated values [35]. In this study, the window size, also known as the SWL, was determined through a tuning procedure. Furthermore, the sampling of data acquired within a certain time frame and the determination of parameters for the first- and second-order AEKF made this study unique in terms of accuracy and speed in the SoC estimation process.
In this research, SoC estimation is carried out for battery packs specifically built to supply power to an aircraft payload system. The method used is based on the first- and second-order AEKF methods with a specified variation in the width of the tuning window size. This improves the accuracy and speed of computational calculations; in fact, with an increase in cycles, this method can provide better accuracy by making the window size width smaller.

2. Lithium-Ion Battery Modelling

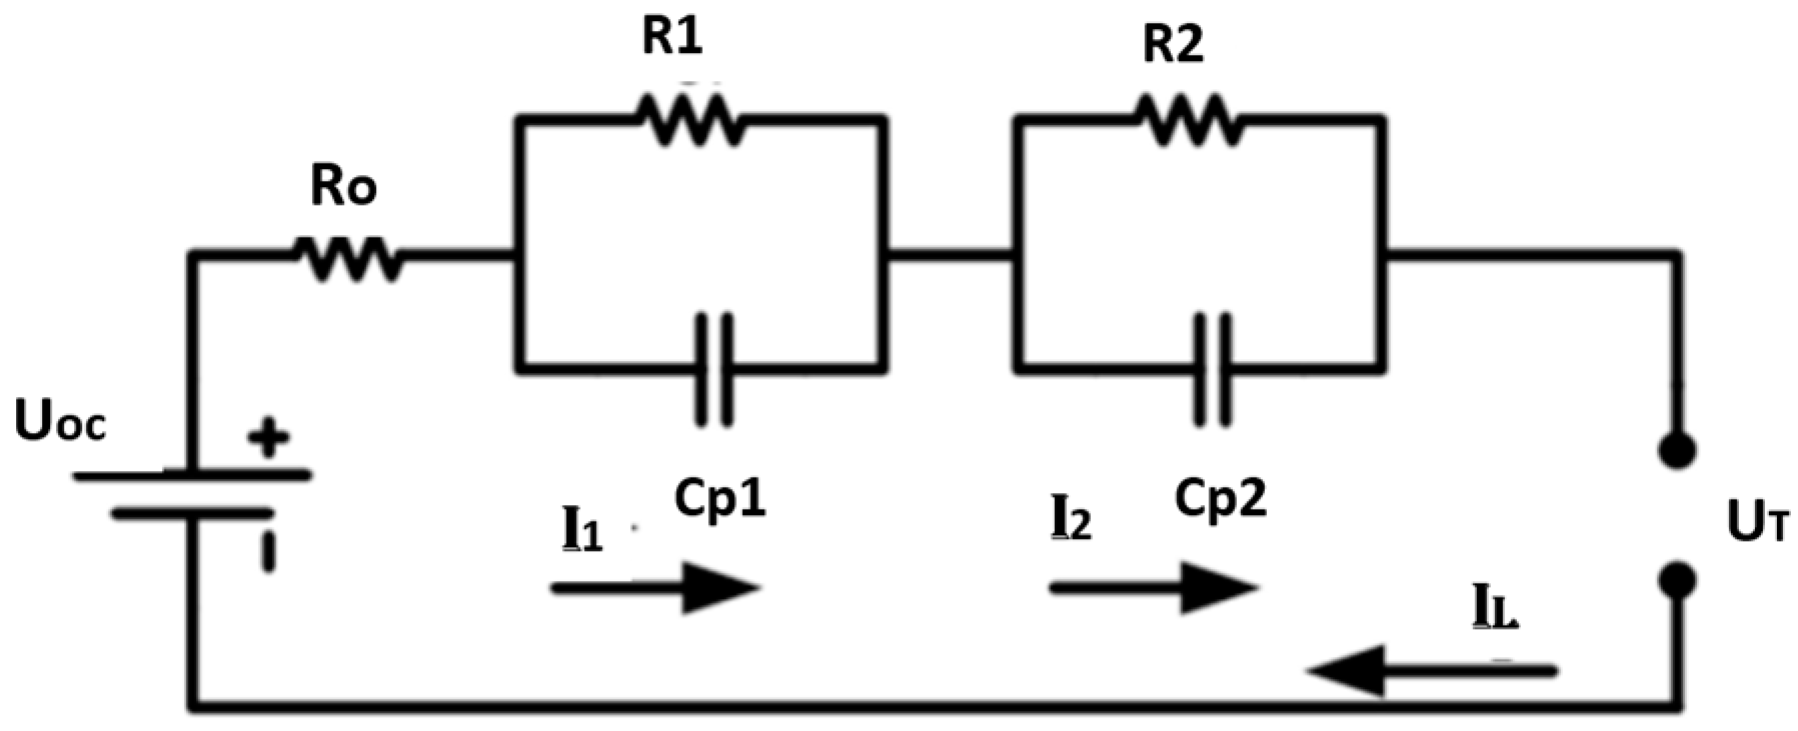
The first- and second-order RC circuit models, shortened to 1st- and 2nd-order ECMs, are commonly used to properly reflect battery dynamics. They are not computationally demanding as they are simple to construct and only a few parameters are involved. As illustrated in Figure 1, which is a simplified model, the U o c v reflects the potential at equilibrium during the charging and discharging process in terms of average values. Furthermore, at the same ambient temperature, it is open-circuit voltage (OCV) that has a relationship with the SoC. R 0 stands for ohmic battery resistance. The resistor–capacitor (RC) linkages explain the internal electrochemical polarization and concentration polarization mechanism of the battery during charging and discharging [36].
The model contains a voltage source section that covers the battery’s open-circuit voltage and parallel RC networks that show different battery diffusion and activation polarization processes [37]. The first-order RC consists of one polarization voltage composed of polarization resistance and capacity, represented as R 1 and C p 1 , respectively. Figure 1 describes the first-order ECM. In Figure 2, polarization voltage characteristics are represented by R 1 C p 1 and R 2 C p 2 , respectively, in the second-order polarization model, and their relationship evolves progressively [38]. In [39], the accuracy of the second-order circuit model is greater than that of the n-order RC. As a result, we utilize first-order and second-order models in our research.
Kirchoff’s law states that battery modeling (refers to Figure 2) can be described as follows:
U ˙ p 1 = I L C p 1 U P 1 R 1 C p 1 U ˙ p 2 = I L C p 2 U P 2 R 2 C p 2
U T = U o c v U p 1 U p 2 R o I L
Equations (1) and (2) become time step k domains in discrete form, resulting in the state–space equations shown in Equations (3) and (4) [40].
U p 1 , k = e T s τ 1   U p 1 , k 1 + R 1 1 e T s τ 1 U p 2 , k = e T s τ 2   U p 2 , k 1 + R 2 1 e T s τ 2
U T , k = U o c v U p 1 , k U p 2 , k R o I L , k 1
where T s is the sampling time and τ is the constant time, and τ 1 = R 1 C p 1 and τ 2 = R 2 C p 2 .
The lumped dynamic electrical model of the battery pack is expressed in discrete form as Equation (5).
U p 1 , k U p 2 , k S o C k =   e T s c p 1 R 1 0 0 0 e T s c p 2 R 2 0 0 0 1 U p 1 , k 1 U p 2 , k 1   S o C k 1 + 1 e T s c p 1 R 1 R 1 1 e T s c p 2 R 2 R 2 T s Q p r e s e n t I k 1

3. Lithium-Ion Battery State Indicator

The battery’s non-linear characteristics will be modeled using second-order ECM methods and filtered using the AEKF algorithm to improve the SoC estimation [41].

3.1. SoC Estimation Algorithm

Equation (6) below presents the SoC estimation using the Coulomb counting method. In Equation (6), efficiency is represented by η , which is assumed to be 0.9 during battery charging and 1 during discharging.
  S o C = S o C t 0 1 Q p r e s e n t 0 t η I t d t
The discrete form of Equation (6) is shown in Equation (7), where the charge and discharge currents are represented by I k 1 , and the total available battery charge is represented by Q p r e s e n t [42].
S O C k = S O C K 1 η T s Q p r e s e n t I k 1

3.2. Adaptive Moving-Window Size Delineation

The following equation presents the measurement system equation and the state equation for non-linear discrete time.
X k = f X k 1 , u k = A X k 1 + B u k 1 + w k 1 Y k = g X k , u k = C X k + D u k + v k 1
The term k , in the state variable and computation inputs, is represented as X k and Y k , respectively. For comprehensible non-linear equations, AEKF refers to Equation (9).
A =   e T s c p 1 R 1 0 0 0 e T s c p 2 R 2 0 0 0 1   B = 1 e T s c p 1 R 1 R 1 1 e T s c p 2 R 2 R 2 T s Q p r e s e n t C = 1 1 d U O C V d S o C ,   D = R o
The dynamic state X k consists of A , which is the dynamic coefficient matrix; B , which is the dynamic sensitivity matrix; and C , which refers to the dynamic measurement system for inputs. Additionally, D is identified by R 0 , u k , v k , and w k , which represent the system signal input, system measurement noise, and process noise, respectively.
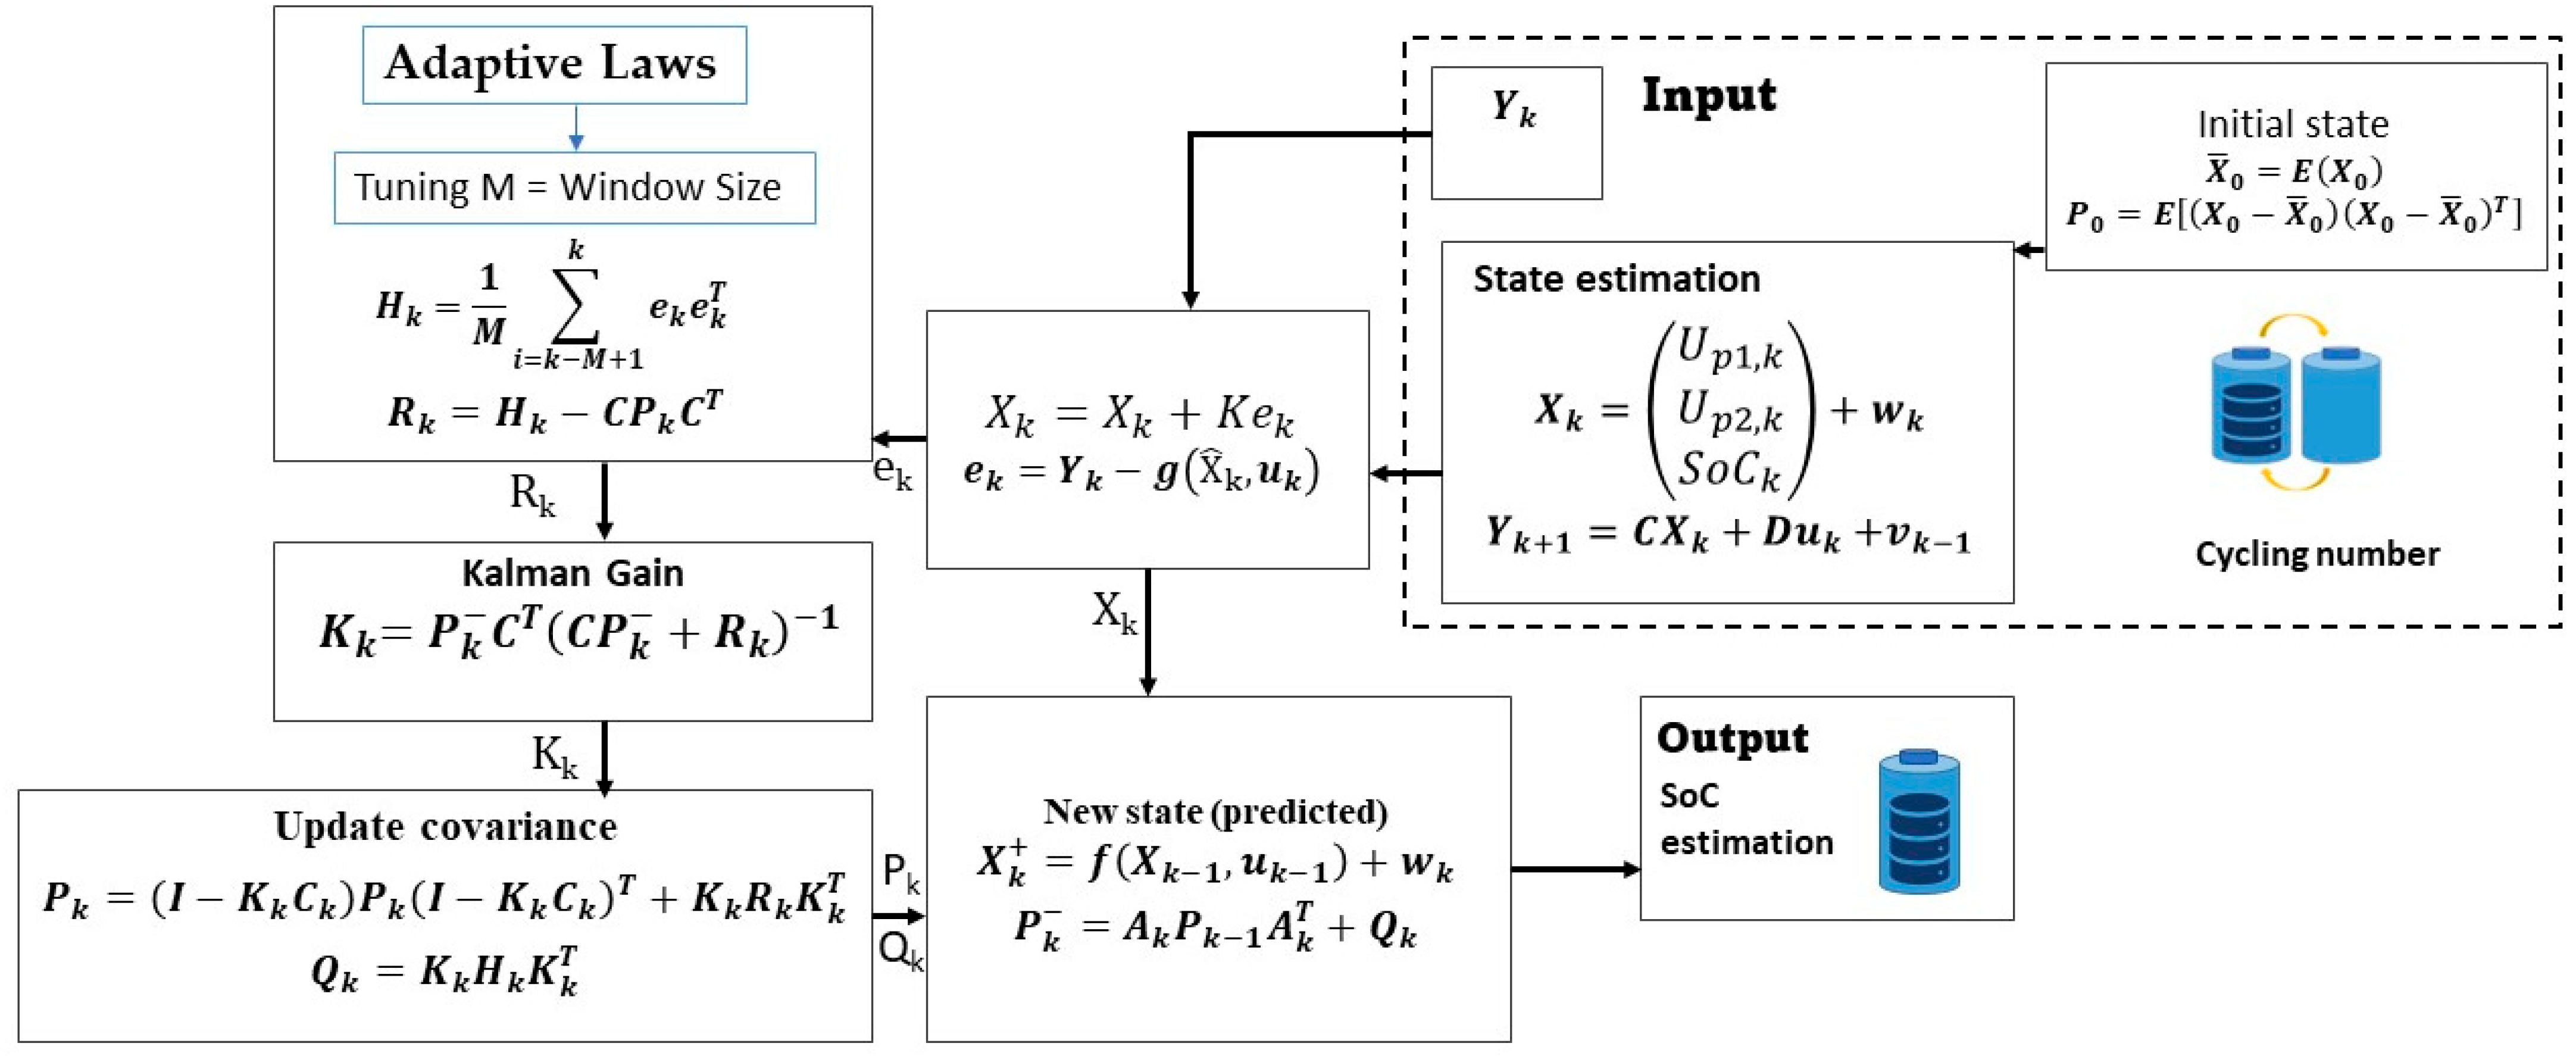
The AEKF algorithm can be explained through the following procedures:
  • Initialize the mean ( X o ¯ ) and the covariance ( P 0 ) of the initial system state X 0
    X 0 ¯ = E X 0 P 0 = E X 0 X ¯ 0 X 0 X ¯ 0 T
    where E is the mean value.
  • Time generation for state and covariance prediction.
The state prediction refers to Equation (8):
X ^ k + = A X k 1 + B u k 1 + w k 1 P k = A k P k 1 A k T + Q k
Generate the measurement.
Kalman gain matrix:
  K k = P k C k T C k P k C k T + R k 1
Update the covariance.
P k = I K k C k P k I K k C k T + K k R k K k T
Update the state.
K k + = X ^ k + K k e k
e k = Y k g X ^ k , u k
Adaptively adjust Q and R .
Q k = K k H k K k T
H k = 1 M i = k M + 1 k e k e k T
R k = H k C P k C T
The correlation between the state of the dynamic system and the measurements provided by the measurement sensitivity matrix is defined by H . M is the sliding window, where the error sequence is characterized through statistical variants that occur in the dynamic system, and allows estimation correction to be obtained in real time [43]. Additionally, the covariance matrices of Q and R for measurement noise and process noise have significant meaning for the estimated SoC. Consequently, selecting the appropriate rate for the M variable is essential in terms of accuracy [34].

4. Methodology, Experiments, and Parameter Identification

The SoC was estimated using first- and second-order battery models. Furthermore, two Kalman filter techniques were utilized to optimize the findings. Figure 3 depicts the flowchart utilized for the SoC estimation.

4.1. Experiments

Experiments were carried out over six months using the following components: (a) 84 lithium-ion battery packs; (b) a battery analyzer BTS8; and (c) an electrical line to the battery hub. The studies were carried out through charge–discharge cycles at 0.2 C at a temperature of 25 °C with a rest time of 30 min to allow the concentration of relaxation to occur and the distribution of solid lithium particles to return to the equilibrium point [44].

4.2. Parameters Identification for Second-Order ECM

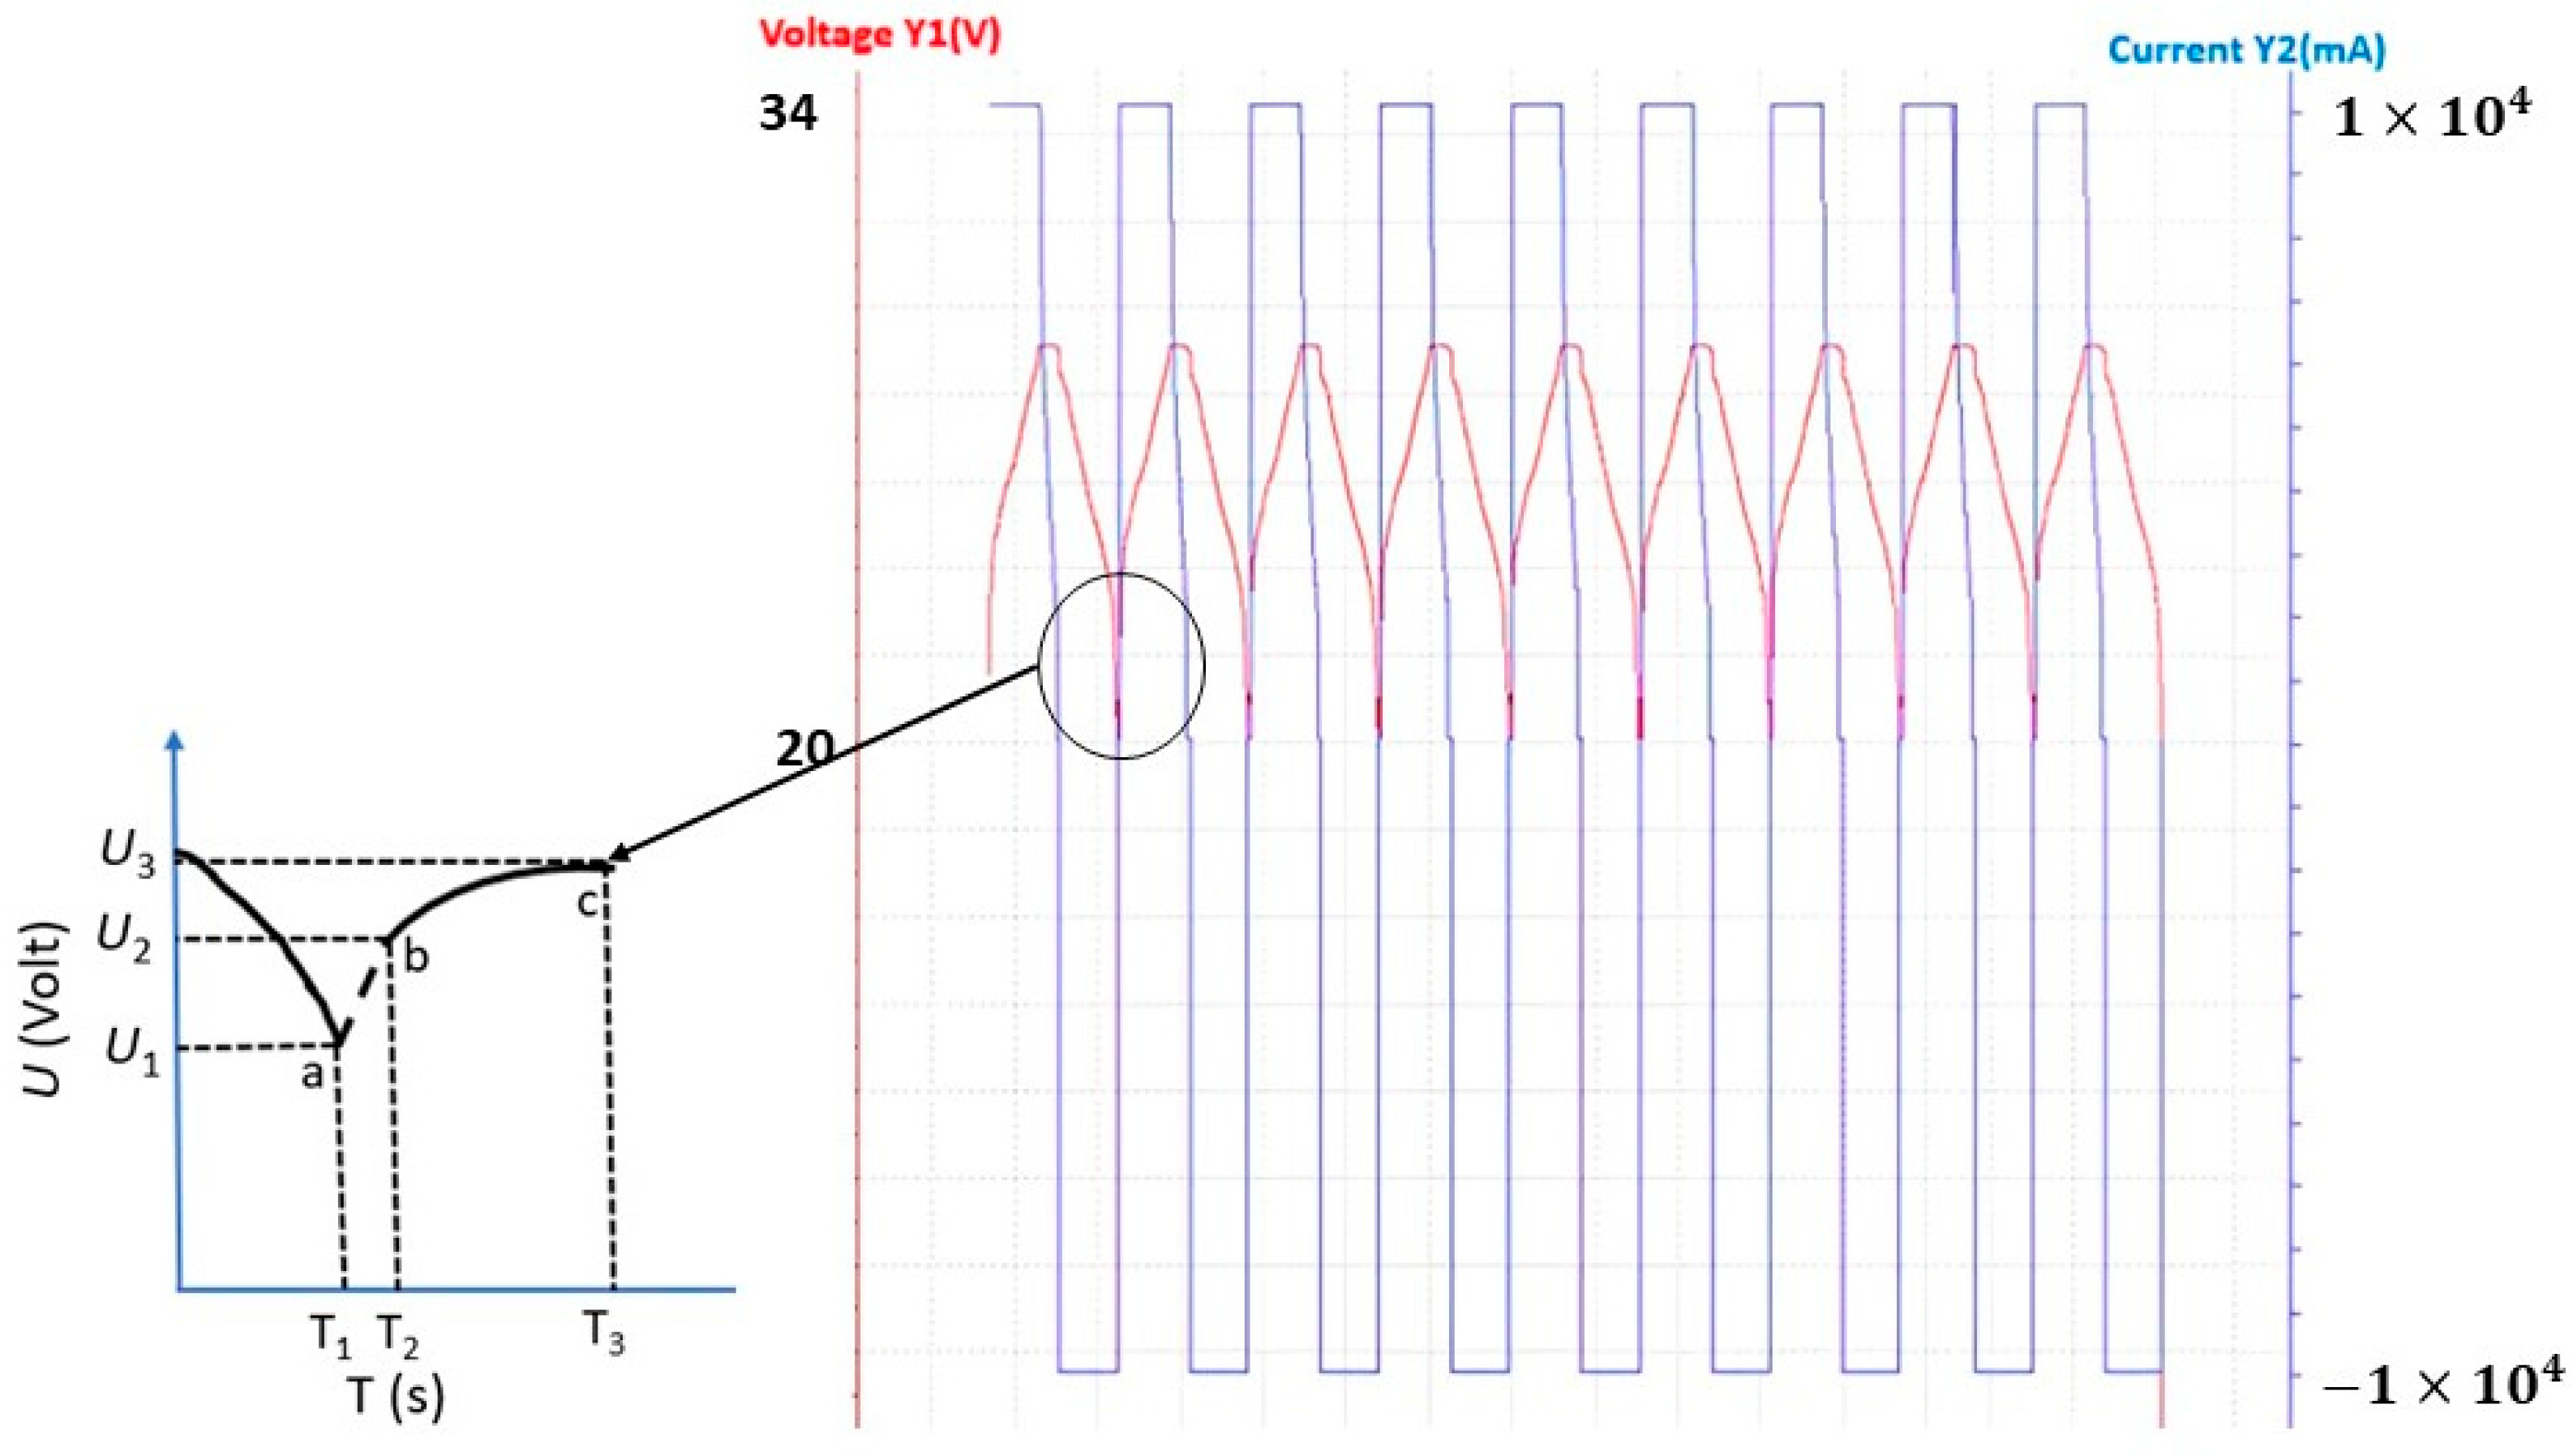
The exponential fitting method determines resistance and capacitance under different SoCs. Figure 4 shows the outline of the current and voltage characterization charge–discharge test conducted. Pulse charging is 1 × 10 4 mA, while 1 × 10 4 mA is denoted as the discharging line. The discharge does not end the internal electrochemical process immediately, and the terminal voltage increases rapidly. Furthermore, it gradually approaches a constant value, which is referred to as the lithium-ion battery’s jump-rebound characteristic.
At line point a−b, the discharge area is at a point where the current is 0. So, the value of the internal resistance can be found using Equation (19).
R o = U b U ( a ) I
At line point b−c, the delay in the voltage response can be said to be zero, so the value of the second-order RC can be found. The following is the expression for the voltage at the battery terminals shown in Equation (20).
U T , 0 = U o c U p 1 U p 2
In Equation (20), U p 1 and U p 2 are polarization voltages. The voltages across the capacitor are considered equal at the same time; hence, the polarization voltages can be expressed as Equation (21).
U p 1 = I t R p 1 . e T s R p 1 C p 1 U p 2 = I t R p 2 . e T s R p 2 C p 2
The pulse discharge element in the fitting curve is represented in Equation (22).
y = z 0 z 1 e ( R p 1 C p 1 ) z 3 e R p 2 C p 1
The parameter RC polarization can be found using Equation (23).
R p 1 = z 1 I ,   R p 2 = z 2 I C p 1 = z 1 R p 1 ,   C p 2 = z 2 R p 2

4.3. Methodology

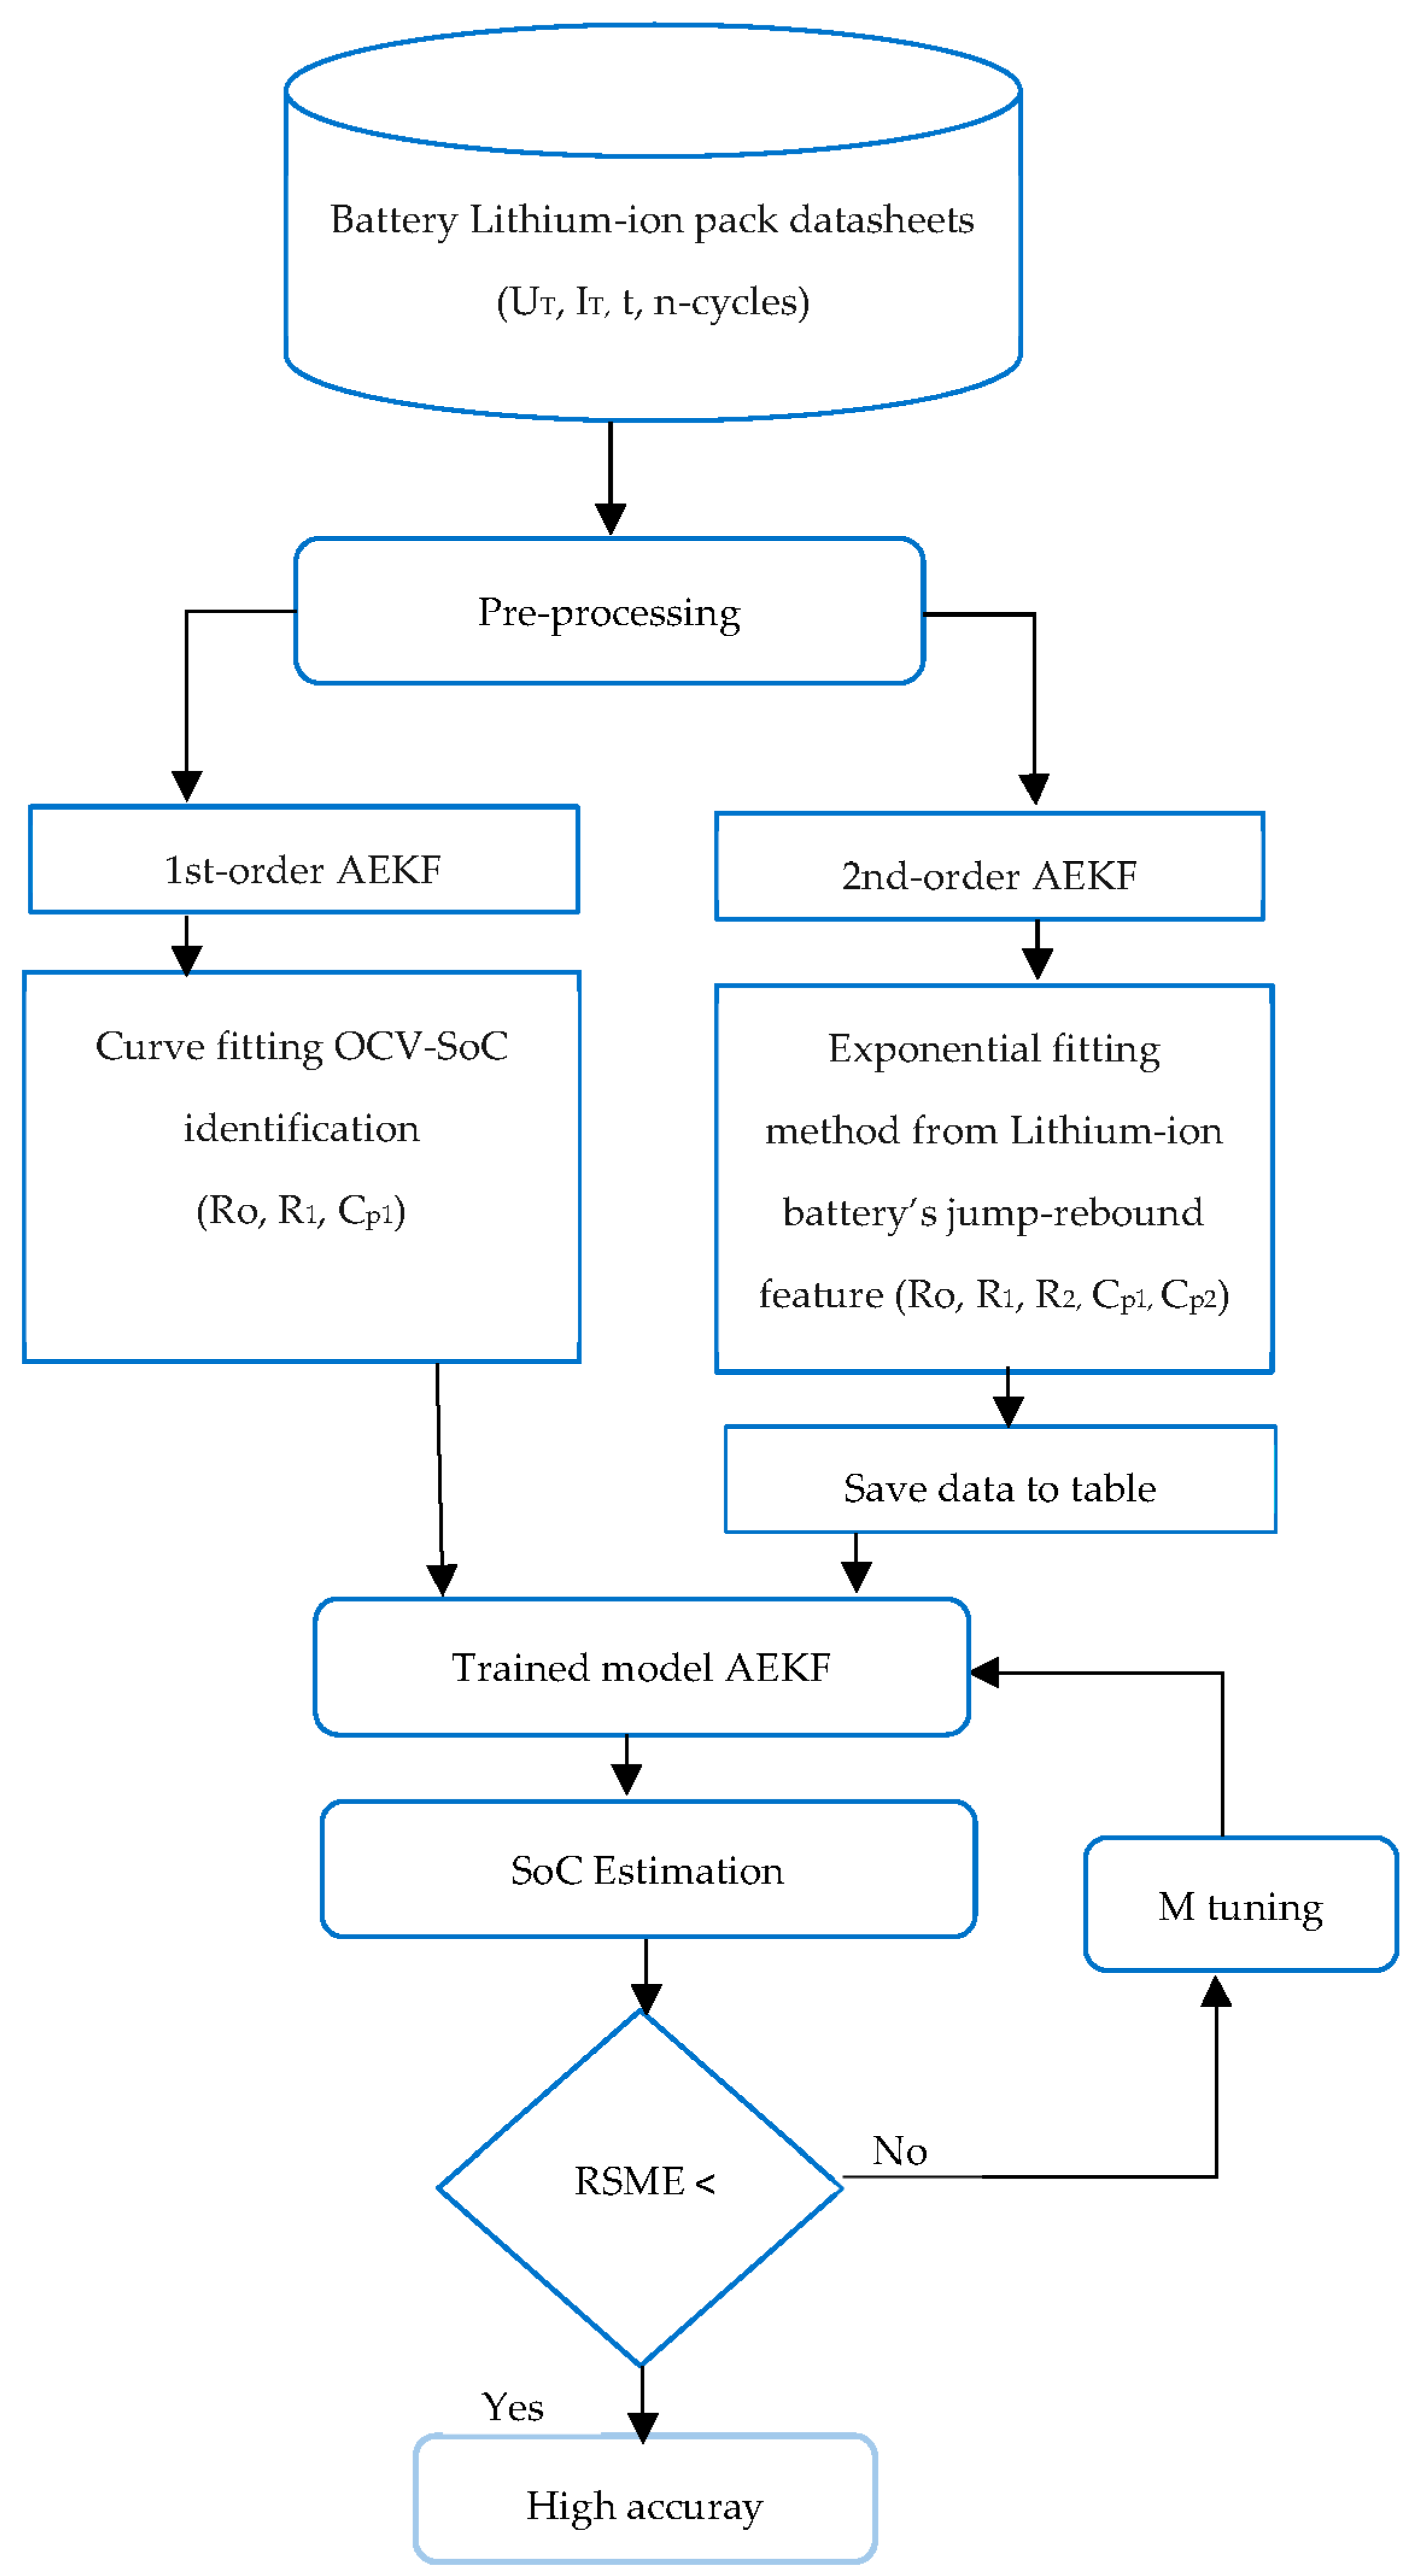
Lithium battery pack measurement data are collected for up to 500 cycles consisting of terminal voltage ( U T ), current ( I ), and time ( t ). Data on current and voltage are recorded once every 20 s. The estimated value of the SoC itself is unaffected by the overall time, which in this case is multiplied by 20 from the projected output calculation time. Figure 5 shows an example of the SoC estimate flow chart.
The recursive least square approach and OCV−SoC curve fitting are then employed to obtain the values of R 0 , R 1 , and C p 1 in the AEKF first-order model. The description of first-order AEKF methods is provided by the authors in [23]. Simultaneously, an exponential fitting curve, known as the “lithium−ion jump-rebound feature”, as stated above, is performed during the reaction time to identify the parameters R 0 , R 1 , R 2 , C p 1 , and C p 2 in the second-order AEKF. The distinction between the two parameter identification techniques is in the data storage. The data for the second-order AEKF model are saved in each cycle throughout the training stage. Meanwhile, there is no parameter data storage for R 1 and C p 1 in the first-order AEKF model.
During the training phase of the second-order AEKF model, parameter data are collected from the lookup table (LUT) recorded in the previously mentioned pre-processing procedure. This procedure, on the other hand, does not occur in the 1st-order AEKF model since the data may be immediately executed in real time. The SoC estimate may be determined after this stage. Entering the training model step, the M value is given at the trained stage in the AEKF model to generate the estimated SoC. Furthermore, a low RSME value is considered a sign of high SoC estimation accuracy.
The root mean square error (RSME) value is commonly used to determine the accuracy of the SoC estimate. The accumulated value of the divergence of the true value from the estimate is compared in this step. This RSME will compare the two models given above to determine which has the lower deviation value, indicating a greater level of accuracy in calculating SoC [23]. Equation (24) depicts the definition of RSME.
R S M E = i = 1 N S o C i S o C ^ i 2 N
where N represents the amount of data, while SoC is the real value and S o C ^ is the estimated value of SoC.
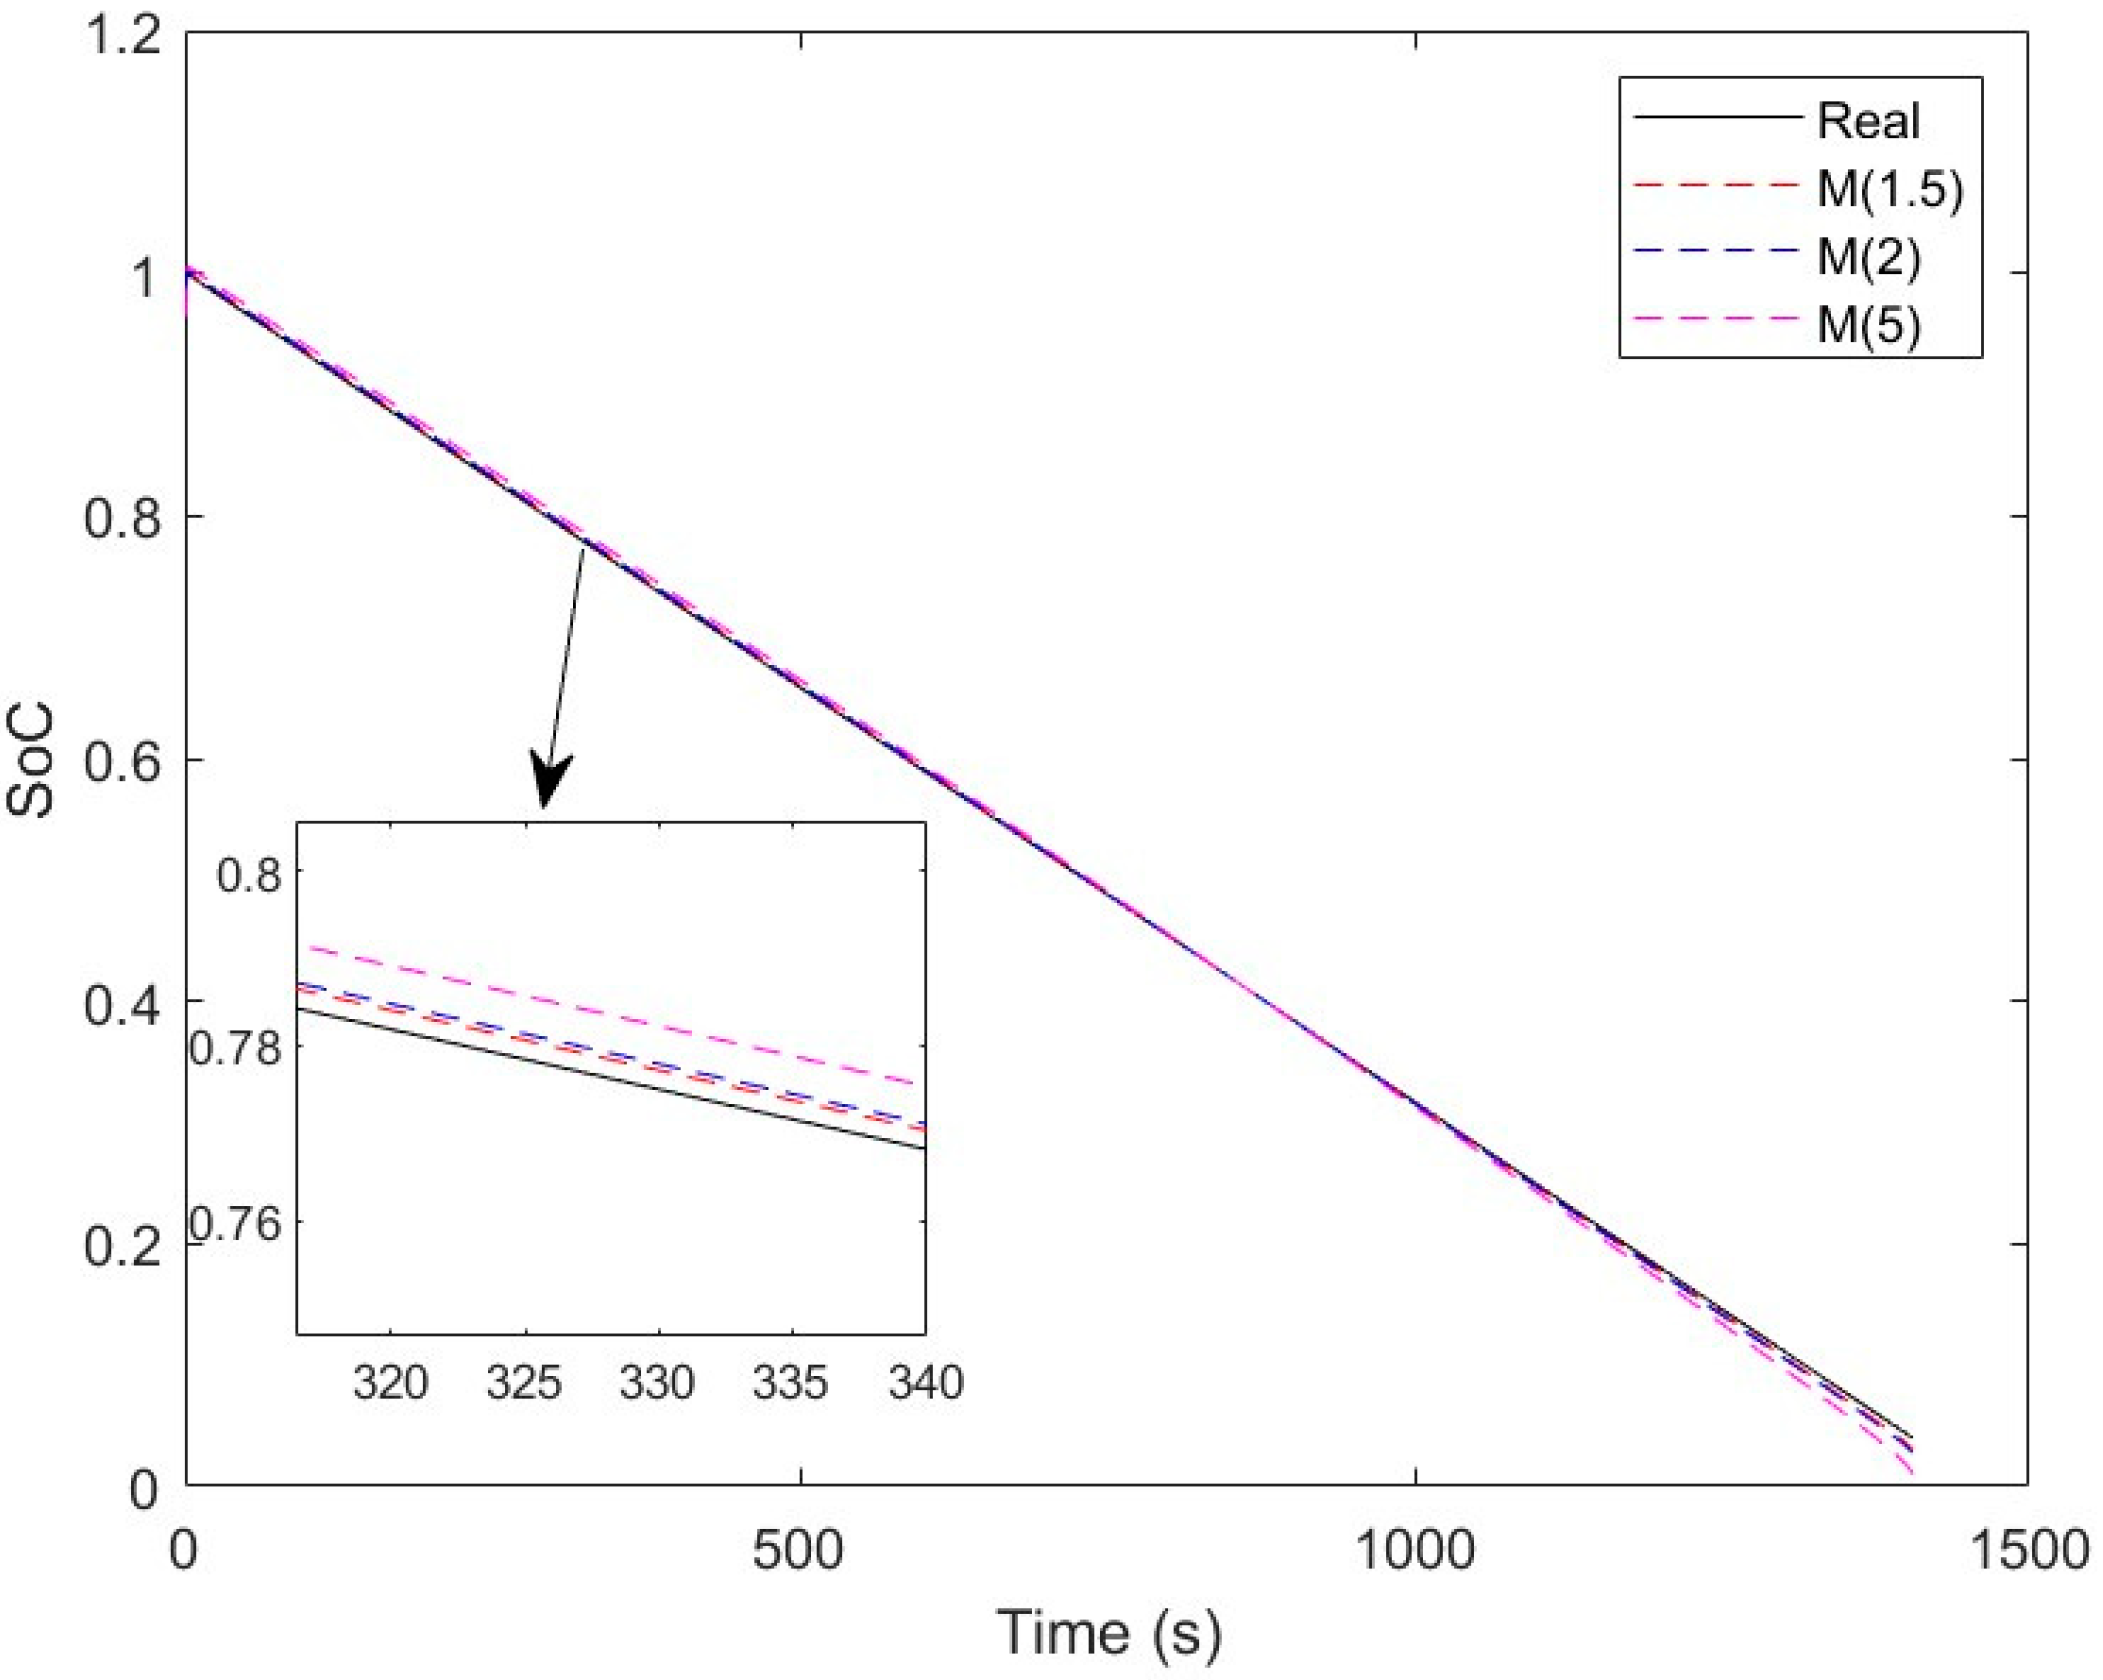
M are real positive values and we chose 1.5, 2, and 5 for M in the training models of the first-order AEKF. Among the given M values, M = 1.5 has a smaller RSME value compared to M = 2. The smaller the M value, the smaller the RSME value, as depicted in Figure 6 and Table 1. Therefore, we chose five numbers to be modeled with M ≤ 1.
We obtained five values from the trained model performed, providing the SoC estimate with a high accuracy value. We began by setting M to 1, then gradually decreasing its value to determine the optimal value. To determine the relationship between M and the SoC estimation accuracy, each n-cycle was processed with a distinct M value input. We determined the M value from highest to lowest, namely with M 1 = 1, M 2 = 0.8, M 3 = 0.5, M 4 = 0.1, and M 5 = 0.01. This is applicable in both suggested models. The SoC estimations reported in this study are for 1, 100, 200, 300, 400, and 500 cycles.

5. Result and Discussion

5.1. SoC Estimation

An evaluation of the SoC estimation accuracy of the objective model used in the BMS payload system and its impact on the number of cycles was performed. The differentiation of the first-order AEKF model is the pre-processing stage where non-linear state–space parameter values in the second-order AEKF in each cycle are determined, as described in Section 4.2. The parameters are the internal resistance, polarization capacitance, and polarization resistance, which are shown in Table 2 and Table 3.
The performance of the first- and second-order ECMs in terms of the examination load and deficiency conditions is determined. Figure 7 depicts a graph of SoC estimates, where the black line represents the true value of the SoC, the dots represent the results of first-order AEKF modeling, and the line represents the results of second-order AEKF modeling. The color difference indicates a distinct M value: M 1 = 1 for green, M 2 = 0.8 for blue, M 3 = 0.5 for magenta, M 4 = 0.1 for turquoise (cyan), and M 5 = 0.01 for red.
The green dots have the highest deviation lines, but the red dots are closer to the true line. Furthermore, as shown in Figure 7b, the lines of the second-order AEKF chart converge on the black lines in all cycles. The graph also shows that the lines diverge much more as the number of cycles increases.
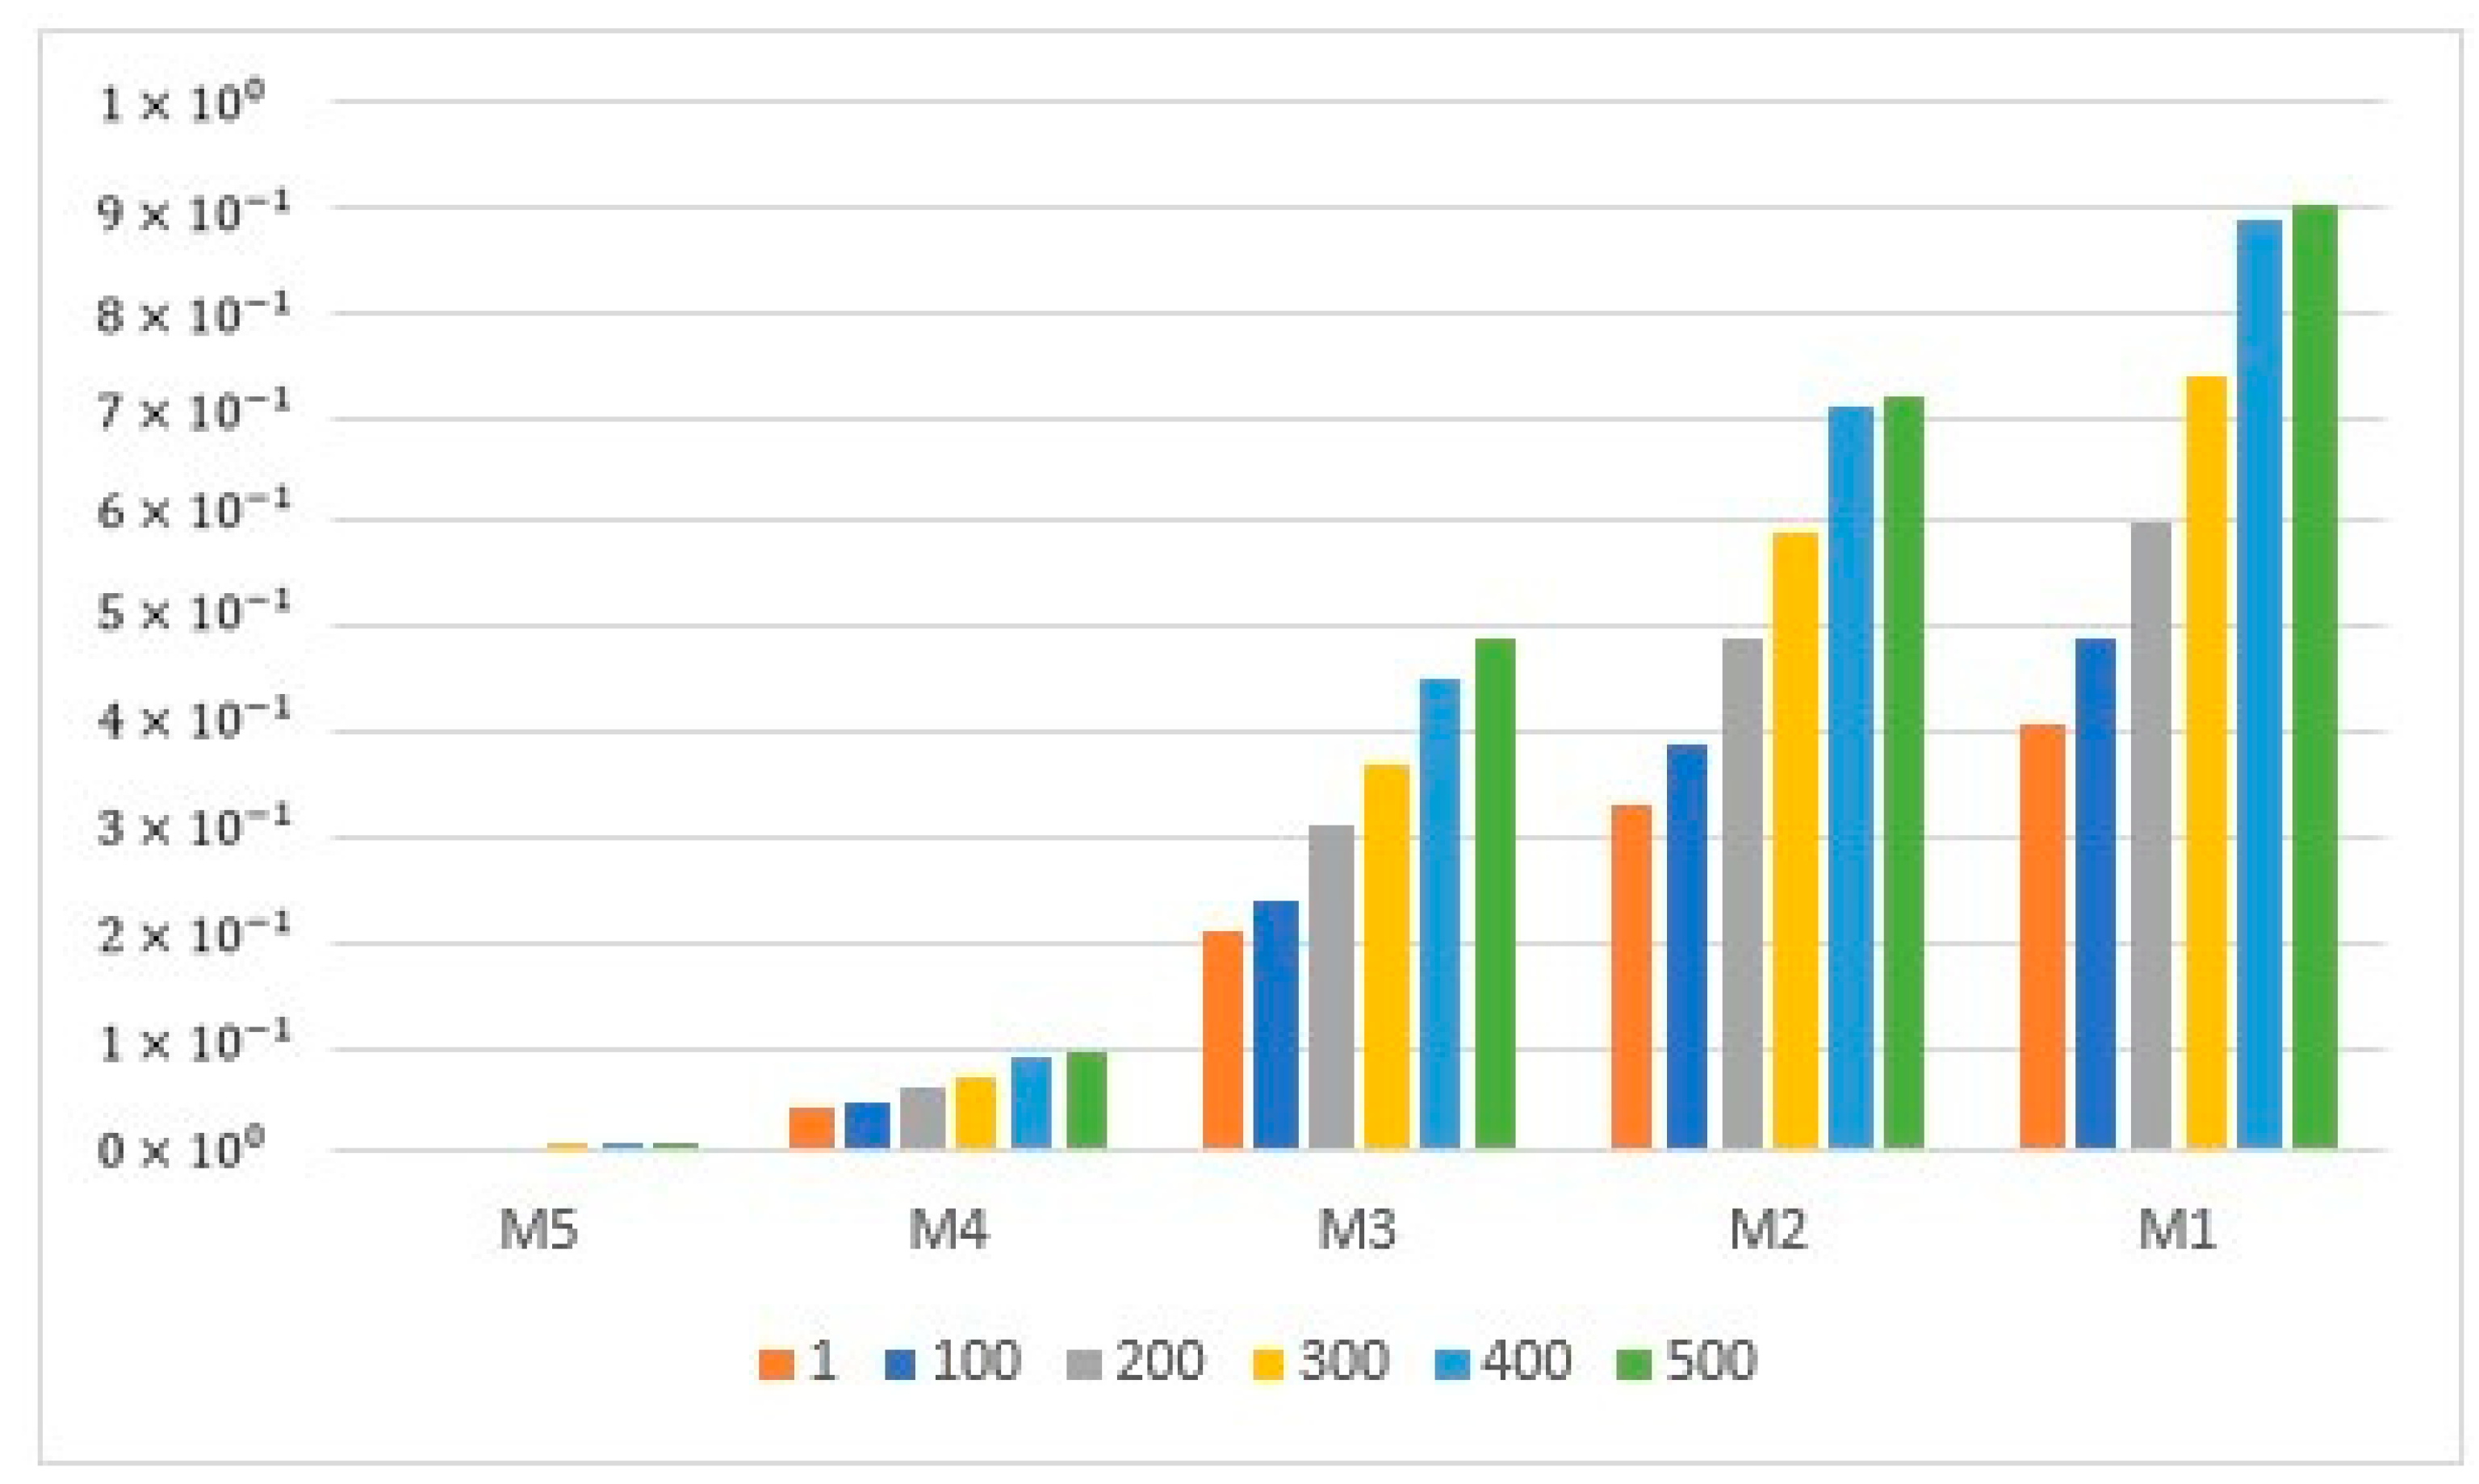
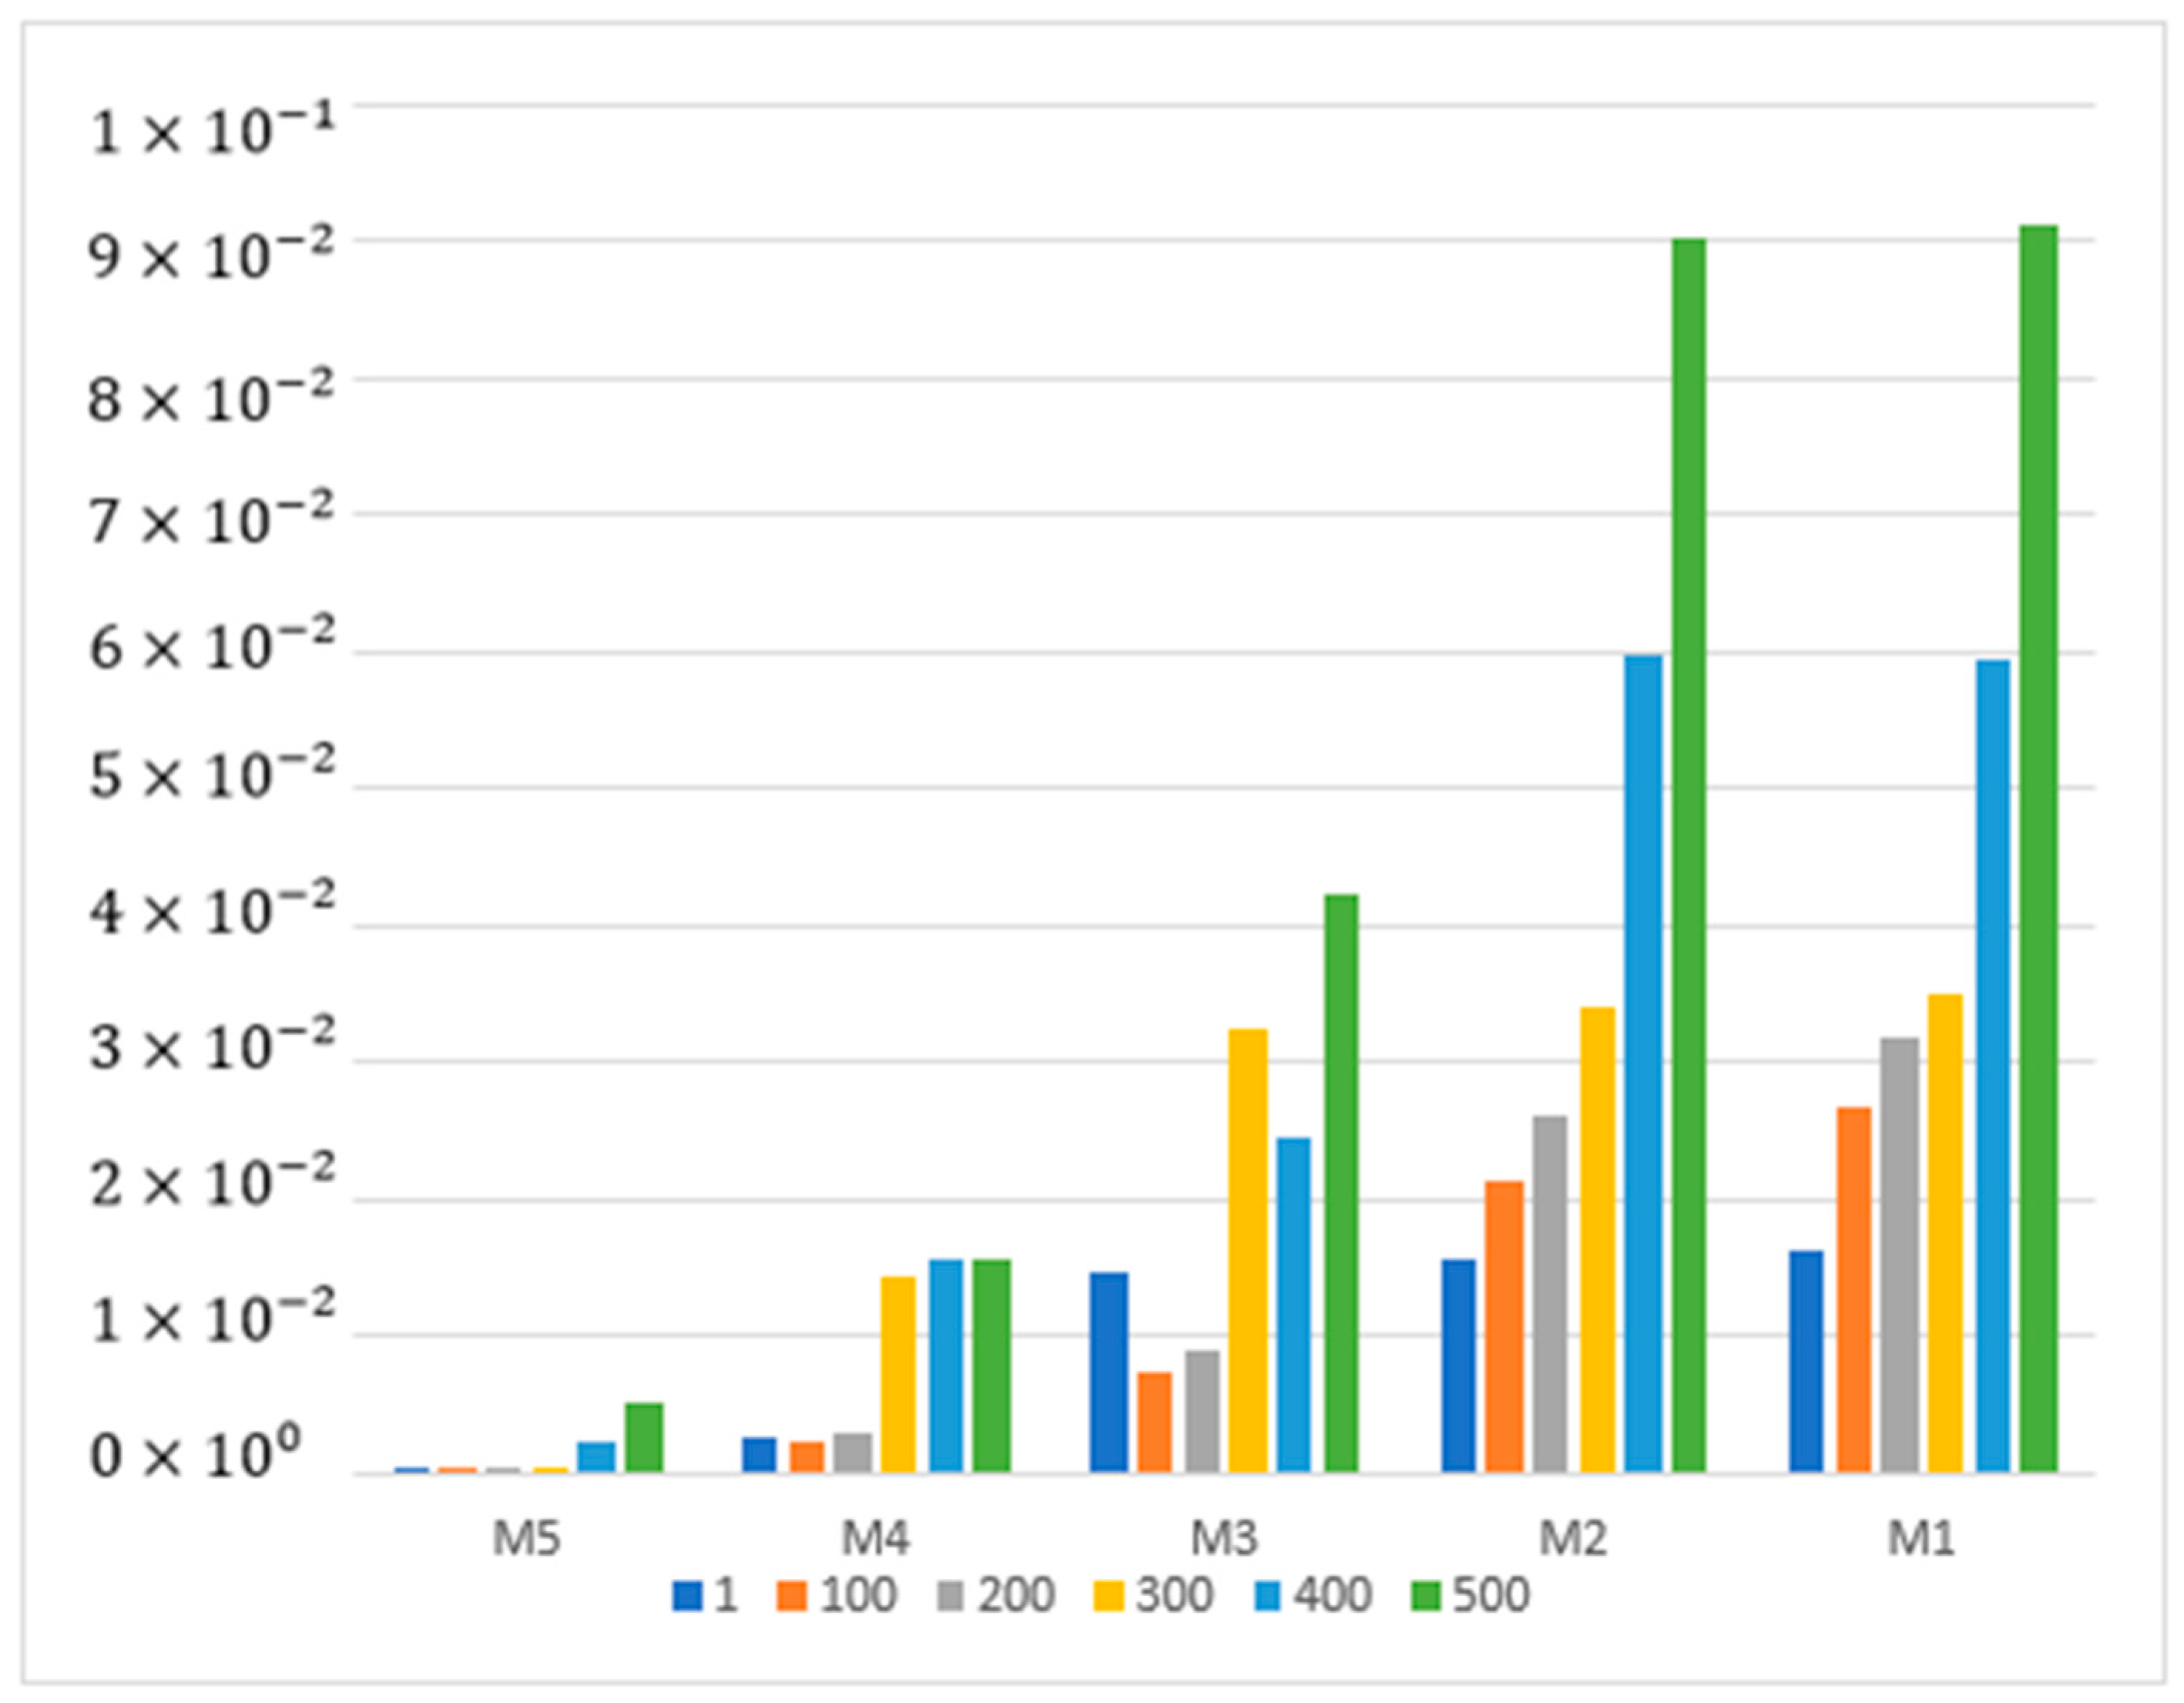
The RSME values in both models are displayed in Table 4, and as the cycle grows, so does the RSME value. Similarly, when the value of M grows, so does the deviation value. The first-order AEKF method has the lowest proportion of RSME at M 5 = 0.01 (4.1461 × 10⁻³), while the highest is at M 1 = 1 (4 × 10⁻¹) in cycle 1. The second-order AEKF method has the lowest RSME on M 5 at 1.5994 × 10⁻⁴ and the highest RSME on M 1 at 1.6269 × 10⁻². As the cycle increases, the RSME values tend to rise. As shown in cycle 500 for the first-order AEKF, the smallest RSME value is 9.7178 × 10⁻³, and the largest RSME value is 9 × 10⁻¹. Meanwhile, the lowest RSME percentage for the second-order AEKF is 5.2878 × 10⁻³ in M 5, while the highest RSME percentage is 9.1223 × 10⁻² in M 1.
The accuracy of SoC estimation for n-cycles and M is shown in Figure 8 and Figure 9. Cycles 1, 100, 200, 300, 400, and 500 are represented by six charts. Figure 7, for the first-order AEKF, indicates that the number of charge–discharge cycles increases and the SoC accuracy decreases. The bar graph shows that at the 500th cycle, the RSME value is higher than at cycles fewer than 500. The same occurs in the second-order AEKF. The RSME value increases significantly by the 500th cycle (refer to Figure 8).
M 5 provides better SoC estimation accuracy than M 1– M 4. This information is presented graphically in Figure 7 and Figure 8, which depict the first- and second-order AEKF. The RSME value in M 5 has the lowest value compared to M 1 to M 4. Likewise, if both models are trained at the highest cycle, SoC estimation is more accurate than M 1– M 4 at the same number of cycles.
The accuracy of the second-order AEKF is higher than that of the first-order AEKF. Although the second-order AEKF is more accurate, it requires parameter data on the LUT in each cycle, as shown in Table 4. This shows that variations in the error value at a specified width (M) will provide a quick response detection measurement and adjust the character of the actual and estimated values.
The comprehensive analysis in Table 4 shows that the percentages of RSME values for the first- and second-order AEKF increase with the number of cycles. SoC assessment precision is reduced as the level of M tuning increases.
The preceding result shows that AEKF has difficulty with actual scenarios, particularly when the battery begins to experience significant aging. Furthermore, the accuracy and reliability of the second-order AEKF are higher than those of the first-order AEKF.

5.2. Robustness Analysis with Different Initial SoCs

The estimation of SoC by the first- and second-order AEKF is heavily influenced by the initial parameters. In this case, the initial SoC values are 0.7, 0.8, and 0.9 in the first charge–discharge cycle. The outcome of the simulation is illustrated in Figure 10. The lines generated by the first-order AEKF exhibit a higher level of volatility in the estimation of SoC compared to the lines produced by the second-order AEKF. The estimated line produced in the second-order AEKF closely aligns with the actual line. It can be inferred that the employed estimation technique is capable of accommodating errors in the initial SoC values while accurately tracking the desired SoC trajectory. Consequently, the proposed estimation approach exhibits enhanced robustness against inaccuracies in the initial SoC values.

6. Conclusions

This study aimed to assess the effectiveness of the first- and second-order AEKFs in estimating SoC while accounting for the effect of the number of cycles. The following are some concerns and observations:
  • The first-order AEKF is more straightforward, as it does not need pre-processing for polarization resistance and capacity determination.
  • The second-order AEKF improves SoC estimation compared to the first-order AEKF because it involves more data from the lookup table (LUT) for determining parameter values such as polarization resistance ( R 1 and R 2 ) and polarization capacitor ( C p 1 and C p 2 ) in each cycle.
  • As the number of cycles increases, so does the number of model errors; this may be controlled by adjusting the window size ( M ) variable. This applies to both sets of models.
  • M will provide a quick response detection measurement and adjust the character of the estimation to the actual value.
  • A variety of initial SoC values were also considered in the simulation to investigate the robustness of the first- and second-order AEKF models. The results show that the SoC estimation line accurately followed the SoC reference trajectory.
Through this scenario, we were able make the calculation process easier and more accurate; however, the pre-processing step for AEKF’s second-order technique requires time to acquire cycle parameter data before proceeding to the SoC estimation phase. Furthermore, more extensive research on data stream applications in the calculation and programming processes of SoC estimation compared to real applications is required so that an accuracy closer to the actual value can be calculated.

Author Contributions

Conceptualization, D.A., B.S. and P.S.P.; methodology, D.A., B.S. and P.S.P.; software, D.A.; validation, B.S. and P.S.P.; formal analysis, B.S. and P.S.P.; investigation, D.A.; resources, D.A. and E.F.; data curation, D.A.; writing—original draft preparation, D.A.; writing—review and editing, D.A. P.S.P. and E.F.; visualization, D.A.; supervision, B.S. and P.S.P.; project administration, P.S.P.; funding acquisition, P.S.P. All authors have read and agreed to the published version of the manuscript.

Funding

This research was funded by UNIVERSITAS INDONESIA, for “Hibah Publikasi Terindeks International (PUTI)” Q2 TA 2023-2024, grant number: NKB-826/UN2.RST/HKP.05.00/2023.

Data Availability Statement

Not available.

Acknowledgments

The authors would like to acknowledge the Research Center for Satellite Technology and the Research Center for Advanced Materials, National Research and Innovation Agency, for the laboratory facility.

Conflicts of Interest

The authors declare no conflict of interest.

References

  1. Aung, H.; Low, K.S.; Goh, S.T. State-of-charge estimation of lithium-ion battery using square root spherical unscented Kalman filter (Sqrt-UKFST) in nanosatellite. IEEE Trans. Power Electron. 2014, 30, 4774–4783. [Google Scholar] [CrossRef]
  2. Musgrave, G.; Larsen, A.; Sgobba, T. Safety Design for Space Systems; Butterworth-Heinemann: Oxford, UK, 2009. [Google Scholar]
  3. Wang, H.; Pourmousavi, S.A.; Soong, W.L.; Zhang, X.; Ertugrul, N. Battery and energy management system for vanadium redox flow battery: A critical review and recommendations. J. Energy Storage 2023, 58, 106384. [Google Scholar] [CrossRef]
  4. Ng, M.-F.; Zhao, J.; Yan, Q.; Conduit, G.J.; Seh, Z.W. Predicting the state of charge and health of batteries using data-driven machine learning. Nat. Mach. Intell. 2020, 2, 161–170. [Google Scholar] [CrossRef]
  5. Park, S.; Ahn, J.; Kang, T.; Park, S.; Kim, Y.; Cho, I.; Kim, J. Review of state-of-the-art battery state estimation technologies for battery management systems of stationary energy storage systems. J. Power Electron. 2020, 20, 1526–1540. [Google Scholar] [CrossRef]
  6. Anggraeni, D.; Sudiarto, B.; Subhan, A.; Chasanah, N.; Santosa, C.E.; Suryanti, D.I.; Prabowo, G.S.; Priambodo, P.S. SoC Estimation Lithium Polymer Battery Based on Equivalent Circuit Model and Extended Kalman Filter. In Proceedings of the 2022 5th Asia Conference on Energy and Electrical Engineering (ACEEE), Kuala Lumpur, Malaysia, 8–10 July 2022; pp. 118–122. [Google Scholar]
  7. Xi, Z.; Dahmardeh, M.; Xia, B.; Fu, Y.; Mi, C. Learning of battery model bias for effective state of charge estimation of lithium-ion batteries. IEEE Trans. Veh. Technol. 2019, 68, 8613–8628. [Google Scholar] [CrossRef]
  8. Lin, X.; Tang, Y.; Ren, J.; Wei, Y. State of charge estimation with the adaptive unscented Kalman filter based on an accurate equivalent circuit model. J. Energy Storage 2021, 41, 102840. [Google Scholar] [CrossRef]
  9. Oji, T.; Zhou, Y.; Ci, S.; Kang, F.; Chen, X.; Liu, X. Data-driven methods for battery soh estimation: Survey and a critical analysis. IEEE Access 2021, 9, 126903–126916. [Google Scholar] [CrossRef]
  10. Hassan, M.U.; Saha, S.; Haque, M.E.; Islam, S.; Mahmud, A.; Mendis, N. A comprehensive review of battery state of charge estimation techniques. Sustain. Energy Technol. Assess. 2022, 54, 102801. [Google Scholar] [CrossRef]
  11. Nath, A.; Mehta, R.; Gupta, R.; Bahga, S.S.; Gupta, A.; Bhasin, S. Control-Oriented Physics-Based Modeling and Observer Design for State-of-Charge Estimation of Lithium-Ion Cells for High Current Applications. IEEE Trans. Control Syst. Technol. 2022, 30, 2466–2479. [Google Scholar] [CrossRef]
  12. Li, X.; Huang, Z.; Tian, J.; Tian, Y. State-of-charge estimation tolerant of battery aging based on a physics-based model and an adaptive cubature Kalman filter. Energy 2021, 220, 119767. [Google Scholar] [CrossRef]
  13. Adaikkappan, M.; Sathiyamoorthy, N. Modeling, state of charge estimation, and charging of lithium-ion battery in electric vehicle: A review. Int. J. Energy Res. 2022, 46, 2141–2165. [Google Scholar] [CrossRef]
  14. Kazmi, S.N.A.; Ulasyar, A.; Khattak, A.; Zad, H.S. A new state of charge estimation technique of lithium-ion battery using adaptive extended Kalman filter and artificial neural network. Trans. Inst. Meas. Control 2023, 45, 747–760. [Google Scholar] [CrossRef]
  15. Vidal, C.; Malysz, P.; Kollmeyer, P.; Emadi, A. Machine learning applied to electrified vehicle battery state of charge and state of health estimation: State-of-the-art. IEEE Access 2020, 8, 52796–52814. [Google Scholar] [CrossRef]
  16. Xiong, R.; Cao, J.; Yu, Q.; He, H.; Sun, F. Critical review on the battery state of charge estimation methods for electric vehicles. IEEE Access 2017, 6, 1832–1843. [Google Scholar] [CrossRef]
  17. Yang, S.; Zhou, S.; Zhou, X.; Lu, Y.; Liu, X.; Hua, Y.; Pan, Y.; Yan, X.; Xiao, L.; Tang, X.; et al. All-climate state-of-charge estimation and equilibrium management for lithium-ion batteries based on diffusion equivalent model. J. Energy Storage 2022, 52, 104700. [Google Scholar]
  18. Naseri, F.; Schaltz, E.; Stroe, D.-I.; Gismero, A.; Farjah, E. An enhanced equivalent circuit model with real-time parameter identification for battery state-of-charge estimation. IEEE Trans. Ind. Electron. 2021, 69, 3743–3751. [Google Scholar] [CrossRef]
  19. Hidalgo-Reyes, J.; Gómez-Aguilar, J.F.; Escobar-Jiménez, R.F.; Alvarado-Martínez, V.M.; López-López, M. Classical and fractional-order modeling of equivalent electrical circuits for supercapacitors and batteries, energy management strategies for hybrid systems and methods for the state of charge estimation: A state of the art review. Microelectron. J. 2019, 85, 109–128. [Google Scholar] [CrossRef]
  20. Shi, H.; Wang, S.; Fernandez, C.; Yu, C.; Li, X.; Zou, C. Adaptive iterative working state prediction based on the double unscented transformation and dynamic functioning for unmanned aerial vehicle lithium-ion batteries. Meas. Control 2020, 53, 1760–1773. [Google Scholar] [CrossRef]
  21. Yang, S.; Zhou, S.; Hua, Y.; Zhou, X.; Liu, X.; Pan, Y.; Ling, H.; Wu, B. A parameter adaptive method for state of charge estimation of lithium-ion batteries with an improved extended Kalman filter. Sci. Rep. 2021, 11, 5805. [Google Scholar] [CrossRef]
  22. Li, K.; Zhou, F.; Chen, X.; Yang, W.; Shen, J.; Song, Z. State-of-charge estimation combination algorithm for lithium-ion batteries with Frobenius-norm-based QR decomposition modified adaptive cubature Kalman filter and H-infinity filter based on electro-thermal model. Energy 2023, 263, 125763. [Google Scholar] [CrossRef]
  23. Anggraeni, D.; Sudiarto, B.; Kurniawan, F.; Priambodo, P.S. Lithium-Ion Battery Modelling and Adaptive Extended Kalman Filter Implementation for BMS Application Software Development. Int. J. Renew. Energy Res. 2023, 13, 412–422. [Google Scholar]
  24. Su, L.; Zhou, G.; Hu, D.; Liu, Y.; Zhu, Y. Research on the state of charge of lithium-ion battery based on the fractional order model. Energies 2021, 14, 6307. [Google Scholar] [CrossRef]
  25. Xu, Y.; Hu, B.; Wu, T.; Xiao, T. Joint estimation of state of charge and state of health of lithium-ion battery based on fractional order model. J. Power Electron. 2022, 22, 318–330. [Google Scholar] [CrossRef]
  26. Zhang, Z.; Zhou, D.; Xiong, N.; Zhu, Q. Non-fragile H∞ nonlinear observer for state of charge estimation of lithium-ion battery based on a fractional-order model. Energies 2021, 14, 4771. [Google Scholar] [CrossRef]
  27. Sethia, G.; Nayak, S.K.; Majhi, S. An approach to estimate lithium-ion battery state of charge based on adaptive Lyapunov super twisting observer. IEEE Trans. Circuits Syst. I Regul. Pap. 2020, 68, 1319–1329. [Google Scholar] [CrossRef]
  28. Wang, W.; Wang, X.; Xiang, C.; Wei, C.; Zhao, Y. Unscented kalman filter-based battery SOC estimation and peak power prediction method for power distribution of hybrid electric vehicles. IEEE Access 2018, 6, 35957–35965. [Google Scholar] [CrossRef]
  29. St-Pierre, M.; Gingras, D. Comparison between the unscented Kalman filter and the extended Kalman filter for the position estimation module of an integrated navigation information system. In Proceedings of the IEEE Intelligent Vehicles Symposium, Parma, Italy, 14–17 June 2004; pp. 831–835. [Google Scholar]
  30. Jin, Y.; Su, C.; Luo, S. Improved algorithm based on AEKF for state of charge estimation of lithium-ion battery. Int. J. Automot. Technol. 2022, 23, 1003–1011. [Google Scholar] [CrossRef]
  31. Shi, N.; Chen, Z.; Niu, M.; He, Z.; Wang, Y.; Cui, J. State-of-charge estimation for the lithium-ion battery based on adaptive extended Kalman filter using improved parameter identification. J. Energy Storage 2022, 45, 103518. [Google Scholar] [CrossRef]
  32. Duan, L.; Zhang, X.; Jiang, Z.; Gong, Q.; Wang, Y.; Ao, X. State of charge estimation of lithium-ion batteries based on second-order adaptive extended Kalman filter with correspondence analysis. Energy 2023, 280, 128159. [Google Scholar] [CrossRef]
  33. Savargaonkar, M.; Oyewole, I.; Chehade, A.; Hussein, A.A. Uncorrelated Sparse Autoencoder With Long Short-Term Memory for State-of-Charge Estimations in Lithium-Ion Battery Cells. IEEE Trans. Autom. Sci. Eng. 2022, 1–12. [Google Scholar] [CrossRef]
  34. Huang, C.-S. Online Parameter Identification for Lithium-Ion Batteries: An Adaptive Moving Window Size Design Methodology for Least Square Fitting. IEEE Trans. Veh. Technol. 2023, 72, 5824–5832. [Google Scholar] [CrossRef]
  35. Candy, J.V. Model-Based Signal Processing; John Wiley & Sons: Hoboken, NJ, USA, 2005. [Google Scholar]
  36. He, Z.; Yang, Z.; Cui, X.; Li, E. A method of state-of-charge estimation for EV power lithium-ion battery using a novel adaptive extended Kalman filter. IEEE Trans. Veh. Technol. 2020, 69, 14618–14630. [Google Scholar] [CrossRef]
  37. Ren, P.; Wang, S.; He, M.; Cao, W. Novel strategy based on improved Kalman filter algorithm for state of health evaluation of hybrid electric vehicles Li-ion batteries during short-and longer term operating conditions. J. Power Electron. 2021, 21, 1190–1199. [Google Scholar] [CrossRef]
  38. Wang, S.; Takyi-Aninakwa, P.; Fan, Y.; Yu, C.; Jin, S.; Fernandez, C.; Stroe, D.-I. A novel feedback correction-adaptive Kalman filtering method for the whole-life-cycle state of charge and closed-circuit voltage prediction of lithium-ion batteries based on the second-order electrical equivalent circuit model. Int. J. Electr. Power Energy Syst. 2022, 139, 108020. [Google Scholar] [CrossRef]
  39. Amir, S.; Gulzar, M.; Tarar, M.O.; Naqvi, I.H.; Zaffar, N.A.; Pecht, M.G. Dynamic equivalent circuit model to estimate state-of-health of lithium-ion batteries. IEEE Access 2022, 10, 18279–18288. [Google Scholar] [CrossRef]
  40. Akeyo, O.M.; Rallabandi, V.; Jewell, N.; Patrick, A.; Ionel, D.M. Parameter identification for cells, modules, racks, and battery for utility-scale energy storage systems. IEEE Access 2020, 8, 215817–215826. [Google Scholar] [CrossRef]
  41. Li, B.; Bei, S. Estimation algorithm research for lithium battery SOC in electric vehicles based on adaptive unscented Kalman filter. Neural Comput. Appl. 2019, 31, 8171–8183. [Google Scholar] [CrossRef]
  42. Ge, C.; Zheng, Y.; Yu, Y. State of charge estimation of lithium-ion battery based on improved forgetting factor recursive least squares-extended Kalman filter joint algorithm. J. Energy Storage 2022, 55, 105474. [Google Scholar] [CrossRef]
  43. Okatan, A.; Hajiyev, C.; Hajiyeva, U. Fault detection in sensor information fusion Kalman filter. AEU-Int. J. Electron. Commun. 2009, 63, 762–768. [Google Scholar] [CrossRef]
  44. Devarakonda, L.; Hu, T. Effects of rest time on discharge response and equivalent circuit model for a lead-acid battery. J. Power Sour. 2015, 282, 19–27. [Google Scholar] [CrossRef]
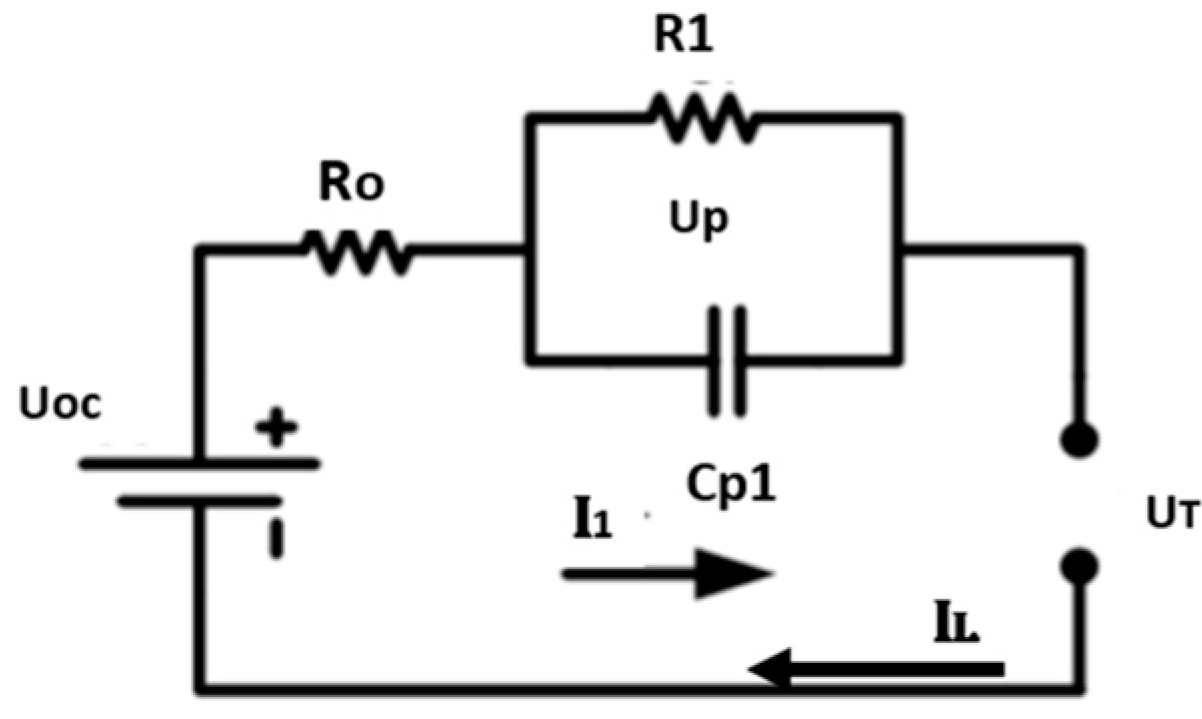
Figure 1. Equivalent 1st-order circuit model.
Wevj 14 00307 g001
Figure 2. Equivalent 2nd-order circuit model.
Wevj 14 00307 g002
Figure 3. Schematic scheme for AEKF algorithm.
Wevj 14 00307 g003
Figure 4. Lithium-ion battery’s jump-rebound feature.
Wevj 14 00307 g004
Figure 5. Flowchart of the SoC estimation with cycle and M variable.
Wevj 14 00307 g005
Figure 6. SoC estimation in specific M in cycle 1.
Wevj 14 00307 g006
Figure 7. The AEKF 1st- and 2nd-order ECM performance estimation result for (a) 1 cycle; (b) 100 cycles; (c) 200 cycles; (d) 300 cycles; (e) 400 cycles; and (f) 500 cycles.
Wevj 14 00307 g007
Figure 8. SoC estimation for the first-order AEKF accuracy over different cycles and M numbers.
Wevj 14 00307 g008
Figure 9. SoC estimation for the second-order AEKF accuracy over different cycles and M numbers.
Wevj 14 00307 g009
Figure 10. SoC estimation derived from various initial SoCs.
Wevj 14 00307 g010
Table 1. Correlation between M and RSME.
Cycle 1MRSME
1.50.25
20.33
50.88
Table 2. Parameter values for the 1st-order ECM.
Cycle R 0 (mΩ) R 1 (mΩ) C p 1 (F)
113.570.0018281.59
10014.530.0078283.98
20014.840.0177285.34
30017.850.0179285.47
40018.860.0182284.87
50019.870.0192285.51
Table 3. Parameter values for the 2nd-order ECM.
Cycle R 0 (mΩ) R 1 (mΩ) R 2 (mΩ) C p 1 (F) C p 2 (F)
1400.000430.000954651.16105.263
100410.000310.000796451.08125.313
200440.000320.000126250.0382.508
300450.000210.000429523.81532.940
4001000.000170.000349764,78294.118
5001010.000710.000227582.14447.328
Table 4. Outline of the SoC assessment of first-order AEKF and second-order ECM for different window sizes and levels of battery debasement.
Cycle M AEKF
SymbolNumber1st Order2nd Order
1M50.014.1461 × 10−31.5594 × 10⁻⁴
M40.14.4144 × 10−22.6201 × 10⁻³
M30.52.1000 × 10−11.4653 × 10⁻²
M20.83.3000 × 10−11.5782 × 10⁻²
M114.1000 × 10−11.6269 × 10⁻²
100M50.014.8718 × 10−33.5576 × 10⁻⁴
M40.14.8714 × 10−22.4692 × 10⁻³
M30.52.4000 × 10−17.3633 × 10⁻³
M20.83.9000 × 10−12.1370 × 10⁻²
M114.9000 × 10−12.6655 × 10⁻²
200M50.016.1204 × 10−34.4408 × 10⁻⁴
M40.16.1199 × 10−22.8086 × 10⁻³
M30.53.1000 × 10−19.0148 × 10⁻³
M20.84.9000 × 10−12.6287 × 10⁻²
M116.0000 × 10−13.1965 × 10⁻²
300M50.017.3740 × 10−35.2360 × 10⁻⁴
M40.17.3733 × 10−21.4435 × 10⁻²
M30.53.7000 × 10−13.2531 × 10⁻²
M20.85.9000 × 10−13.4133 × 10⁻²
M117.4000 × 10−13.5105 × 10⁻²
400M50.018.9075 × 10−32.3943 × 10⁻³
M40.18.9065 × 10−21.5727 × 10⁻²
M30.54.5000 × 10−12.4705 × 10⁻²
M20.87.1000 × 10−15.9720 × 10⁻²
M118.9000 × 10−15.9467 × 10⁻²
500M50.019.7178 × 10−35.2878 × 10⁻³
M40.19.7166 × 10−21.5698 × 10⁻²
M30.54.9000 × 10−14.2440 × 10⁻²
M20.87.2000 × 10−19.0396 × 10⁻²
M119.0000 × 10−19.1223 × 10⁻²
Disclaimer/Publisher’s Note: The statements, opinions and data contained in all publications are solely those of the individual author(s) and contributor(s) and not of MDPI and/or the editor(s). MDPI and/or the editor(s) disclaim responsibility for any injury to people or property resulting from any ideas, methods, instructions or products referred to in the content.