Article

A Study on the Formation and Distribution Mechanisms of the Demand for Shared Electric Vehicles

College of Civil Engineering and Architecture, Xinjiang University, Urumqi 830017, China
*
Author to whom correspondence should be addressed.
World Electr. Veh. J. 2023, 14(10), 285; https://doi.org/10.3390/wevj14100285
Submission received: 6 September 2023 / Revised: 3 October 2023 / Accepted: 7 October 2023 / Published: 10 October 2023

Abstract

:
With the decarbonization of the transportation sector and the diversification of travel demand, the development of shared electric vehicles has become crucial. Based on survey data of travel mode and destination of shared electric vehicles in Beijing, this paper aims to explore the formation and distribution mechanisms of the demand for shared electric vehicles. First of all, a multi-index and multi-cause (MIMIC) model was established to quantify the psychological latent variables that cannot be directly observed and to analyze the mechanisms between individual socio-demographic attributes and latent variables. Secondly, these psychological latent variables were added to mixed logit (ML) models as explanatory variables to form hybrid choice models to explore the travel mode choice behavior and travel destination choice behavior, respectively, when using shared electric vehicles for leisure travel. The results show that potential users of shared electric vehicles are characterized by higher education, employees of enterprises, no car availability and high driving years, and most of them travel for the purpose of connecting to transport hubs. Latent variables such as individual carbon trading, subjective norms, risks and behavioral intentions all affect the demand for shared electric vehicles; in-car time, out-of-car time, travel cost and the number of subway stations have negative impacts on the demand, while mall properties and the number of parking lots have positive impacts on the demand. Furthermore, the use of shared electric vehicles is highly correlated with the use of cars and subways, and part of the travel demand could be transferred to shared electric vehicles by taking certain measures.

1. Introduction

According to data from the International Energy Agency (IEA), carbon emissions from the transportation sector are a major factor causing climate change and other environmental issues. In China, the transportation sector has the fastest growing carbon emissions of all sectors, of which road transport alone accounts for more than 85% of the national transportation carbon emissions. Therefore, the promotion of electric vehicles (EVs) has become one of the most effective measures to reduce the carbon emissions of road transport by developing electrified means of transport and reducing fossil energy consumption [1]. Although the current market share of EVs is still very low, with the development of the sharing economy, shared electric vehicles (SEVs) could become an important driving force to promote the entry of EVs into the market [2,3]. Since most users of SEVs are those who do not own private cars and have purchase intention for cars, the development of SEVs can not only directly affect the car ownership rate [4,5], but also reduce the driving range and carbon emissions of fuel vehicles by switching from private cars to SEVs [6,7,8], thus promoting the sustainable development of urban transport [9,10]. However, the development of SEVs has also caused concerns about aggravating traffic congestion and reducing the rate of public transport use. In fact, the high-frequency users that SEVs will mainly target in the future are travelers during non-commuting hours, and expanding the market of SEVs will not increase the road burden [5,11]. At the same time, SEVs mostly replace suburban, off-peak hour and long-distance public transport trips, and generally form cooperative relations with public transport, taxis and non-motor vehicles [11]. SEVs still have huge development potential, especially in China, where the number of cars per thousand people is only 186 [12], far less than in the United States, Japan and other developed countries. In fact, SEVs are developing rapidly in China; as of 2019, the market size of SEVs has risen from 428 million CNY in 2016 to 5.389 billion CNY. SEVs have appeared in Beijing, Shanghai, Chongqing and other developed cities, but the existing SEVs have the phenomenon of “no car to save, no place to park”. The underlying reason is that the choice behavior related to SEVs is not fully understood. Demand forecasting fails to provide a sufficient foundation for outlet distribution and vehicle scheduling, which not only leads to low public satisfaction and loyalty to SEVs, but also leads to a promotion bottleneck. Therefore, it is necessary to conduct in-depth research on the formation and distribution mechanisms of the demand for SEVs based on choice behavior analysis.
The existing research on demand forecasting mainly applies discrete choice models on questionnaire survey data to explore the factors affecting the choice behavior related to SEVs and their influencing mechanisms. The initial stage of the study mainly explored the influence of observable variables such as individual socio-demographic attributes and travel attributes, and the main conclusions are that males are inclined to choose a shared car by changing from their existing travel modes [13,14]; SEVs are more likely to be favored by young and middle-low income groups [13,15,16], highly educated groups [17,18], as well as employees [13,19]; people who normally use public transport, online ride-hailing and bicycles generally show a preference for SEVs [16,18]; travel time and travel cost have a negative impact on the demand for SEVs [19,20]; the competitiveness of SEVs became stronger with the increase in travel distance, and the choice behavior related to SEVs is closely related to travel cost during medium and long distance trips, and to travel time in long-distance travel [19]; SEVs are often used for leisure travel or trips to areas with underdeveloped public transport [20], and the factors affecting the choice behavior for SEVs were different for different travel purposes. For example, the number of available vehicles in the family, age and education level have significant positive impacts on the choice of SEVs for shopping, while travel distance and income have significant negative impacts on the choice of SEVs during vacation [21,22].
As research continues, scholars have begun to consider the impact of difficult-to-observe psychological latent variables on the demand for SEVs. Efthymiou et al. took residents’ satisfaction with their current travel mode as a latent variable, and found that the more satisfied they were with the current travel mode, the less inclined they were to choose SEVs [16]. Hahn et al. selected compatibility as a potential variable and measured compatibility with observable items such as the attractiveness of shared cars, the awareness of use cost, and the trial-and-error ability, finding that compatibility would increase the intention to use shared cars [23]. Sun et al. investigated the use intention of Chinese college students on SEVs, focusing on the impact of perceived usefulness and perceived ease of use, and found that only the perceived usefulness of SEVs service has a significant positive impact on students’ use intention [20]. Kim et al. considered five latent variables associated with privacy-seeking, pro-environmental attitudes, symbolic value of car and driving preference, and discovered that privacy-seeking had a positive impact on the choice behavior concerning SEVs, while pro-environmental attitudes and the symbolic value of the car had negative impacts, and driving preference had no significant impact [24]. Ramos et al. revealed that control (perceived behavioral control, perceived ease of use, perceived usefulness) and subjective norms have positive effects on the demand for SEVs; driving habits have a negative impact on demand, and the impact on SEV users is greater than that on non-users; trust and climate morality only exert a certain impact on the choice behavior of partial individuals [25]. Fleury et al. introduced environment-friendly variables on the basis of the Unified Theory of Acceptance and Use of Technology (UTAUT) model and found that both effort expectation (EE) and performance expectation (PE) directly affect the demand for SEVs. These authors also found that facilitating conditions (FC) and environmental friendliness are expected to indirectly affect demand, whereas social influence (SI) has no significant influence [26]. On this basis, Vanduy et al. extended the UTAUT model and explored the influencing mechanisms of hedonic motivation (HM) and familiarity with car-sharing concept (FM) on behavioral intention (BI), finding that HM, EE, PE and FM can promote BI related to SEVs, whereas SI also has no significant effect [27]. Giovanni et al. considered the impact of environmental, social and economic factors on attitudes and found that the intention to reuse SEVs was successively affected by attitudes, subjective norms and perceived behavioral control [28].
Based on the analysis above, the key factors affecting the choice behavior related to SEVs have been extensively studied for SEV demand forecasting. However, the conclusions depend on the degree of influence of related factors, and some emerging factors that may influence choice behavior have not yet been considered at the same time. For example, some studies have found that personal carbon trading has a positive impact on the travel behavior of residents, which will promote the public to shift from high-carbon travel to low-carbon travel [29,30]. Therefore, this paper introduces psychological latent variables such as personal carbon trading, habits and attitudes to risk, that may affect the choice behavior related to SEVs and establishes a discrete choice model to explore the formation mechanism of the demand for SEVs.
The determination of the key factors affecting the choice behavior related to SEVs can provide a basis for the establishment of the demand forecasting model, so as to predict the total demand for SEVs when the total demand is far from sufficient to provide a basis for the outlet distribution and vehicle delivery in the SEV system. Therefore, it is particularly critical to explore the distribution mechanism of the demand for SEVs.
Existing studies have explored the distribution characteristics of demand for SEVs mainly through the operational data of SEVs. These studies found that the demand for SEVs varies greatly in different types of places and different time periods, among which the demand for shared cars near retail services and transport hubs is large at any time [31]; the demand at leisure and entertainment places, such as gyms and cinemas, is large on weeknights and non-workdays, whereas the demand is small during working hours [31,32]; government institutions, social institutions such as schools, libraries, churches, etc., are locations of high demand only on weekdays [31]; catering services have a large demand for shared cars during the period 12–16 h, while the demand is weak during the 16–18 h and 0–4 h periods [33].
However, the research on the demand distribution of SEVs based on operational data has some shortcomings. On the one hand, the demand is spatiotemporally dynamic; on the other hand, the operational data show only the met travel demand for SEVs, and the real demand of users cannot be determined when the supply of the SEV system is insufficient. In addition, the demand of potential users interested in SEVs is difficult to capture. In order to avoid the limitations mentioned above, it is necessary to conduct a stated preference (SP) survey and, accordingly, to explore the distribution mechanism of the demand for SEVs. It has been proved that the travel demand for SEVs is mainly for leisure and entertainment, commuting and connecting transport hubs [32,34]. Since the starting and ending points of travel for commuting and connecting transport hubs are fixed, and the freedom of travel for leisure and entertainment is relatively large, this paper considers travel for leisure and entertainment to explore the distribution mechanism of demand for SEVs.
Therefore, in the era of low-carbon transportation and diversified travel demand, this paper surveys individuals’ psychological latent attitudes toward SEVs, travel mode and travel destination choice behavior through online questionnaires, and then explores the formation and distribution mechanisms of demand for SEVs by constructing discrete choice models considering psychological latent variables. In view of the problem that psychological latent variables are not fully considered in the research on the choice behavior related to SEVs, this paper constructs a discrete choice model to explore the key factors affecting the choice behavior towards SEVs by considering psychological latent variables, such as personal carbon trading, habits and risks. Thus, revealing the internal mechanism of this choice behavior can provide the basis for formulating corresponding measures to improve the public’s trust and loyalty in SEVs. Considering the lack of research on the distribution mechanism of demand for SEVs, this paper models the destination choice behavior in relation to SEVs for leisure and entertainment travel by constructing a discrete choice model considering the influence of psychological latent variables and the attributes of the travel destination. This model reveals the distribution mechanism of demand for SEVs, which can be the basis for SEV enterprises to distribute outlets and configure vehicles in advance.
The remainder of this paper is organized as follows: Section 2 introduces the experimental design and data collection; Section 3 provides the theoretical basis and construction of the models; Section 4 analyzes the model results according to parameter estimation; and Section 5 discusses the findings, formulates suggestions and evaluates the future prospects.

2. Data

2.1. Experimental Design

As an innovative transport mode targeting all potential users, SP surveys are frequently used to measure individuals’ travel choice behavior towards SEVs. All the respondents are required to indicate choices under different hypothetical scenarios. According to the needs of the research, a three-part questionnaire was designed based on the existing relevant research. The first part collects the socio-demographic characteristics and psychological attributes of the respondents, among which the psychological attributes comprise perceptual behavioral control (PBC), subjective norms (SN), attitudes (ATT), personal carbon trading (PCT), habits (HAB), risk (FX) and intention (INT). In addition, a five-point Likert Scale is commonly used to measure the observed indicators of the latent variables, and respondents are asked to rate how strongly they agree with each of the items on a scale of 1–5 from strongly disagree to strongly agree. The second and third parts of the questionnaire comprise the stated preference experiments. The second part relates to the choice of travel mode, requiring travelers to choose from SEV, bus, subway or car (private car/taxi) given the specified in-car time, out-of-car time, travel cost and travel purpose. The third part concerns the choice of recreational travel destination, requiring travelers to choose from A (small malls with rich supporting resources), B (medium-sized malls with rich supporting resources), and C (large malls with less rich supporting resources), considering the mall attributes, the number of parking lots, bus lines and subway stations. The above attributes and their level values are shown in Table 1 and Table 2, respectively.

2.2. Data Collection and Statistics

In February 2022, data on the choice behavior concerning SEVs in Beijing were collected in the form of an online questionnaire. A total of 784 questionnaires were issued and recovered, of which 768 were valid, with an effective response rate of 98%. The sample characteristics are shown in Table 3. Compared with the statistical data of the Beijing Yearbook 2021 [35], there is no apparent difference in the gender distribution. On the whole, the sample is younger with higher education levels, and the majority are immigrants. Furthermore, most of participants have middle- and low-income, have no car availability, frequently travel by public transport, have driving experience over one year and are employees of enterprises. These characteristics are in accordance with those of users and potential users of SEVs [36,37].

2.3. Data Verification

In order to ensure the validity of the subsequent modeling analysis and with particular concerned about whether the indicators can reflect the psychology of respondents, this paper verifies the data for the latent variables by two approaches. Firstly, Cronbach’s alpha coefficient and the Kaiser–Meyer–Olkin (KMO) value are used for reliability and validity analysis, both of which are greater than 0.5, indicating good reliability and validity. Secondly, confirmatory factor analysis (CFA) is used to check the rationality of the latent variable measurement items. A composite reliability (CR) greater than 0.7 and average variance extracted (AVE) greater than 0.5 were obtained for these test criteria. As can be seen from Table 4, except for the CR and AVE of PBC, which are slightly lower than the standard, all items pass the test, indicating that overall, the questionnaire data have further analytical value.

3. Modeling

3.1. MIMIC Model

Since psychological latent variables are not directly observed and difficult to be quantified, the multi-index and multi-cause model (MIMIC) is used to quantify the effects of latent variables on residents’ travel choice behavior. The MIMIC model consists of two parts: the multi-index model conducts CFA on latent variables through measurement equations, and the multi-cause model explores the impact of socio-demographic attributes on latent variables through structural equations. The models are described in Equations (1) and (2).
Y = η + ν , ν ~ N ( 0 , σ 1 )
where Y is the observed variable, η is the latent variable, is the factor loading coefficient, and v is the error term, which follows the multivariate normal distribution.
η = Z X + δ , δ ~ N ( 0 , σ 2 )
where X is the cause variable, such as gender or age; Z is the regression coefficient; and δ is the error term, which follows the multivariate normal distribution.
The model parameters are estimated by using the maximum likelihood method, and the estimation results of the measurement equation and structural equation are shown in Table 5 and Table 6, respectively. The standardized factor loading coefficient is taken as the weight coefficient of each observed indicator, and then the adaptation formula of each latent variable is obtained.

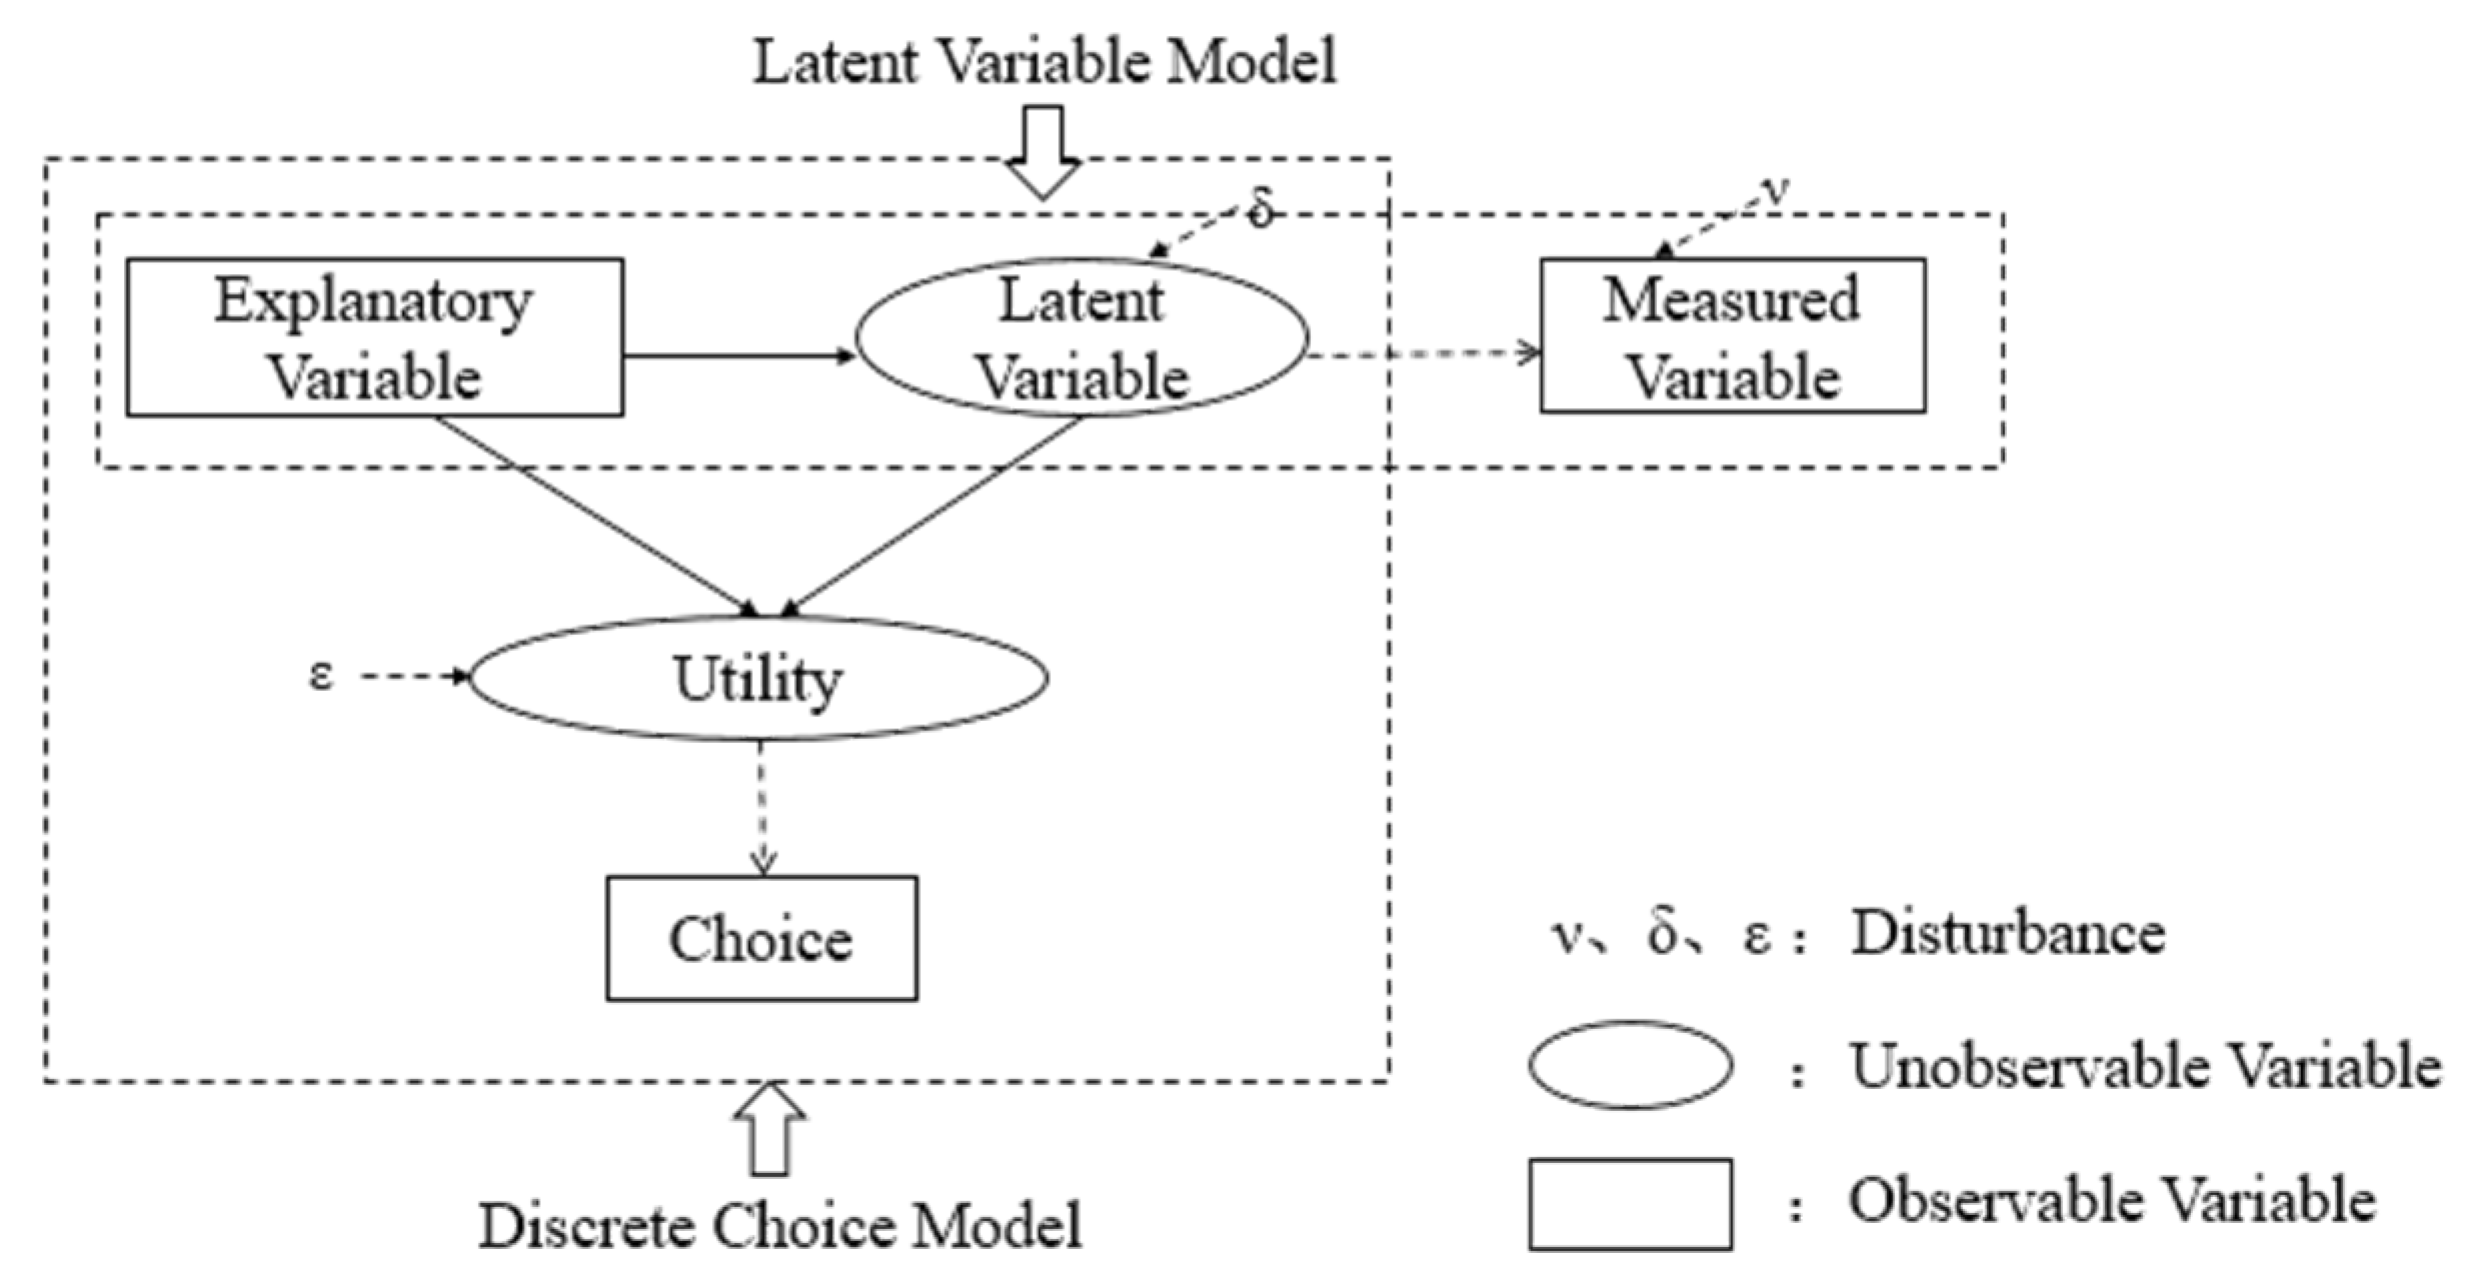
3.2. Hybrid Choice Model

In the field of travel behavior analysis, it is the basic method and research frontier to explore travel behavior through discrete choice models [38,39], which are based on the theory of random utility maximization, that is, travelers always choose the option that maximizes their own utility. The utility function is normally demonstrated in a linear form, as shown in Equation (3).
U n i = V n i + ε n i = β 1 x n 1 + β 2 x n 2 + β 3 x n 3 + ... + β k x n k + ... + ε n i = β X n i + ε n i
where U n i is the utility of individual n choosing alternative i ; V n i is a fixed term of the utility function; ε n i is a random term of the utility function; X n i is a vector of variables related to alternative i that varies between individuals, such as age, education, PBC, SN, etc.; and β is a vector of coefficients of these variables.
The Multinomial Logit (MNL) model is the most basic model among discrete choice models [18]. It is widely used due to its advantages of simple parameter estimation, good robustness and low error rate. It assumes that the random term follows the independent Gumbel distribution and that the vector β to be estimated is a fixed value. The probability that individual n will choose alternative i from the set of alternatives J is given by Equation (4).
P n i = exp ( β X n i ) j = 1 J β X n j
However, the MNL model has two defects: Firstly, the independence assumption leads to ignoring the influence of the interaction between travel modes on the choice behavior. The second defect is that the fixed value of β indicates that different individuals have the same preference for travel modes, failing to consider the heterogeneity among different individuals, which is obviously not in line with the actual situation. Therefore, the mixed logit (ML) model, which effectively considers individual heterogeneity, has gradually replaced the MNL model for analyzing travel choice behavior [40,41]. The utility random term of the ML model can be neither independent nor distributed differently, and the vector β to be estimated is considered to be a random variable, which can follow a normal distribution, lognormal distribution, uniform distribution, etc., and thus, the ML model clearly express the preference degree of different individuals. The probability that individual n will choose alternative i can be regarded as the weighted average of the probabilities of MNL, as shown in Equation (5).
P n i = exp ( β i X n i ) j = 1 J exp ( β j X n j ) f ( β / θ ) d β
where f ( β / θ ) is a probability density function, which determines the weight coefficient; and θ is an unknown parameter of the probability density function; for example, if the function is normally distributed, θ refers to the mean value and variance of the function, which can be estimated by the maximum likelihood method.
The traditional discrete choice model regards psychological factors and other unobservable factors as random terms, which cannot reflect an individual’s decision-making process and internal mechanism. However, it has been demonstrated that the hybrid choice model, in which psychological latent variables are introduced into the traditional discrete selection model as explanatory variables, can improve the explanatory power and prediction accuracy of the model [20,24]. Therefore, this paper adopts the continuous two-stage method to construct a hybrid choice model to explore the internal psychology of residents on the choice decision of SEVs, and the basic framework of the hybrid choice model is shown in Figure 1. The first stage is to build a MIMIC model to calculate the adaptive value of each latent variable, as shown in Section 3.1. In the second stage, the adaptive values are substituted into the ML model as explanatory variables to perform parameter estimation, beginning with a comprehensive model including socio-demographic variables, latent variables and alternative specific variables. All the variables are tested by iteratively eliminating the parameter with the highest p-value, and the process finishes when there are only significant parameters left. To further verify the excellence of the hybrid choice model, the Akaike Information Criterion (AIC) and Bayesian Information Criterion (BIC) can be used to judge the overall goodness-of-fit of the model, namely, the smaller the value, the better the fitting effect of the model.

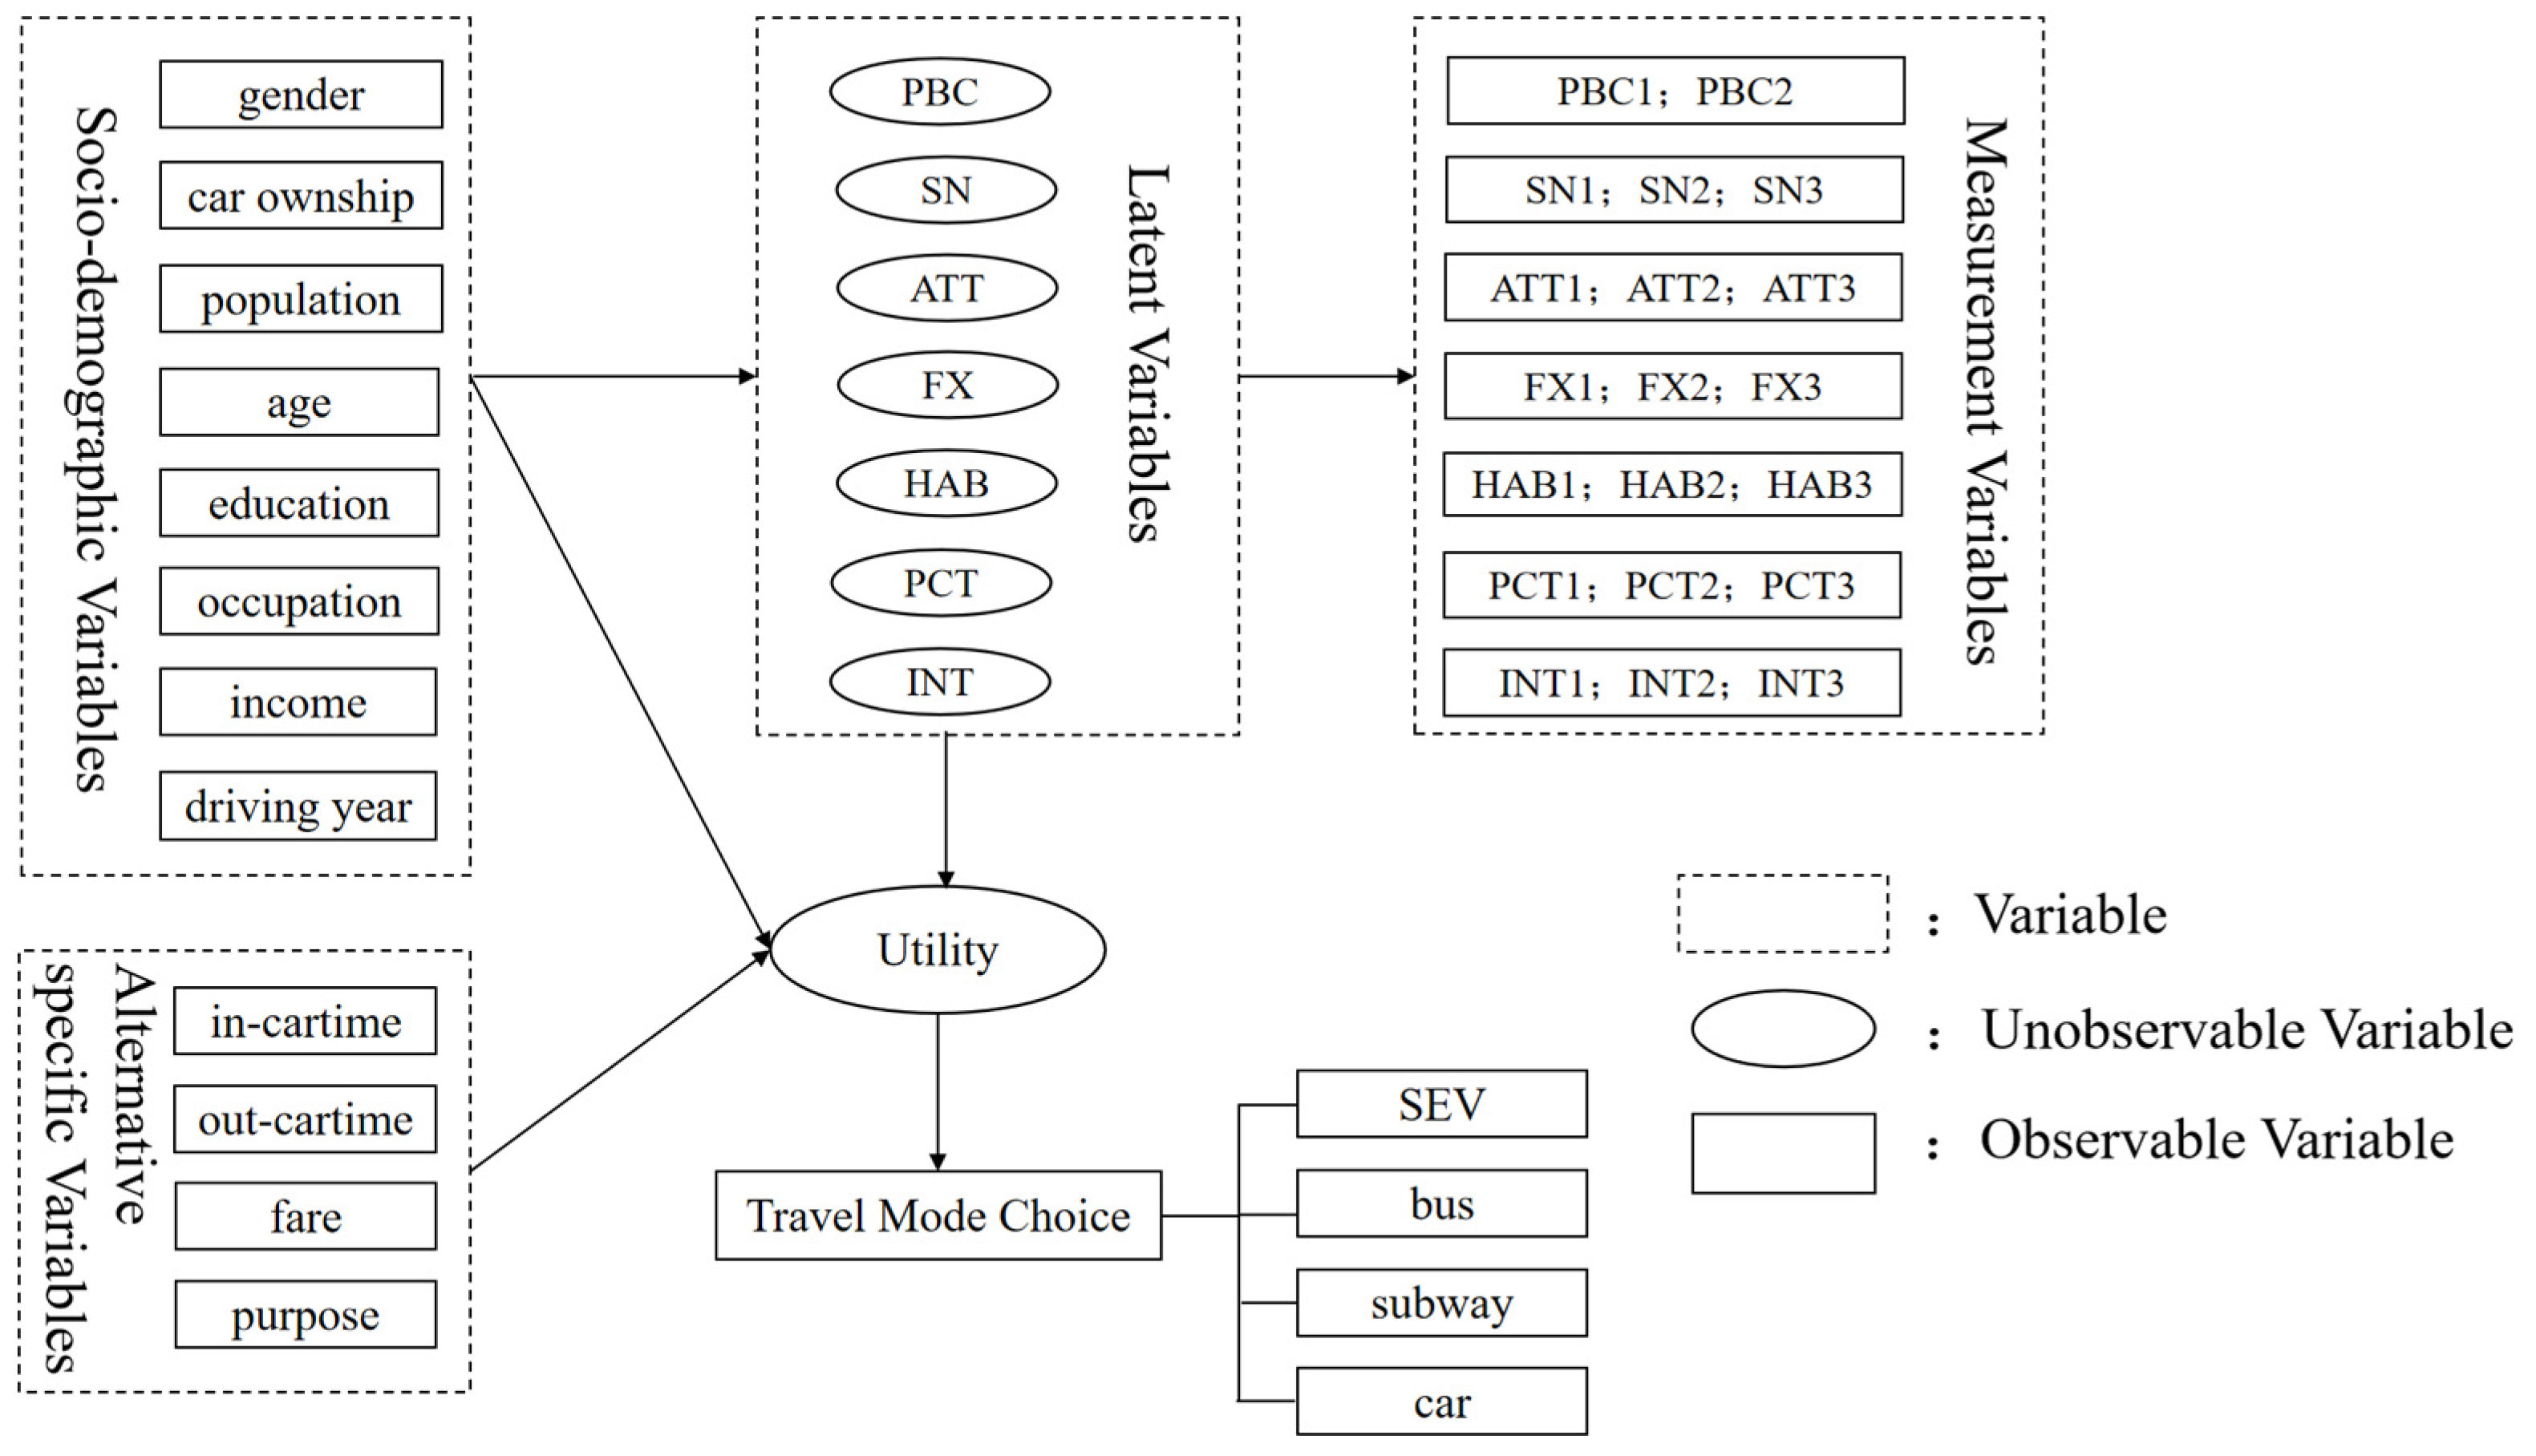
3.2.1. Hybrid Choice Model for Travel Mode Choice

The framework of the hybrid choice model for travel mode choice is illustrated in detail in Figure 2.
In order to verify the validity of the hybrid choice model, this paper establishes a hybrid choice model and mixed logit model without latent variables to compare them. Both models take bus as a reference while the other alternatives are set as random variables, and the parameter estimation results of the models are shown in Table 7. It can be seen that compared with the mixed logit model, the AIC and BIC values of the hybrid choice model are smaller, indicating that the overall goodness-of-fit of the hybrid choice model is better.

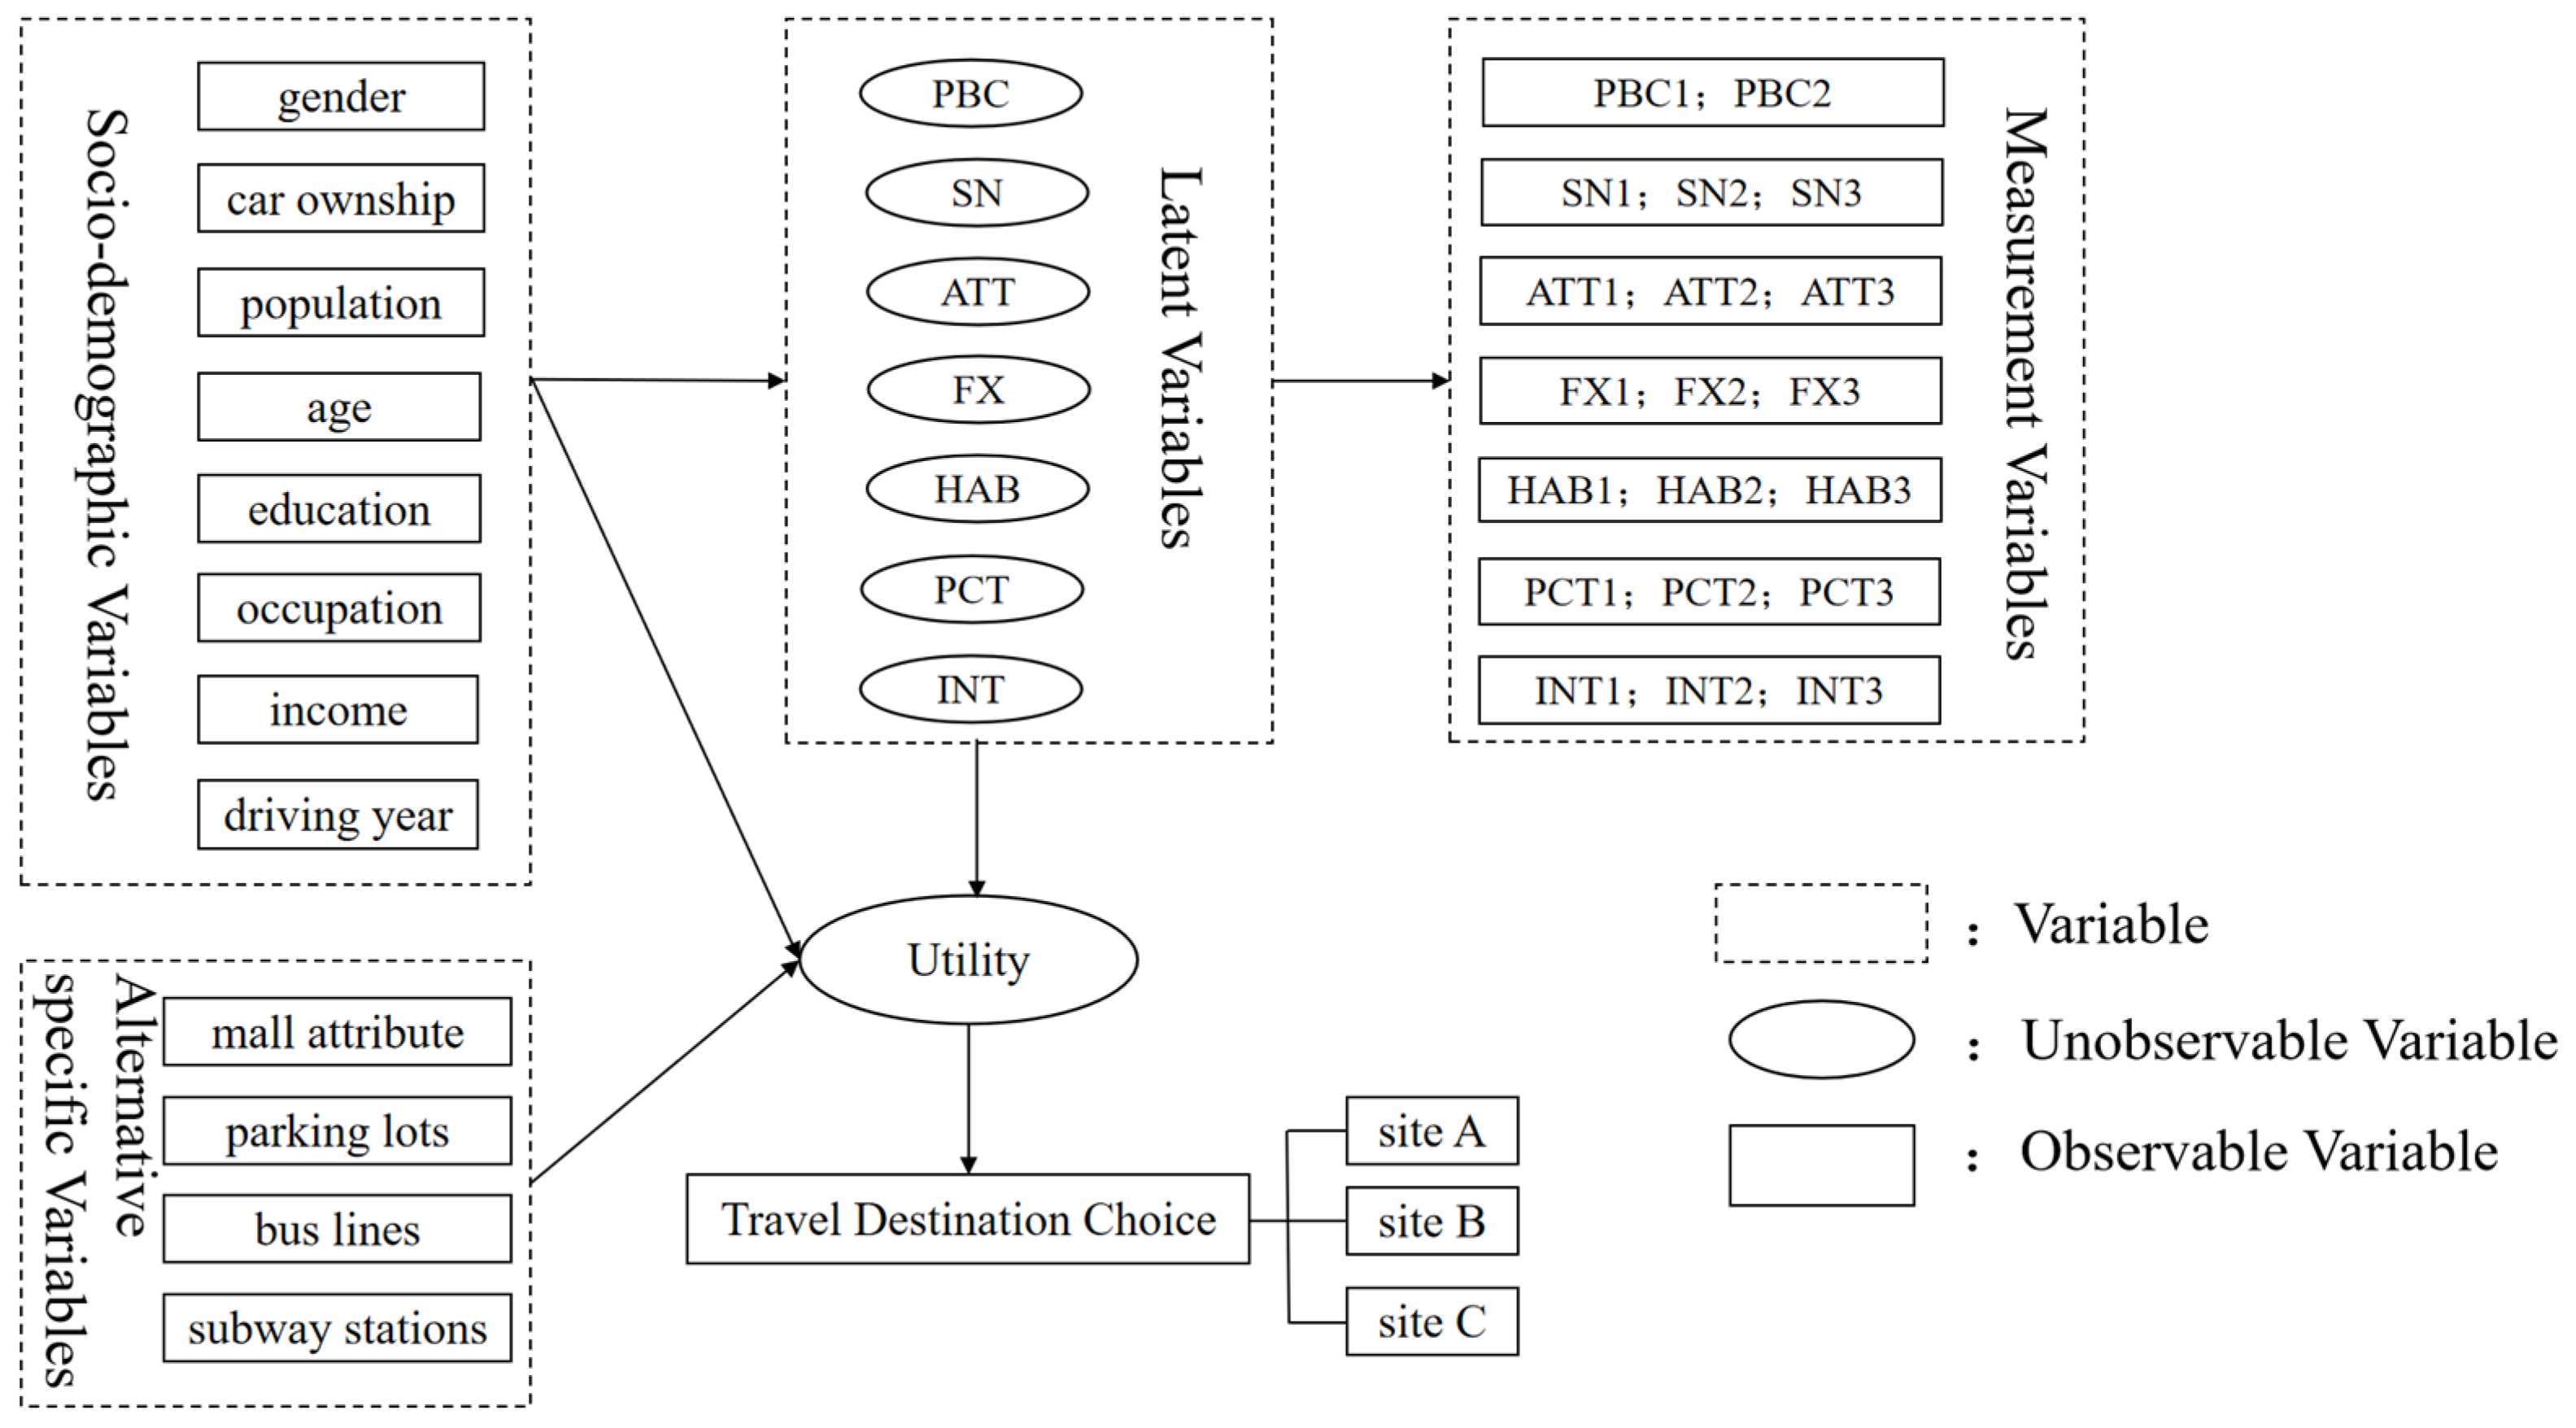
3.2.2. Hybrid Choice Model for Travel Destination Choice

Taking SEVs for leisure and entertainment as the research scenario, the hybrid choice model for travel destination choice is constructed by combining the adaptation values of latent variables and travel destination attributes as explanatory variables. The framework can be seen in Figure 3.
To model the travel mode choice, a hybrid choice model and mixed logit model without latent variables are established to study the travel destination choice. Both models take Category B destination as a reference and mall attributes, the number of parking lots and subway stations are set as random variables. The parameter estimation results of the models are shown in Table 8. It can be seen that the AIC and BIC values of the hybrid choice model are less than those of the mixed logit model, which again verifies the better overall goodness-of-fit of the hybrid choice model.

4. Results and Discussion

4.1. The MIMIC Model

The MIMIC model established in Section 3.1 not only quantifies the psychological latent variables, but also reveals the mechanism of interaction between the socio-demographic attributes and psychological latent variables. Table 6 demonstrates that gender, age, education, car ownership, driving years, occupation and common travel mode have great influence on each latent variable.
Gender has significant effects on PBC, SN, HAB, PCT and INT, indicating that women have a more accurate understanding of whether they could complete travel, which is in accordance with previous findings that women express greater perceived value [41]. Meanwhile, their behavior is easily influenced by social stress, travel habits and PCT policies. Age has a positive effect on INT, that is to say, older people have stronger intentions than younger people to switch from other travel modes to SEVs, which is consistent with the study by Kim [42]. Education has positive effects on all latent variables except ATT. The group without a private car has stronger perceptual behavioral control, which is related to the group’s greater opportunities to use SEVs, while the group with a private car holds a positive attitude toward SEVs. Driving years has a positive effect on PBC, ATT, FX and PCT. Compared with employees of enterprises, the self-employed, civil servants and students have stronger perceptual behavioral control, indicating that they can more clearly perceive the difficulty of the process of using SEVs. Those who often travel by private car, subway, taxi/online car-hailing have weaker intentions.

4.2. Hybrid Choice Model for Travel Mode Choice

The hybrid choice model for travel mode choice established in Section 3.2.1 explores the influence of socio-demographic attributes, latent variables and alternative specific attributes on travel mode choice behavior, so as to reveal the formation mechanism of the demand for SEVs.
The results in Table 7 demonstrate that education, occupation, age, car ownership, driving years and common travel mode all have a non-negligible influence on the travel mode choice behavior towards SEVs. The group with a junior high school education or below, a private car and a senior age are not inclined to choose SEVs for travel. The possible reasons are as follows: the group with a lower level education is less receptive to new things; car-owning groups have fewer opportunities to use SEVs and believe that private cars are more comfortable than SEVs, which is obviously in line with the research results that higher vehicle ownership adversely affects the demand for shared cars [43]; and older people pay more attention to the economy of travel, with free bus and dedicated bus seats causing most of the elderly to choose bus travel. Public officials, employees of enterprises and people with high driving years have preferences for SEVs. It may be that employees of enterprises choose SEVs to meet work-related travel activities such as commuting and business trips [13,44]. Some companies have business cooperation with sharing enterprises, and the price of internal employees using SEVs is relatively favorable. The longer the driving experience, the more familiar the individual is with operating the car and the higher the demand for travel flexibility.
Subjective norms, attitudes, habits and intentions all have positive impacts on the choice behavior concerning SEVs, indicating that the more susceptible individuals are to the influence of social expectations and pressures, the more positive their evaluation of SEVs, the stronger their intention to use them, and the more inclined they are to choose SEVs for travel. At the same time, people subjectively think that the commonly used travel mode is more convenient, and the choice behavior is also affected by the travel habit preference [45].
Regarding alternative specific attributes, as expected and in line with common sense, in-car time, out-car time and travel cost all have significant negative effects on the choice behavior concerning SEVs, that is, an increase in time and cost reduces an individual’s preference for SEVs [20,24]. In addition, travel purpose also affects the choice behavior concerning SEVs. When residents shuttle to subway stations, airports, high-speed rail stations and other transport hubs, they are more inclined to choose SEVs, which may be because SEVs can reduce the need to look for parking spaces for private cars near stations, and especially at airports and high-speed rail stations.
The standard deviation of each random variable is statistically significant, indicating that there are substantial variations across individuals in their travel mode choice of SEV, bus, subway and car. According to Table 7, the residents’ choice of car shows the largest difference, followed by subway, and the choice of SEV has the smallest difference. It may be that as traditional travel modes, cars and subways have a higher travel sharing rate and involve groups of different ages, occupations and education levels, while as an emerging travel mode, SEVs have a lower market share, and most users are young people, employees of enterprises, groups with higher education and people without cars, so there is little difference in the choice behavior related to SEVs. Furthermore, the covariances between random variables are also statistically significant, indicating that there are correlations between different travel modes. The high correlation between SEV and car is exciting because SEV users are time- and cost-sensitive, which is greatly affected by car ownership, as discussed previously. Thus, reducing the use cost or reducing travel time through reasonable distribution of outlets are possible measures to increase the attractiveness of SEVs. Therefore, it could be concluded that it is possible to encourage users who are used to using cars to choose SEVs by offering effective measures, which is consistent with the conclusions of previous studies [27,40].

4.3. Hybrid Choice Model for Travel Destination Choice

The hybrid choice model for travel destination choice established in Section 3.2.2 explores the influence of socio-demographic attributes, latent variables and site-specific attributes on travel destination choice behavior, so as to reveal the distribution mechanism of the demand for SEVs in the context of leisure and entertainment travel.
Table 8 demonstrates that age, occupation, education, income, car ownership and driving years all have significant effects on the travel destination choice behavior for SEVs. The specific influencing mechanisms are as follows: Compared with Category B malls, 18–50-year-olds without private cars tend to use SEVs to commute to Category A malls, possibly because Category A malls are mostly located in the city center and the travel distance to Category A malls is shorter, which can reduce the driving risk and range anxiety. Groups with private cars and high-level driving years are more inclined to choose Category C malls, which may be because Category C malls are usually located in remote regions, and sufficient parking lots around malls provide convenience for the parking of SEVs, which is also in line with the characteristic that SEVs mainly serve medium and long distance travel [19].
Similarly, the latent variables have significant impacts on diverse travel destination choice, among which risk, subjective norms and behavioral intentions have positive impacts on the demand for SEVs in Category A malls. This may be because Category A malls are mostly located in the city center, and developed public transport and shorter travel distances reduce users’ risk perception of emerging transport modes, thus enhancing the acceptance intention of SEVs. Perceived behavioral control has a positive impact on the demand for SEVs in Category C malls. This may be because the group with stronger perceptual behavioral control has a clearer awareness about using SEVs to complete long-distance travel, and the convenient parking conditions around Category C malls are also more attractive to them. Personal carbon trading restrains the demand for SEVs in Categories A and C malls. It may be that for Category A malls with developed public transport, walking or public transport is obviously more low-carbon and environment-friendly than SEVs; for Category C malls with inconvenient public transport, the implementation of personal carbon trading policy will directly affect the use of cars for travel to these malls.
The mall attributes and the number of parking lots positively affect the travel destination choice behavior, that is, the greater the number of parking lots and the more diversified service items in malls, the higher the demand for SEVs, indicating that the public is more inclined to use SEVs to travel to malls with convenient parking and diversified leisure and entertainment facilities. While the number of subway stations has a negative impact on destination choice behavior, that is, the more subway stations, the less inclined people are to use SEVs for travel, indicating that there is a certain competitive relationship between subways and SEVs, which is consistent with the conclusions of previous studies [40]. The effect of the number of bus lines is not significant, which may be related to the fact that residents do not choose buses with poor comfort when traveling for leisure.
The standard deviation of each destination-specific attribute is also statistically significant, indicating that individuals have different preferences for the destination attributes. As shown in Table 8, residents have the largest difference in preference for the number of subway stations near the mall, followed by the mall attributes, and the preference difference related to the number of parking lots is the least. It may be that the subway, as the main travel mode in the city, has a wide patronage, so its preference difference is the largest. While a sufficient number of parking lots is a necessary condition for the development of SEVs, the preference difference is small. Table 8 also shows that there is a correlation between mall attributes and the number of parking lots. The more diversified the service features of the mall, the more abundant the parking resources it should be equipped with. There is also a certain correlation between mall attributes and the number of subway stations: a large mall with diversified entertainment facilities should be equipped with a developed subway network to meet the travel needs of a larger number of customers. Due to the cost and resource constraints and the planning and construction period, it is difficult to complete the construction of subway networks to meet the travel needs of large malls in a short period of time. SEVs can be used as a transition mode to meet the travel demand of large passenger flows. In addition, there is no significant relationship between the number of parking lots and the number of subway stations, which may be because they represent two different types of travel modes, of which parking lots mainly serve car travelers, while subways mainly serve public transport travelers.
To sum up, the choice intention and choice behavior related to SEVs are affected by many factors, and the comparison of results of parameter significance between previous studies and our study (see Table 9 for details) shows that most of the variables that are significant in our study were significant in other studies.

5. Conclusions

In the era of social resource sharing, low-carbon transportation and diversified travel demand, SEVs as a low-carbon and flexible travel mode should be vigorously developed. The demand formation and distribution mechanisms of SEVs are the basis for a reasonable distribution of destinations. Therefore, this study firstly quantifies the psychological latent variables such as personal carbon trading, habit and risk, that influence the choice behavior towards SEVs. We construct a MIMIC model to analyze the mechanism between individual socio-demographic attributes and latent variables. It was found that gender, driving years, occupation, car ownership and common travel mode have great impacts on the latent variables. Secondly, by integrating the quantified latent variables into the ML model, the hybrid choice models are constructed to analyze the travel mode choice behavior and the travel destination choice behavior related to SEVs. Finally, we reveal the demand formation and distribution mechanisms of SEVs, and on the basis of the above research, the following main conclusions and relevant suggestions are given for developing SEVs in developing countries.
The travel mode choice model reveals the formation mechanism of the demand for SEVs. The primary factors include in-car time, out-of-car time, travel cost and travel purpose, etc. Among these, time, cost and demand show a negative growth relationship, that is, reducing the time and cost spent on travel could promote the growth of demand. The in-car time is mainly affected by SEVs’ performance and road accessibility, which is difficult to improve in a short period of time. To reduce the out-car time, sharing enterprises should ensure a reasonable distribution of outlets and release SEVs in accordance with demand distribution, thus reducing waiting times, shortening walking distances and improving vehicle utilization rates. To reduce the travel cost, the government should provide special land planning or subsidies for the site selection of sharing enterprises to reduce the operational cost of enterprises. There is a large demand for SEVs when going to/leaving transport hubs; thus, enterprises could deploy stations in subway stations, railway stations, airports and other important public transport stations to increase the market share of SEVs. At the same time, research illustrates that psychological latent variables such as subjective norms, attitudes, habits and behavioral intentions can promote the demand for SEVs, and along with the improvement of sharing service quality, residents’ psychological perception of SEVs can be improved [47]. In addition, the study finds that residents who often use private cars/taxis tend to choose cars instead of subways, and it has been observed that people who are accustomed to using private transport have a strong preference for cars. Thus, it is extremely hard to directly transfer them to public transport. As demonstrated by the correlation between SEV and car use, as well as with subway use, SEVs may become a transitional approach to improving their effectiveness by attracting car and subway trips to SEVs. This could reduce both the travel frequency of private cars and the utilization rate of fuel vehicles, as well as distribute some redundant passenger flow to subways, promoting the formation of sustainable transport.
The distribution mechanism of demand for SEVs was revealed by the model of travel destination choice for SEVs. The fundamental factors include personal carbon trading, mall attributes and the number of parking lots and subway stations. As SEVs become more attractive due to their increased utility, some restrictions on private cars should be implemented at the same time to avoid the diversion of demand from public transport. Personal carbon trading will reduce the demand for high-carbon travel. Public transport or walking will tend to be chosen for short-distance travel, while long-distance travel will be avoided as much as possible. Therefore, the government could consider implementing personal carbon trading policies through low-carbon travel benefits and high-carbon travel penalties to promote SEVs, thus encouraging residents to travel using low-carbon travel modes and form a favorable social atmosphere for carbon emission reduction. The richer the functions of the mall and the more parking lots there are, the more the demand for SEVs can be promoted, while the number of subway stations has an inhibitory effect. Therefore, different types of malls can be equipped with different public transport and parking resources. For large malls located in remote areas with diversified leisure and entertainment facilities, SEV stations can be added nearby and combined with the subway network to meet a large number of medium- or long-distance and diversified leisure and entertainment travel needs. For small- and medium-sized malls located in the center of the city and lacking in land resources, the government can help enterprises convert some parking space into SEV stations, so as to meet the travel needs of residents without cars while restricting some private cars.
A positive feature of this paper is the hybrid choice model that combines psychological latent variables. Thus the demand for SEVs in developing countries can be obtained from a stated preference survey. However, several limitations should be noted. First of all, the formation and distribution mechanisms of the demand for SEVs are explored in-depth from a spatial perspective, which can provide the corresponding foundation for outlet distribution. However, it is worth pointing out that the demand for SEVs is not considered from a time perspective. The spatiotemporal distribution mechanism of demand can be explored in future studies to provide relevant recommendations guiding vehicle scheduling. Second, this paper mainly explores the destination choice behavior related to SEVs when traveling for leisure and entertainment. Wang et al. point out that if the residential community were equipped with convenient SEV services, most residents would be willing to change their travel mode and reduce the use of private cars [46]. The follow-up research cannot be limited to the places that are frequently used to set up shared sites, such as leisure and entertainment destinations and transport hubs. Future research should also explore whether community sites can break through the development dilemma faced by SEVs and how to reasonably distribute sites. Last but not least, the correlation analysis shows that there is a certain correlation among SEV, subway and car use. In future research, there should be comprehensive and in-depth investigation of two aspects: one is to explore the individual behavioral transfer mechanism among the three modes; the other is to promote the sustainable development of transportation through the coordinated development of the three modes from the perspective of transportation systems.

Author Contributions

Conceptualization, X.S. and F.W.; methodology, Y.F. and F.W.; software, Y.F. and F.W.; investigation, X.S., F.W. and Y.F.; data curation, X.S. and Y.F.; writing—original draft preparation, X.S. and F.W.; writing—review and editing, Y.F. All authors have read and agreed to the published version of the manuscript.

Funding

This work was supported by the National Natural Science Foundation of Xinjiang Uygur Autonomous Region (2021D01C104).

Data Availability Statement

Not applicable.

Acknowledgments

We are grateful for the support from the Science and Technology Department of Xinjiang Uygur Autonomous Region and Xinjiang University.

Conflicts of Interest

The authors declare no conflict of interest.

References

  1. Jung, J.; Yeo, S.; Lee, Y.; Moon, S.; Lee, D.-J. Factors affecting consumers’ preferences for electric vehicle: A Korean case. Res. Transp. Bus. Manag. 2021, 41, 100666. [Google Scholar] [CrossRef]
  2. Schlueter, J.; Weyer, J. Car sharing as a means to raise acceptance of electric vehicles: An empirical study on regime change in automobility. Transp. Res. Traffic Psychol. Behav. 2019, 60, 185–201. [Google Scholar] [CrossRef]
  3. Luna, T.F.; Uriona-Maldonado, M.; Silva, M.E.; Vaz, C.R. The influence of e-carsharing schemes on electric vehicle adoption and carbon emissions: An emerging economy study. Transp. Res. Transp. Environ. 2020, 79, 102226. [Google Scholar] [CrossRef]
  4. Lempert, R.; Zhao, J.; Dowlatabadi, H. Convenience, savings, or lifestyle? Distinct motivations and travel patterns of One-way and two-way carsharing members in Vancouver. Transp. Res. Transp. Environ. 2019, 71, 141–152. [Google Scholar] [CrossRef]
  5. Henrik, B.; Francesco, C.; Axhausen, K.W. Measuring the car ownership impact of free-floating car-sharing—A case study in Basel, Switzerland. Transp. Res. Transp. Environ. 2018, 65, 51–62. [Google Scholar]
  6. Nijland, H.; Meerkerk, J.V. Mobility and environmental impacts of car sharing in the Netherlands. Environ. Innov. Soc. Transit. 2017, 23, 84–91. [Google Scholar] [CrossRef]
  7. Vine, S.L.; Polak, J. The impact of free-floating carsharing on car ownership: Early-stage findings from London. Transp. Policy 2019, 75, 119–127. [Google Scholar] [CrossRef]
  8. Fromm, H.; Ewald, L.; Frankenhauser, D.; Ensslen, A.; Jochem, P. A Study on Free-floating Carsharing in Europe: Impacts of car2go and DriveNow on modal shift, vehicle ownership, vehicle kilometers traveled, and CO2 emissions in 11 European cities. Work. Pap. Ser. Prod. Energy 2019, 36, 20–22. [Google Scholar]
  9. Matheys, J.; Sergeant, N.; Timmermans, J.-M.; Boureima, F.-S.; Wynen, V.; Van Mierlo, J. Potential reductions of CO2 emissions due to the landside accessibility of Brussels Airport through adapted policy measures and use of electric vehicles. World Electr. Veh. J. 2009, 3, 79–92. [Google Scholar] [CrossRef]
  10. Liu, X.; Zhao, F.; Hao, H.; Liu, Z. Opportunities, Challenges and Strategies for Developing Electric Vehicle Energy Storage Systems under the Carbon Neutrality Goal. World Electr. Veh. J. 2023, 14, 170. [Google Scholar] [CrossRef]
  11. Javanmardi, E.; Hoque, M.; Tauheed, A.; Umar, M. Evaluating the Factors Affecting Electric Vehicles Adoption Considering the Sustainable Development Level. World Electr. Veh. J. 2023, 14, 120. [Google Scholar] [CrossRef]
  12. NBSC. Statistical Communiqué of the People’s Republic of China on the 2021 National Economic and Social Development. Available online: http://www.stats.gov.cn/english/PressRelease/202202/t20220227_1827963.html (accessed on 10 September 2023).
  13. Riccardo, C.; Marco, D. Substitution and complementarity patterns between traditional transport means and car sharing: A person and trip level analysis. Transportation 2021, 48, 1523–1540. [Google Scholar]
  14. Acheampong, R.A.; Alhassan, S. Modelling the determinants of car-sharing adoption intentions among young adults: The role of attitude, perceived benefits, travel expectations and socio-demographic factors. Transportation 2020, 47, 2557–2580. [Google Scholar] [CrossRef]
  15. Ehsan, A.; Marco, D. A review of the socio-demographic characteristics affecting the demand for different car-sharing operational schemes. Transp. Res. Interdiscip. Perspect. 2022, 14, 100616. [Google Scholar]
  16. Efthymiou, D.; Antoniou, C. Modeling the propensity to join carsharing using hybrid choice models and mixed survey data. Transp. Policy 2016, 51, 143–149. [Google Scholar] [CrossRef]
  17. Shaheen, S.; Martin, E.P.; Bansal, A. Peer-To-Peer (P2P) Carsharing: Understanding Early Markets, Social Dynamics, and Behavioral Impacts; University of California: Oakland, CA, USA, 2018. [Google Scholar]
  18. Wang, N.; Yan, R. Research on Consumers’ Use Willingness and Opinions of Electric Vehicle Sharing: An Empirical Study in Shanghai. Sustainability 2016, 8, 7. [Google Scholar] [CrossRef]
  19. Li, W.; Kamargianni, M. Steering short-term demand for car-sharing: A mode choice and policy impact analysis by trip distance. Transportation 2020, 47, 2233–2265. [Google Scholar] [CrossRef]
  20. Sun, S.; Liu, Y.; Yao, Y.; Duan, Z.; Wang, X. The Determinants to Promote College Students’ Use of Car-Sharing: An Empirical Study at Dalian Maritime University, China. Sustainability 2021, 13, 6627. [Google Scholar] [CrossRef]
  21. Matowicki, M.; Pribyl, O.; Pecherkova, P. Carsharing in the Czech Republic: Understanding why users chose this mode of travel for different purposes. Case Stud. Transp. Policy 2021, 9, 842–850. [Google Scholar] [CrossRef]
  22. Dong, H.; Yang, X.; Wang, W. Influencing factor analysis of car-sharing demand based on point of interest data. J. Phys. Conf. Ser. 2021, 1972, 012074. [Google Scholar] [CrossRef]
  23. Hahn, R.; Ostertag, F.; Lehr, A.; Büttgen, M.; Benoit, S. “I like it, but I don’t use it”: Impact of carsharing business models on usage intentions in the sharing economy. Bus. Strategy Environ. 2020, 29, 1404–1418. [Google Scholar] [CrossRef]
  24. Kim, J.; Rasouli, S.; Timmermans, H.J. The effects of activity-travel context and individual attitudes on car-sharing decisions under travel time uncertainty: A hybrid choice modeling approach. Transp. Res. Transp. Environ. 2017, 56, 189–202. [Google Scholar] [CrossRef]
  25. Ramos, R.M.S.; Bergstad, C.J. The Psychology of Sharing: Multigroup Analysis among Users and Non-Users of Carsharing. Sustainability 2021, 13, 6842. [Google Scholar] [CrossRef]
  26. Fleury, S.; Tom, A.; Jamet, E.; Colas-Maheux, E. What drives corporate carsharing acceptance? A French case study. Transp. Res. Traffic Psychol. Behav. 2017, 45, 218–227. [Google Scholar] [CrossRef]
  27. Tran, V.; Zhao, S.; Diop, E.B.; Song, W. Travelers’ Acceptance of Electric Carsharing Systems in Developing Countries: The Case of China. Sustainability 2019, 11, 5348. [Google Scholar] [CrossRef]
  28. Mattia, G.; Guglielmetti Mugion, R.; Principato, L. Shared mobility as a driver for sustainable consumptions: The intention to re-use free-floating car sharing. J. Clean. Prod. 2019, 237, 117404. [Google Scholar] [CrossRef]
  29. Uusitalo, E.; Kuokkanen, A.; Uusitalo, V.; von Wright, T.; Huttunen, A. Personal Carbon Trading In Mobility May Have Positive Distributional Effects. Case Stud. Transp. Policy 2021, 9, 315–323. [Google Scholar] [CrossRef]
  30. Liu, Y. Residents’ Willingness and Influencing Factors on Action Personal Carbon Trading: A Case Study of Metropolitan Areas in Tianjin, China. Sustainability 2019, 11, 369. [Google Scholar] [CrossRef]
  31. Klemmer, K.; Willing, C.; Wagner, S.; Brandt, T. Explaining Spatio-Temporal Dynamics in Carsharing: A Case Study of Amsterdam: 22nd Americas Confrence on Information Systems (AMCIS 2016); Twenty-second Americas Conference on Information Systems; AMCIS: San Diego, CA, USA, 2016. [Google Scholar]
  32. Chen, X.; Cheng, J.; Ye, J.; Jin, Y.; Li, X.; Zhang, F. Locating Station of One-Way Carsharing Based on Spatial Demand Characteristics. J. Adv. Transp. 2018, 2018, 5493632. [Google Scholar] [CrossRef]
  33. Willing, C.; Klemmer, K.; Brandt, T.; Neumann, D. Moving in time and space—Location intelligence for carsharing decision support. Decis. Support Syst. 2017, 99, 75–85. [Google Scholar] [CrossRef]
  34. Curtale, R.; Liao, F.; van der Waerden, P. Understanding travel preferences for user-based relocation strategies of one-way electric car-sharing services. Transp. Res. Emerg. Technol. 2021, 127, 103135. [Google Scholar]
  35. Beijing Municipal Bureau of Statistics and NBS Survey Office in Beijing. Beijing Statistics Yearbook. 2021. Available online: https://nj.tjj.beijing.gov.cn/nj/main/2021-tjnj/zk/indexeh.htm (accessed on 10 September 2023).
  36. Clewlow, R.R. Carsharing and sustainable travel behavior: Results from the San Francisco Bay Area. Transp. Policy 2016, 51, 158–164. [Google Scholar] [CrossRef]
  37. Mayara, M.; Carlos, M.L.A.; Maria, K.; Yoram, S.; Ayelet, G.-T.; Sharon, S.T.; Constantinos, A.; Guido, C. Car-Sharing Subscription Preferences: The Case of Copenhagen, Munich, and Tel Aviv-Yafo. Economics 2022, 2206, 2448. [Google Scholar]
  38. Ben-Akiva, M.; Lerman, S.R. Discrete Choice Analysis: Theory and Application to Travel Demand; Massachusetts Institute of Technology Press: Cambridge, UK, 1985; p. 370. [Google Scholar]
  39. McFadden, D.; Train, K. Mixed MNL models for discrete response. J. Appl. Econom. 2000, 15, 447–470. [Google Scholar] [CrossRef]
  40. Carrone, A.P.; Hoening, V.M.; Jensen, A.F.; Mabit, S.E.; Rich, J. Understanding car sharing preferences and mode substitution patterns: A stated preference experiment. Transp. Policy 2020, 98, 139–147. [Google Scholar] [CrossRef]
  41. Yin, Y.; Wang, H.; Xiong, J.; Zhu, Y.; Tang, Z. Estimation of optimum supply of shared cars based on personal travel behaviors in condition of minimum energy consumption. Environ. Dev. Sustain. 2021, 23, 13324–13339. [Google Scholar] [CrossRef]
  42. Kim, D.; Ko, J.; Park, Y. Factors affecting electric vehicle sharing program participants’ attitudes about car ownership and program participation. Transp. Res. Transp. Environ. 2015, 36, 96–106. [Google Scholar] [CrossRef]
  43. Felipe, F.; Dias, P.S.L.V. A behavioral choice model of the use of car-sharing and ride-sourcing services. Transportation 2017, 44, 1307–1323. [Google Scholar]
  44. Yoon, T.; Cherry, C.R.; Jones, L.R. One-way and round-trip carsharing: A stated preference experiment in Beijing. Transp. Res. Transp. Environ. 2017, 53, 102–114. [Google Scholar] [CrossRef]
  45. Chen, W.; Cao, C.; Fang, X.; Kang, Z. Expanding the Theory of Planned Behaviour to Reveal Urban Residents’ Pro-Environment Travel Behaviour. Atmosphere 2019, 10, 467. [Google Scholar] [CrossRef]
  46. Alonso-Almeida, M.D.M. Carsharing: Another gender issue? Drivers of carsharing usage among women and relationship to perceived value. Travel Behav. Soc. 2019, 17, 36–45. [Google Scholar] [CrossRef]
  47. Juan, W.; Gamze, D.; Harry, T. Carsharing Facilitating Neighborhood Choice And Commuting. Eur. Real Estate Soc. 2021, 36, 1033–1054. [Google Scholar]
Figure 1. The basic framework of hybrid choice model.
Wevj 14 00285 g001
Figure 2. The framework of hybrid choice model for travel mode choice.
Wevj 14 00285 g002
Figure 3. The framework of hybrid choice model for travel destination choice.
Wevj 14 00285 g003
Table 1. Attributes and their level values in travel mode choice.
Mode AttributeIn-Car Time (Min)Out-Car Time (Min)Fare (CNY)Purpose
SEV16/20/2412/15/1812/15/18Recreation/commuting/connecting transport hubs
Bus32/40/4816/20/242
Subway12/15/1820/25/304
Car16/20/246/8/1025/30/35
Table 2. Attributes and their level values in travel destination choice.
Destination
Attribute
Mall AttributeParking LotsBus LinesSubway
Stations
Level 1Malls mainly include shopping; dining, cinema, KTV, beauty and fitness present as a supplementary activities15–3515–30<4
Level 2In addition to shopping and dining, these malls also include amusement parks, theme blocks, ecological parks, art museums, bookstores, exhibitions and other large-scale leisure facilities35–6530–654–10
Table 3. Socio-demographics of sample vs. census.
VariableDescriptionRespondentsProportionStatistical Yearbook
GenderMale39651.6%51.1%
Female37248.4%48.8%
PopulationLocal30139.2%61.6%
Immigrant46760.8%38.4%
Age (years)18–2513317.3%7.3%
26–3024131.4%10.2%
31–4021828.4%24.9%
41–5012416.1%17.2%
51–60384.9%17.4%
>60141.8%23%
EducationJunior high school or below324.2%33%
High school/technical secondary14819.3%17.6%
Graduate/junior college45659.4%42.0%
Master degree or above13217.2%
Income (CNY/month)<500016121.0%
5000–10,00034444.8%
10,001–20,00019024.7%
>20,000739.5%
OccupationEmployees of enterprises30940.2%
Civil servant18223.7%
Student11615.1%
Self-employed13317.3%
Other283.6%
Car ownershipYes30639.8%
No46260.2%
Driving years (years)<115620.3%
1–525633.3%
6–1027635.9%
>108010.4%
Common travel modePrivate car11615.1%
Bus19124.9%
Subway29238.0%
Taxi/Online car-hailing11214.6%
SEV455.9%
Other121.6%
Note: — Values not included in the Statistical Yearbook.
Table 4. Results of data test index.
Latent VariablesCronbach’s AlphaKMOCRAVE
PBC0.6720.6510.650.48
SN0.7940.6970.800.57
ATT0.9080.9390.800.57
HAB0.8140.7120.810.59
FX0.7780.6990.770.53
PCT0.8130.7810.790.55
INT0.8350.7230.830.63
Table 5. Measurement index estimation and adaptation formula of latent variables.
IndicatorFactor Loadings CoefficientAdaptation Formula
PBC10.693 *** η P B C = 0.50 P B C 1 + 0.50 P B C 2
PBC20.696 ***
SN10.697 *** η S N = 0.31 S N 1 + 0.33 S N 2 + 0.36 S N 3
SN20.751 ***
SN30.809 ***
ATT10.808 *** η A T T = 0.36 A T T 1 + 0.30 A T T 2 + 0.34 A T T 3
ATT20.679 ***
ATT30.764 ***
HAB10.737 *** η H A B = 0.32 H A B 1 + 0.33 H A B 2 + 0.35 H A B 3
HAB20.759 ***
HAB30.802 ***
FX10.724 *** η F X = 0.33 F X 1 + 0.33 F X 2 + 0.34 F X 3
FX20.709 ***
FX30.748 ***
PCT10.696 *** η P C T = 0.31 P C T 1 + 0.33 P C T 2 + 0.35 P C T 3
PCT20.743 ***
PCT30.787 ***
INT10.775 *** η I N T = 0.33 I N T 1 + 0.33 I N T 2 + 0.34 I N T 3
INT20.786 ***
INT30.814 ***
Note: *** Significance at 1% level.
Table 6. Standardized path coefficients between individual socio-demographic attributes and latent variables.
VariablePBCSNATTHABFXPCTINT
Gender(female = 1)0.16 **0.15 *0.17 **0.11 *0.22 ***
Age0.06 *
Education0.17 **0.09 *0.13 **0.14 ***0.13 **0.11 **
Car ownership
(No = 1)
0.16 **−0.16 *
Driving years0.09 **0.15 ***0.09 **0.13 ***
Civil servant
(Yes = 1)
0.35 **
Student
(Yes = 1)
0.33 *
Self-employed
(Yes = 1)
0.50 ***0.33 *
Common travel mode—private car
(Yes = 1)
−0.68 **
Common travel mode—subway
(Yes = 1)
−0.59 **
Common travel mode—taxi/online car-hailing (Yes = 1)−0.54 *−0.55 *−0.60 **−0.47 *−0.68 **
Note: * Significance at 10% level; ** Significance at 5% level; *** Significance at 1% level; — Variables not included in the analysis.
Table 7. Parameter estimation results of hybrid choice model and mixed logit model for travel mode choice.
VariableMixed Logit ModelHybrid Choice Model
SEVSubwayCarSEVSubwayCar
MeanConstant−0.455 ***0.295 ** −1.095 *** −0.490 *
Edu1 (Education = Junior high school and below)−0.007 **0.370 **−0.016 **0.353 *
Occ1 (Occupation = Employees of enterprises + Civil servant)0.248 ***0.142 **0.228 **0.127 **
Age−0.030 **−0.030 **−0.047 ***−0.034 ***−0.028 **−0.051 ***
Car ownership (Yes = 1)−0.285 ***0.313 ***−0.173 *0.354 ***
HighDyear (Driving years = 6 years or above)0.250 ***0.131 **0.251 ***0.131 **
Cmode (Common travel mode = Private car + Taxi/Online car-hailing)−0.145 *0.174 *−0.134 *0.195 *
Purpose1 (Purpose = Recreation)0.265 ***0.266 ***
Purpose3 (Purpose = Connecting transport hubs)0.281 *** 0.281 ***
SN0.168 ***0.099 ***
ATT0.104 **0.127 **
HAB0.093 **0.202 ***
INT0.058 ***0.073 *
In-car time−0.010 ***−0.007 ***
Out-car time−0.006 **−0.006 **
Fare−0.009 ***−0.009 ***
Standard deviationSEV0.744 ***0.704 ***
Subway0.749 ***0.727 ***
Car1.032 ***1.016 ***
CovarianceSEV and subway0.296 ***0.256 ***
SEV and car0.345 ***0.285 ***
Car and subway0.641 ***0.614 ***
Model criteriaAIC18,289.0918,169.84
BIC18,431.1918,357.75
Note: * Significance at 10% level; ** Significance at 5% level; *** Significance at 1% level; — Variables not included in the analysis.
Table 8. Parameter estimation results of the hybrid choice model and mixed logit model for travel destination choice.
VariableMixed Logit ModelHybrid Choice Model
ACAC
MeanAge1 (Age = 18–25)1.557 **2.065 ***1.704 **2.152 ***
Age2 (Age = 26–30)1.392 ***1.557 **
Occ2 (Occupation = Civil servant)−1.056 ***−1.123 ***
Occ3 (Occupation = Student)−0.913 *−1.696 **−0.849 *−1.620 **
Edu2 (Education = Graduate/Junior College)−0.593 **−0.633 **−0.686 **−0.625 **
Inc1 (Income ≤ 5000)−1.426 **−1.496 **
Inc4 (Income ≥ 20,000)−0.875 *−1.036 **
Car ownership (Yes = 1)−0.548 **0.569 **−0.437 *0.558 **
HighDyear (Driving years = 6 years or above)0.614 **0.573 *
PBC 0.293 **
FX 0.259 *
SN 0.310 **
INT 0.212 *0.419 ***
PCT −0.330 **−0.487 **
Number of parking lots0.122 ***0.148 ***
Number of subway stations−0.142 **−0.156 **
Mall0.166 ***0.220 ***
Standard deviationNumber of parking lots0.039 **0.050 **
Number of subway stations1.101 *1.385 *
Mall0.081 **0.101 **
CovarianceNumber of parking lots and Number of subway stations0.1460.182
Number of parking lots and Mall0.056 ***0.070 **
Number of subway stations and Mall0.233 **0.090 **
Model
criteria
AIC1920.8751814.328
BIC2151.2762080.294
Note: * Significance at 10% level; ** Significance at 5% level; *** Significance at 1% level; — Variables not included in the analysis.
Table 9. Comparison of results of parameter significance between previous studies and our study.
VariableResults of Parameter Significance in This StudyResults of Parameter Significance in Previous Studies
GenderGender has significant effects on PBC, SN, HAB, PCT and INT.Women’s perceived attitudes toward traveling with SEVs are more pronounced [46].
AgeAge has a positive effect on INT.Age has a significant impact on behavioral intent to travel with SEVs [42].
EducationThe group with a junior high school education or below are not inclined to choose SEVs for travel.Highly educated people are more likely to use SEVs [17,18].
Car ownershipThe group with a private car are not inclined to choose SEVs for travel.High vehicle ownership adversely affects the demand for SEVs [43].
OccupationPublic officials, employees of enterprises and people with high driving years have preferences for SEVs.Employees of enterprises are more willing to choose SEVs for daily work-related travel activities [13,44].
SNThe latent variable of subjective norms has a significant impact on the choice behavior concerning SEVs.Subjective norms have positive effects on the demand for SEVs [25].
ATTAttitudes have positive impacts on the choice behavior concerning SEVs.The intention to reuse SEVs is successively affected by attitudes [28].
HABHabits have positive impacts on the choice behavior concerning SEVs.SEV choice behavior is influenced by habit preference [45].
Time and FareIn-car time, out-car time and travel cost all have significant negative effects on the choice behavior concerning SEVs.Increasing time and fares would reduce an individual’s preference for SEVs [20,24].
PurposeThe public is more inclined to use SEVs to travel to malls with convenient parking and diversified leisure and entertainment facilities.SEVs are often used for leisure travel [22].
DistanceTravelers are more inclined to choose SEVs to go to remote category C malls.SEVs mainly serve medium- and long-distance travel [19].
Number of subway stationsThe number of subway stations has a negative impact on destination choice behavior.There is competition between subways and SEVs, and the more developed the subway, the lower the probability of SEV choice [39,46].
Disclaimer/Publisher’s Note: The statements, opinions and data contained in all publications are solely those of the individual author(s) and contributor(s) and not of MDPI and/or the editor(s). MDPI and/or the editor(s) disclaim responsibility for any injury to people or property resulting from any ideas, methods, instructions or products referred to in the content.

