
Leveraging Connected Vehicle Data to Assess Interstate Exit Utilization and Identify Charging Infrastructure Investment Allocation Opportunities


Abstract
:1. Introduction
1.1. Literature Review
1.2. Objectives and Scope
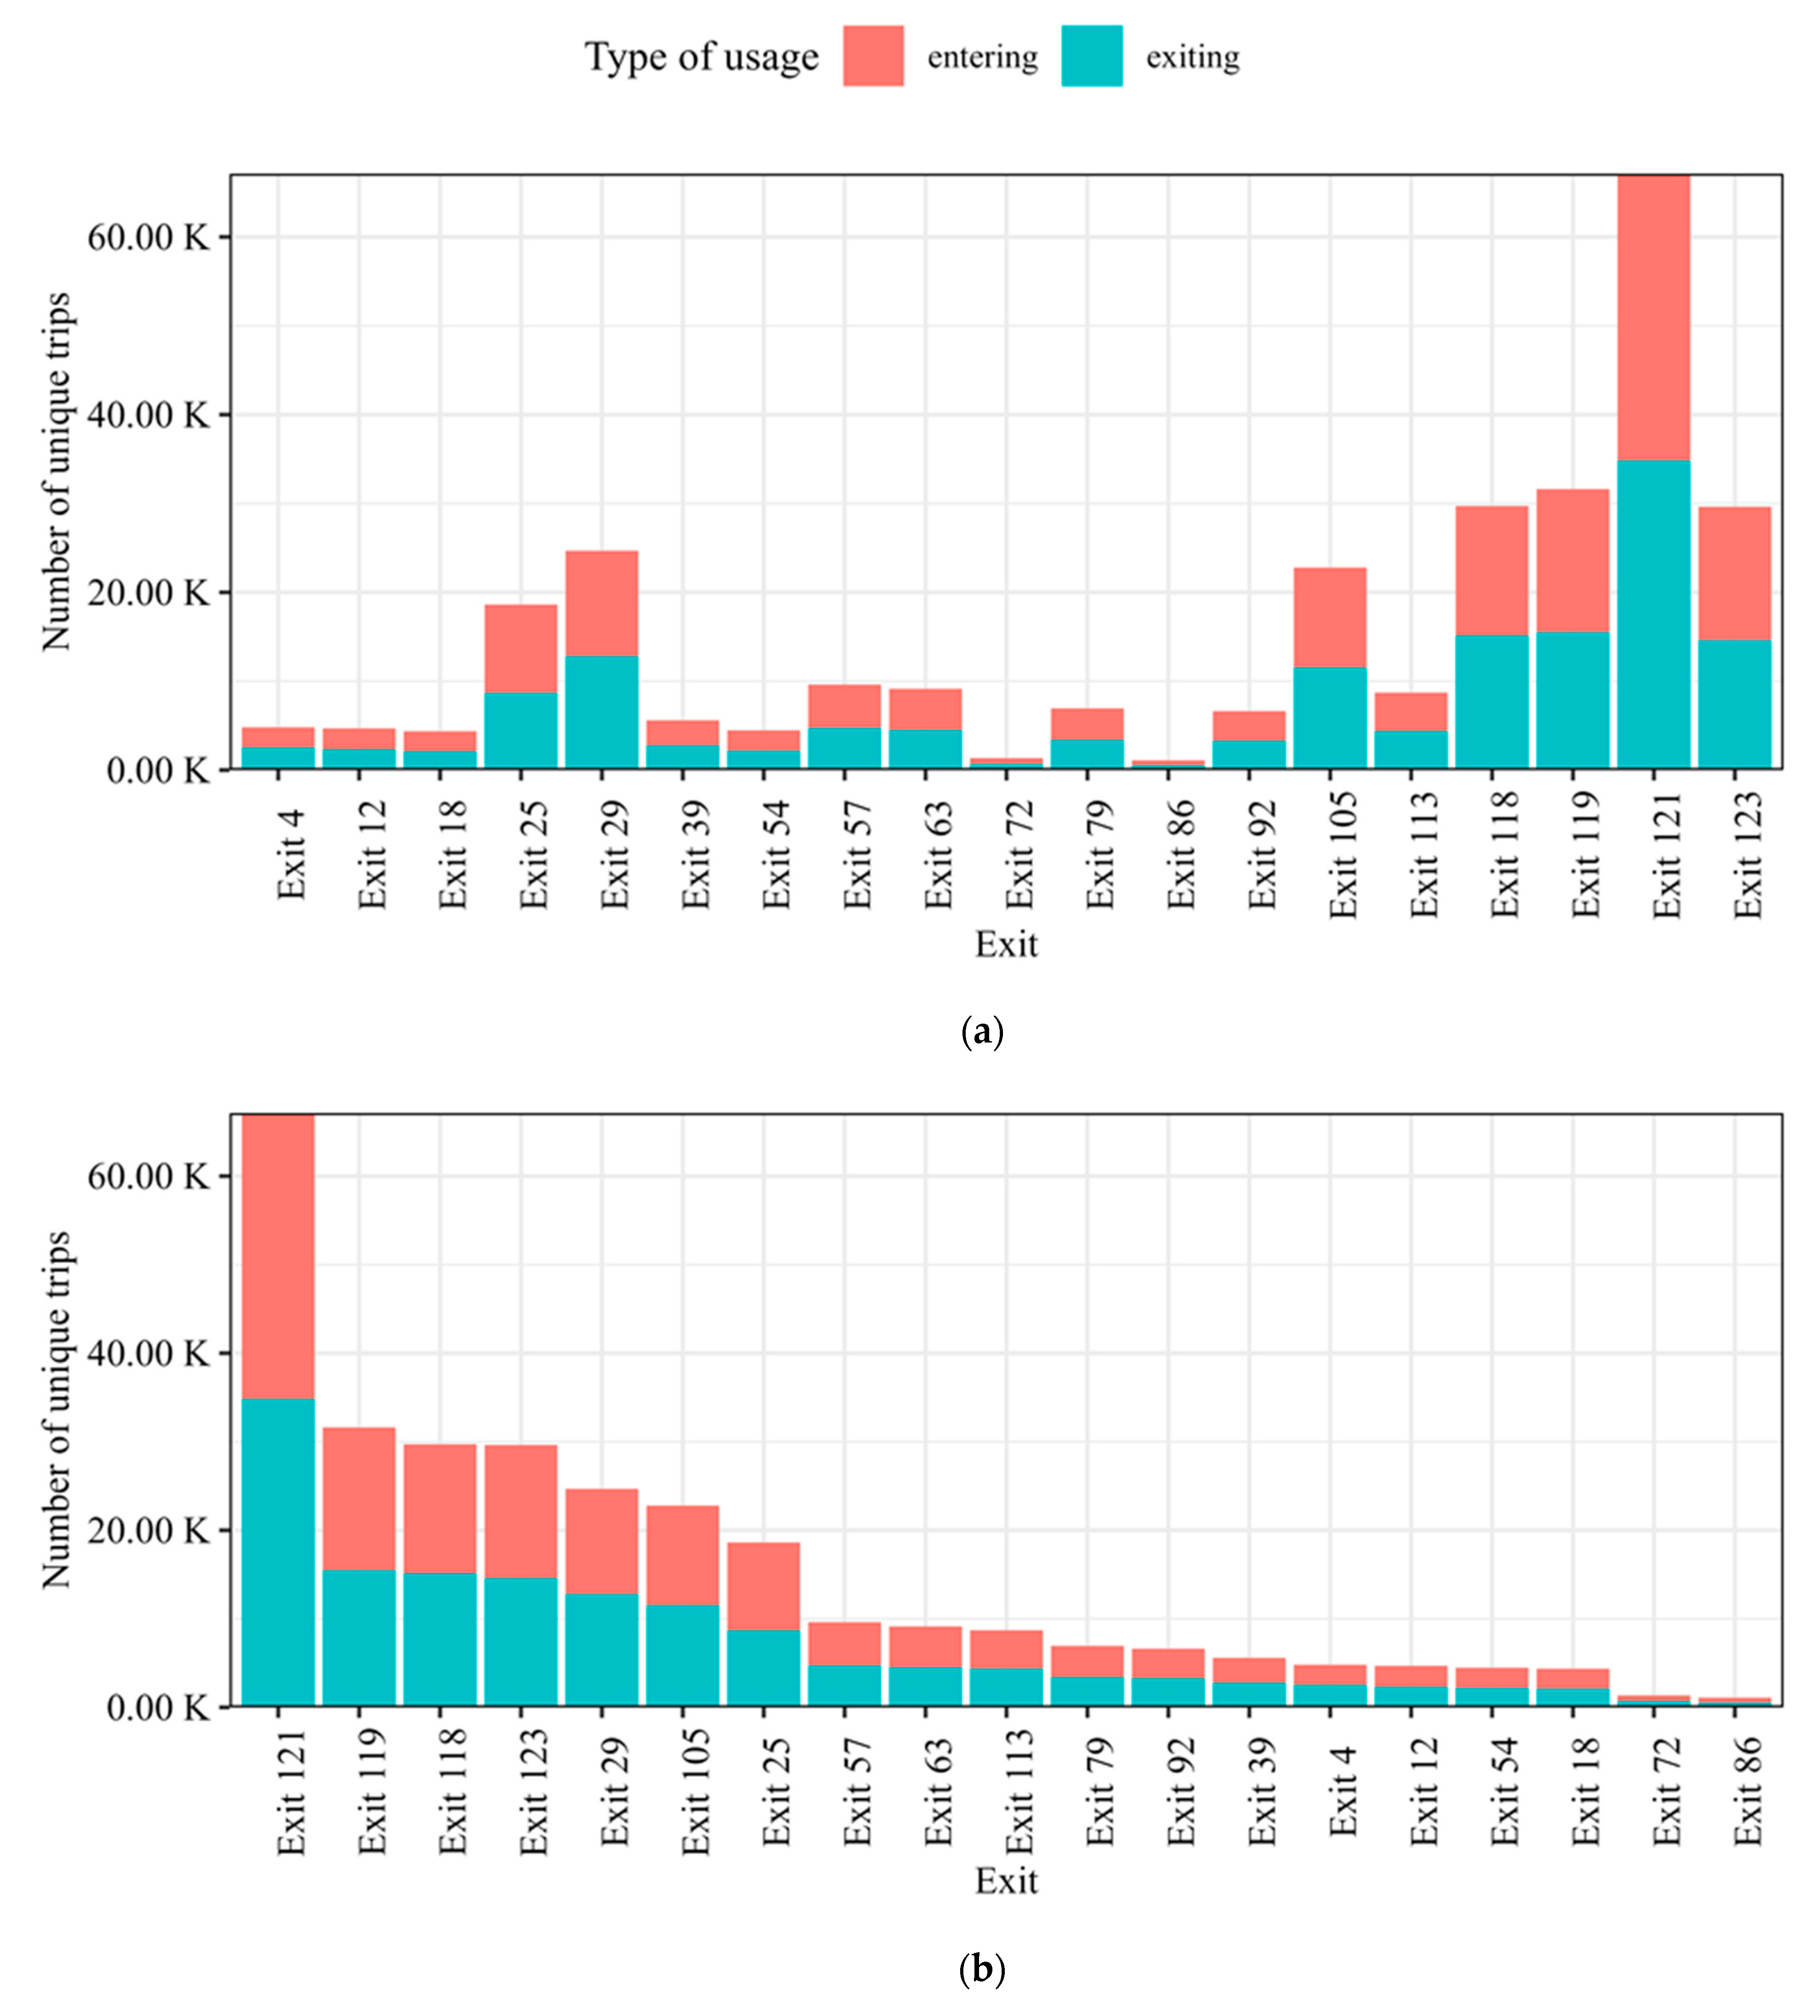
- Analyzing exit usage on Indiana’s interstate network
- Analyzing CV dwell patterns in the vicinity of interstate exits
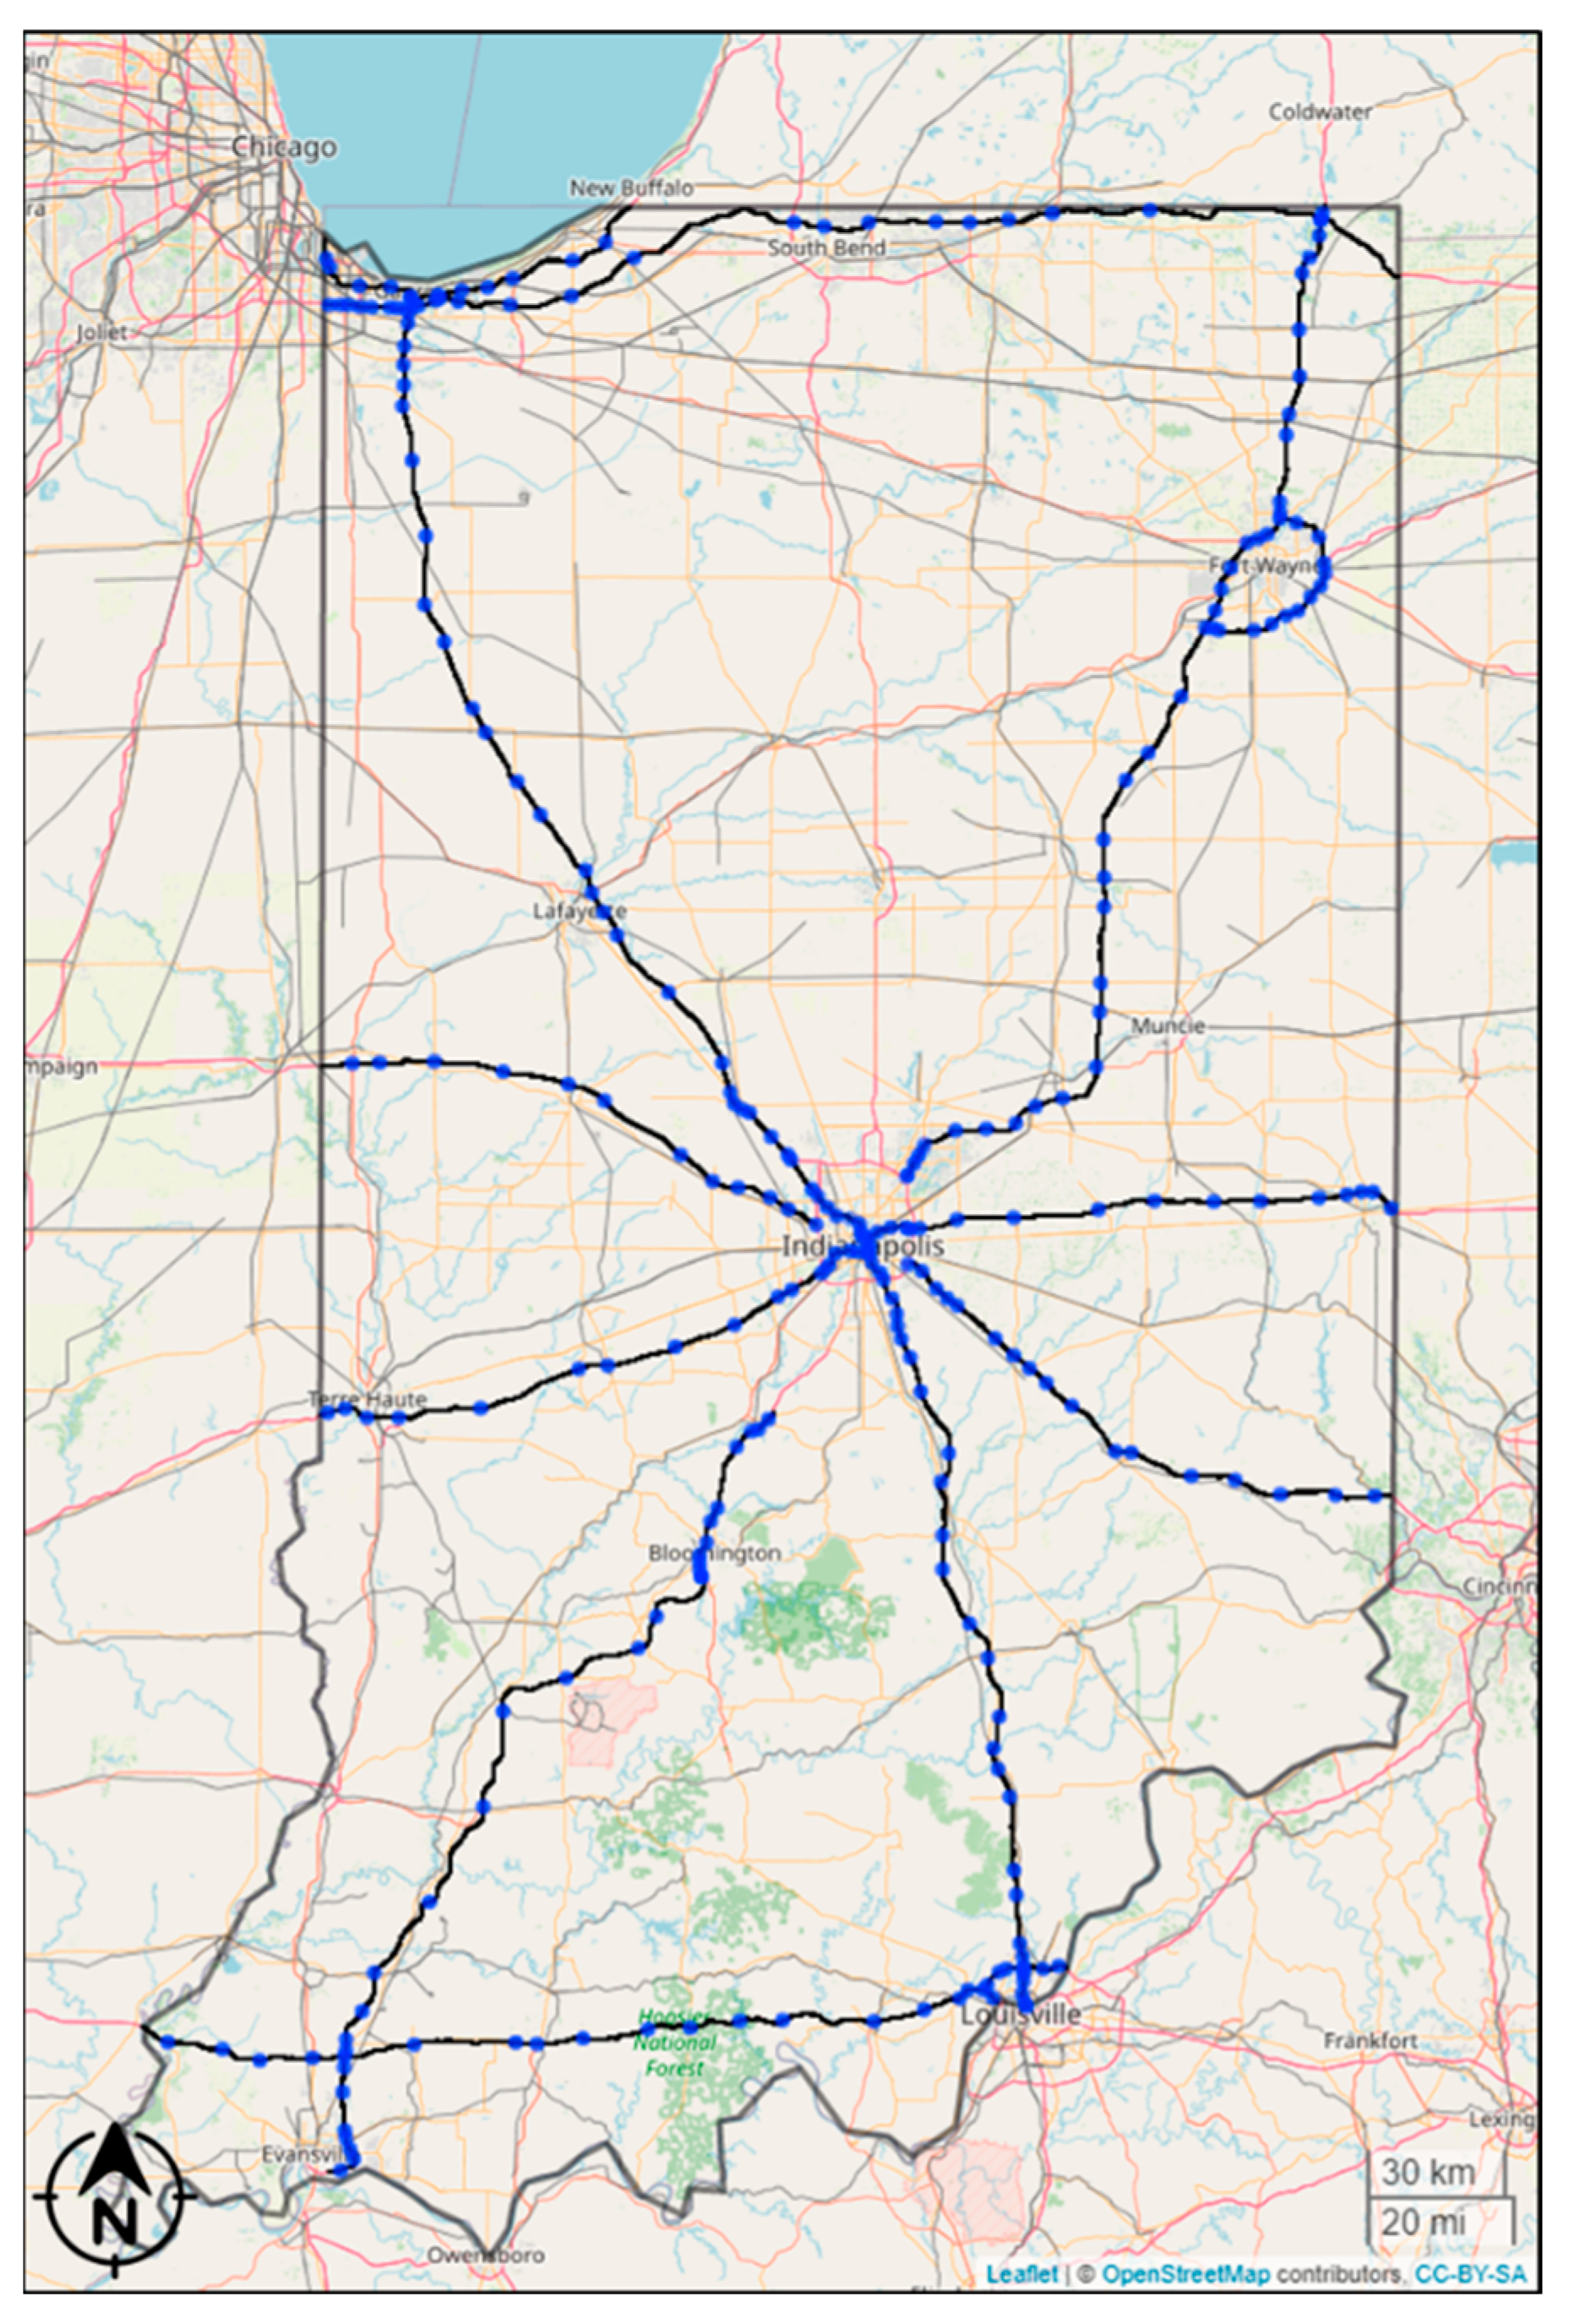
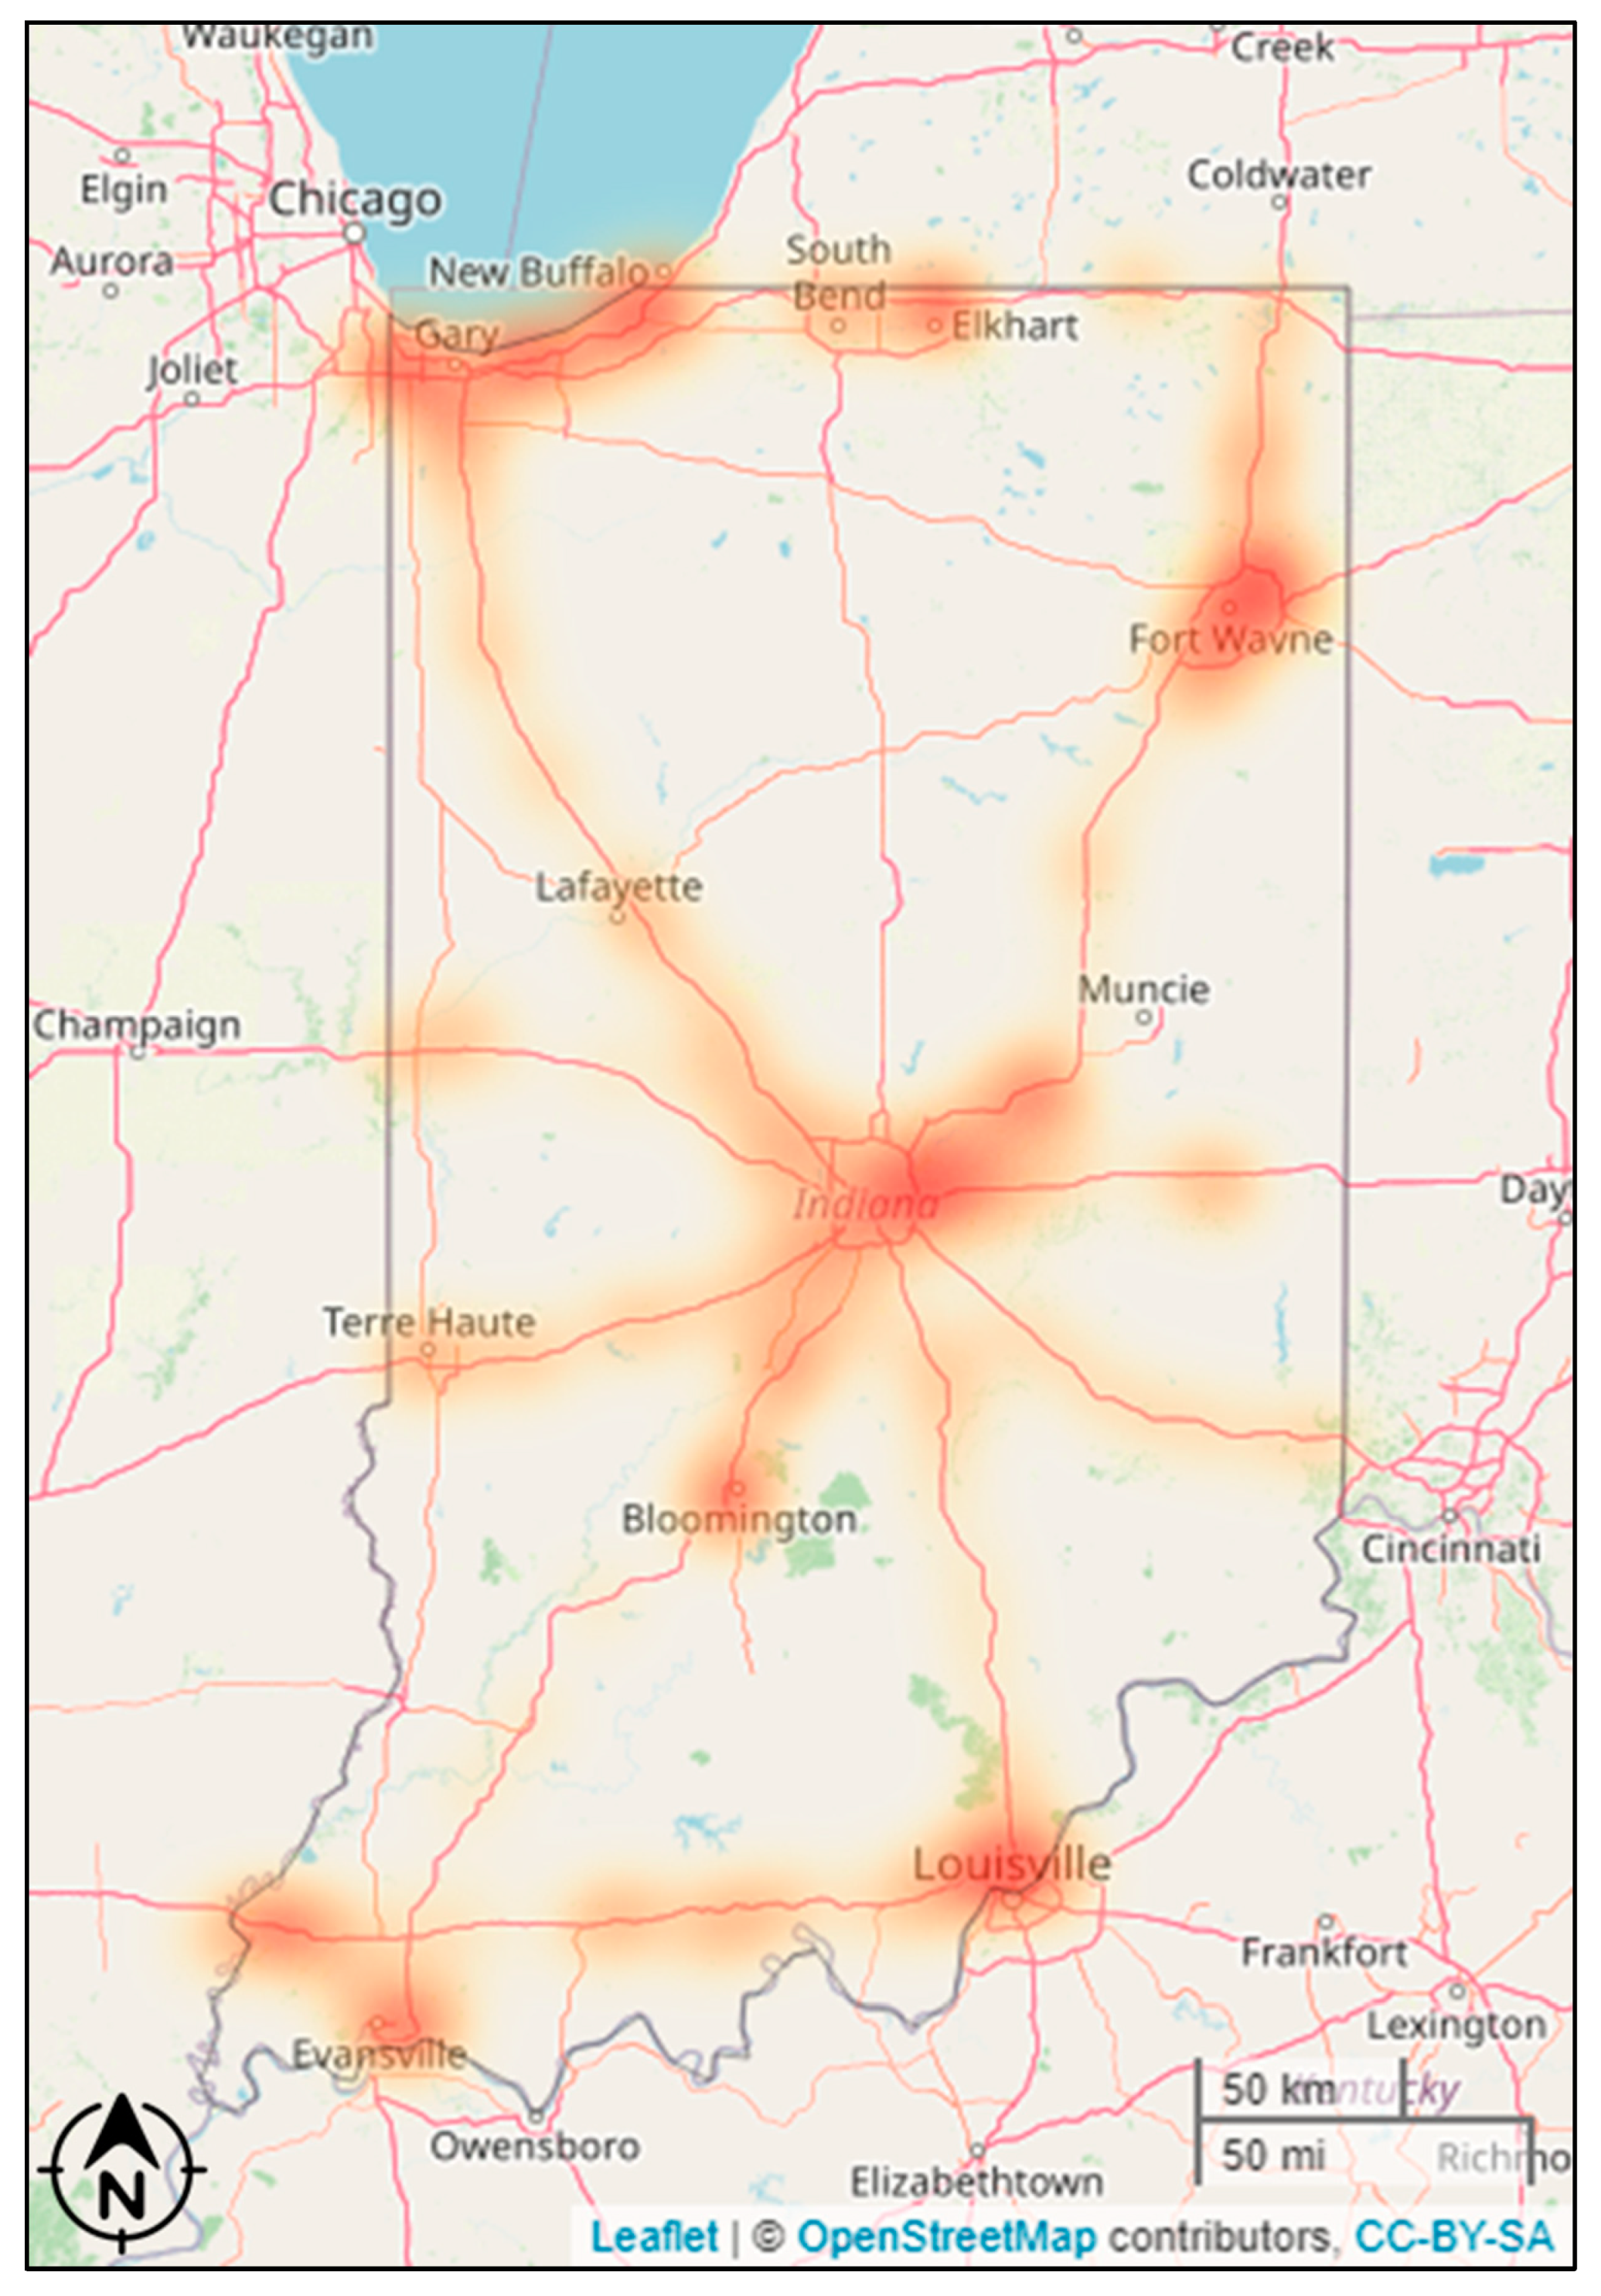
1.3. Study Location
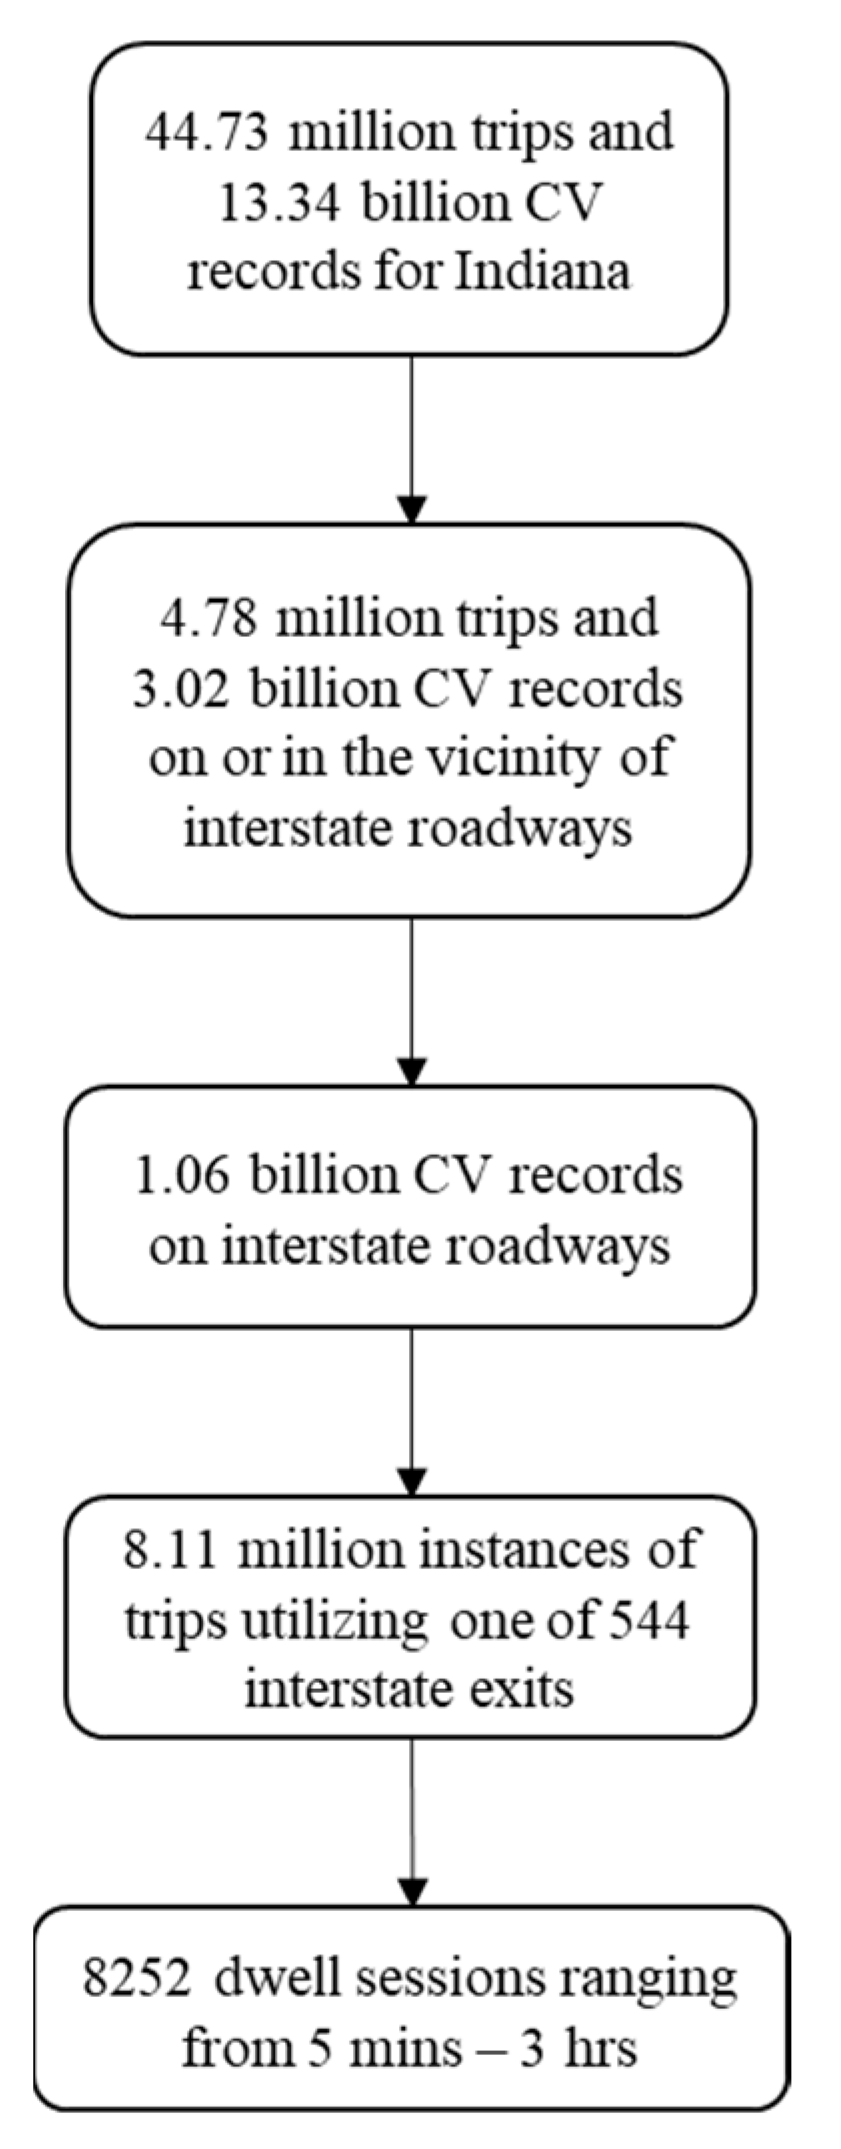
1.4. CV Data
2. Methodology
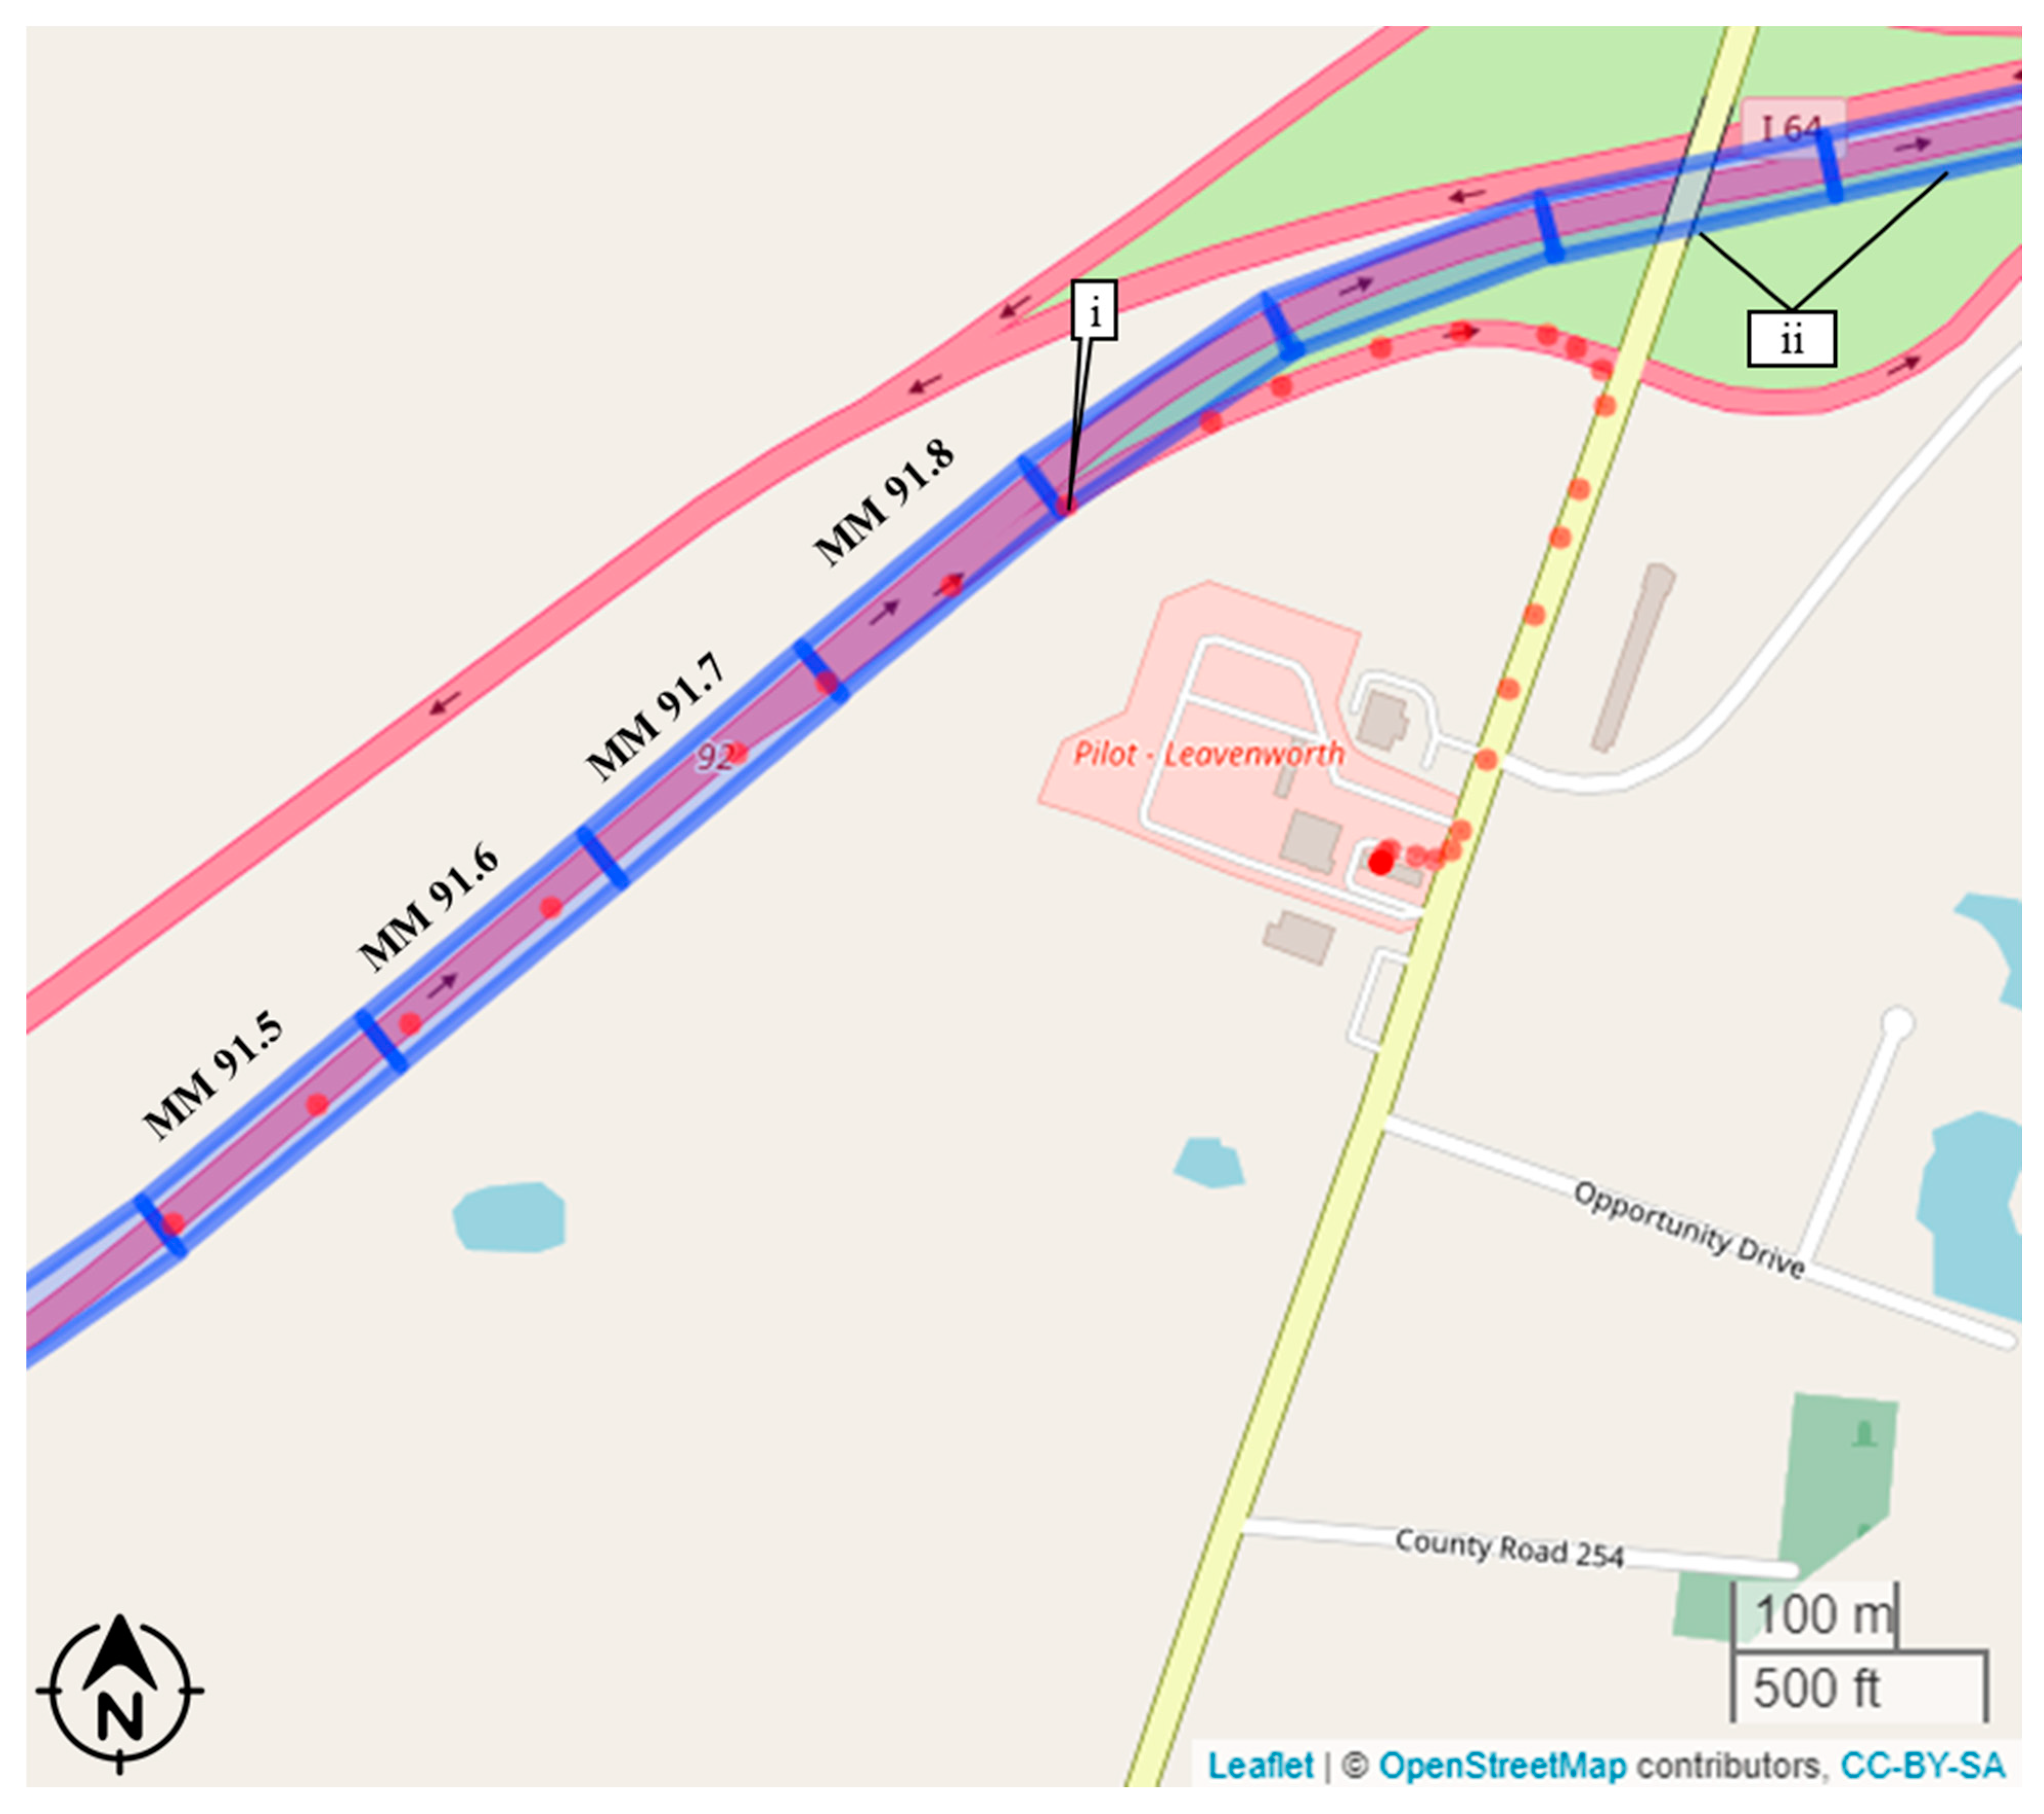
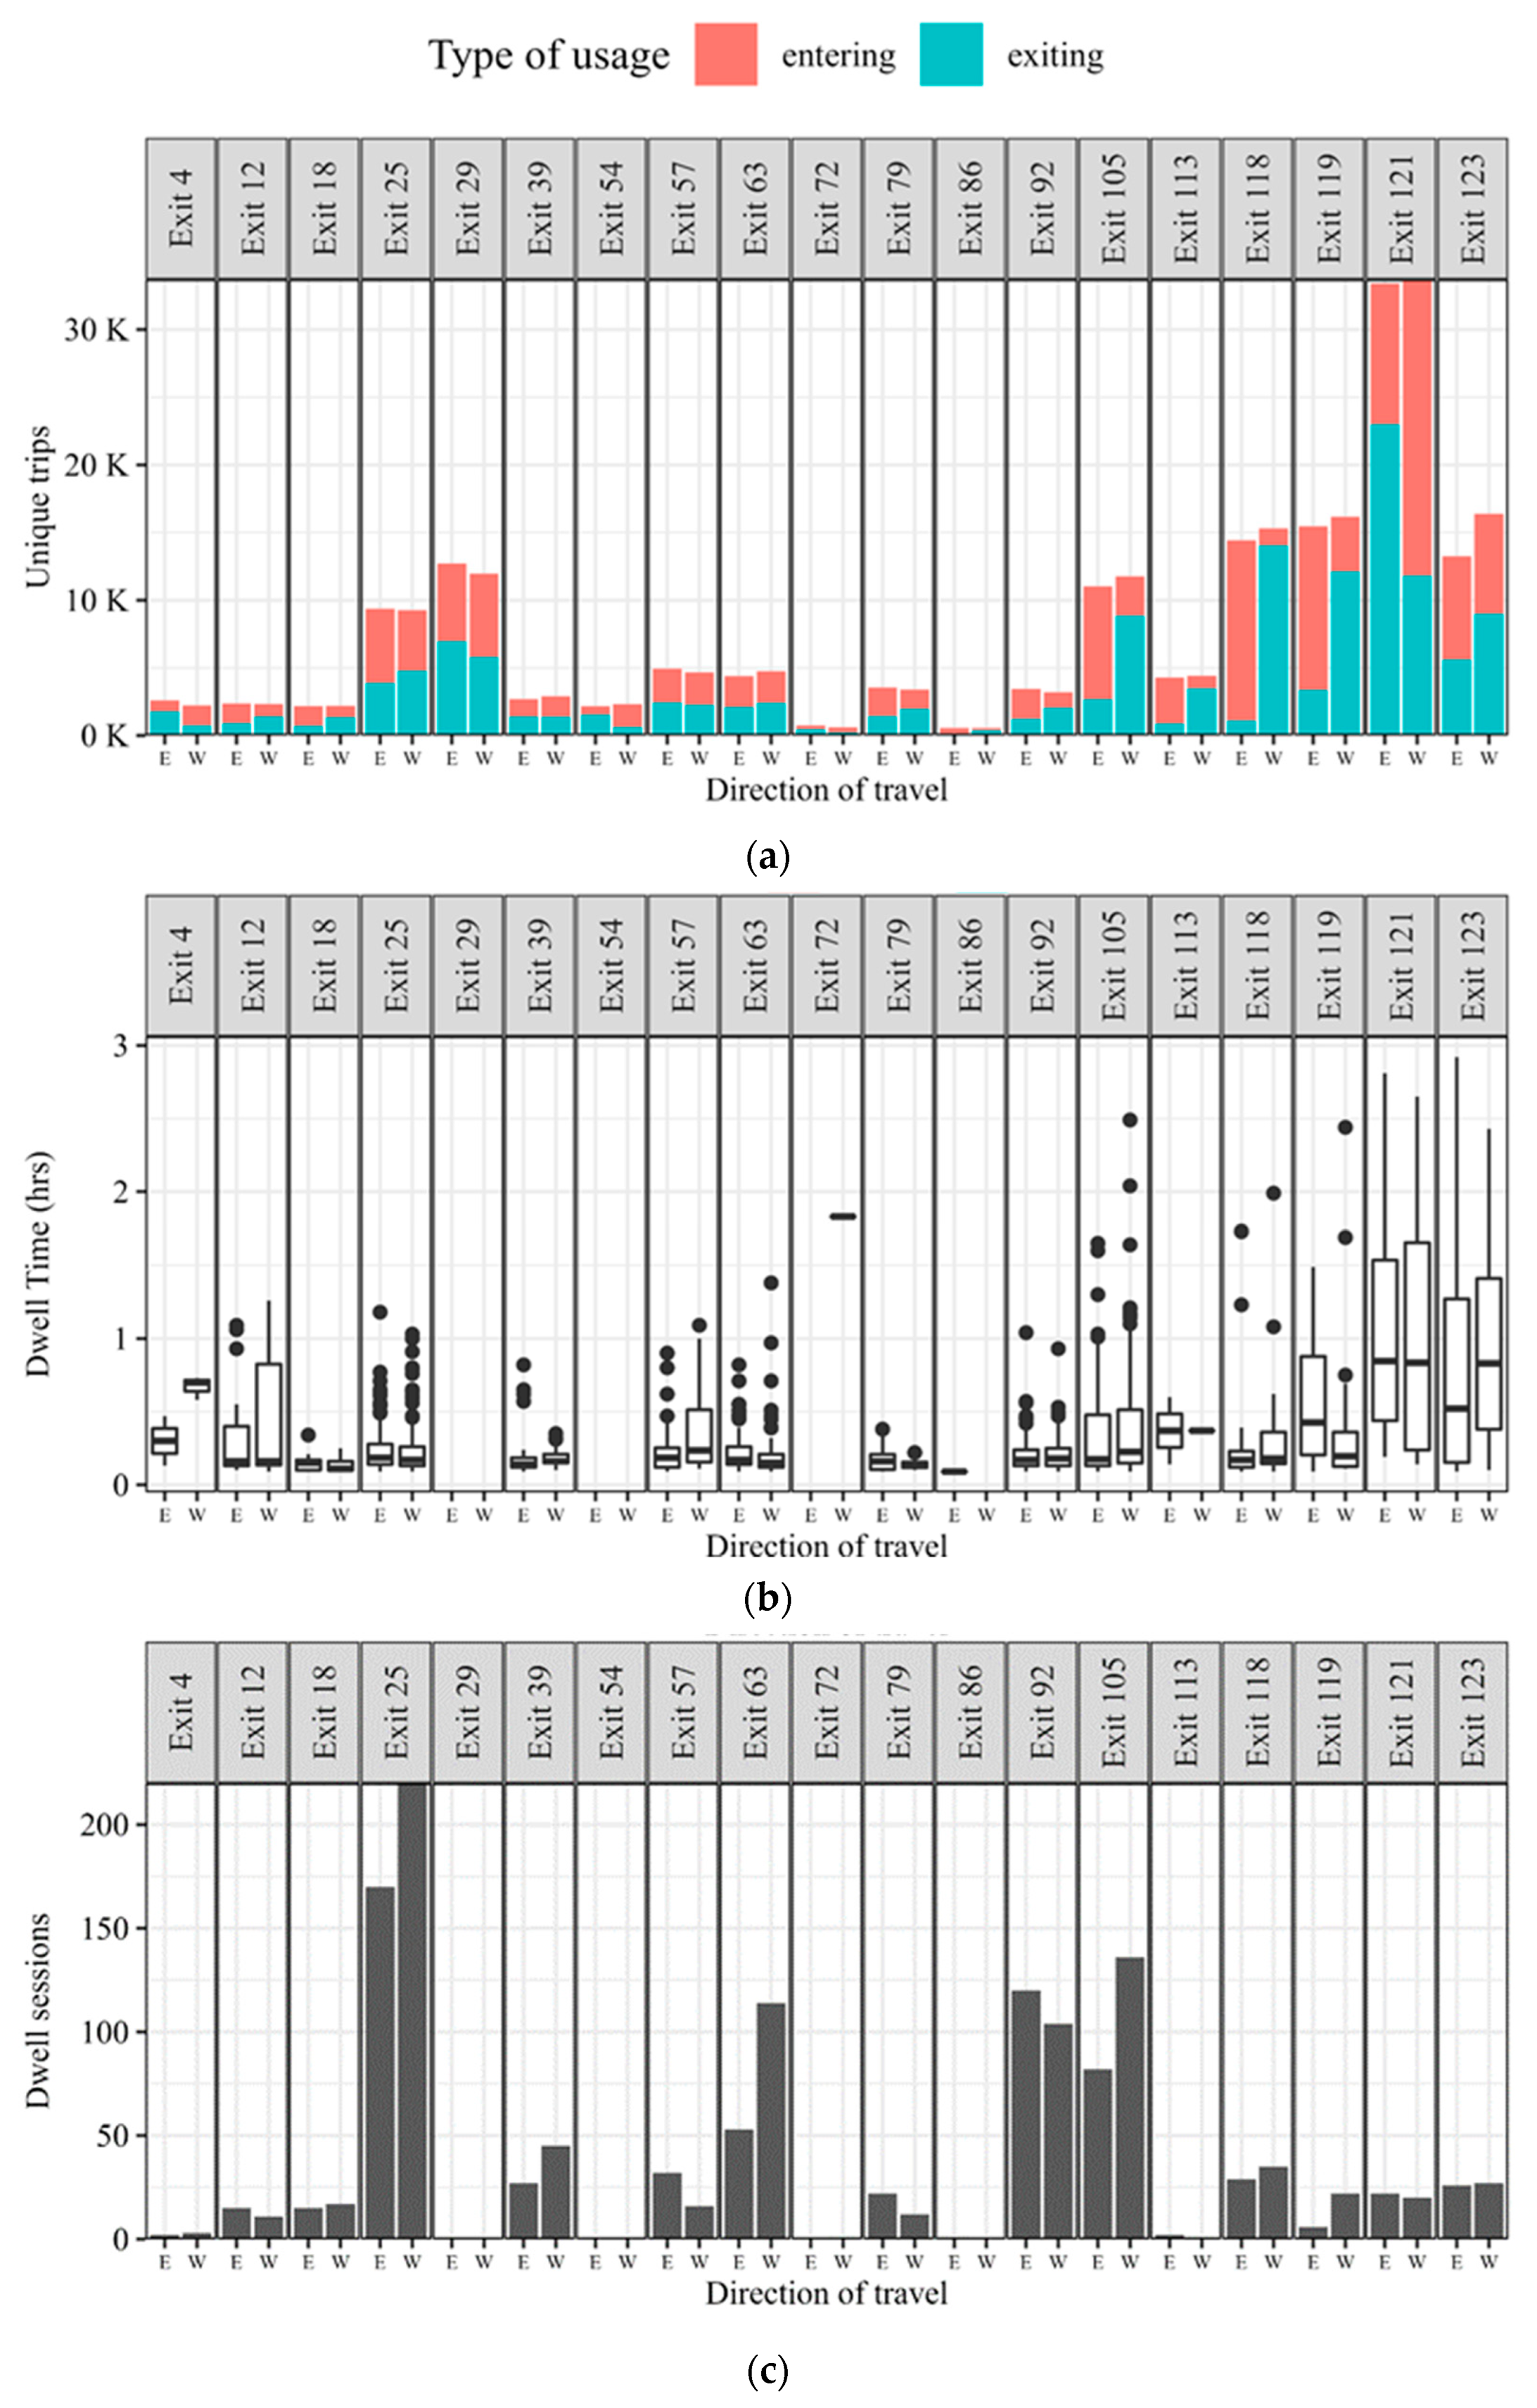
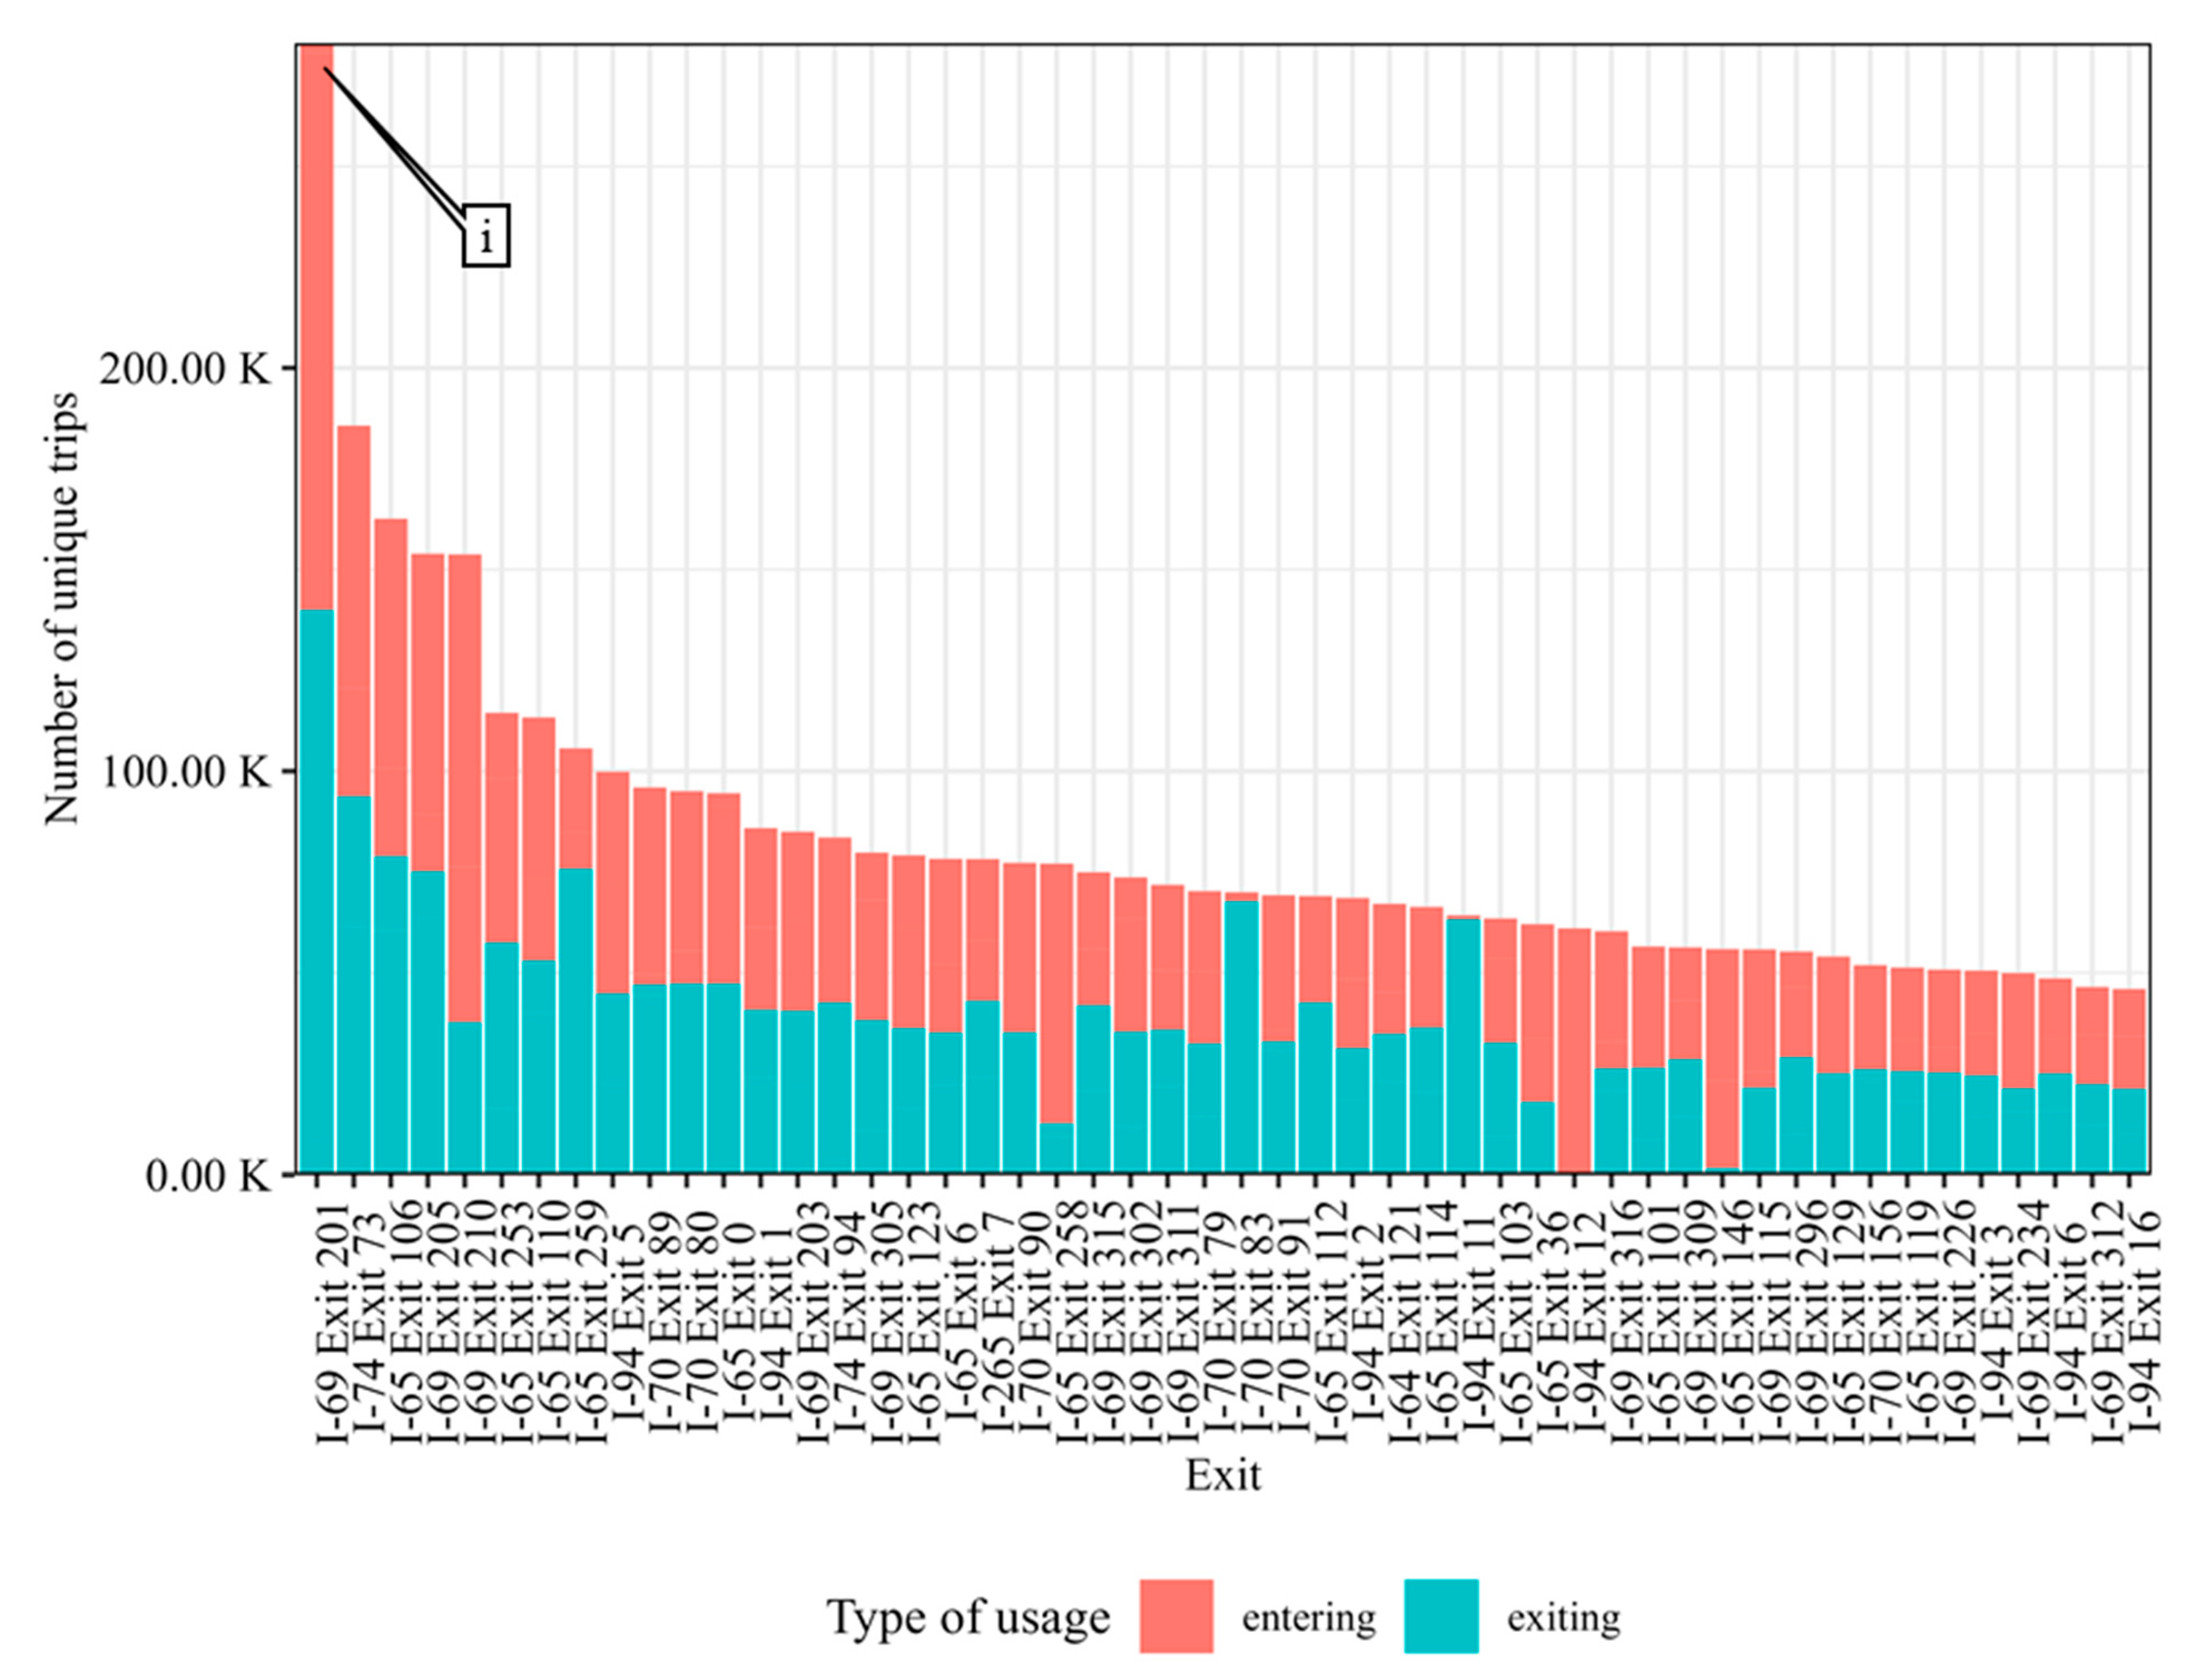
2.1. Analyzing Interstate Exit Usage
2.2. Analyzing Dwell Patterns
2.3. Scaling Methodology for Systemwide Analysis
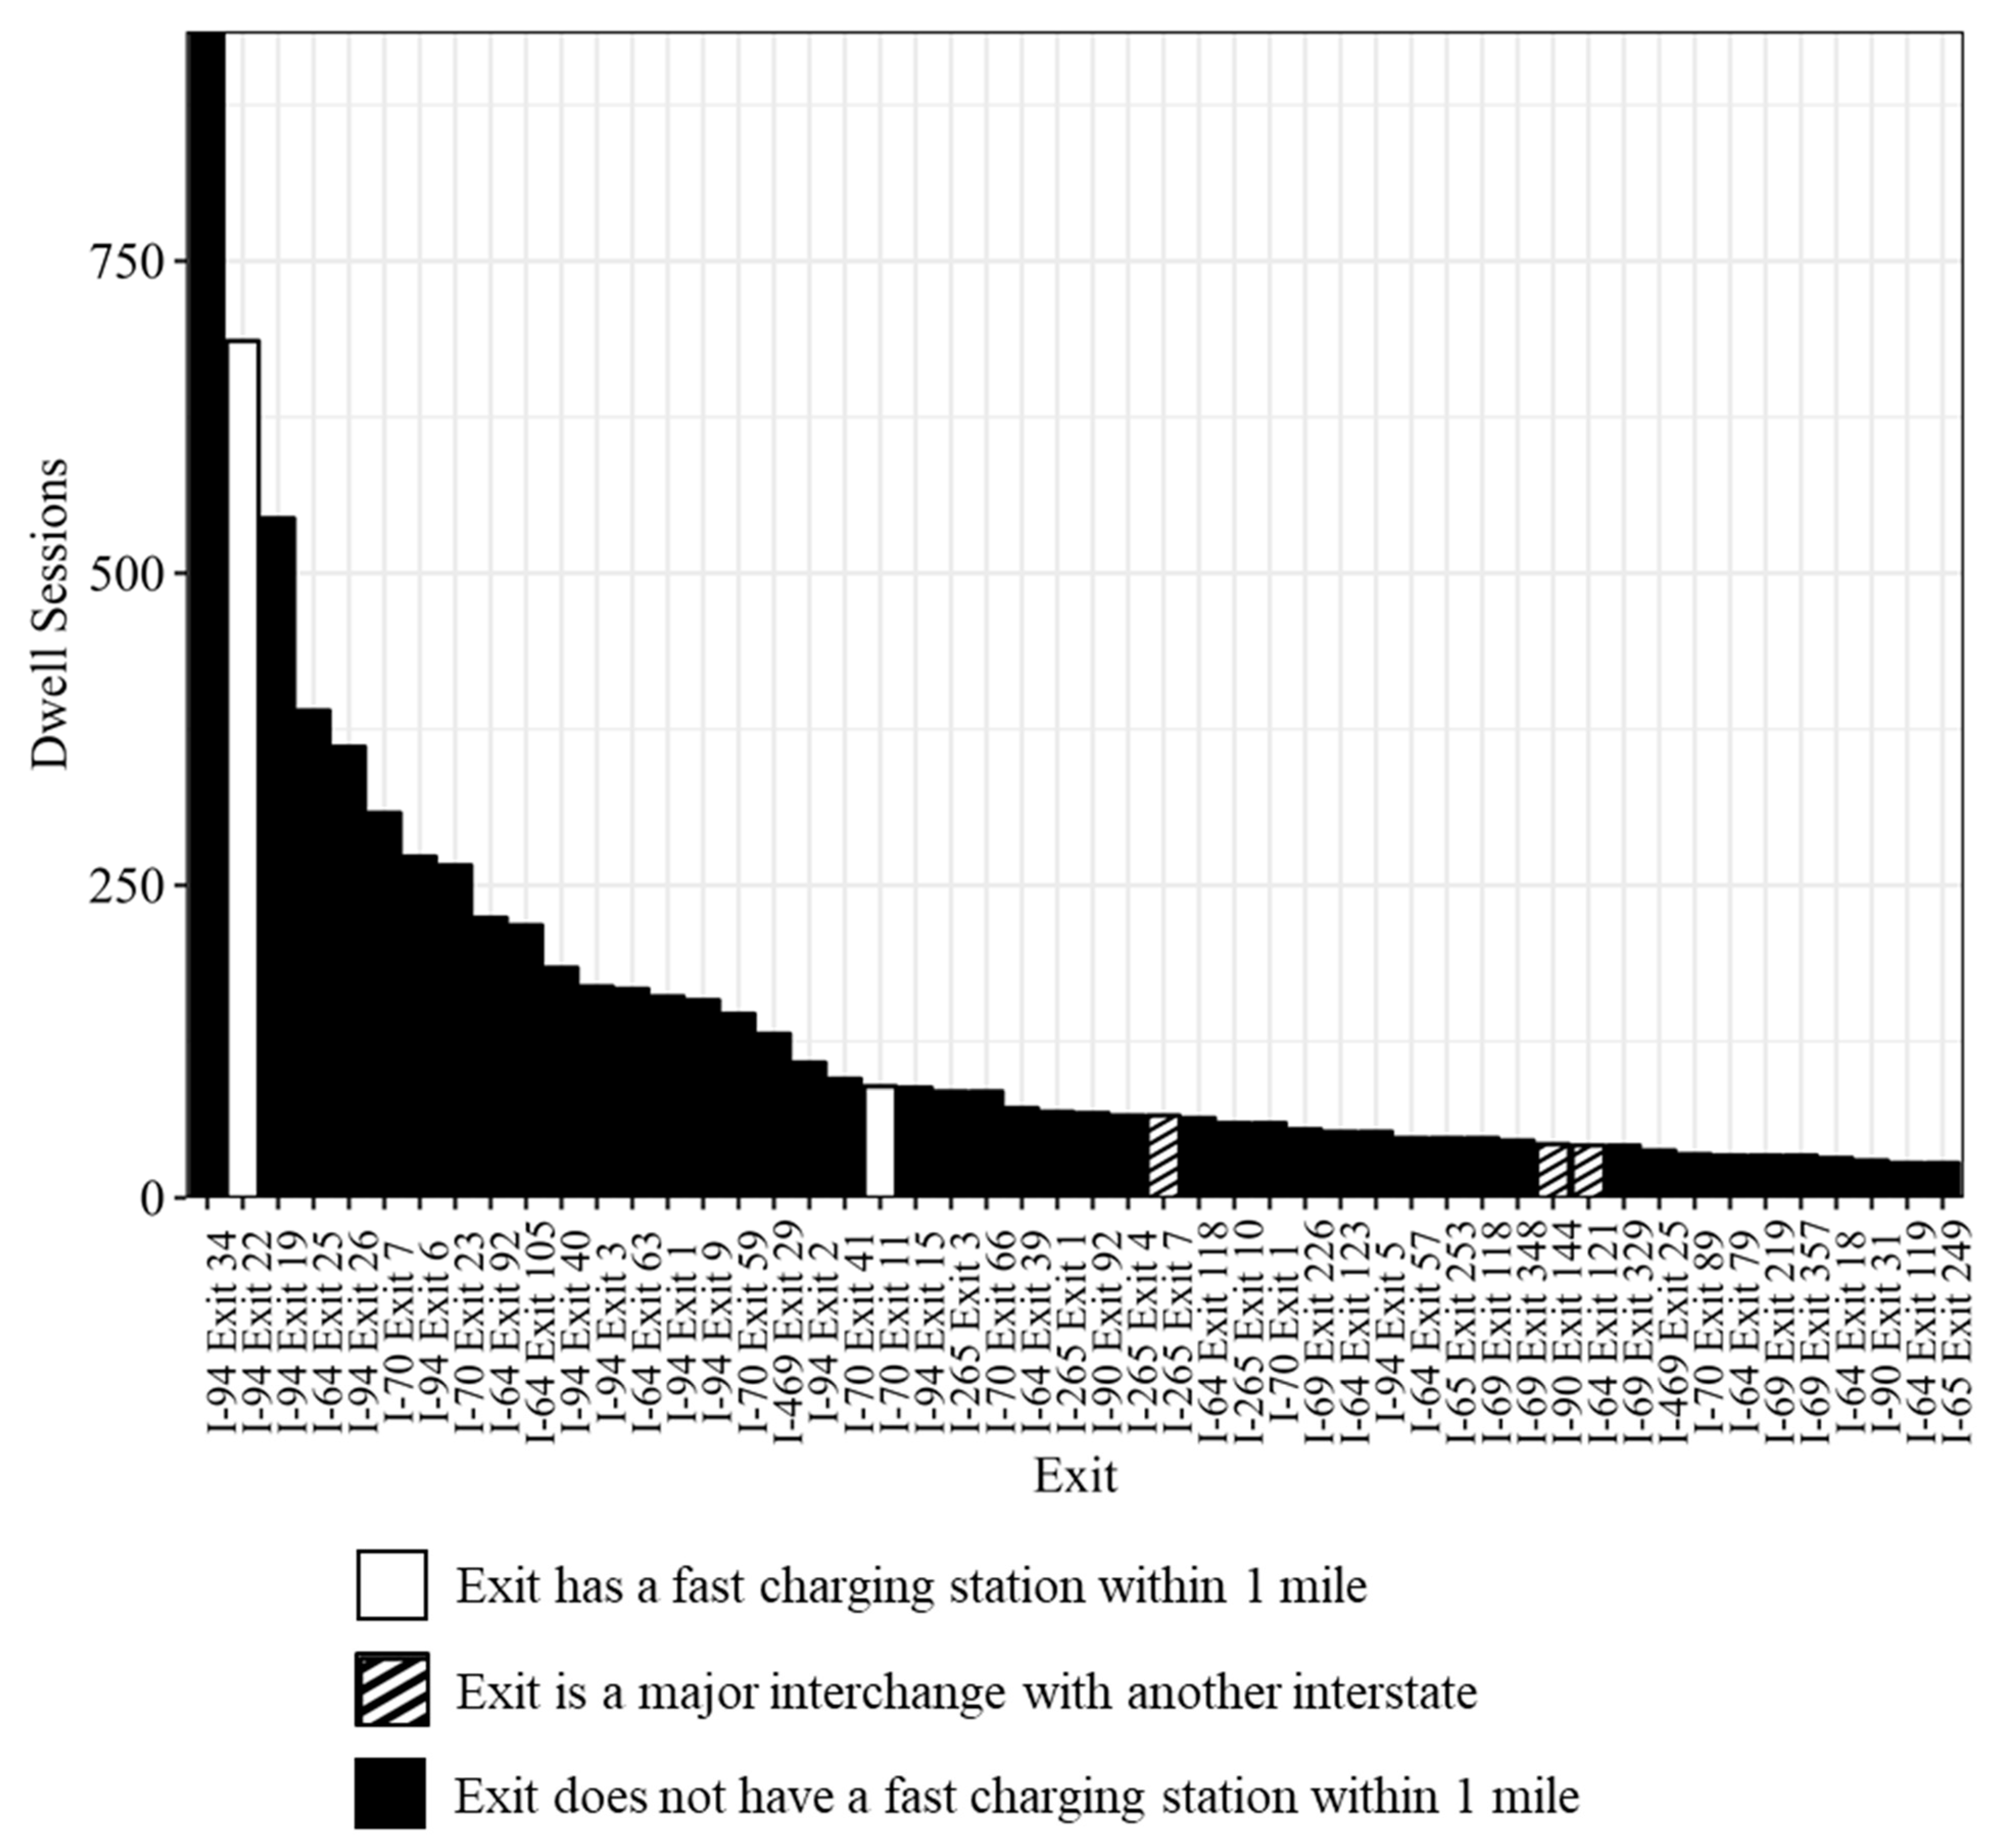
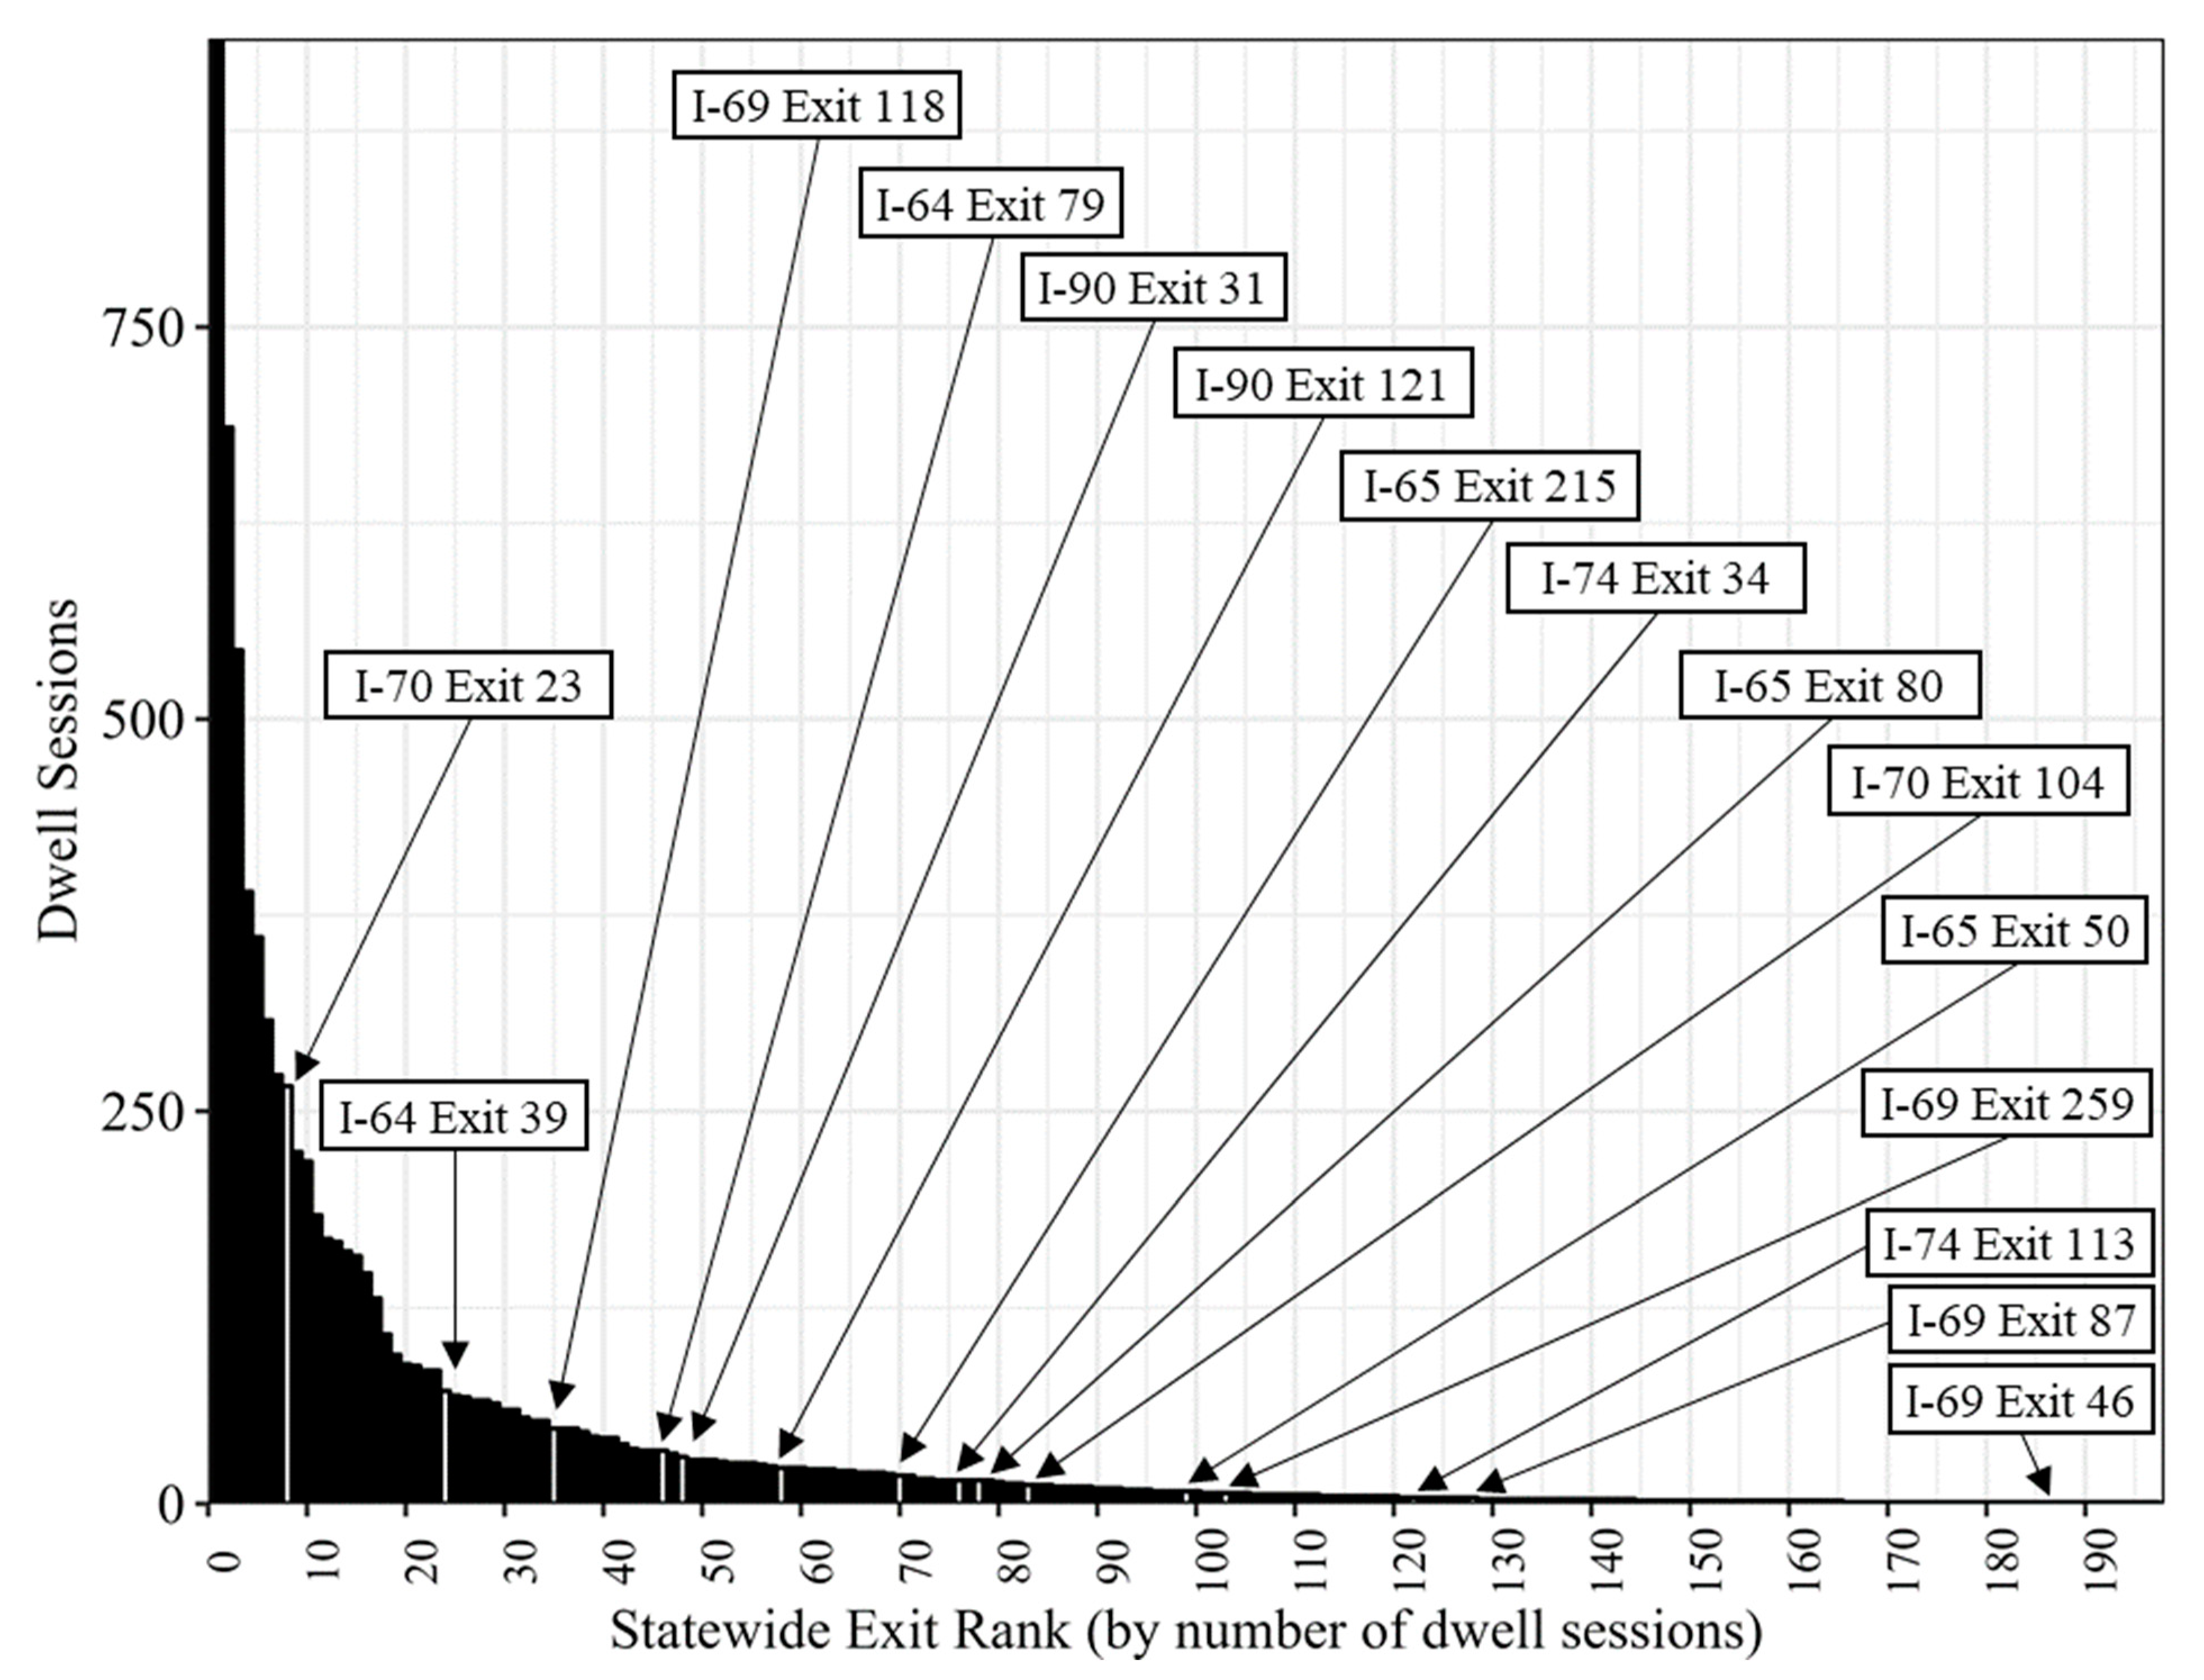
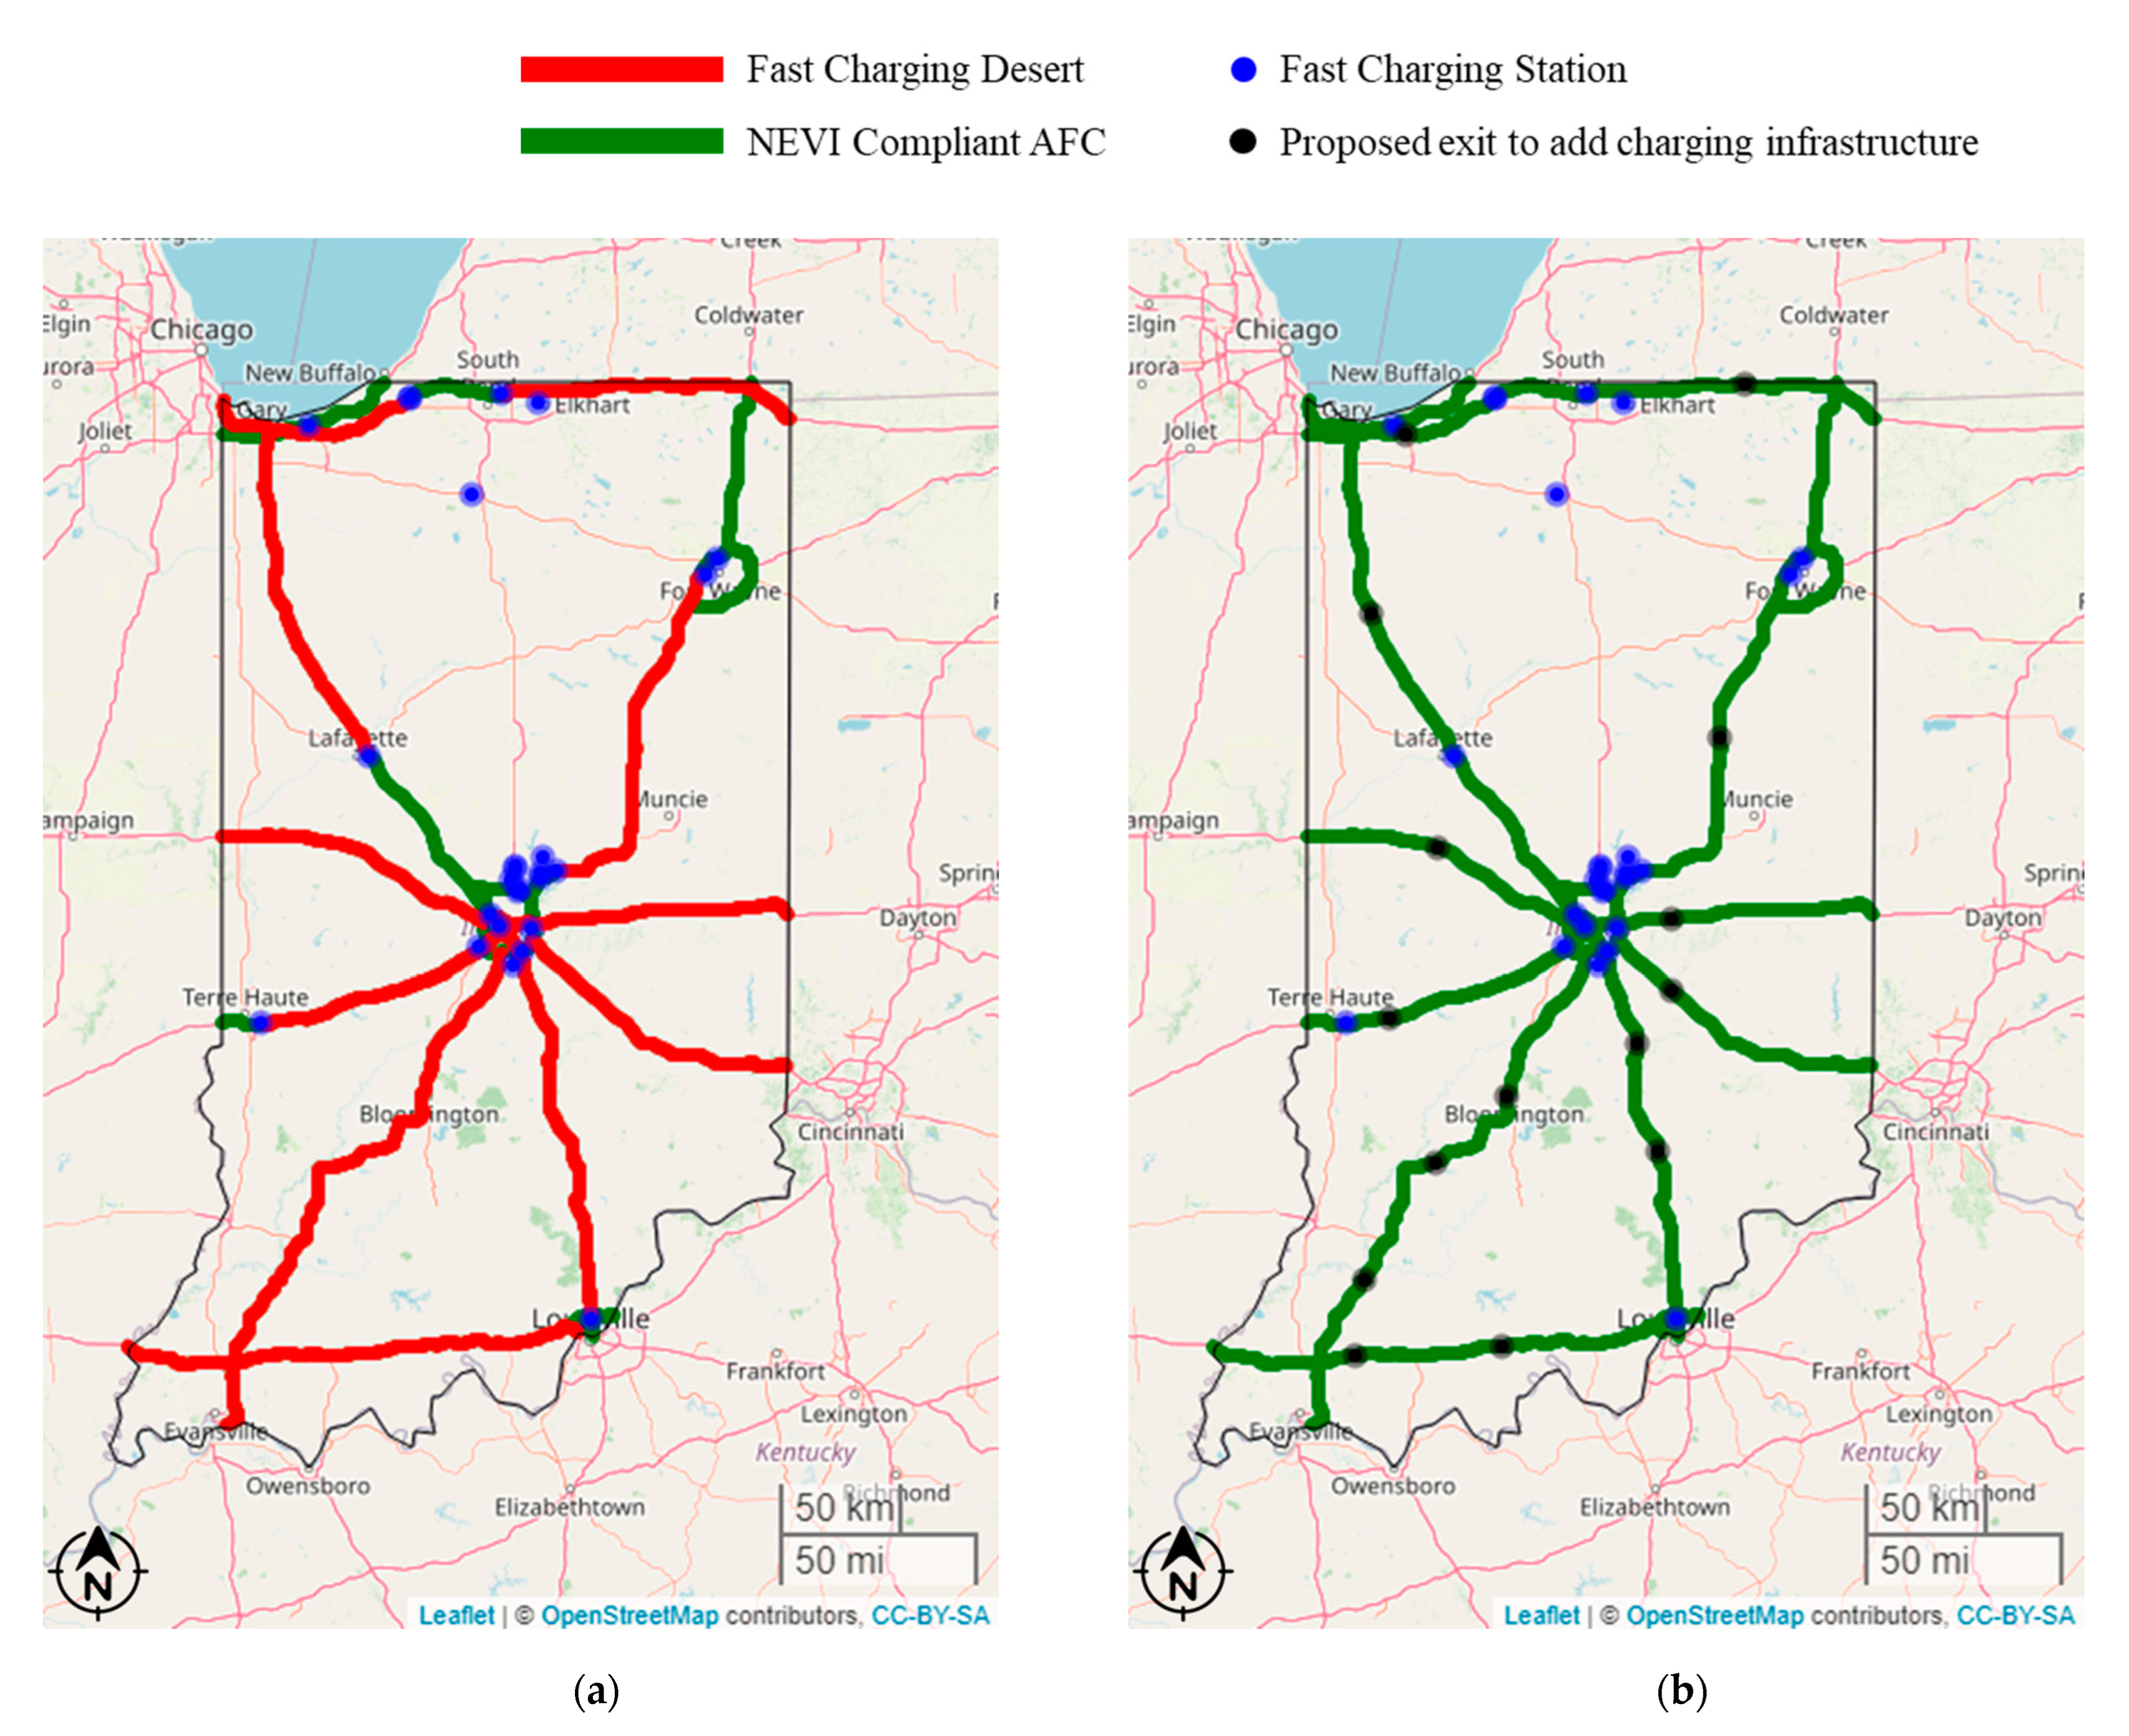
2.4. Proposed Exit Selection Methodology to Address Fast Charging Deserts
3. Conclusions
Author Contributions
Funding
Acknowledgments
Conflicts of Interest
References
- USDOT. President Biden, USDOT and USDOE Announce $5 Billion over Five Years for National EV Charging Network, Made Possible by Bipartisan Infrastructure Law|FHWA. Available online: https://highways.dot.gov/newsroom/president-biden-usdot-and-usdoe-announce-5-billion-over-five-years-national-ev-charging (accessed on 17 July 2022).
- The White House. FACT SHEET: The Biden-Harris Electric Vehicle Charging Action Plan. Available online: https://www.whitehouse.gov/briefing-room/statements-releases/2021/12/13/fact-sheet-the-biden-harris-electric-vehicle-charging-action-plan/ (accessed on 17 July 2022).
- The White House. FACT SHEET: Biden-Harris Administration Proposes New Standards for National Electric Vehicle Charging Network. Available online: https://www.whitehouse.gov/briefing-room/statements-releases/2022/06/09/fact-sheet-biden-harris-administration-proposes-new-standards-for-national-electric-vehicle-charging-network/ (accessed on 23 August 2022).
- The White House. FACT SHEET: Biden-Harris Administration Catalyzes More than $700 Million in Private Sector Commitments to Make EV Charging More Affordable and Accessible. Available online: https://www.whitehouse.gov/briefing-room/statements-releases/2022/06/28/fact-sheet-biden-harris-administration-catalyzes-more-than-700-million-in-private-sector-commitments-to-make-ev-charging-more-affordable-and-accessible/ (accessed on 23 August 2022).
- Kampshoff, P.; Kumar, A.; Peloquin, S.; Sahdev, S. America’s Electric-Vehicle Charging Infrastructure|McKinsey. Available online: https://www.mckinsey.com/industries/public-and-social-sector/our-insights/building-the-electric-vehicle-charging-infrastructure-america-needs (accessed on 18 July 2022).
- Tolbert, J. Beyond Cities: Breaking Through Barriers to Rural Electric Vehicle Adoption|Article|EESI. Available online: https://www.eesi.org/articles/view/beyond-cities-breaking-through-barriers-to-rural-electric-vehicle-adoption (accessed on 18 July 2022).
- Seattle, O.S.E. Removing Barriers to Electric Vehicle Adoption by Increasing Access to Charging Infrastructure. Alternative Fuel Toolkit. 2014. Available online: https://altfueltoolkit.org/resource/removing-barriers-to-electric-vehicle-adoption-by-increasing-access-to-charging-infrastructure/ (accessed on 9 August 2022).
- Desai, J.; Scholer, B.; Mathew, J.K.; Li, H.; Bullock, D.M. Analysis of Route Choice During Planned and Unplanned Road Closures. IEEE Open J. Intell. Transp. Syst. 2022, 3, 489–502. [Google Scholar] [CrossRef]
- Lambert, F. Global Market Share of Electric Cars More than Doubled in 2021 as the EV Revolution Gains Steam. Electrek. 2022. Available online: https://electrek.co/2022/02/02/global-market-share-of-electric-cars-more-than-doubled-2021/ (accessed on 9 August 2022).
- Hosseini, S.; Sarder, M. Development of a Bayesian Network Model for Optimal Site Selection of Electric Vehicle Charging Station. Int. J. Electr. Power Energy Syst. 2019, 105, 110–122. [Google Scholar] [CrossRef]
- Liu, H.-C.; Yang, M.; Zhou, M.; Tian, G. An Integrated Multi-Criteria Decision Making Approach to Location Planning of Electric Vehicle Charging Stations. IEEE Trans. Intell. Transp. Syst. 2019, 20, 362–373. [Google Scholar] [CrossRef]
- Lam, A.Y.S.; Leung, Y.-W.; Chu, X. Electric Vehicle Charging Station Placement: Formulation, Complexity, and Solutions. IEEE Trans. Smart Grid 2014, 5, 2846–2856. [Google Scholar] [CrossRef]
- Chen, T.D.; Kockelman, K.M.; Khan, M. Locating Electric Vehicle Charging Stations: Parking-Based Assignment Method for Seattle, Washington. Transp. Res. Rec. 2013, 2385, 28–36. [Google Scholar] [CrossRef]
- Kong, W.; Luo, Y.; Feng, G.; Li, K.; Peng, H. Optimal Location Planning Method of Fast Charging Station for Electric Vehicles Considering Operators, Drivers, Vehicles, Traffic Flow and Power Grid. Energy 2019, 186, 115826. [Google Scholar] [CrossRef]
- Mao, D.; Tan, J.; Wang, J. Location Planning of PEV Fast Charging Station: An Integrated Approach Under Traffic and Power Grid Requirements. IEEE Trans. Intell. Transp. Syst. 2021, 22, 483–492. [Google Scholar] [CrossRef]
- Huang, Y.; Kockelman, K.M. Electric Vehicle Charging Station Locations: Elastic Demand, Station Congestion, and Network Equilibrium. Transp. Res. Part D: Transp. Environ. 2020, 78, 102179. [Google Scholar] [CrossRef]
- Cai, H.; Jia, X.; Chiu, A.S.F.; Hu, X.; Xu, M. Siting Public Electric Vehicle Charging Stations in Beijing Using Big-Data Informed Travel Patterns of the Taxi Fleet. Transp. Res. Part D Transp. Environ. 2014, 33, 39–46. [Google Scholar] [CrossRef]
- Speidel, S.; Bräunl, T. Driving and Charging Patterns of Electric Vehicles for Energy Usage. Renew. Sustain. Energy Rev. 2014, 40, 97–110. [Google Scholar] [CrossRef]
- Carlton, G.J.; Sultana, S. Electric Vehicle Charging Station Accessibility and Land Use Clustering: A Case Study of the Chicago Region. J. Urban Mobil. 2022, 2, 100019. [Google Scholar] [CrossRef]
- Desai, J.; Mathew, J.K.; Li, H.; Bullock, D.M. Analysis of Electric and Hybrid Vehicle Usage in Proximity to Charging Infrastructure in Indiana. J. Transp. Technol. 2021, 11, 577–596. [Google Scholar] [CrossRef]
- Alternative Fuels Data Center: National Electric Vehicle Infrastructure (NEVI) Formula Program. Available online: https://afdc.energy.gov/laws/12744 (accessed on 18 July 2022).
- Hunter, M.; Mathew, J.; Cox, E.; Blackwell, M.; Bullock, D. Estimation of Connected Vehicle Penetration Rate on Indiana Roadways. JTRP Affil. Rep. 2021, 37. [Google Scholar] [CrossRef]
- Desai, J.; Mathew, J.K.; Li, H.; Bullock, D.M. Using Connected Vehicle Data for Assessing Electric Vehicle Charging Infrastructure Usage and Investment Opportunities. Inst. Transp. Eng. ITE J. 2022, 92, 22–31. [Google Scholar]
- Vukovic, T. Hilbert-Geohash—Hashing Geographical Point Data Using the Hilbert Space-Filling Curve. Master’s Thesis, NTNU, Trondheim, Sweden, 2016. [Google Scholar]
- NREL. Alternative Fuel Stations API|NREL: Developer Network. Available online: https://developer.nrel.gov/docs/transportation/alt-fuel-stations-v1/ (accessed on 18 July 2022).


| Route | Top Three Exits with Dwell Sessions | ||||||||
|---|---|---|---|---|---|---|---|---|---|
| First | Second | Third | |||||||
| Exit | NDS | MDT (h) | Exit | NDS | MDT (h) | Exit | NDS | MDT (h) | |
| I-64 | 25 | 390 | 0.18 | 92 | 224 | 0.18 | 105 | 218 | 0.20 |
| I-65 | 253 | 48 | 0.51 | 249 | 28 | 1.32 | 259 | 26 | 0.83 |
| I-69 | 226 | 55 | 0.41 | 118 | 48 | 0.39 | 348 | 46 | 0.16 |
| I-70 | 7 | 308 | 0.21 | 23 | 266 | 0.18 | 59 | 147 | 0.16 |
| I-74 | 4 | 24 | 0.33 | 164 | 21 | 0.45 | 169 | 16 | 1.23 |
| I-90 | 92 | 68 | 0.69 | 144 | 43 | 0.20 | 31 | 30 | 0.17 |
| I-94 | 34 | 934 | 0.19 | 22 | 686 | 0.16 | 19 | 544 | 0.17 |
| I-265 | 3 | 85 | 0.88 | 1 | 69 | 0.42 | 4 | 66 | 0.53 |
| I-469 | 29 | 131 | 1.27 | 25 | 38 | 0.82 | 19 | 20 | 0.70 |
| Route | Exit | Corridor Rank | Statewide Rank | NDS | MDT (h) |
|---|---|---|---|---|---|
| I-64 | 39 | 5 | 24 | 72 | 0.16 |
| 79 | 10 | 46 | 34 | 0.15 | |
| I-65 | 50 | 13 | 98 | 8 | 0.58 |
| 80 | 9 | 78 | 15 | 1.17 | |
| 215 | 7 | 70 | 18 | 0.15 | |
| I-69 | 46 | 42 | 187 | 1 | 0.11 |
| 87 | 27 | 127 | 4 | 0.17 | |
| 118 | 2 | 35 | 48 | 0.39 | |
| 259 | 22 | 102 | 7 | 0.22 | |
| I-70 | 23 | 2 | 8 | 266 | 0.18 |
| 104 | 12 | 83 | 12 | 0.29 | |
| I-74 | 34 | 4 | 76 | 15 | 0.20 |
| 113 | 6 | 121 | 4 | 0.32 | |
| I-90 | 31 | 3 | 48 | 30 | 0.17 |
| 121 | 4 | 58 | 23 | 0.30 |
Publisher’s Note: MDPI stays neutral with regard to jurisdictional claims in published maps and institutional affiliations. |
© 2022 by the authors. Licensee MDPI, Basel, Switzerland. This article is an open access article distributed under the terms and conditions of the Creative Commons Attribution (CC BY) license (https://creativecommons.org/licenses/by/4.0/).
Share and Cite
Desai, J.; Mathew, J.K.; Li, H.; Bullock, D.M. Leveraging Connected Vehicle Data to Assess Interstate Exit Utilization and Identify Charging Infrastructure Investment Allocation Opportunities. World Electr. Veh. J. 2022, 13, 167. https://doi.org/10.3390/wevj13090167
Desai J, Mathew JK, Li H, Bullock DM. Leveraging Connected Vehicle Data to Assess Interstate Exit Utilization and Identify Charging Infrastructure Investment Allocation Opportunities. World Electric Vehicle Journal. 2022; 13(9):167. https://doi.org/10.3390/wevj13090167
Chicago/Turabian StyleDesai, Jairaj, Jijo K. Mathew, Howell Li, and Darcy M. Bullock. 2022. "Leveraging Connected Vehicle Data to Assess Interstate Exit Utilization and Identify Charging Infrastructure Investment Allocation Opportunities" World Electric Vehicle Journal 13, no. 9: 167. https://doi.org/10.3390/wevj13090167
APA StyleDesai, J., Mathew, J. K., Li, H., & Bullock, D. M. (2022). Leveraging Connected Vehicle Data to Assess Interstate Exit Utilization and Identify Charging Infrastructure Investment Allocation Opportunities. World Electric Vehicle Journal, 13(9), 167. https://doi.org/10.3390/wevj13090167