Article

Method of Location and Capacity Determination of Intelligent Charging Pile Based on Recurrent Neural Network

College of Metallurgy and Automotive Engineering, Shandong Vocational College of Industry, Zibo 255000, China
World Electr. Veh. J. 2022, 13(10), 186; https://doi.org/10.3390/wevj13100186
Submission received: 18 August 2022 / Revised: 9 September 2022 / Accepted: 28 September 2022 / Published: 3 October 2022
(This article belongs to the Special Issue Charging Infrastructure for EVs)

Abstract

:
With the popularity of new energy vehicles, a large number of cities began to focus on the installation of electric vehicle charging piles. However, the existing intelligent charging piles have faced problems such as short supply, unreasonable distribution areas, and insufficient power supply. In response to these problems, this research proposes a recurrent neural network algorithm with an integrated firefly algorithm. Based on these two algorithms, a charging pile location and capacity model was established, and users’ travel habits were analyzed according to the model. In the simulation experiment, the PR curve analysis of the algorithm was carried out first. The analysis results showed that the AP value of the recurrent neural network algorithm combined with the firefly algorithm was increased from 0.9324 to 0.9972. In addition, it had higher accuracy and stability than before, which also verified the feasibility of the algorithm. Finally, through the model, the user’s travel habits were analyzed in detail. From the perspective of total demand, the charging demand of commercial centers was the highest, with a peak of about 537 kw, followed by 501 kw in office areas and then about 379 kw in parks. The kw charging demand in other areas was below 200 kw. The above results show that the recursive neural network can effectively determine the location and capacity of the charging pile, which is of great value to the development of transportation and new energy.

1. Introduction

In the early stages, the artificial neural network (ANN) was proposed in order to simulate the way the human brain processes information. This technology is a network model abstracted based on human brain neurons [1]. Neural networks can autonomously learn the characteristics of data, process images, make predictions, and more. On the basis of the ANN algorithm, the recursive neural network (RNN) was born. The algorithm has a tree-like structure and is named because each network node recurses in order according to the corresponding input information [2]. In general, recurrent neural networks can be divided into two categories: temporal recurrent neural networks (TRNNs) and structural recurrent neural networks (SRNN). Since the development of this algorithm, it has been used in many fields, such as information processing, image recognition, and building site selection. Additionally, through previous research, it was found that the algorithm has high accuracy, as well as strong practicability and work efficiency [3].
While the global GDP continues to rise, motor vehicle ownership is also rising rapidly. On the one hand, it has led to the development of oil, steel, and other industries, but on the other hand, the environment has paid the price. Currently, the international energy supply is tight, and the domestic energy price remains high. Furthermore, air pollution, climate change, and other issues are emerging one after another. According to statistics, the carbon emission caused by fuel vehicles occupies the first place in various carbon emission sources [4]. Especially in developed countries such as Europe and the United States, the carbon emissions of fuel vehicles account for about 55% of the total emissions. Currently, energy saving and emission reduction have become prevalent global topics. With the strengthening of people’s awareness of environmental protection, research on new energy in recent years is in full swing. With the advancement of technology, electric vehicles are slowly occupying the market of traditional fuel vehicles. Compared with traditional fuel vehicles, electric vehicles have lower power consumption, do not pollute the environment, and have more advantages in terms of price. Comparable to gas stations, electric vehicles rely on smart charging stations for their battery life. The development of electric vehicles is affected to a certain extent by the layout of charging piles. Data shows that the number of charging piles that have been put into use is less than a quarter of that of electric vehicles, and the distribution locations are extremely unreasonable [5]. Therefore, the site selection and relocation of charging piles are particularly important.
There are four parts in this study. Firstly, Section 2 presents the current status of research at home and abroad. The recurrent neural network algorithm and the firefly algorithm are introduced, and the model is established on the basis of the fusion of the two algorithms in Section 3. In Section 4, the proposed algorithm is tested and analyzed, and the basic information of the charging pile is obtained through the model. Finally, the site selection and capacity determination of charging piles are realized.

2. Related Works

With the development of Internet technology, recurrent neural networks have been used in many fields. Veeramsetty Venkataramana et al. proposed a combination of recurrent neural network and principal component analysis techniques when performing short-term power load forecasting. The results showed that this method could accurately predict the load under the condition of dimensionality reduction of the input data, thereby minimizing the overall computation [6]. Gonzalez Jesús proposed a very efficient recursive neural network algorithm in time series to accurately predict the characteristics of the next earthquake during geological research. The experimental results show that the time series recursive neural network algorithm lock has significant prediction ability [7]. In order to optimize the design of mirror evolution, Zhang Xinyong introduced a recurrent neural network method based on the Bayesian regularization algorithm. The results showed that the prediction model established by this method had a greater improvement in accuracy than before optimization and could perform efficient and accurate searches for multi-objective optimization [8]. Gao Yunfei was looking for biomarkers in order to better estimate the age of the subjects. A recurrent neural network was introduced for modeling and analysis. The simulation results showed that the correlation between the predicted age and actual age obtained by the established model in all test samples was above 0.91 [9]. Wang Guancheng et al. proposed a bounded recurrent neural network method when they studied an efficient solution method for the dynamic Lyapunov equation. The results showed that the method could be effectively used in the solution of the Lyapunov equation and exhibited good robustness and convergence [10].
In order to optimize the charging and discharging problem of complex intelligent charging piles, Long G et al. introduced a multi-objective automatic scheduling algorithm for the charging and discharging of electric vehicle charging piles based on automatic power monitoring and control. The experimental results showed that the algorithm realized an optimization of the automatic scheduling of charging piles and greatly improved the efficiency of charging and discharging [11]. Liu W et al. introduced the genetic algorithm and combined the linear weighting method function when they studied the charging pile location problem. Simulation experiments showed that this method could effectively select an optimal location and finally confirmed the feasibility of this method [12]. Hosseini S and others put forward a search strategy based on Bayesian network in order to obtain the optimal location of electric vehicle charging station. Experimental results showed that this method provided a site selection scheme for making friends and provided a new research perspective [13]. Rajani B et al. proposed an enhanced recurrent neural network to analyze the optimal management between the electric vehicle charging station and the power distribution system. The experimental results showed that the method comprehensively considered the land cost and power station equipment and maintenance cost and verified its efficient performance [14]. In order to optimize the layout of airport charging piles, Gao J et al. used a genetic algorithm to establish an airport charging pile model. The simulation experiment shows that the method determines the final scheme of the airport charging pile, and proves the feasibility and effectiveness of the model [15]. Through previous research, it was found that recurrent neural networks, as a kind of artificial neural network, have achieved good application effects in a large number of fields. A small number of scholars have also applied it to the constant volume of electric vehicle charging piles. Although they have achieved certain results, further research is needed.

3. Location and Capacity of Intelligent Charging Pile Based on RNN Algorithm

3.1. Subsection

Recurrent neural networks can be divided into two categories: time recurrent neural network (TRNN) and structural recurrent neural network (SRNN) [16,17,18]. The proposed recurrent neural network has a strong memory function and can operate the input data sequence orderly. The network structure is shown in Figure 1.
As shown in Figure 1, the recurrent neural network structure is mainly composed of three layers: the input layer, the internal representation layer, and the output layer. The internal representation layer includes a self-feedback module. Different from the traditional neural network, the recurrent neural network is built entirely based on the structure of the neurons in the human brain. Due to the complexity of the human mind, there are a lot of loops between each step. Considering the actual situation of the structure, in the recurrent neural network structure, the loop is only performed in the inner representation layer [18,19,20,21]. Recurrent neural networks must take into account changes in time in the description process, and different variables must be discussed in the same time dimension.
At the time t = 0 , the matrix of the ownership values is randomly weighted, and the state of the internal representation layer is obtained as shown in Equation (1).
h 1 = f ( U x 1 + W h 0 )
In Formula (1), h 1 represents the state function of the internal representation layer, W represents the feedback loop of the internal representation layer node, and the weight matrix U represents the relationship between the input layer and the internal representation layer. The output data of the output layer is shown in Formula (2).
O 1 = g ( V h 1 )
In Formula (2), O 1 represents the output data of the network and V represents the weight matrix between the internal representation layer and the output layer. According to the above relationship, t , t 1 , a functional relationship is generated with the state function at two moments, as shown in Formulas (3) and (4).
h x = f ( U x t + W h t 1 )
O t = g ( V h t )
From the mechanism and steps of the recurrent neural network algorithm, it can be seen that there are several major characteristics at runtime. First, the input time of the recurrent neural network is not static, and the length of time can be changed according to the situation. Additionally, the weight matrix is also obtained according to the continuous change of time. The weight matrix at each t moment is consistent, that is, the weight matrix can be used from that moment to any subsequent moment. Second, the recurrent neural network will not forget the previous data during the operation, that is, the current state still contains the previous state, which is the memory of the recurrent neural network. Third, recurrent neural networks have strong learning ability, are extremely tolerant of data, and can accept discontinuous information [22,23]. From the structure and characteristics of the recurrent neural network, it can be seen that it has a strong advantage in processing time series data and can learn autonomously according to the data characteristics. However, the algorithm also has certain defects. The structure of the algorithm is relatively simple, and the algorithm is completely dependent on a method similar to BP neural network for calculation. Such a structure has great disadvantages, the most important of which is that it is easy to fall into a local optimal solution when faced with more complex data [24,25,26]. The data on the location and capacity determination of intelligent charging piles are complex, so it cannot be studied with a single recurrent neural network algorithm. This research and processing introduce the integration of the firefly algorithm and the recurrent neural network algorithm to better solve the problem of the location and capacity of charging piles.

3.2. Firefly Algorithm and Its Application Characteristics

The firefly algorithm was inspired by the fact that when fireflies fly in the wild, they determine their flight direction according to the strength of other individuals’ flashes. Each firefly in the group is randomly distributed in the set solution space, and the fitness value of each individual is calculated according to the position of each firefly. The brighter the firefly, the more individuals will be attracted to it. If no brighter individual firefly is detected, the flight path will be randomly selected until a brighter firefly is found [27,28,29].
In the process of fireflies gathering, the fireflies with higher relative fitness values tend to have higher brightness, thus occupying a better position in the space and attracting other fireflies toward it. The position of the firefly is shown in Formula (5).
x i n e w = x i o l d + β i j ( r i j ) ( x j o l d x i o l d ) + α ξ i
Equation (5), x i n e w represents i in a new position generated when β i j ( r i j ) ( x j o l d x i o l d ) a firefly is attracted by a firefly with a higher brightness. In addition, j represents a quantitative representation of the firefly’s influence α ξ i on the firefly in i position, representing a random movement of the firefly. Where α [ 0 , 1 ] is a random constant ξ i representing a random vector determined by a Gaussian or uniform distribution. Where β i j represents i , j the attraction function of fireflies when they are attracted by fireflies with higher brightness, as shown in Equation (6).
β i j ( r i j ) = β 0 e γ r i j 2
In Formula (6), β 0 represents that r i j = 0 , i fireflies were attracted by fireflies with higher brightness at that time j and γ represents the characteristics of the attractive changes of the two fireflies, which directly determines the optimization ability and convergence speed of the algorithm. Where r i j represents i , j theEuclid distance between two fireflies, as shown in Formula (7).
r i j = x i x j = ( k = 1 d ( x i k x j k ) 2 ) 1 2
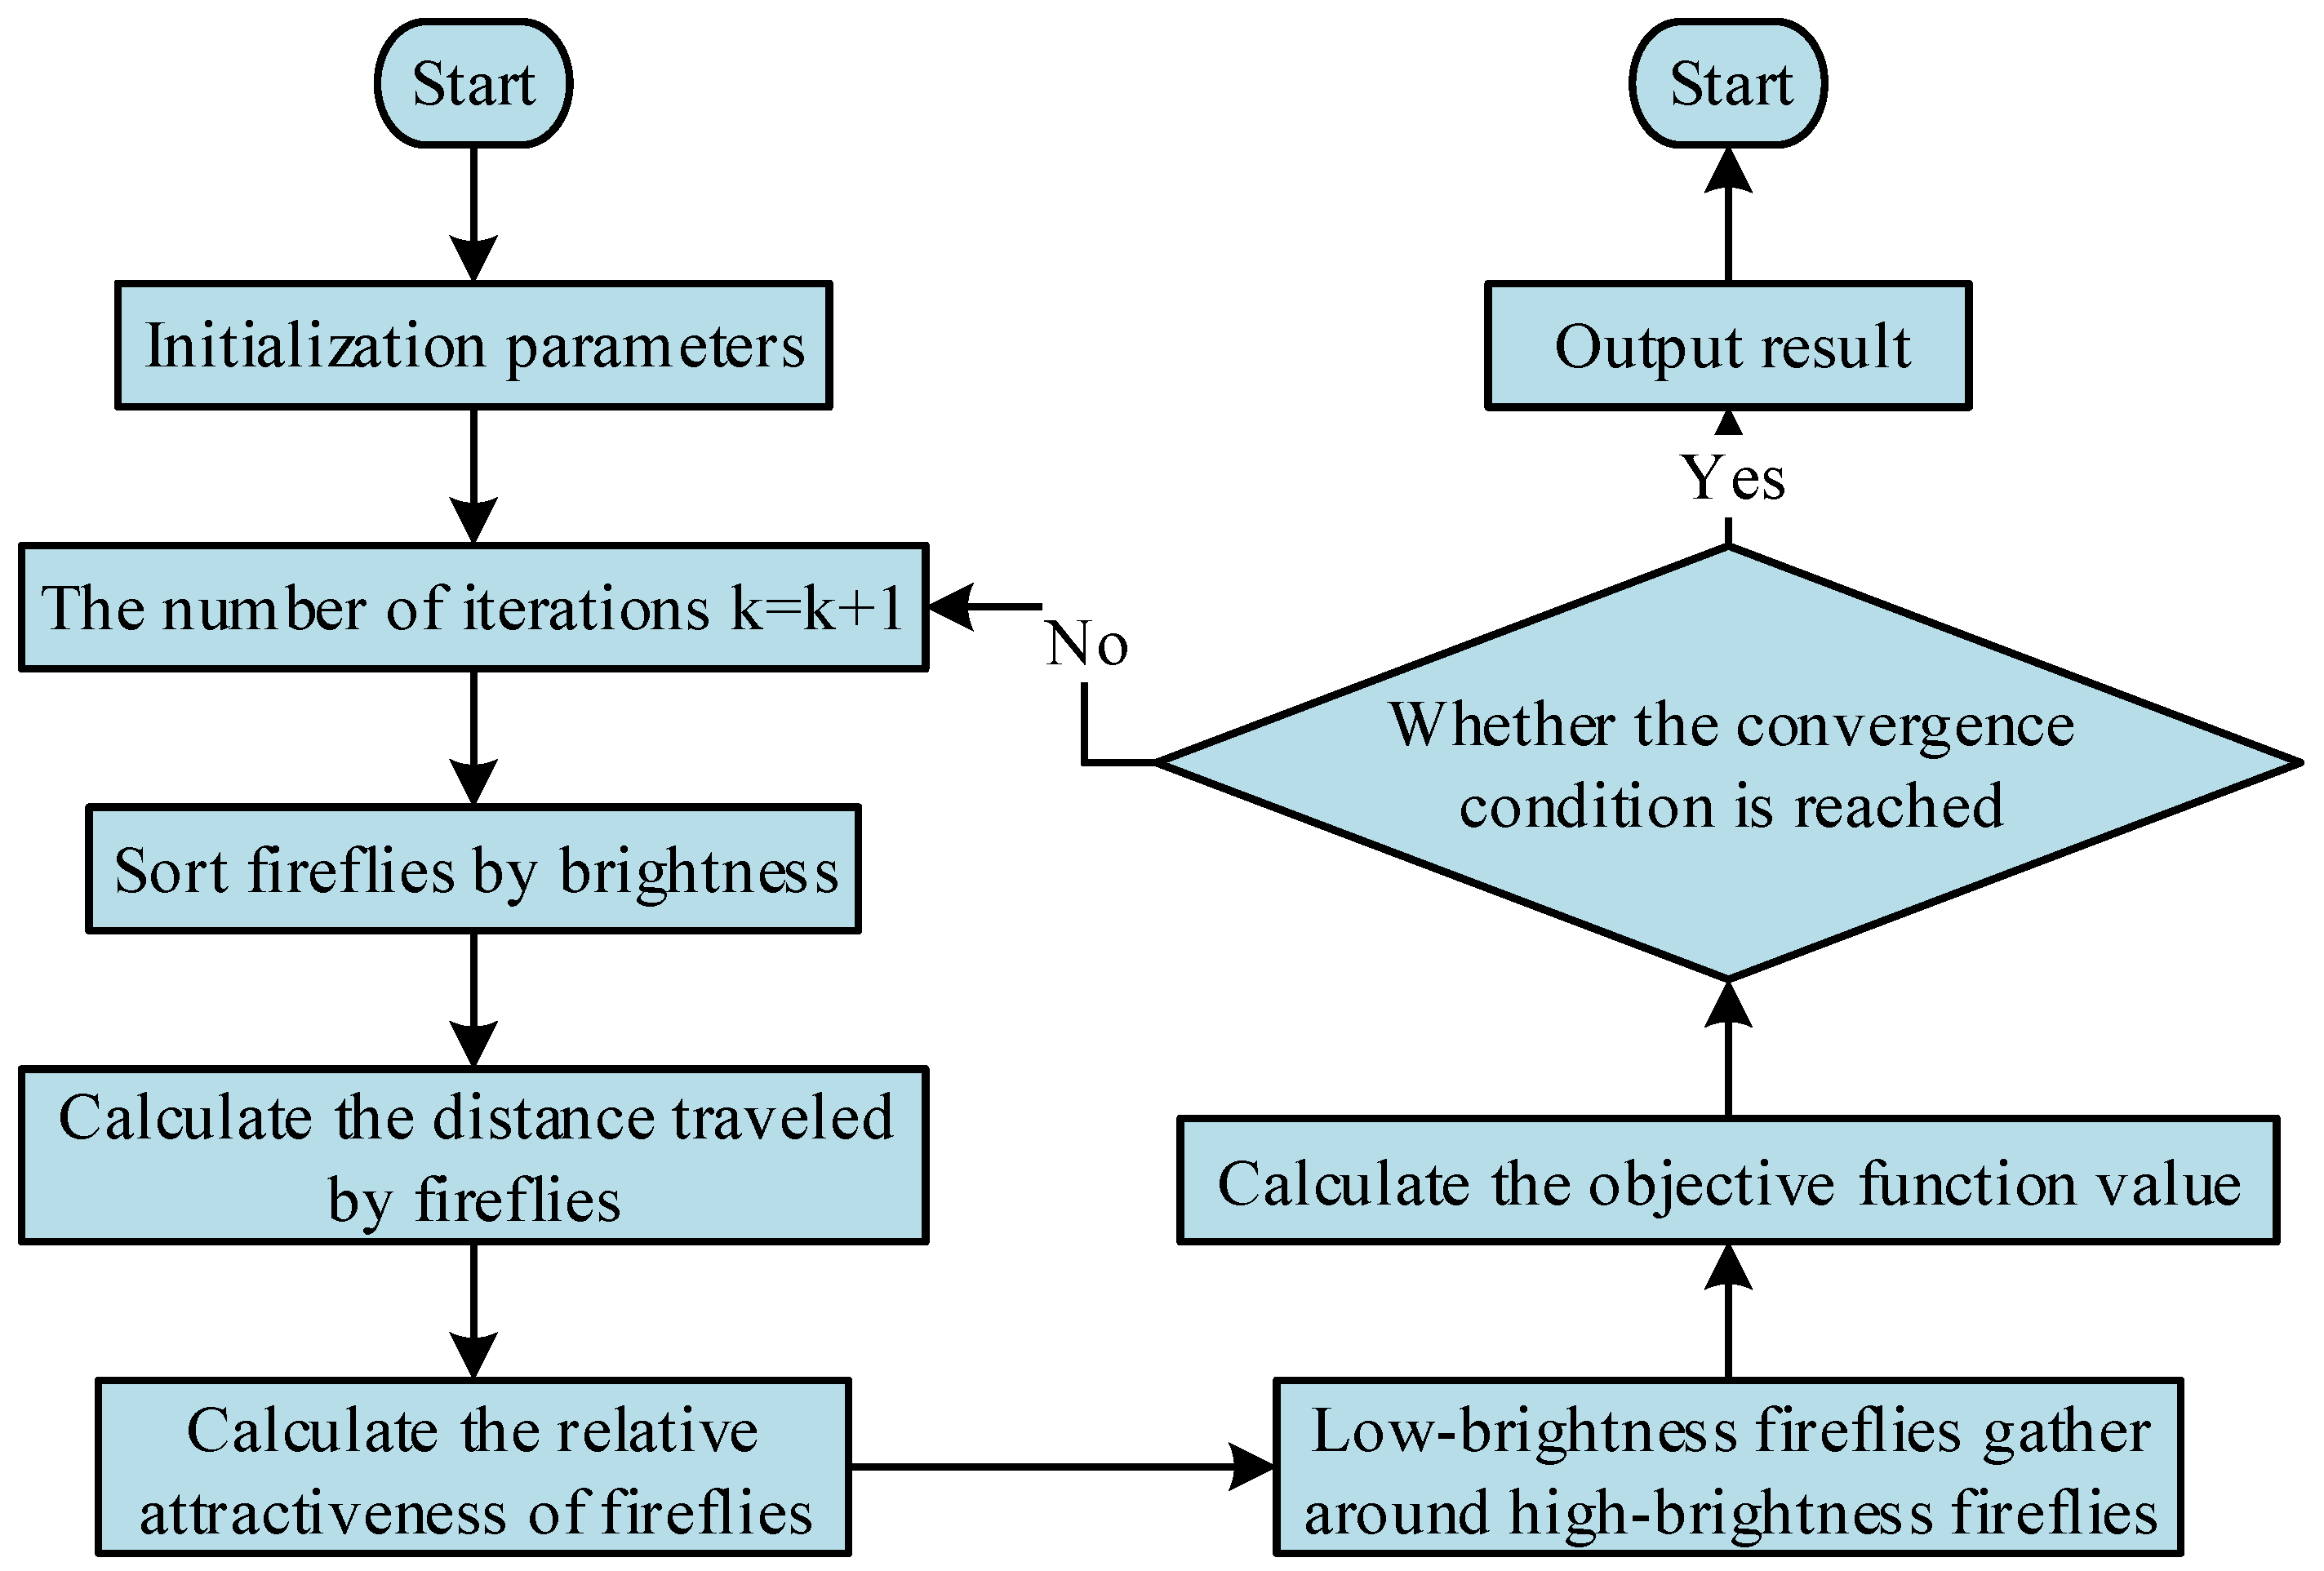
In Formula (7), thetwo vectors x i , x j represent the positions of the two fireflies, respectively, and the dimension of the vectors is d , Which represented by the two position coordinates x i k , x j k . x i k , x j k respectively represent i the position coordinates of the fireflies x i and j the position coordinates of the fireflies x j in the first k dimension. The specific process of the firefly algorithm is shown in Figure 2.
As shown in Figure 2, when the firefly algorithm is running, it first initializes the parameters and their position coordinates to determine the initial solution value in the search space. Then, the brightness of all fireflies in the group is sorted, and the moving direction of the fireflies is determined by the brightness relationship. Then the mutual attraction between the fireflies is calculated, which is proportional to the distance. Finally, the objective function value is calculated according to the position coordinates of all the fireflies after moving, and then it is judged whether the convergence condition is reached. If it is reached, the optimal result will be an output. Otherwise, it will continue to iterate until the convergence condition is reached, and the loop will end [30,31,32].
There is a similar problem in the issue of location and volume of intelligent charging piles for electric vehicles, which also requires a quick call between charging piles and charging piles, which is similar to the operating principle of the firefly algorithm. The location of the charging pile can be selected at the location where the fireflies gather, and the number of fixed volumes is determined according to the number of fireflies gathered there. Therefore, the firefly algorithm and the recurrent neural network algorithm can be combined to solve the problem of charging pile location and capacity.

3.3. Firefly Algorithm and Its Application Characteristics

The setting of charging piles needs to consider not only the needs of customers but also economic benefits. The development of any industry must rely on good economic benefits, so the economic cost must be considered first when establishing the charging pile location and capacity model. When selecting the location and capacity of intelligent charging piles, it is necessary to comprehensively consider factors such as construction cost, maintenance cost, power purchase cost, etc., and the use of a recurrent neural network. After the comprehensive multi-factor analysis of the algorithm and the firefly algorithm, the optimal planning objective function of the charging pile is shown in Formula (8).
min C = i = 1 N ( C 1 i + C 2 i + C 3 i + C 4 i + C 5 i )
In Formula (8), C represents the cost of one year of charging piles in each operation cycle and N represents the number of charging piles located in the area. In addition, C 1 i represents i the annual consumption of the investment of the charging pile and the cost C 2 i of maintaining the charging pile every year i . Finally, C 3 i represents i the annual electricity consumption of C 4 i the charging pile, the electricity cost consumed by the user between the round trip of the charging pile, and C 5 i represents other construction costs. Among these, the annual investment cost consumption of charging piles is shown in Formula (9).
C 1 i = ( e i a + m i b + c i ) r 0 ( 1 + r 0 ) z ( 1 + r 0 ) z 1
In Formula (9), e i represents the number of transformers that need to be matched with the a charging pile, and i represents theunit price of the transformer. Furthermore, c i indicates i the infrastructure construction cost of the m i charging pile, the i number of motors required for b the charging pile, and the unit price of the motor. Lastly, r 0 represents the discount probability of the charging pile, and z represents the number of years of normal use of the charging pile i without man-made damage.
The maintenance and repair costs of intelligent charging piles are mainly composed of staff costs, equipment operation, equipment maintenance, equipment wear, and so on. The maintenance and repair cost cannot be calculated accurately, so it needs to be calculated according to a certain conversion ratio. The annual operating cost of the smart charging pile is shown in Formula (10).
C 2 i = ( e i a + m i b + c i ) η
In Formula (10), η represents the operating cost conversion ratio. The electricity consumption cost of the smart charging pile is shown in Formula (11).
C 3 i = e i ( C F e + C C u ) T v 365 p 0 + m i ( C L + C D ) k i T v 365 p 0
In Formula (11), C F e represents the steel consumption required by the C C u self-made transformer and the copper consumption required by the self-made transformer. In addition, T v represents the charging time of the smart charging pile for one day and p 0 represents the unit price of electricity purchased from the grid. Lastly, C L and C D represent the power loss of the line between the charging piles and the loss of the motor itself, and k represents the simultaneous rate of the motor. If each intelligent charging pile needs to build two auxiliary roads, i the auxiliary road construction fee and other infrastructure construction costs required by the charging pile are shown in Formula (12).
C 4 i = 2 ξ g l i r 0 ( 1 + r 0 ) z ( 1 + r 0 ) z 1
In Formula (12), ξ g and l i , respectively, represent the cost required for each kilometer of road and the required construction length of auxiliary roads. There is also a lot of cost on the way for users to and from the charging pile, and the cost on the way to and from the charging pile is shown in Formula (13).
C 5 i = ( h 1 + h 2 )
In Formula (13), h 1 and h 2 , respectively, represent the power loss and other indirect losses during the round trip. Among them, the loss cost and other indirect loss costs caused by idling are shown in Equations (14) and (15).
h 1 = ( L i c a r g c a r + L i b u s g b u s ) 365 p
h 2 = ( L i c a r v c a r + L i b u s v b u s ) 365 k
In Formula (14), p represents the electric vehicle charging unit price, L i c a r and L i b u s represent the distance that the electric vehicle needs to travel from the intersection to the charging pile, and g c a r and g c a r represent the mileage per unit of electricity. In Formula (15), v c a r and v b u s represent the average driving speed of the electric vehicle, and k represents the user’s travel time value. The driving distance is shown in Formula (16).
{ L i c a r = d i j q j c a r L i b u s = d i j q j b u s
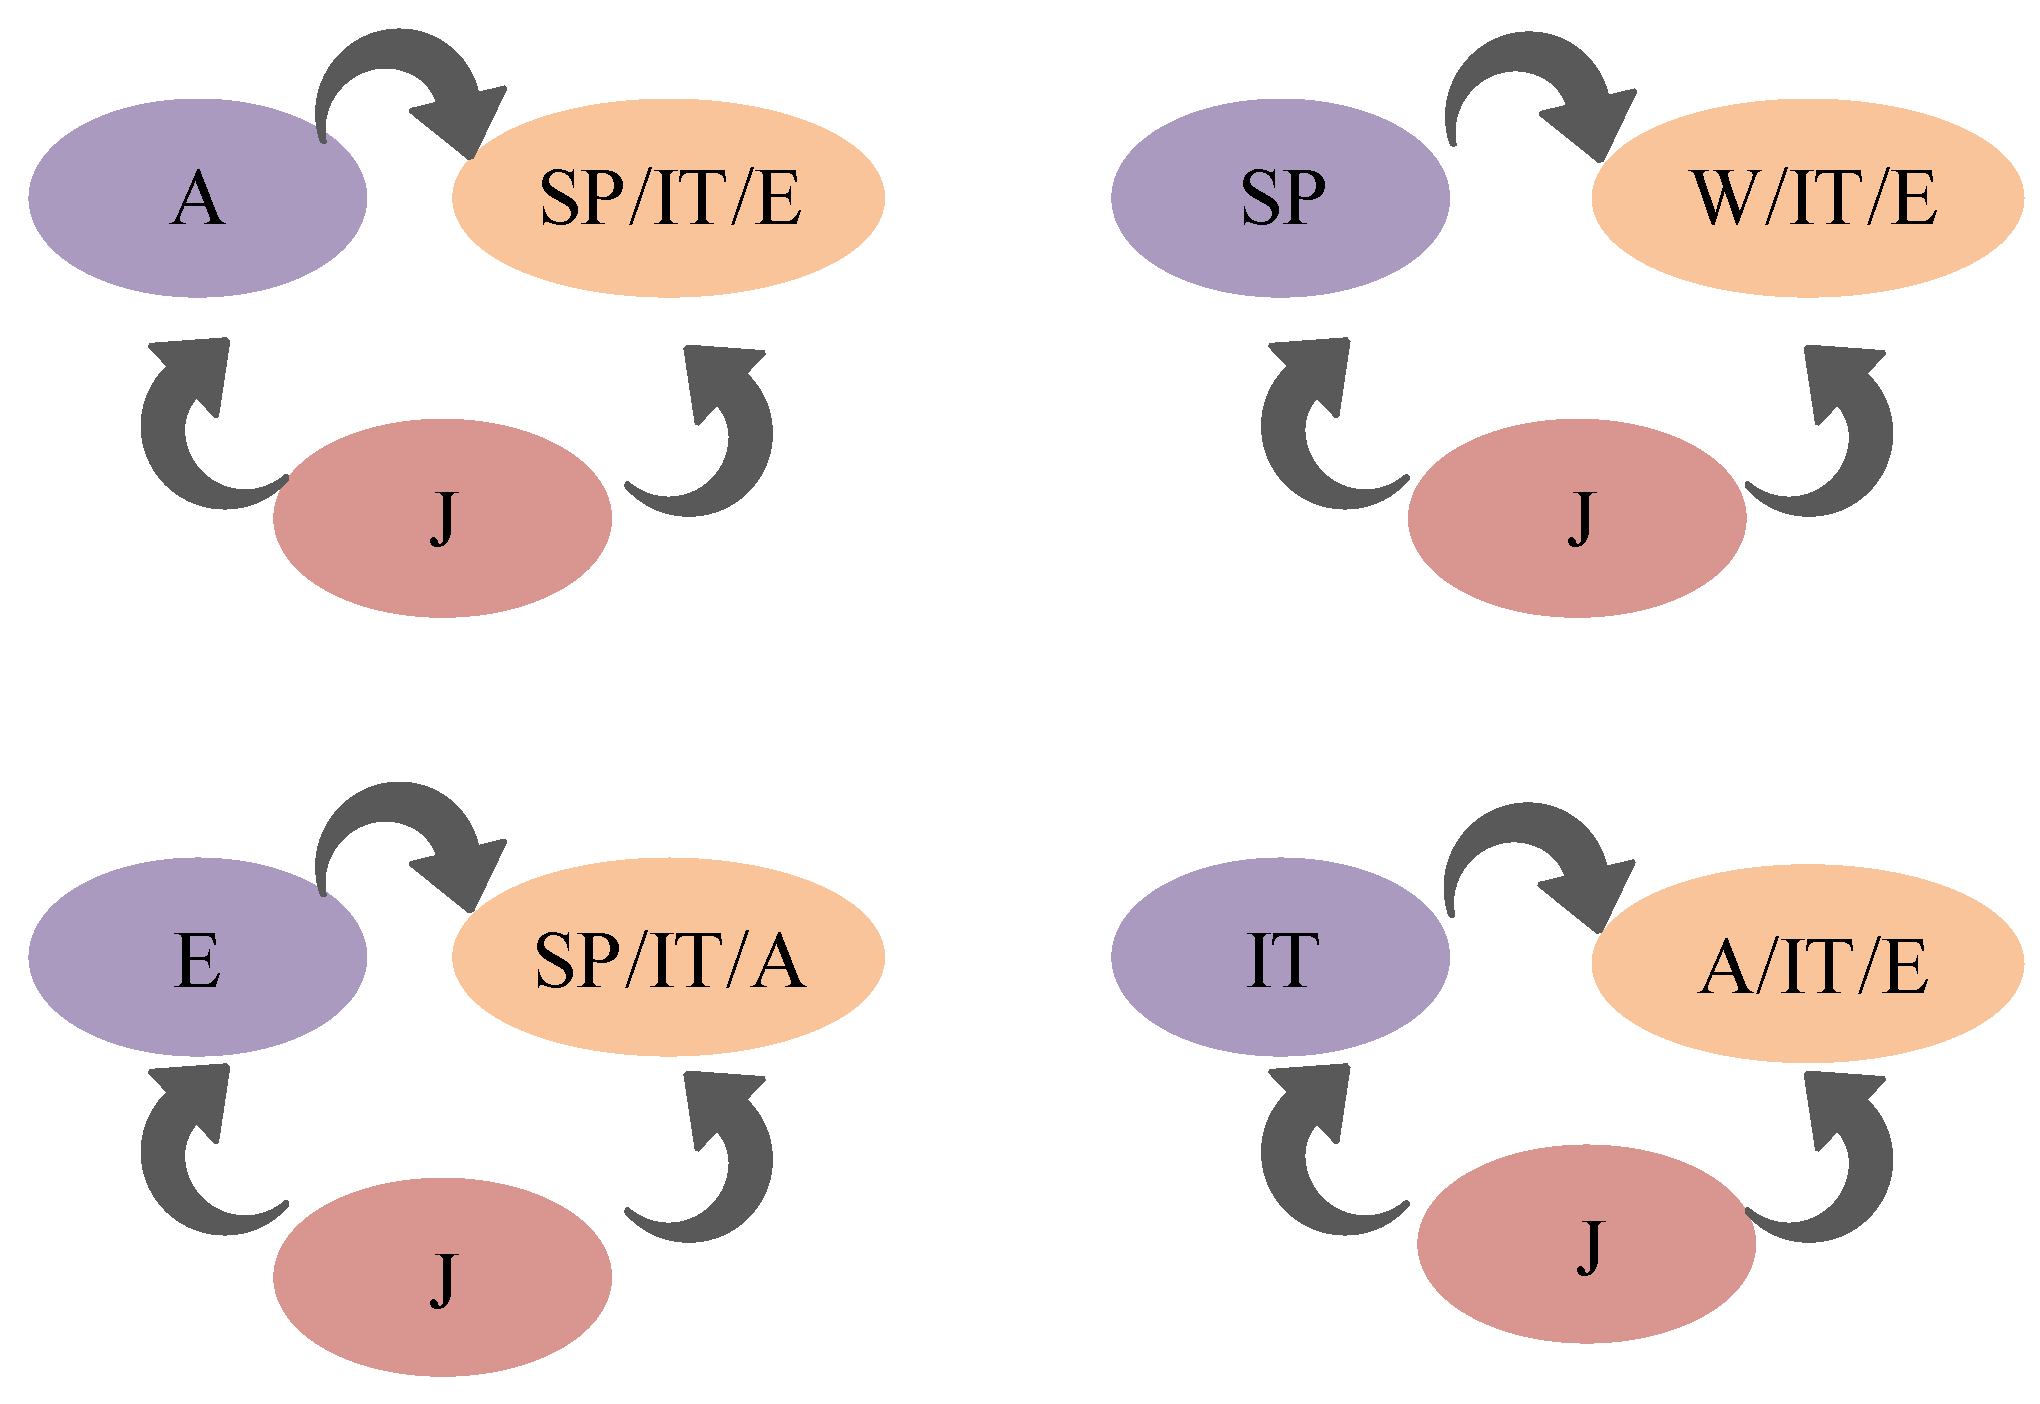
In Formula (16), d i j represents j the distance from the q j c a r first intersection to the charging pile, i , and q j b u s represents the number of electric vehicles driving from the intersection to the charging pile. As shown in Figure 3, a schematic diagram of common user travel is given.
As shown in Figure 3, A represents the workplace, SP represents the shopping location, J represents the user at home, IT represents the social leisure location, and E represents other locations.

4. Model Simulation Experiment Results and Analysis

In recent years, electric vehicle technology has also been continuously improved, and national environmental protection awareness has gradually increased. With the increase of electric vehicles, charging piles are in short supply, and the existing layout of charging piles is not perfect. Data in 2021 showed that the number of electric vehicles in the country has increased by 29.4% compared with the previous year. In order to solve the problem of the short supply of charging piles, this research proposes to use the recursive neural network algorithm and firefly algorithm for modeling analysis to reasonably optimize the problem of the fixed capacity and location of charging piles.
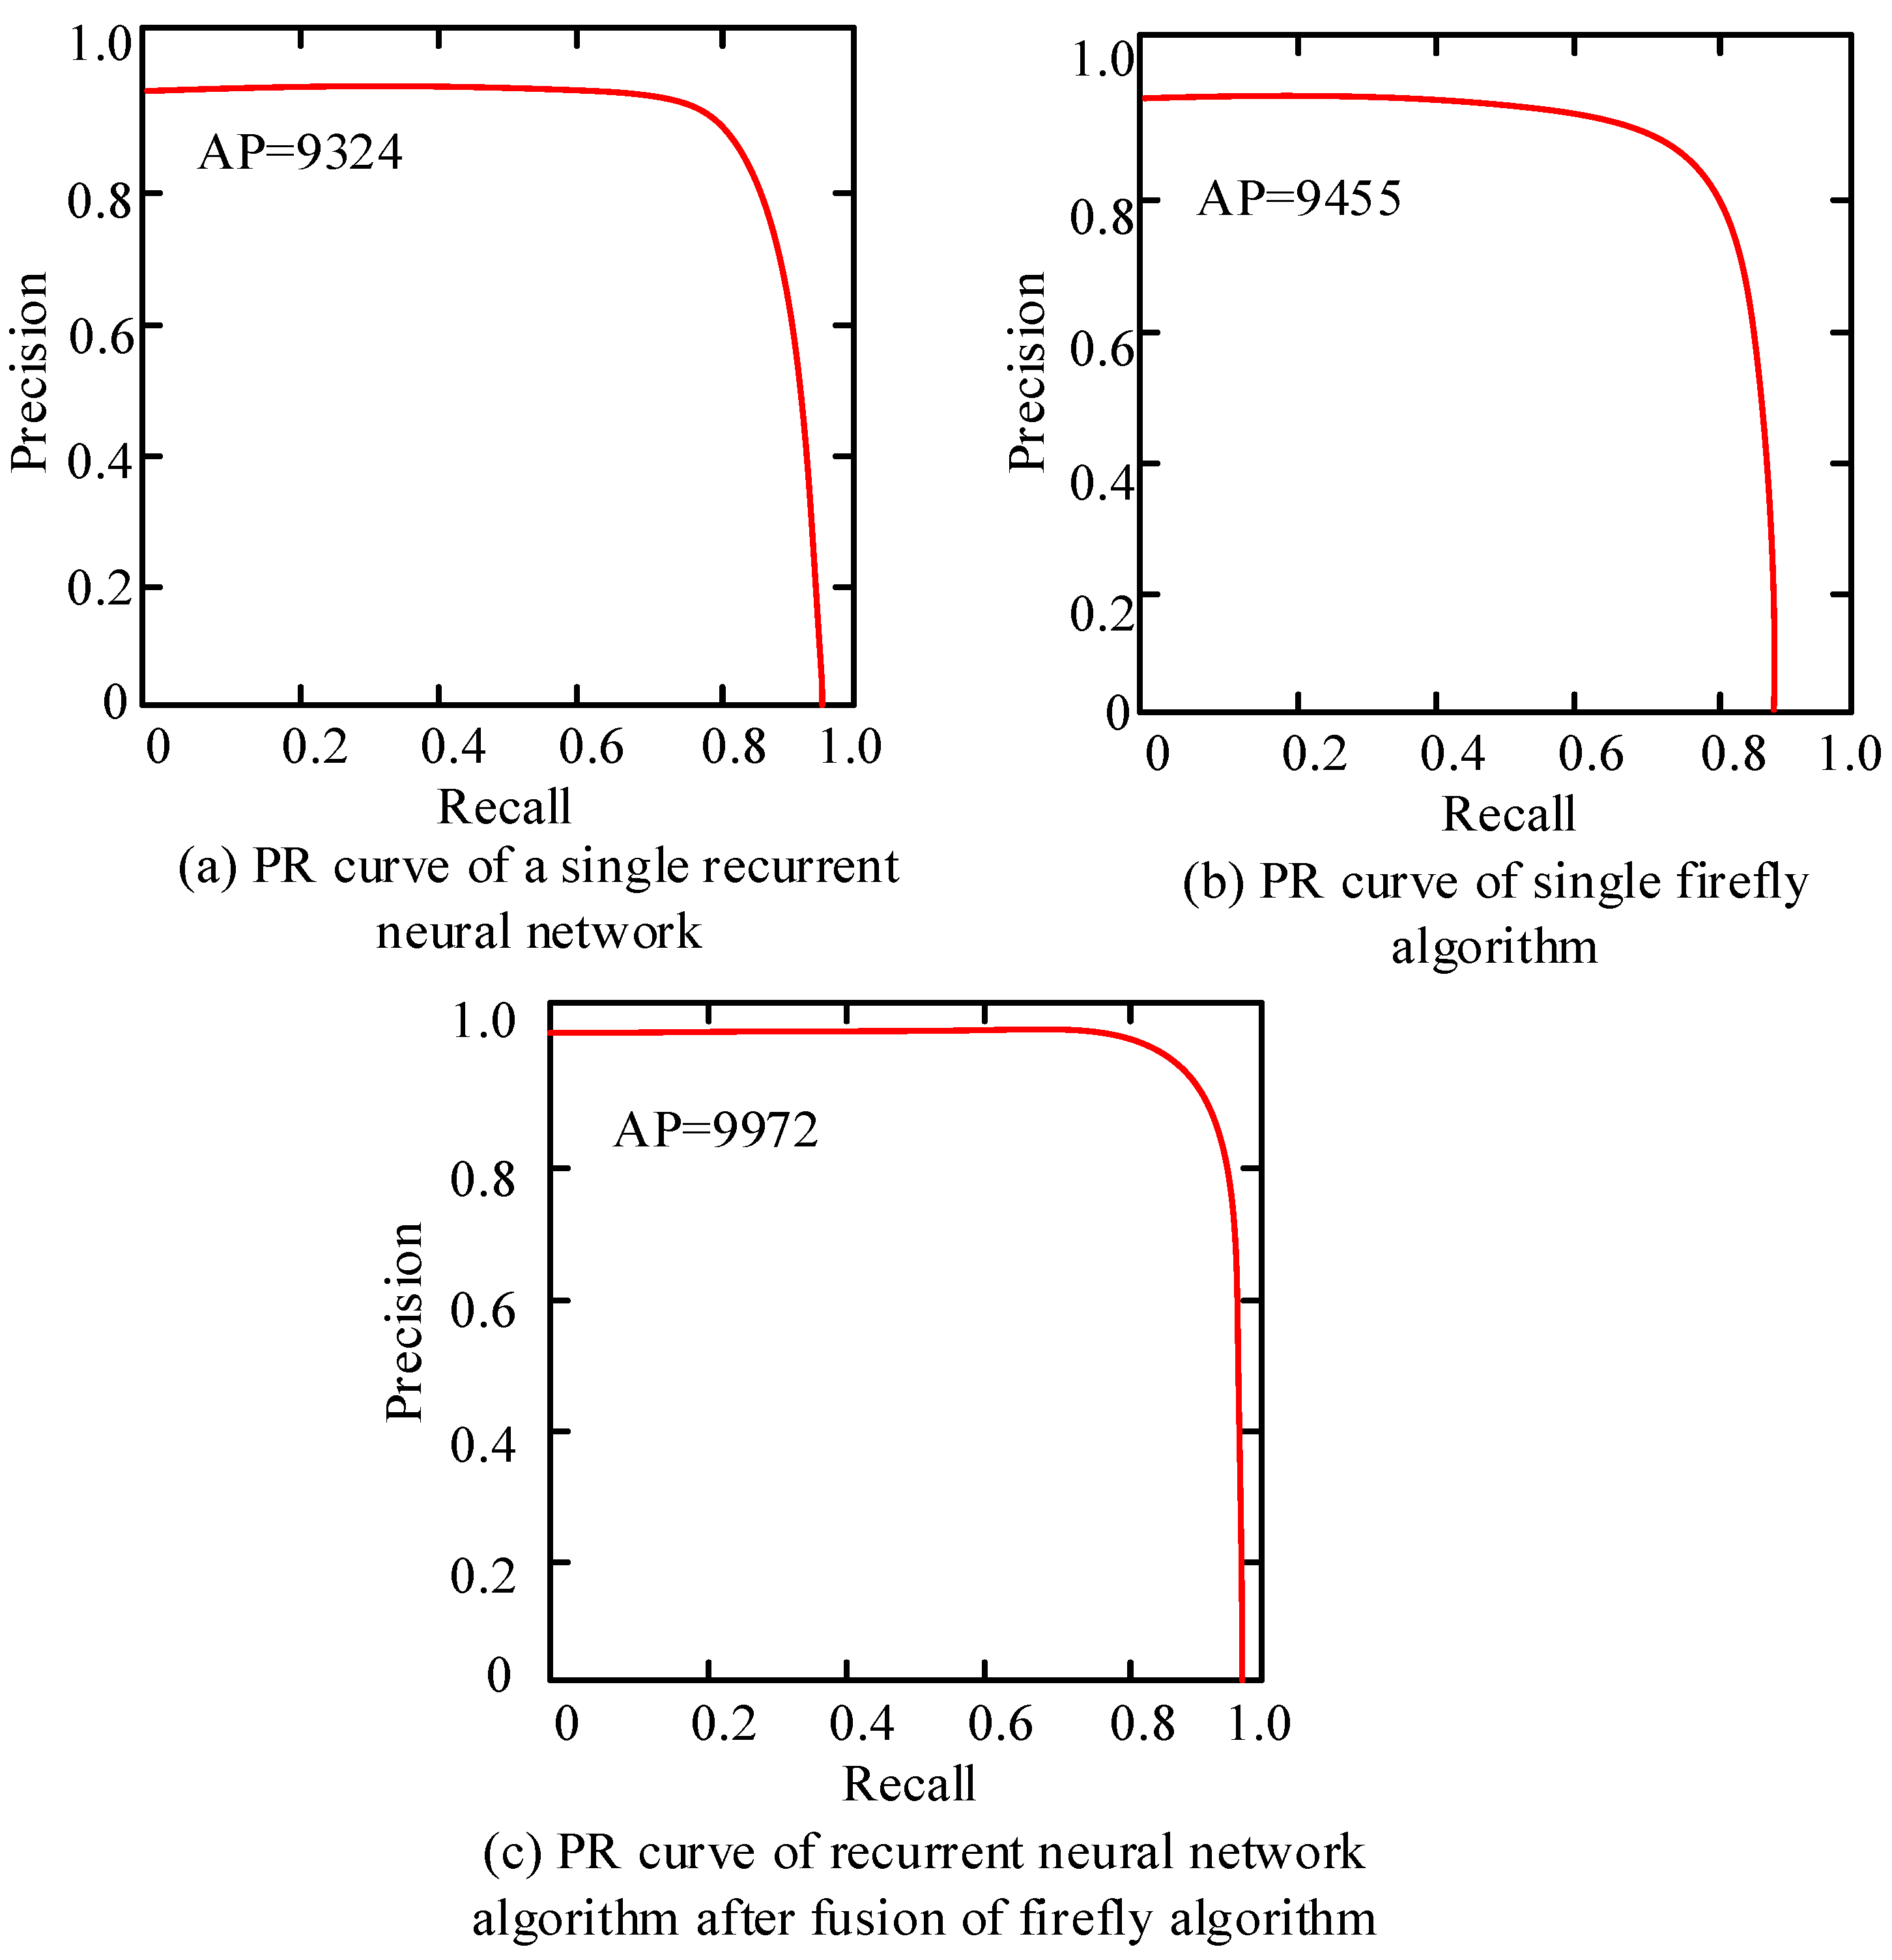
In the experiment, the threshold for dividing the positive and negative cases of the predicted value needed be set in advance, and the threshold is usually set to 0.5. When the predicted value is greater than or equal to 0.5, the corresponding sample at this time is classified as a positive example; similarly, when the predicted value is less than 0.5, the corresponding sample is classified as a negative example. Through the constant change of the threshold value set, the precision and recall values changed continuously, and the PR curve formed according to different test results. The PR curve of the test results is shown in Figure 4.
As shown in Figure 4, Figure 4a is the PR curve formed by the test results of the traditional recurrent neural network algorithm, Figure 4b is the PR curve formed by the test results of the firefly algorithm, and Figure 4c shows the fusion of two algorithm tests. Figure 4a,b show that the AP values of recurrent neural network algorithm and firefly algorithm are 0.9324 and 0.9455 respectively, respectively; however, as can be seen from Figure 4c, the recurrent neural network after the fusion of the firefly algorithm, the AP value was 0.9972, which showed great improvement compared to the previous value. Additionally, the improved algorithm has a good balance between the accuracy rate and the recall rate and is more stable in comparison. The accuracy and efficiency have been greatly improved [22]. After verifying the validity and feasibility of the recurrent neural network algorithm, the simulation experiment was carried out using the built model. First of all, in order to ensure the charging time, this study made statistics on the travel time of residents in a certain city, and the statistical results are shown in Table 1.
As shown in Table 1, the highest probability of the end time of the trip of electric vehicle users was in the time period of 7−9 am in the morning, and there was also a small peak around 1:00 pm in the afternoon. These two time points are the time period for work in the morning and noon, respectively. The probability segment is approximately concentrated, and the value of k is approximately large. By calculating the probability of forming the end time, the number of electric vehicles arriving at a certain position at each moment could be determined. Correspondingly, combining with the probability of charging and the charging power of the charging pile, the sum of the total power of the charging pile could be obtained. By further analyzing the travel time of users, the travel time distribution of non-work days was obtained, as shown in Figure 5.
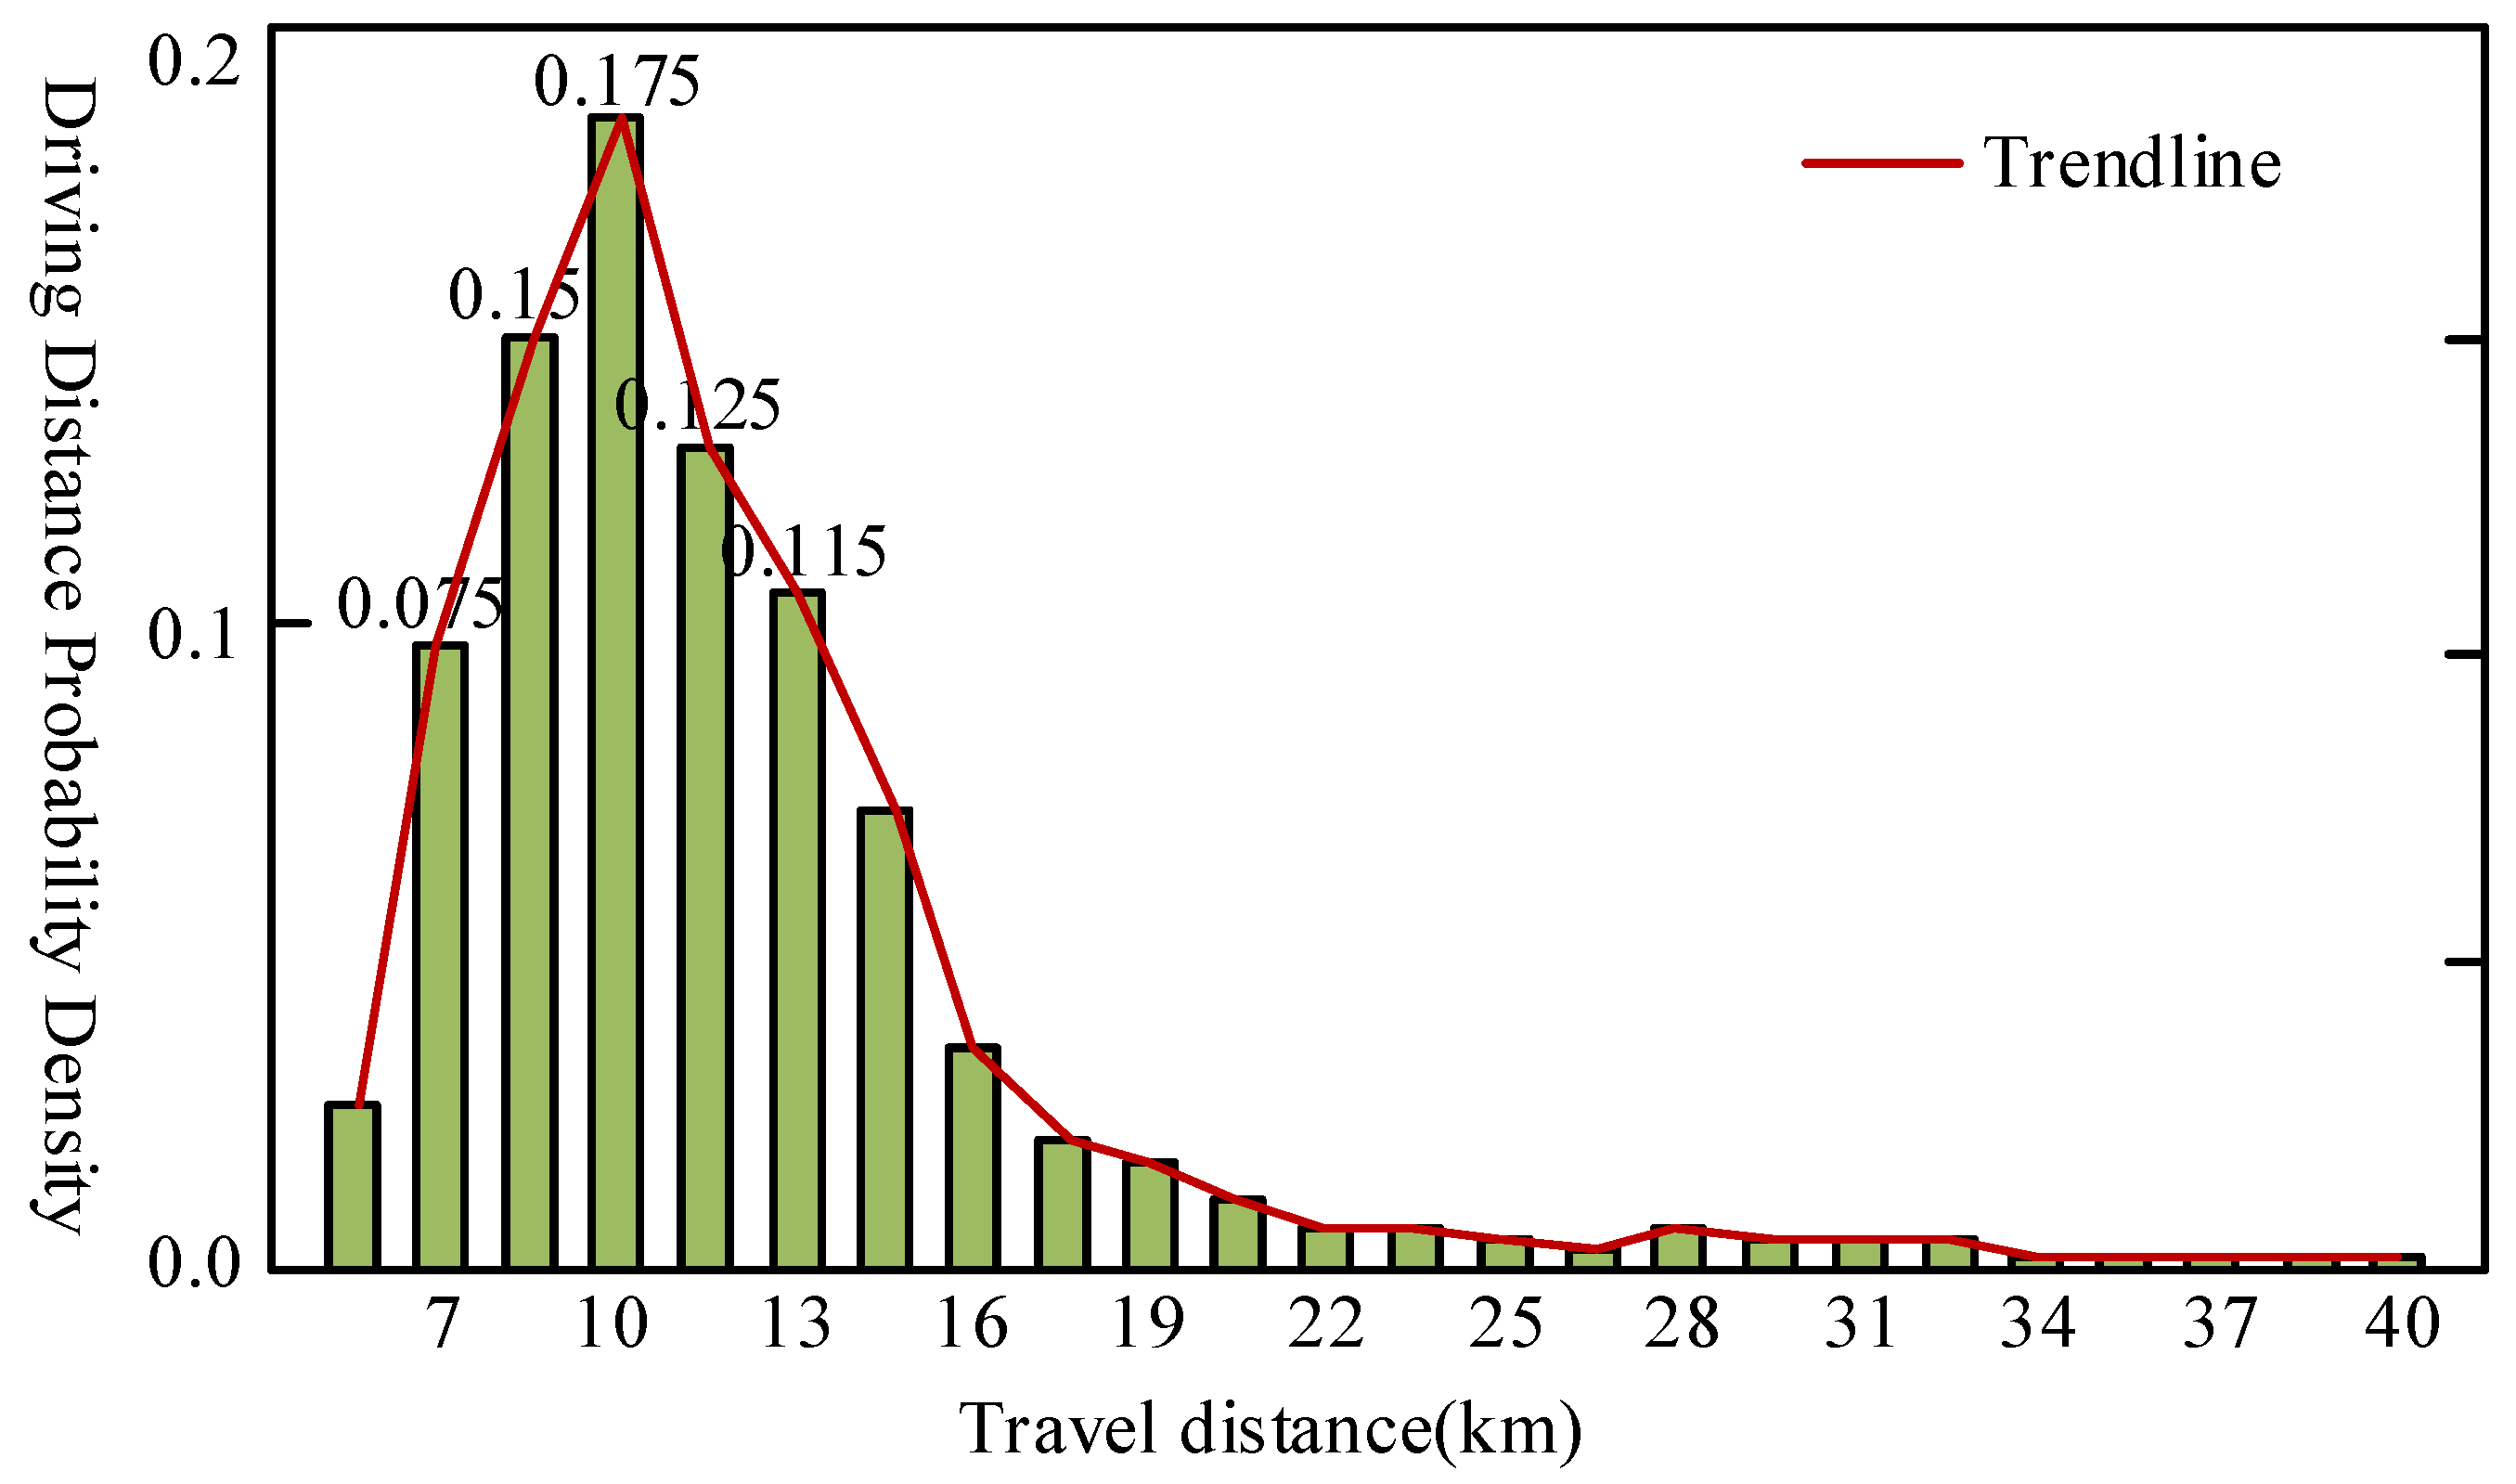
As shown in Figure 5, from the time probability distribution of the three routes of J-SP, SP-IT, and IT-J, the probability of traveling to shopping places, entertainment, and leisure places on weekends and holidays was higher, and shopping places and leisure places are more likely to travel. The time probability curves have a high degree of overlap. After the end time of the trip was determined, the existing data was used to count the travel distance of each trip. The probability distribution of travel distance for a trip from home to work (JA) is shown in Figure 6.
As shown in Figure 6, when the driving distance was less than 10 kilometers, the probability density of driving distance also increased with the increase in mileage, and the probability density reached a maximum value of 0.175 when the driving distance was 10 kilometers. As the mileage continued to increase, the probability density gradually decreased and finally approached 0. From a random selection of a certain brand of electric vehicle, the rated capacity of the electric vehicle battery selected was 30 kw h , and the theoretical battery life was 200 km . With the change in external conditions, the battery life also changes. The battery life of the electric vehicle under different conditions is shown in Table 2.
As shown in Table 2, the cruising range of this type of electric vehicle under different external conditions remained within the range of 133 to 249 kilometers. When the road conditions were good, for example, the temperature was low, and the air conditioner was kept off, the range could reach up to 249 kilometers. As the conditions deteriorated, the range of the electric vehicle decreased accordingly. When the road conditions were less ideal, for example, holiday peaks were encountered, the temperature was high, and the air conditioner was kept on, the battery life was only 133 kilometers. Finally, the time distribution curve of vehicle charging load obtained through model calculation, as shown in Figure 7.
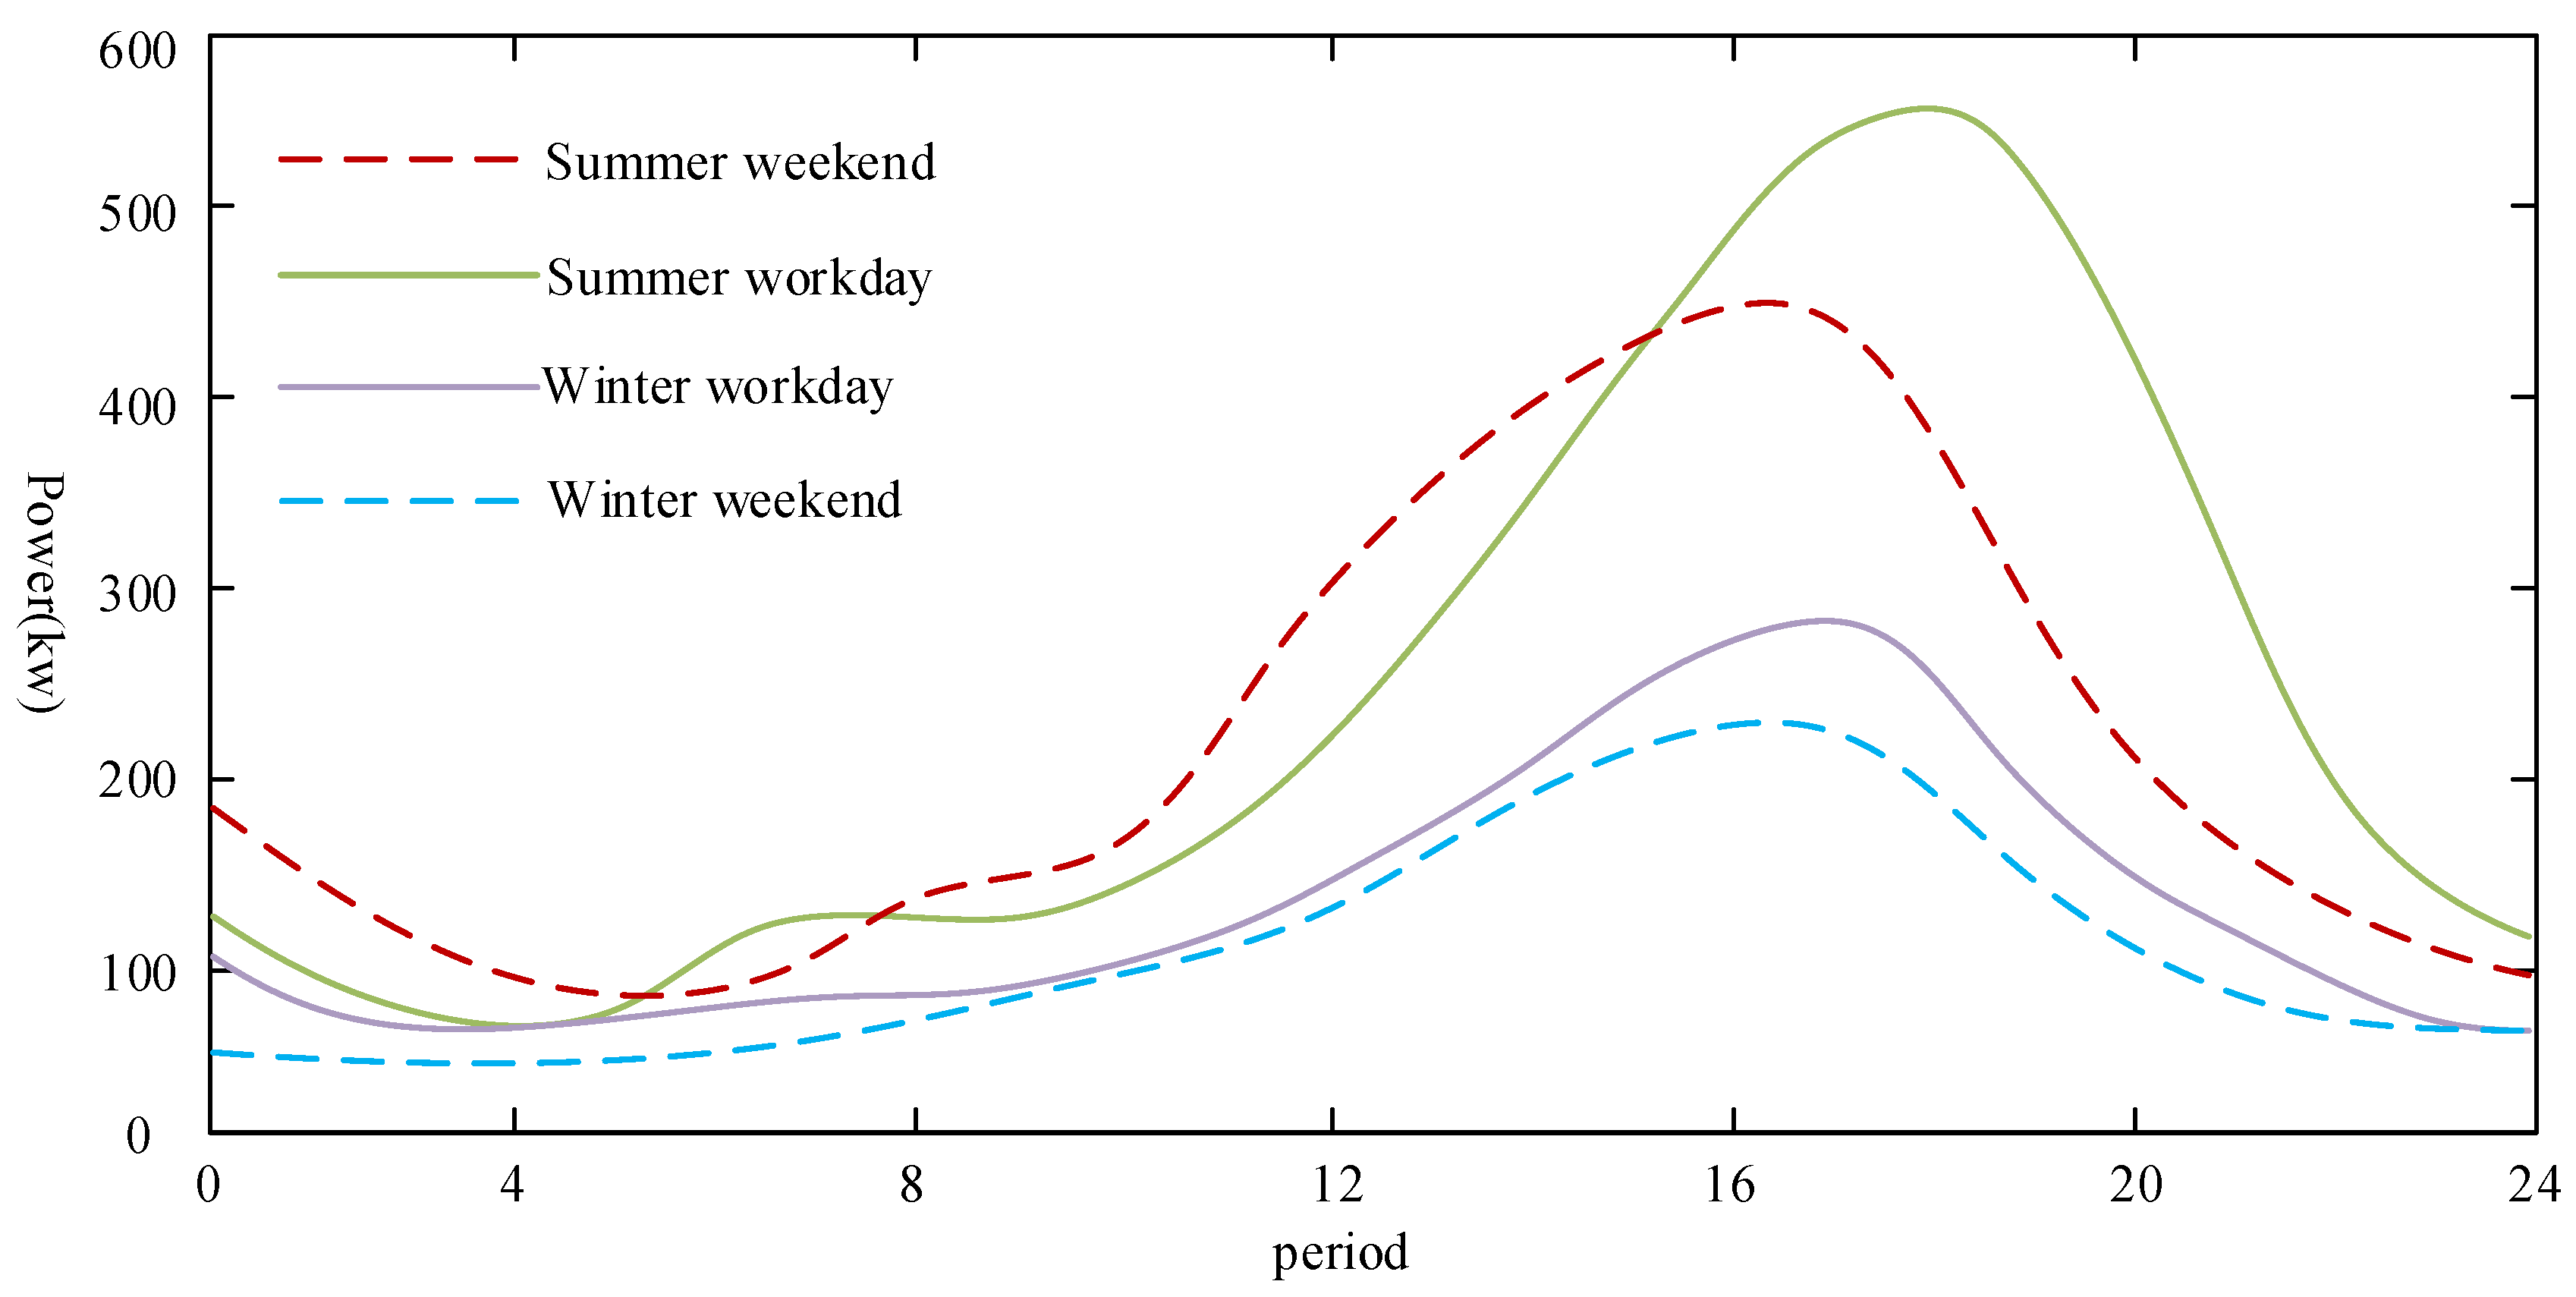
As shown in Figure 7, the powers are predicted separately for the four cases. Among them, the charging power for summer work days is up to 570 kw , but the duration is shorter than other power values, only close to 1 h. Among them, the total power value for summer weekend charging is about 447 kw , and the duration is about 2.7 h. The charging power is not much different between winter weekdays and winter weekends. The highest charging power is maintained at about 269 kw , and the duration is also about 1 h. Using the built model, the charging demands of commercial centers, office areas, parks, residential areas, and other areas with less traffic were predicted respectively. The prediction results are shown in Figure 8.
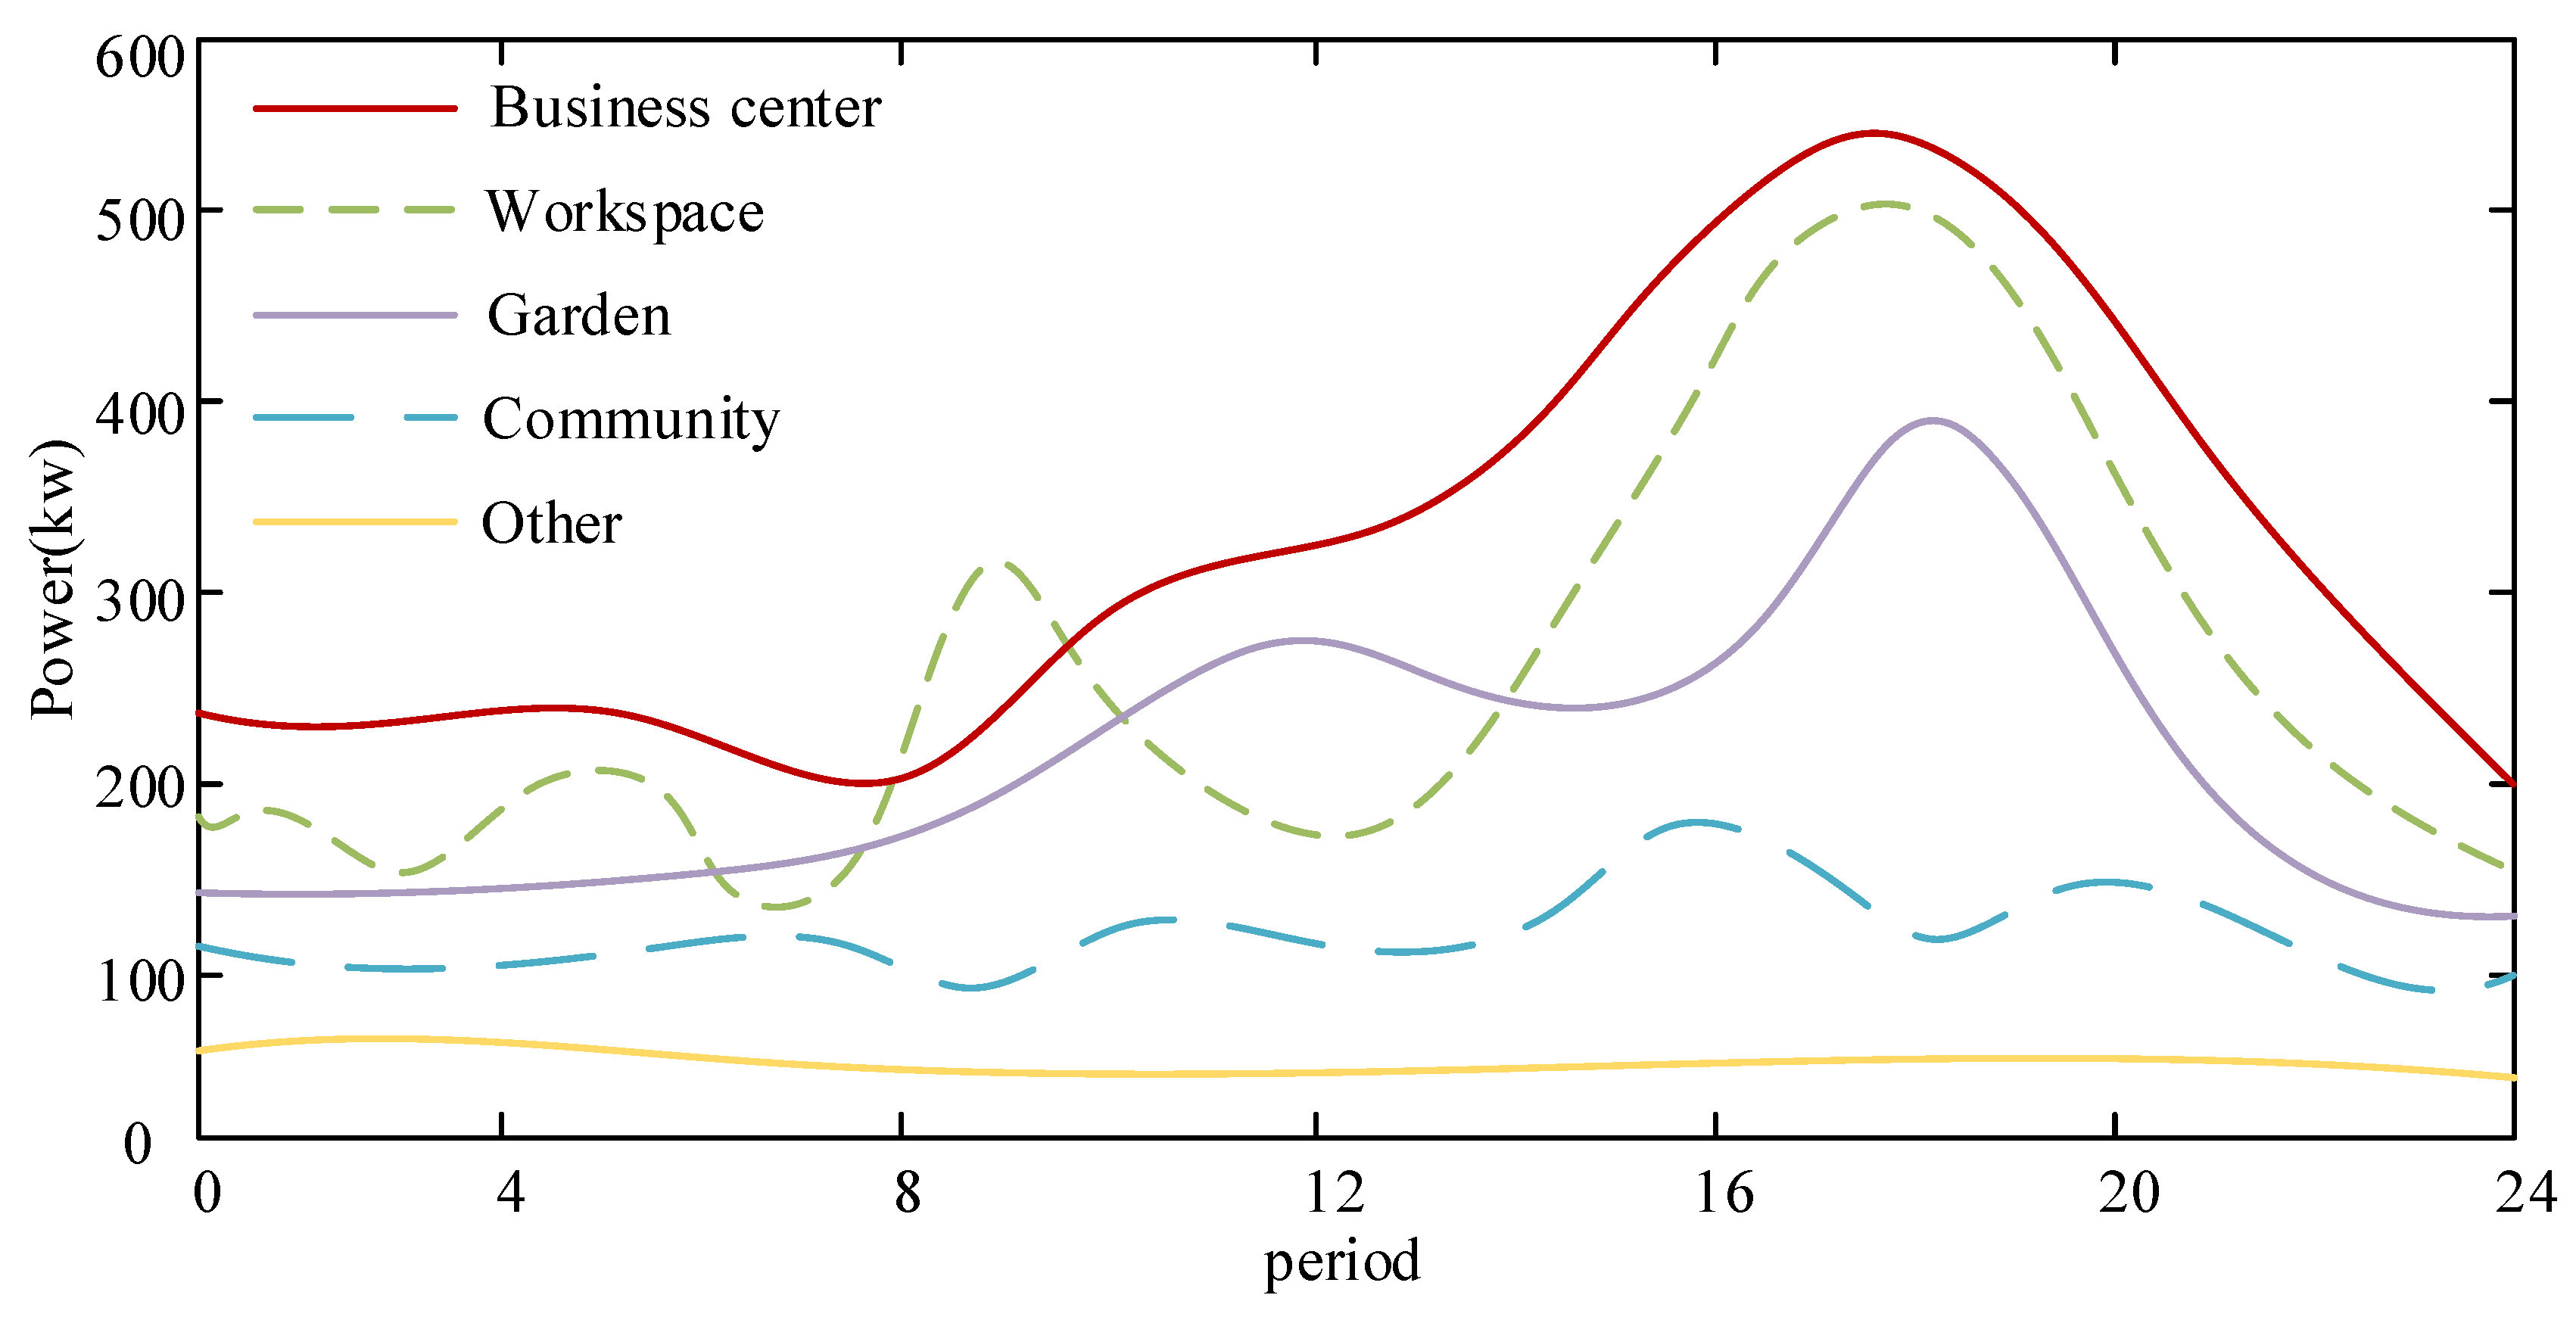
As shown in Figure 8, it can be seen from the charging demand forecast curves of the five regions that the charging demand peaks for several regions were concentrated between 4:00 pm and 8:00 pm, and there was also a small peak around 8:00 am. In terms of total demand, the peak charging demand in the commercial center was around 537 kw , followed by 501 kw in the office area and then around 379 kw in the park. The kw charging demand in other areas was below 200 kw . Finally, the charging load demand was calculated according to the model established in this research, and the final location of the charging pile and the rated capacity of each location were obtained, as shown in Table 3.
As shown in Table 3, 1–5 represent 5 different types of siting areas in descending order according to the installation rated capacity. It can be seen from the table that the maximum rated capacity was 600 kw , the investment cost per area was 1.3712 million yuan per year, and the operation and maintenance cost of the charging pile and its supporting facilities was 291,200 yuan per year.

5. Conclusions

In order to better alleviate the problems of insufficient supply and unreasonable distribution of intelligent charging piles, this study proposed to integrate the firefly algorithm into the recurrent neural network algorithm and establish a model of intelligent charging pile location and capacity for simulation experiments. It was seen from the PR curve that the recurrent neural network algorithm combined with the firefly algorithm provided a better balance between the accuracy rate and the recall rate and was more stable in comparison. Furthermore, the AP value of the fusion algorithm was 0.9972, which was greatly improved compared with the AP value of 0.9324 of the single recurrent neural network and 0.9455 of the firefly algorithm, and the detection accuracy and efficiency were greatly improved. According to the statistics of users' daily travel data on electric vehicles, it was seen that the most likely distribution of the end time of electric vehicle users’ trips from home to work was in the time period of 7-9 am in the morning, and there was also a small peak around 1 pm in the afternoon. These two time points represent the morning and noon work hours, respectively. Further analysis of the travel time of users through the model showed that from the time probability distribution of the three routes, J-SP, SP-IT, and IT-J, the probability of traveling to shopping, entertainment, and leisure places on weekends and holidays was relatively high. Additionally, the time probability curves of shopping places and leisure places had a high degree of overlap. Using the built model, the charging demand of commercial centers, office areas, parks, communities, and other areas with less traffic was predicted. From the total demand, the peak charging demand of commercial centers was about 537 kw , followed by office areas 501 kw in the district and then about 379 kw in the park. The kw charging demand in other areas was below 200 kw . In this study, the firefly algorithm and the recurrent neural network algorithm were combined to construct a smart charging pile location and capacity model. Compared with the single recurrent neural network model and the firefly algorithm model, this model greatly improved the global optimization ability and solved most problems. There was a better fit when the optimal solution was obtained. The sub-model could provide a site selection and volume determination scheme that better meets the needs of users while taking into account the cost. Through this model, the charging load demand of each area was successfully analyzed, and the purpose of selecting the location and capacity of the charging pile was finally achieved.

Funding

This research received no external funding.

Data Availability Statement

All data generated or analyzed during this study are included in this published article.

Conflicts of Interest

The authors declare no conflict of interests.

References

  1. Xie, Z.; Ai, Y.; Chen, J.; Wang, F.; Zhang, W. Deep Recurrent Neural Network Architecture of High Order Indirect Integration Method. Neural Process. Lett. 2022, 54, 1233–1253. [Google Scholar] [CrossRef]
  2. Selvaggio, A.Z.; Sousa, F.M.M.; da Silva, F.V.; Vianna, S.S. Application of long short-term memory recurrent neural networks for localisation of leak source using 3D computational fluid dynamics. Process Saf. Environ. Prot. 2022, 159, 757–767. [Google Scholar] [CrossRef]
  3. Xu, M.; Liu, W.; Xu, J.; Xia, Y.; Mao, J.; Xu, C.; Hu, S.; Huang, D. Recurrent Neural Network Based Link Quality Prediction for Fluctuating Low Power Wireless Links. Sensors 2022, 22, 1212. [Google Scholar] [CrossRef] [PubMed]
  4. Jeong, Y. A personalized lane keeping system for autonomous vehicles based on recurrent neural network with temporal dependencies. J. Mech. Sci. Technol. 2022, 36, 565–574. [Google Scholar] [CrossRef]
  5. Zhu, J.; Jiang, Q.; Shen, Y.; Qian, C.; Xu, F.; Zhu, Q. Application of recurrent neural network to mechanical fault diagnosis: A review. J. Mech. Sci. Technol. 2022, 36, 527–542. [Google Scholar] [CrossRef]
  6. Veeramsetty, V.; Chandra, D.R.; Grimaccia, F.; Mussetta, M. Short Term Electric Power Load Forecasting Using Principal Component Analysis and Recurrent Neural Networks. Forecasting 2022, 4, 149–164. [Google Scholar] [CrossRef]
  7. Gonzalez, J.; Yu, W.; Telesca, L. Gated Recurrent Units Based Recurrent Neural Network for Forecasting the Characteristics of the Next Earthquake. Cybern. Syst. 2021, 53, 209–222. [Google Scholar] [CrossRef]
  8. Zhang, X.; Sun, L.; Qi, L. Bayesian Regularization Algorithm Based Recurrent Neural Network Method and NSGA-II for the Optimal Design of the Reflector. Machines 2022, 10, 63. [Google Scholar] [CrossRef]
  9. Gao, Y.; No, A. Age Estimation from fMRI data using recurrent neural network. Appl. Sci. 2022, 12, 749. [Google Scholar] [CrossRef]
  10. Wang, G.; Hao, Z.; Zhang, B.; Jin, L. Convergence and robustness of bounded recurrent neural networks for solving dynamic Lyapunov equations. Inf. Sci. 2021, 588, 106–123. [Google Scholar] [CrossRef]
  11. Tao, Y.; Huang, M.H.; Chen, Y.P.; Yang, L. Review of optimized layout of electric vehicle charging infrastructures. J. Cent. South Univ. 2021, 28, 3268–3278. [Google Scholar] [CrossRef]
  12. Liu, W.; Tang, Y.; Yang, F.; Dou, Y.; Wang, J. A Multi-Objective Decision-Making Approach for the Optimal Location of Electric Vehicle Charging Facilities. Comput. Mater. Contin. 2019, 60, 813–834. [Google Scholar] [CrossRef] [Green Version]
  13. Hosseini, S.; Sarder, M.D. Development of a Bayesian network model for optimal site selection of electric vehicle charging station. Int. J. Electr. Power Energy Syst. 2018, 105, 110–122. [Google Scholar] [CrossRef]
  14. Rajani, B.; Kommula, B.N. An optimal energy management among the electric vehicle charging stations and electricity distribution system using GPC-RERNN approach. Energy 2022, 245, 12–78. [Google Scholar] [CrossRef]
  15. Gao, J.; Wang, M.; Song, Z.; Zhuge, J.; Xing, S. Study on site selection of airport charging pile based ongenetic algorithm. Comput. Eng. Appl. 2019, 54, 210–216. [Google Scholar]
  16. Huang, Y.; Yu, J.; Leng, J.; Liu, B.; Yi, Z. Continuous Recurrent Neural Networks Based on Function Satlins. Neural Process. Lett. 2022, 54, 1–23. [Google Scholar] [CrossRef]
  17. An, H.; Fang, X.; Liu, Z.; Li, Y. Research on a soft-measurement model of gasification temperature based on recurrent neural network. Clean Energy 2021, 6, 97–104. [Google Scholar] [CrossRef]
  18. Mirzazadeh, Z.S.; Hassan, J.B.; Mansoori, A. Assignment model with multi-objective linear programming for allocating choice ranking using recurrent neural network. RAIRO-Oper. Res. 2021, 55, 3107–3119. [Google Scholar] [CrossRef]
  19. Rai, A.K.; Senthilkumar, R.; Aruputharaj, K. Framed Recurrent Neural Network with Mutated Dragonfly Search Optimization (FRNN-MDSO) for hyperspectral image based face recognition in real time door locking applications. J. Intell. Fuzzy Syst. 2021, 41, 6589–6599. [Google Scholar] [CrossRef]
  20. Es Saiydy, M.; Zitane, M. Dynamic behavior of a class of delayed lotka–volterra recurrent neural networks on time scales. Russ. Math. 2021, 65, 59–75. [Google Scholar] [CrossRef]
  21. Liu, X.; Li, K.; Song, Q.; Yang, X. Quasi-Projective Synchronization of Distributed-Order Recurrent Neural Networks. Fractal Fract. 2021, 5, 260. [Google Scholar] [CrossRef]
  22. Kang, I.; Pang, S.; Zhang, Q.; Fang, N.; Barbastathis, G. Recurrent neural network reveals transparent objects through scattering media. Optics Express 2021, 29, 5316–5326. [Google Scholar] [CrossRef] [PubMed]
  23. Pan, S.; Yan, K.; Yang, H.; Bedal, J.; Qin, Z. A sparse spike deconvolution method based on Recurrent Neural Network like improved Iterative Shrinkage Thresholding Algorithm. Geophys. Prospect. Pet. 2022, 58, 533–540. [Google Scholar]
  24. Kuang, B.; Nnabuife, S.G.; Sun, S.; Whidborne, J.F.; Rana, Z.A. Gas-liquid flow regimes identification using non-intrusive Doppler ultrasonic sensor and convolutional recurrent neural networks in an s-shaped riser. Digit. Chem. Eng. 2022, 2, 100012. [Google Scholar] [CrossRef]
  25. Zhang, Q.-Q.; Wai, R.-J. Design of Adaptive Distributed Secondary Control Using Double-Hidden-Layer Recurrent-Neural-Network-Inherited Total-Sliding-Mode Scheme for Islanded Micro-Grid. IEEE Access. 2022, 99, 1. [Google Scholar] [CrossRef]
  26. Saeed, A.; Li, C.; Gan, Z. Short-Term Wind Speed Interval Prediction using LUBE based Quasi-Recurrent Neural Network. J. Phys. Conf. Ser. 2022, 2189, 15–19. [Google Scholar] [CrossRef]
  27. Yuan, Y.; Luo, Y.; Kang, L.; Ni, J.; Zhang, Q. Range Alignment in ISAR Imaging Based on Deep Recurrent Neural Network. IEEE Geosci. Remote Sens. Lett. 2022, 19, 27–34. [Google Scholar] [CrossRef]
  28. Luo, C.; Zhao, X.; Sun, Y.; Li, X.; Ye, Y. PredRANN: The spatiotemporal attention Convolution Recurrent Neural Network for precipitation now casting. Knowl. Based Syst. 2022, 239, 107–109. [Google Scholar] [CrossRef]
  29. Kaczmarek, T.; Będowska-Sójka, B.; Grobelny, P.; Perez, K. False Safe Haven Assets: Evidence From the Target Volatility Strategy Based on Recurrent Neural Network. Res. Int. Bus. Financ. 2022, 60, 7–9. [Google Scholar] [CrossRef]
  30. Caseri, A.N.; Santos, L.B.L.; Stephany, S. A convolutional recurrent neural network for strong convective rainfall now casting using weather radar data in Southeastern Brazil. Artif. Intell. Geosci. 2022, 3, 8–13. [Google Scholar]
  31. Paraschiakos, S.; de Sá, C.R.; Okai, J.; Slagboom, P.E.; Beekman, M.; Knobbe, A. A recurrent neural network architecture to model physical activity energy expenditure in older people. Data Min. Knowl. Discov. 2022, 36, 1–36. [Google Scholar] [CrossRef]
  32. Li, Y.; Zeng, C.; Li, B.; Hu, J. A One-Layer Recurrent Neural Network for Interval-Valued Optimization Problem with Linear Constraints. Neural Process. Lett. 2022, 54, 1–18. [Google Scholar] [CrossRef]
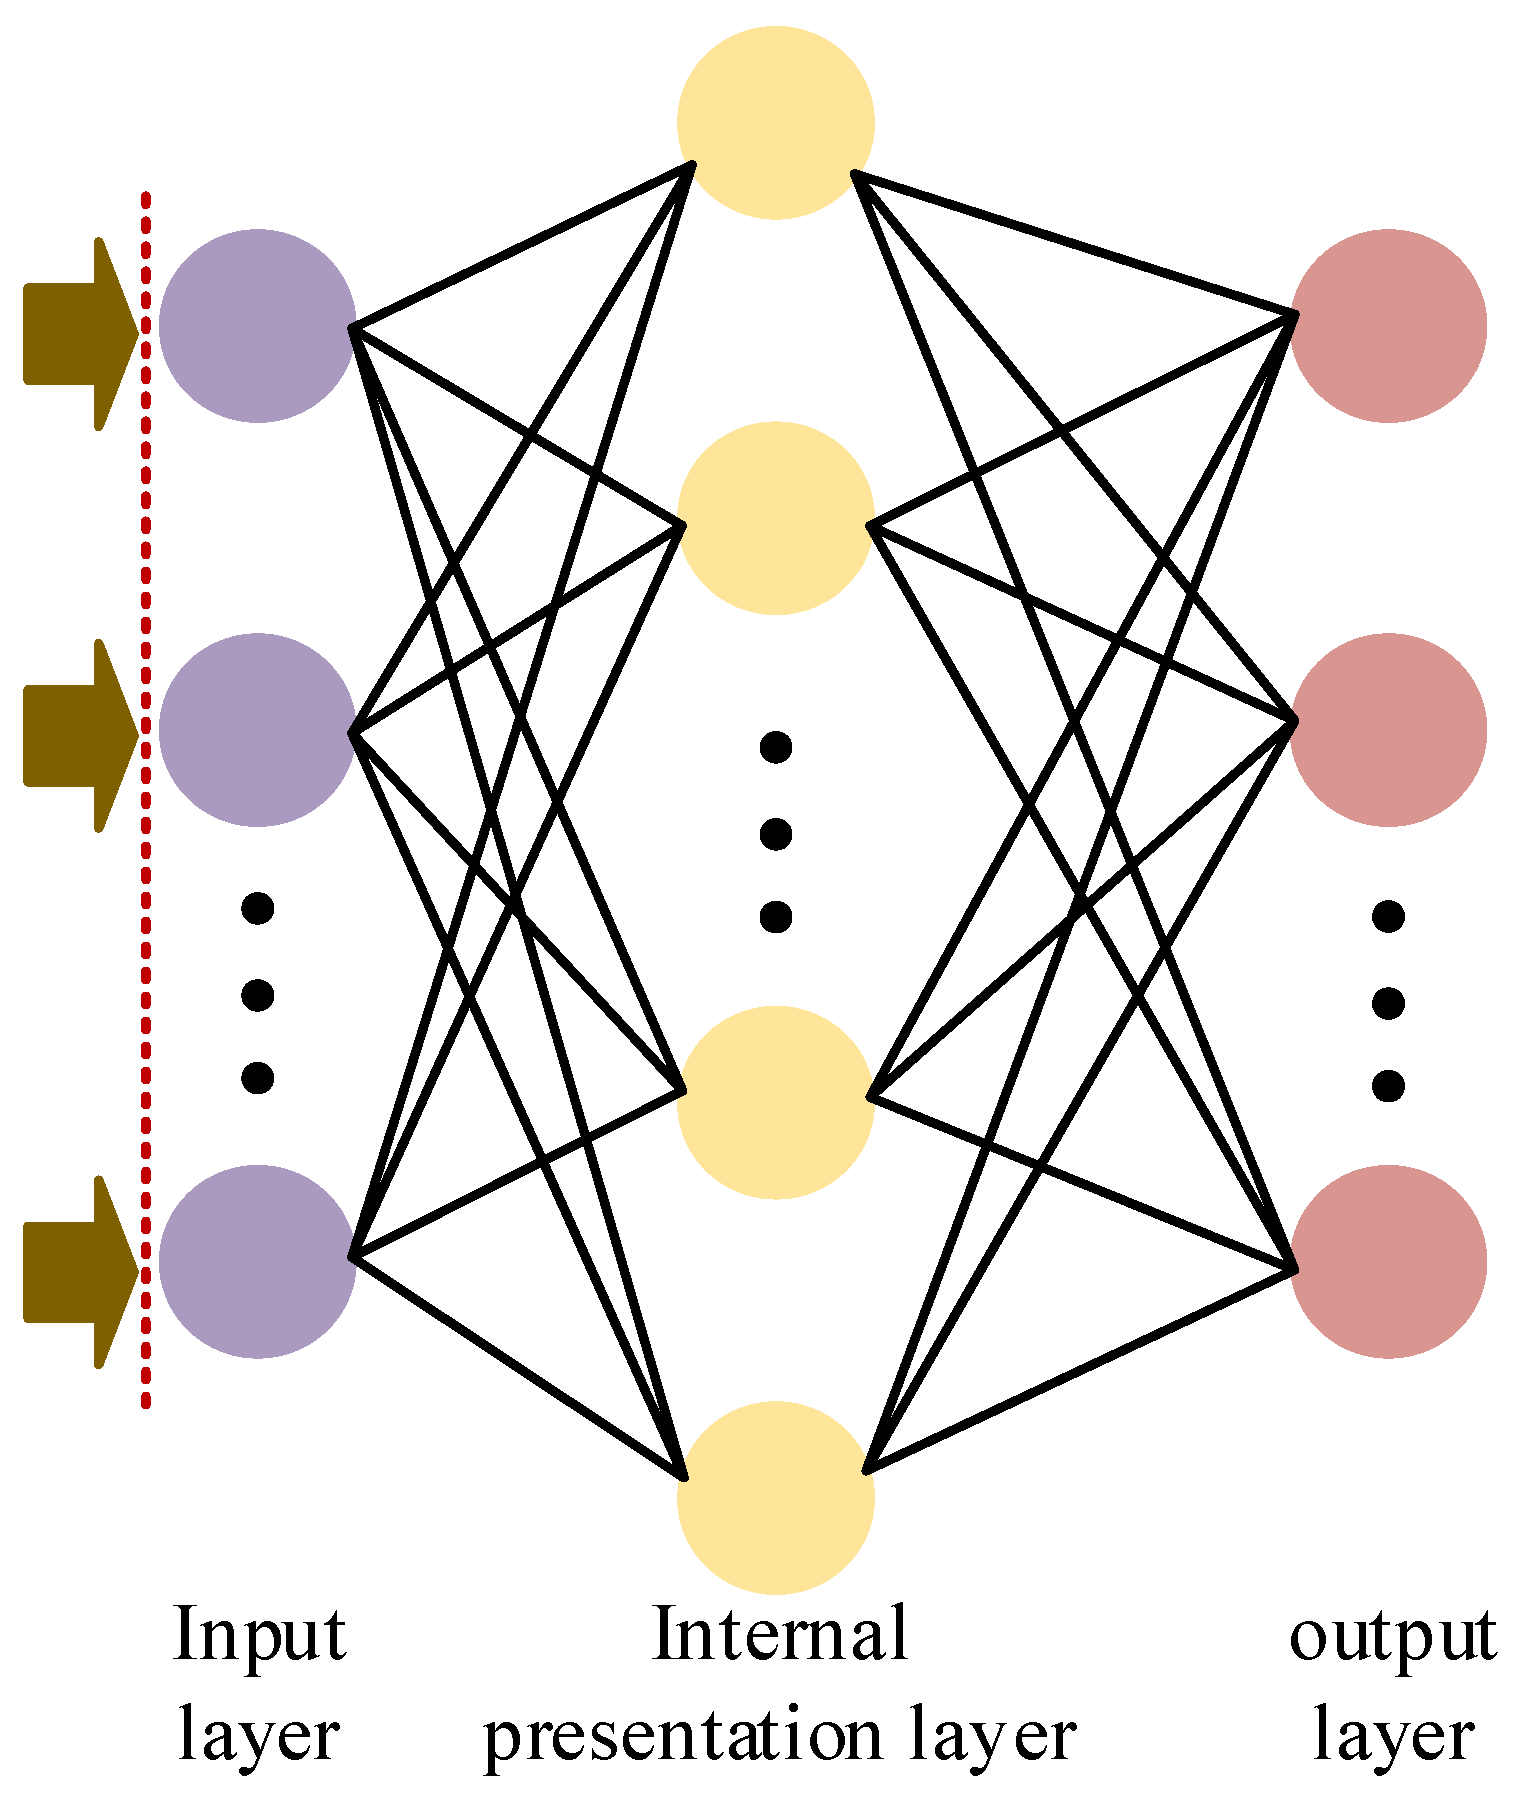
Figure 1. RNN neural network structure diagram.
Wevj 13 00186 g001
Figure 2. Basic flowchart of Firefly algorithm.
Wevj 13 00186 g002
Figure 3. Typical travel routes of ordinary users.
Wevj 13 00186 g003
Figure 4. PR curve.
Figure 4. PR curve.
Wevj 13 00186 g004
Figure 5. Probability distribution of the end time of user trips on non-work days.
Wevj 13 00186 g005
Figure 6. Probability distribution of mileage traveled from home to work (JA).
Wevj 13 00186 g006
Figure 7. Prediction of charging demand for electric vehicles in different scenarios.
Wevj 13 00186 g007
Figure 8. Forecast of charging demand for electric vehicles in different regions.
Wevj 13 00186 g008
Table 1. Statistics of travel time from home to work (JA) on work days.
PeriodTrip End ProbabilityPeriodTrip End ProbabilityPeriodTrip End ProbabilityPeriodTrip End Probability
1070.1239130.0612190
2080.4055140.0199200
3090.1899150210
40100.0742160.0076220
50110.1910170.0091230.0086
60.0127120.0231180240
Table 2. Life comparison of electric vehicles under different conditions.
Road ConditionAir Temperature (°C)Air ConditionerBattery Life (km)
Unmanned20Closure249
Smooth18Closure237
Stroll0Heating182
Morning peak27Closure154
Holiday peak39Refrigeration133
Table 3. The installation position, rated capacity, and cost of charging piles obtained from the model.
Charging Pile Code Rated   Capacity   ( kw ) Investment Cost (10,000 yuan/year)Operating Cost (10,000 yuan/year)
1600137.1229.12
2500101.3323.12
340088.4219.88
430078.1918.76
520060.7815.42
Publisher’s Note: MDPI stays neutral with regard to jurisdictional claims in published maps and institutional affiliations.