Abstract
Private cars are the most active and important incremental factor in the electric vehicle market and are expected to account for 80% of the new energy vehicle sales market by 2030. As the most common charging scenario for private cars, orderly charging in the community can optimize the distribution load curve by dynamically adjusting charging time and power of electric vehicles, so as to achieve peak-load shaving and turn electric vehicles into a friendly load to the distribution grid. However, after the traditional orderly charging strategy was released, the complexity of the operation on the user’s side was a heavy strike to the user’s willingness to participate in orderly charging, resulting in the quite low participation rate and insufficient demonstration of the characteristics of EV’s elastic power demand. To solve this issue, the paper proposes a senseless orderly charging strategy with user charging demand prediction and substation capacity constraint considered to minimize user charging fee or maximize service provider revenue. After a five-month practical application, the proposed strategy was found to effectively improve the user participation rate in orderly charging and to regulate electric vehicles as an elastic load to meet the grid demand.
1. Introduction
Private cars are the most active and important incremental factor in the new energy vehicle market, with a current market share of 72% and an expected prompt of over 80% by 2030. The community scenario is the main field to be explored for private passenger vehicle charging [1,2,3]. A widespread EV disorderly charging may increase the peak-to-valley difference of the power system due to the charging peak load overlap with the community electricity peak load [4,5]. For a transformer substation with limited capacity, disorderly charging may easily exceed the capacity limit during the evening peak hours [6]. According to [7,8], the average daily time that private cars are driven is only about 4%, the long parking and standby on the grid time can provide a charging power regulation opportunity under fully actual charging condition. As of 2021, 120,000 orderly charging piles have been installed in 18 provinces and cities in China, covering 10,000 communities and serving 150,000 vehicle owners and this number is prospected to be 200,000 in 2022. With the continuous investment in the orderly charging piles, the community charging scenario could turn from disorderly charging into orderly charging.
Current research on orderly charging mainly focuses on the following aspects: user guiding through price incentive, charging curve optimization, and maximizing the benefits of electricity grid, vehicle owners, or operators in a single- or multi-objective manner [9]. Based on time-of-use electricity tariffs, the charging load is expected to achieve peak-shaving and valley-filling or minimize the volatility of the overall load curve while ensuring the operator’s benefits [10] and solving the grid potential operation problems. Alternatively, EVs are divided into dispatchable clusters and non-dispatchable clusters, which can be separately guided from time and space dimensions to achieve friendly interaction between EVs and the grid [11,12]. However, from the operation effect of community orderly charging piles in 2021, users’ willingness to participate in orderly charging is not strong, mainly because the current orderly charging technology focuses more on serving grid operation than meeting users’ demand for the charging capacity. Previous technology research and actual operation data show no consideration of the charging demand and user experience in current orderly charging research, which feeds back a lower expectation on the effect of vehicle–grid interaction.
In order to speed up the orderly charging penetration in the community and turn electric vehicles into large-scale controllable resources, it is necessary to solve the problems of the traditional orderly charging strategy, which came into practical use in 2019. For the traditional orderly charging strategy, if users want to participate in orderly charging, they need to input many parameters on the app, including departure time, current SOC, target SOC, battery capacity, and so on, and the operation is complex, resulting in weak willingness of users to participate. To solve these problems, we propose a senseless orderly charging strategy to simplify the user’s operation process on the app side with user charging demand prediction to realize the senseless participation of users participating in orderly charging in the process of EV serving power grid regulation. Specifically, the charging demand is predicted based on historical driving data with an artificial intelligence algorithm and the charging strategy is made to minimize the user’s charging fee or maximize service provider revenue with station capacity constraint considered.
2. Senseless Orderly Charging Technology
2.1. Technical Scheme
The senseless orderly charging technical scheme is presented in Figure 1. Users start from the binding of the vehicle and person by inputting the vehicle VIN code on the app side. After choosing coordinated charging, the senseless coordinated platform uses the VIN index to automatically log the model, license, maximum power, and battery capacity information by calling an external EV data platform. In addition, the historical charging data of the users can also be collected through the vehicle VIN code. According to these data, the senseless coordinated charging platform can forecast the user departure demand, thus reducing the manual records of the above data on the app and solving the cumbersome operation issues.
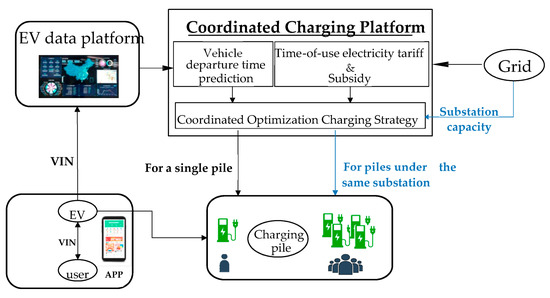
Figure 1.
Technical framework of users’ senseless participation in orderly charging.
Based on the user demand forecasting and the time-of-use tariff and subsidy of the grid, a single pile charging strategy is formulated by linear optimization to minimize charging costs and address the charging anxiety under the premise of satisfying the user charging demand. Furthermore, when the substation capacity limitation needs to be referenced on a large-scale vehicle-to-grid connection, the platform will receive the capacity information from the grid-side substation, and optimize charging clusters within the platform to maximize the revenue without exceeding the capacity limitation by the support of the mentioned strategies.
2.2. User Demand Forecasting
2.2.1. Charge Quantity Prediction
Select the historical data with the highest correlation with the pre-predicted charging scenario by correlation calculation for Support Vector Machine regression prediction model training. The traditional similarity degree calculation of historical days only considers the basic features such as weather and type of day. In fact, the community charging behavior of EV users has a certain robustness in terms of charging location (personal pile or public pile in the community), charging time, and charging power. Therefore, as well as the daily characteristics, this paper also considers charging station pile, charging time period, and charging trend factors when calculating the history-day similarity degree.
- (1)
- Charging date correlation
Considering the factors with greater impact on the EV charging quantity in the daily characteristics, including weather (sunshine, rain, and snow), temperature (average temperature), and type of day (weekday, weekend, and holiday), etc., after the data are normalized and the corresponding values for the type data are setup, the daily correlation degree R1 between the historical day and the predicted day is calculated using the weighted cosine similarity as
where p is the total number of the classes of charge demand influencing factors in the daily characteristics, is the weight factor of the pth charge demand influencing factor, is the pth charge demand influencing factor corresponding to the historical day, and is the pth charge demand influencing factor corresponding to the predicted day.
- (2)
- Charging spatiotemporal correlation
The start charging time and charging quantity are strongly related to the charging site, such as personal pile, community pile, and office charging station. The correlation of the above-mentioned relationship in the charging time and charging site is defined as “charging spatiotemporal correlation”. Define the coefficient S of charging station correlation degree, where the larger coefficient is, the more familiar the charging station piles on the forecast day is with the station on the historical day. Define the similarity coefficient d of the charging period between the historical day and the day to be predicted. The larger the coefficient is, the more similar these two periods are. Considering the charging station pile correlation and the charging period correlation, the charging spatiotemporal correlation R2 defined above can be calculated as
- (3)
- Charging trend correlation
Considering the consistency of the user charging trend, define the charging trend correlation between the historical day and the predicted day. Taking 3 days’ charging capacity before the forecast day Q0 = {Q0–3 Q0–2 Q0–1} and the charging capacity before the history day Qk = {Qk−3, Qk−2, Qk−1}, the charging trend correlation R3 is calculated as
where is covariance of and , and is standard deviation of Q0 and Q1.
- (4)
- Comprehensive correlation
Based on the charging date correlation, the comprehensive correlation is calculated by modifying the spatiotemporal correlation coefficient and charging trend correlation coefficient.
According to the comprehensive correlation calculation, select the historical day with high comprehensive correlation coefficient as the training data of the model input layer, including weather type (sunny, rainy, and snowy), air temperature (average temperature), type of day (working day, weekend, and holiday), and starting SOC. The charging quantity of the historical order is used as the output layer training data of the machine learning model so as to obtain the prediction model for predicting the user’s charging demand.
2.2.2. Departure Time Prediction
The prediction of the user’s departure time needs to be conservative to ensure that the electricity charged can meet the user’s demand. The step changing of the user’s departure probability usually indicates the travel status change and this step change moment is considered as the user departure time, which not only scientifically considers the user’s historical data, but also has a certain degree of prediction conservatism.
The method is to first obtain the historical travel data of users on different types of days (working days, weekends, and holidays), and calculate the 24-h travel probability curve of users on different types of days by using a sample statistics method or artificial intelligence prediction method. Then, the adaptive segmentation method is used to select the thresholds Th1 and Th2 (0 < Th1 < Th2 < 1), and the travel probability is divided into high, medium, and low periods. Finally, the user departure time is determined by the moment where the travel probability period turns higher.
Specifically, as shown in Figure 2, firstly, obtain the travel probability curve of the user for next 24 h, and select the threshold to divide the curve into low, medium, and high, i.e., three types of travel probability periods. If the car is being charged during the low travel probability period, the user’s departure time is predicted to be the moment where travel probability period turns from low to medium or from medium to high. If the car is being charged during the medium travel probability period, the user’s departure time is predicted to be the moment where the travel probability period turns from medium to high. If the vehicle is charged during the period of high travel probability, the departure time is predicted as extending the average charging time of the corresponding type of days (such as working days, weekends, and holidays) on the basis of the start charging moment.
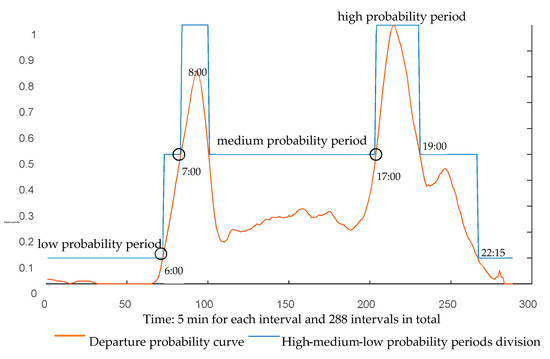
Figure 2.
Corresponding relationship between departure probability and departure time.
In the following example, the threshold of Th1 and Th2 is respectively set at 0.1 and 0.5, the 24 h are divided into high, medium, and low probability periods as shown in Figure 2. The conclusion can be drawn by combining the travel probability curve and the probability period curve: if the car is being charged 7 p.m.–6 a.m the next day. (low and medium travel probability period), the predicted departure time is 6 a.m. where the travel probability period turns from low to medium. If the car is being charged from 6 a.m. to 7 a.m., the predicted departure time is 7 a.m., where the travel probability period turns from medium to high. Similarly, if the car is being charged 9 a.m.–5 p.m., the departure time of the user is predicted to be 5 p.m.
2.3. Senseless Orderly Charging Strategy
The charging strategy for two scenarios are presented in this section. If the user directly participates in the electricity market and gets profit, the charging strategy for single pile with the objective of minimizing the user’s charging fee will be applied. If users could not participate in the electricity market, they will call for a charging service provider to indirectly participate in electricity market; the charging strategy for piles in the same substation area with the objective of maximizing charging service provider benefit will be applied.
2.3.1. Charging Strategy for a Single Pile
When the substation transformer capacity is sufficient to meet the users’ power demand in the station area, it is unnecessary to consider the transformer capacity limit in the orderly charging strategy. Combined with time-of-use and subsidized price, a single pile orderly charging strategy with the lowest charging cost is generated, the mathematical model is as follows:
The charging strategy for a single pile aims to minimize the user’s charging fee by considering time-of-use and subsidized price. The mathematical model is as follows:
The battery capacity of this user’s car is expressed as L (kWh), the initial SOC at time when the user starts the senseless charging process is , and the predicted departure time is with the target SOC expressed as . The optimized step, charging power, charging price, and subsidy price in each optimization step are respectively expressed as ∆T, Pi (kW), Ci (RMB/kWh), and Subi (RMB/kWh). The objective function with the lowest charging cost is:
In Equation (5), n is the total number of optimized time periods from the time when the user starts orderly charging on the app to the time when the vehicle is picked up, and the calculation method is:
The user’s charging demand is met by Equation (7):
The charging power limit of the charging pile is considered in Equation (8):
Build the above model in MATLAB and solve the problem with linprog method to get the optimal charging strategy for the user.
2.3.2. Charging Strategy of Piles in the Same Substation Area
While making the charging strategy for large-scale electric vehicles connected to the same substation and the substation capacity is insufficient, it is necessary to take the substation maximum capacity into the constraint and maximize the charging income of the charging service provider. The objective function can be expressed as
where is the dependent variable, representing the charging power of the charging pile n at time t. , , and are respectively the charging electricity fee, the charging service fee, and the subsidy at time t. is electricity purchase cost for this substation area. The charging power of each charging pile shall meet the constraint (10):
where is the maximum charging power, is the maximum allowable charging power of the car on-board charger. The constraint on the total load under this substation is shown in Equation (11):
where S is the substation capacity, k is the allowable capacity ratio assigned for electric vehicles charging, C is the substation capacity limit from high-priority order. The total electricity power of the substation does not exceed the capacity limit is ensured by Equation (11)
where is the user’s target SOC, is the initial SOC when the user starts orderly charging process, . is the minimum charging capacity demanded by the user, is remaining capacity of the battery. The user’s charging capacity demand shall be met by Equation (12).
In the above model, the revenue of the charging service provider is maximized by the objective function. Compared with the strategy in Section 2.3.1, the optimization strategy aiming at maximizing the revenue of the charging service provider considers overall charging power limit of the station area so as to ensure that the load of the station area does not exceed the transformer capacity.
3. Results and Analysis
3.1. Departure Time Prediction Result
Once the user selects orderly charging on the app, the predicted departure time for this user will pop up automatically. If the predicted value is inconsistent with the user’s intention, the user can modify it manually. If the prediction time is accurate, the user directly starts the orderly charging process. A total of 83,200 senseless charging orders for 4708 users from 6 February to 6 May 2022 were used to analyze the departure time prediction results, as shown in Figure 3:
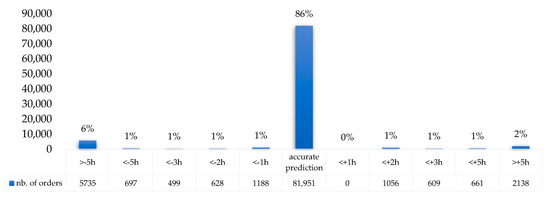
Figure 3.
User departure time prediction results.
For 70,965 senseless orders, the percentage of accurate prediction was 85.3% and the percentage of the deviation from the user’s real departure time within one hour, two hours, three hours, four hours, and five hours were respectively 3%, 4.7%, 5.8%, 6.5%, and 7.1%. The percentage of the deviation from the user’s real departure time beyond 5 h accounts for 7.6%. It can be concluded that the accuracy of user’s departure time prediction method could reach 85.3%.
3.2. Effective Analysis of Single Pile Charging Strategy
3.2.1. Optimization Result of a Single Pile Charging Strategy
A community’s electricity load curve from 11 a.m. on 18 April 2022 to 11 a.m. the next day is analyzed in this section. The electricity load curve without EV is shown in the gray curve below(Figure 4), and the peak power consumption occurs at 10:30 p.m.
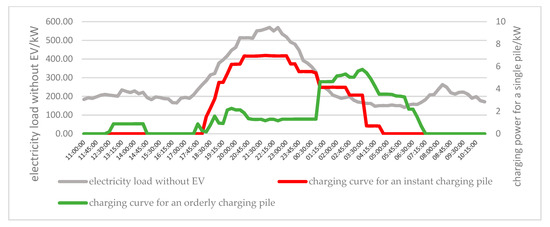
Figure 4.
Charging curves of an instant charging pile and an orderly charging pile.
The green curve is a single pile’s charging power with single pile charging strategy implemented and the red curve is an instant charging pile’s power curve. By comparing two charging curves, it can be found that the implementation of single pile orderly charging strategy shifts the charging peak period originally from 8 p.m. to 11:30 p.m. to 1 a.m. to 4 a.m., avoids overlapping with the peak period of basic power consumption of this substation area, and improves the power consumption safety of this community.
3.2.2. Effective Analysis of Single Pile Charging Strategy for Charging Pile Cluster
The application effect of a single pile charging strategy for large scale charging piles is analyzed with 1000 instant charging piles and 1000 orderly charging piles. The results are shown in Figure 5.
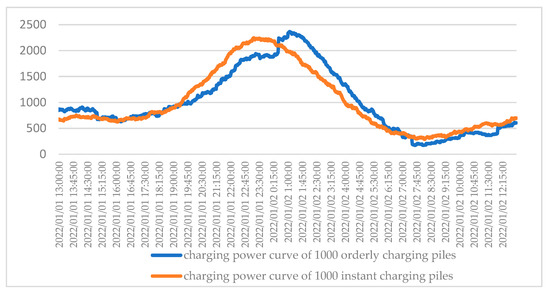
Figure 5.
Charging curves of large-scale charging piles with single charging strategy implemented.
The orange curve represents the charging power of 1000 instant charging piles, and the blue curve is the charging power of 1000 orderly charging piles. It can be found that through single pile optimization strategy, the peak value of charging pile cluster shifts from 11:13 p.m. to 1:06 a.m. the next day. For large scale charging piles, the application of orderly charging strategy greatly reduces the charging load in the 7 p.m. to midnight period, which alleviates the power grid pressure during this time and transfers more charging loads to midnight to 7 a.m., which promotes the consumption of renewable energy in this period.
3.3. Effective Analysis of Charging Strategy for Piles in the Same Substation Area
Five orderly charging piles in a community with rated power of 7 KW were used test and verify the charging strategy with substation maximum capacity considered. The subsidized electricity price in peak shaving market is shown in Figure 6. The residential power demand without EV is shown in Table 1, five colored horizontal bar columns represent five residential users, and the bar length indicates the user’s connection time. The initial SOC and the target SOC are written in the Table 1.
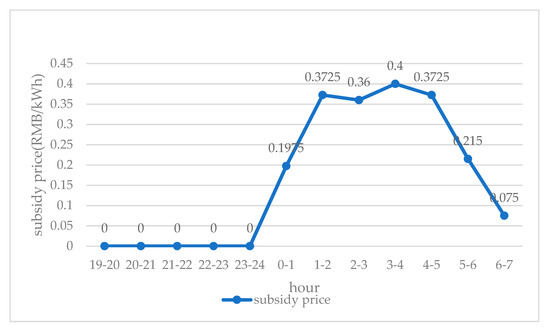
Figure 6.
Subsidized electricity price in peak shaving market.

Table 1.
The community’s residential power demand without EV.
Implement the optimization strategy presented in Section 2.3.2, but do not implement substation capacity constraint, the total load curve of this community is shown as the blue dotted line in Figure 7, and the charging curve of electric vehicles is shown as the gray dotted line. It can be found that the electric vehicles are mostly charged when there is a market subsidized price. The higher the subsidized price is, the higher the charging power of electric vehicles is. In this case, the income of charging service provider in this substation is 45.96 RMB.
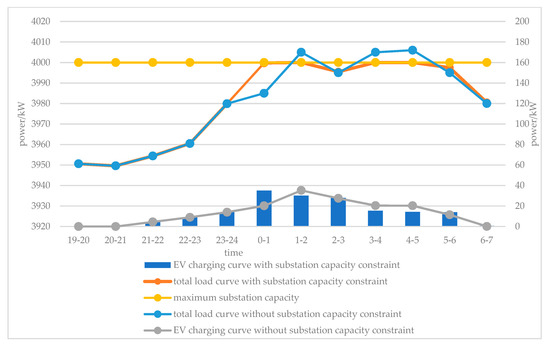
Figure 7.
Optimization result analysis of charging strategy for piles in the same substation area.
Implementing the substation capacity constraint, the electric vehicles’ charging curve is shown with the blue histogram in Figure 7. Part of the charging power is transferred to 0–1 a.m. when the subsidy price is lower, and the charging power in the original period of 3–5 a.m. is transferred to 6 a.m., so as to avoid exceeding the limit of transformer capacity. The overall income of the service provider is 41.73 RMB.
As more and more electric cars are charged in the community, the transformer capacity is insufficient to meet overall power demand. The application of single pile strategy may cause the transformer to overload. The simulation results show that the application of charging piles strategy in the same substation area can effectively solve this problem and maximize the income of charging service provider.
3.4. The Increase in Senseless Charging Orders
Two charging pile groups were used to track the charging orders for 25 weeks. Group 1 includes 1000 senseless orderly charging piles and the users’ participation rate in orderly charging is shown with the blue broken line in Figure 8. The maximum weekly participation rate was 47.54% and the lowest was 35.73%. The average users’ participation ratio in orderly charging for 25 weeks was 40%.
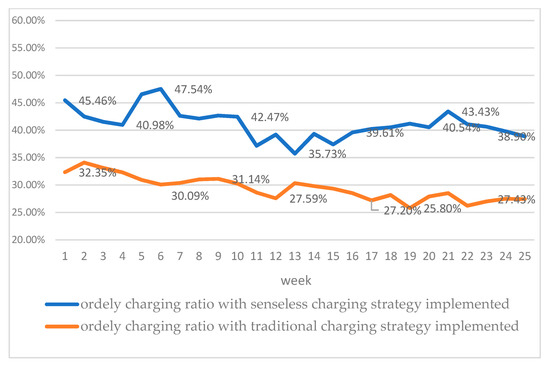
Figure 8.
Orders’ quantity comparison between senseless orderly charging piles and traditional orderly charging piles.
Group 2 includes 1000 traditional orderly charging piles. The results are shown with the orange broken line in Figure 8. The average users’ participation ratio in orderly charging is 28%, 12% lower than senseless orderly charging.
The demonstration application of senseless orderly charging piles was carried out in Beijing, Tianjin, North Hebei, and South Hebei Power Grid. The orders from 6 February 2022 to 6 May 2022 were selected for statistical analysis. The results are shown in Figure 9 and in Table 2 below.
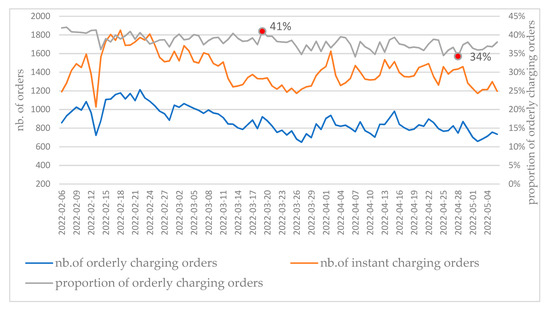
Figure 9.
Quantity of senseless charging orders in different cities/provinces.

Table 2.
Statistical results of orderly charging orders.
In Figure 9, the orange line represents the number of instant charging orders in North China, and the blue line represents the number of orderly charging orders. In 3 months, 207,750 orders were generated in North China, mainly in Beijing and Tianjin. The total number of orderly charging orders was 79,465, accounting for an average of 38.25%. Compared with the user participation rate of the traditional orderly charging strategy, the orderly charging order increased by 10%. It can be seen that the application of senseless orderly charging strategy improves users’ participation to a certain extent.
4. Conclusions and Perspectives
To solve the problems of traditional orderly charging, including complicated operation on the user side and charging demand unsatisfied, this paper proposes a senseless orderly charging strategy based on user demand prediction. Through the prediction of the user’s charging demand, the manual input parameters on the user’s app side are reduced, bringing the user a senseless charging experience. The orderly charging strategies are proposed under two scenarios with or without transformer capacity considered to maximize the service provider income or minimize the user’s charging cost. The case studies show that the senseless charging strategy not only realizes the friendly interaction between electric vehicles and power grid, but also improves the enthusiasm of users in participating in orderly charging.
As more and more renewable energy and dispatchable EV clusters are integrated into grid, the interaction between electric vehicles and grid plays an important role in new energy systems by means of promoting renewable energy consumption, improving power quality, and enhancing grid stability. Under this circumstance, more advanced technical skills for guiding electric vehicles participate in grid interaction need to be further developed.
Although the research results of this paper have improved the willingness of electric vehicle users to participate in orderly charging to a certain extent, most car owners still choose instant charging. Subsequent research needs to consider how to guide more electric vehicle users to participate in orderly charging through value transmission so as to further realize the friendly interaction between large-scale electric vehicles and the power grid.
Author Contributions
Conceptualization, W.D.; Software, Q.H., Y.L. and S.L.; Supervision, W.W. and X.P.; Writing—original draft, Y.Y. and S.G.; Writing—review & editing, Y.Y. and X.Z. All authors have read and agreed to the published version of the manuscript.
Funding
This work was supported by State Grid EV Service Co., Ltd. for Technology Project “Research on theoretical framework and key technology of electric vehicle load regulation for power system based on renewable energy”.
Institutional Review Board Statement
Not applicable.
Informed Consent Statement
Not applicable.
Conflicts of Interest
Ye Yang, Wen Wang, Xiaoqing Zhang, Xiaofeng Peng, Qingwen Han, Yao Li, Shuaihua Li, and Shiqiao Gao are employees of State Grid EV Service Co. The paper reflects the views of the scientists, and not the company.
References
- Lopes, J.A.P.; Soares, F.J.; Almeida, P.M.R. Integration of Electric Vehicles in the Electric Power System. Proc. IEEE 2011, 99, 168–183. [Google Scholar] [CrossRef] [Green Version]
- Sun, X.; Wang, W.; Su, L.; Jiang, J.; Xu, L.; He, X. Orderly charging control strategy for electric vehicles based on time of use electricity price. Autom. Electr. Power Syst. 2013, 37, 191–195. [Google Scholar]
- Kempton, W.; Letendre, S.E. Electric vehicles as a new power source for electric utilities. Transp. Res. Part D: Transp. Environ. 1997, 2, 157–175. [Google Scholar] [CrossRef]
- Yilmaz, M.; Krein, P.T. Review of the impact of vehicle - to - grid technologies on distribution systems and utility interfaces. IEEE Trans. Power Electron. 2013, 28, 5673–5689. [Google Scholar] [CrossRef]
- Kempton, W.; Kubo, T. Electric-drive vehicles for peak power in Japan. Energy Policy 2000, 28, 9–18. [Google Scholar] [CrossRef]
- Tayloe, J.; Maitra, A.; Alexander, M.; Brooks, D.; Duvall, M. Evaluation of the impact of plug-in electric vehicle loading on distribution system operations. In Proceedings of the IEEE Power & Energy Society General Meeting, Calgary, AB, Canada, 26–30 July 2009; pp. 2076–2081. [Google Scholar]
- Yang, Y.; Wang, W.; Jiang, Q.; Meng, D.; Diao, R.; Cheng, H.; Dai, Y.; Wang, M.; Li, S.; Zhong, Y. A DNN-based predictive optimization method for operating integrated EV charging stations with PV and battery storage. In Proceedings of the International Conference on Computer Graphics, Artificial Intelligence, and Data Processing, Harbin, China, 18 March 2022; pp. 225–232. [Google Scholar]
- Yang, Y.; Zhang, B.; Wang, W.; Wang, M.; Peng, X. Development pathway and practices for integration of electric vehicles and internet of energy. In Proceedings of the IEEE Sustainable Power and Energy Conference, Chengdu, China, 23–25 November 2020; pp. 2128–2134. [Google Scholar]
- Pan, Z.; Yu, T.; Wang, K. Decentralized coordinated dispatch for real-time optimization of massive electric vehicles considering various interests. Proc. CSEE 2019, 39, 3528–3540. [Google Scholar]
- Chen, K.; Ma, Z.; Zhou, S. Charging control strategy for electric vehicles based on two-stage multi-target optimization. Power Syst. Prot. Control 2020, 48, 65–72. [Google Scholar]
- Wu, W.; Huang, J.; Fang, W.; Hong, H.; Chen, W.; Che, C.; Yang, L.; Han, Q. EV orderly charge discharge strategies for residents considering charge delay time. Power Demand Side Manag. 2020, 22, 83–88. [Google Scholar]
- Peng, X.; Yang, Y.; Meng, D. Research on Orderly Charging Control Strategy in Demond Response. In Proceedings of the IEEE 4th International Conference on Renewable Energy and Power Engineering, Beijing, China, 9–11 October 2021; pp. 216–220. [Google Scholar]
Publisher’s Note: MDPI stays neutral with regard to jurisdictional claims in published maps and institutional affiliations. |
© 2022 by the authors. Licensee MDPI, Basel, Switzerland. This article is an open access article distributed under the terms and conditions of the Creative Commons Attribution (CC BY) license (https://creativecommons.org/licenses/by/4.0/).