
Location of Electric Vehicle Charging Piles Based on Set Coverage Model

Abstract
:1. Introduction
2. The Index System for Evaluating the Location of Electric Vehicle Charging Piles
2.1. Building the Index System for Evaluating the Location of Charging Piles
2.2. Entropy Method
2.3. TOPSIS Method
3. An Optimal Model for Choosing the Location of Charging Piles Based on Location Evaluation
3.1. Model Overview
3.2. Model Solution
4. Case Application
4.1. Background
4.2. Evaluation on the Location of Charging Piles
4.3. Optimal Location for Charging Piles
5. Conclusions
Author Contributions
Funding
Institutional Review Board Statement
Informed Consent Statement
Data Availability Statement
Conflicts of Interest
References
- Wang, N.; Liang, Y.L. Policy analysis and prospect of electric vehicle charging infrastructure under the background of new infrastructure. Automob. Ind. Res. 2021, 1, 8–15. [Google Scholar] [CrossRef]
- Guo, S.; Zhao, H. Optimal location selection of electric vehicle charging station by using fuzzy TOPSIS based on sustainability perspective. Appl. Energy 2015, 158, 390–402. [Google Scholar] [CrossRef]
- Siefi, S.; Karimi, H.; Soffianian, A.; Pourmanafi, S. GIS-based multi criteria evaluation for thermal power plant location selection in Kahnuj County, SE Iran. Civ. Eng. Infrastruct. J. 2017, 50, 179–189. [Google Scholar] [CrossRef]
- Solangi, Y.A.; Shah, S.A.A.; Zameer, H.; Ikram, M.; Saracoglu, B.O. Assessing the solar PV power project location selection in Pakistan: Based on AHP-fuzzy VIKOR approach. Environ. Sci. Pollut. Res. 2019, 26, 30286–30302. [Google Scholar] [CrossRef] [PubMed]
- Cao, X.; Hu, P.; Liu, D. Progress of research on electric vehicle charging stations. Prog. Geogr. 2019, 38, 139–152. [Google Scholar] [CrossRef]
- Kong, W.; Luo, Y.; Feng, G.; Li, K.; Peng, H. Optimal location planning method of fast charging station for electric vehicles considering operators, drivers, vehicles, traffic flow and power grid. Energy 2019, 186, 115826. [Google Scholar] [CrossRef]
- Ren, Q.L.; Wu, L.X.; Jin, X.G.; Su, L.X. Research on hierarchical progressive location method of electric vehicle charging stations. J. Chongqing Jiaotong Univ. 2018, 37, 121–126. [Google Scholar] [CrossRef]
- Yao, L. Research on electric vehicle charging station location selection based on hierarchical analysis method and fuzzy evaluation method. Heilongjiang Electr. Power 2015, 37, 313–317. [Google Scholar] [CrossRef]
- Wei, L. Research on location of new energy electric vehicle charging facilities based on multi-level gray evaluation method. J. Nanchang Univ. (Sci. Ed.) 2016, 40, 225–228. [Google Scholar] [CrossRef]
- Wang, J.Y. Research on the Evaluation of Electric Vehicle Charging Station Location Selection Based on FAHP. Master’s Thesis, Changchun University of Science and Technology, Changchun, China, 2018. [Google Scholar]
- Zhang, J. Research on Orderly Charging Strategy and Charging Facility Planning of Electric Vehicles. Master’s Thesis, Taiyuan University of Technology, Taiyuan, China, 2018. [Google Scholar]
- Xiang, H. Research on the Location of Urban Pure Electric Vehicle Charging Stations. Chongqing Jiaotong Univ. 2019, 04, 256–258. [Google Scholar] [CrossRef]
- Zhou, Y.T.; Dai, J.; Yuan, H.L.; Lu, Y. Research on demand prediction and planning layout of urban electric vehicle charging facilities. Power Syst. Prot. Control 2021, 49, 177–187. [Google Scholar] [CrossRef]
- Wu, H.F. Research on the layout of electric vehicle charging stations on highways. Lanzhou Jiaotong Univ. 2020, 34, 345–347. [Google Scholar] [CrossRef]
- Qin, L.; Qian, Z.W. Research on location selection of logistics distribution center based on combined weighting TOPSIS model. Econ. Math. 2019, 36, 100–105. [Google Scholar] [CrossRef]
- Yildiz, A.; Ayyildiz, E.; Gumus, A.T.; Ozkan, C. A modified balanced scorecard based hybrid pythagorean fuzzy AHP-topsis methodology for ATM location selection problem. Int. J. Inf. Technol. Decis. Mak. 2020, 19, 365–384. [Google Scholar] [CrossRef]
- Caner, H.I.; Aydin, C.C. Shipyard location selection by raster calculation method and AHP in GIS environment, İskenderun, Turkey. Mar. Policy 2021, 127, 104439. [Google Scholar] [CrossRef]
- Um, S.; Zhang, Y.; Li, B.; Zhu, Y. Comprehensive evaluation indexes fra- mework and evaluation method for substation location selection. J. Phys. Conf. Ser. 2021, 1887, 012034. [Google Scholar] [CrossRef]
- He, Y.H.; Huang, L.; Xiong, S.H. An airport fire station location evaluation model based on entropy weight intuitionistic fuzzy extension MULTIMOORA. Control. Decis. 2022, 4, 1–9. [Google Scholar] [CrossRef]
- Chen, J.H.; Sheng, D.R.; Li, W.; Ren, H.R. Multi-objective comprehensive evaluation model for thermal power plant engineering. Chin. J. Electr. Eng. 2002, 22, 153–156. [Google Scholar] [CrossRef]
- Zhang, S.; Zhu, L.M. Research on the location method of coal logistics nodes based on AHP. J. Nanjing Univ. Sci. Technol. 2015, 39, 301–305. [Google Scholar] [CrossRef]
- Hua, Y.P.; Wang, Y.Y.; Han, D.; Bu, F.F.; Wang, H.; Jia, Y.B. Medium- and long-term charging load prediction of electric vehicles in residential areas considering orderly charging. J. Power Syst. Autom. 2022, 4, 1–7. [Google Scholar] [CrossRef]
- Dai, H.; Zhang, P.L.; Sun, X.W. Research on location selection of logistics parks based on AHP-fuzzy comprehensive evaluation method. Logist. Technol. 2014, 33, 98–100. [Google Scholar] [CrossRef]
- Luo, H.; Ruan, J.; Li, F. A fuzzy evaluation and AHP based method for the energy efficiency evaluation of EV charging station. J. Comput. 2014, 9, 1185–1192. [Google Scholar] [CrossRef]
- Zenginis, I.; Vardakas, J.S.; Zorba, N.; Verikoukis, C.V. Analysis and quality of ser- vice evaluation of a fast charging station for electric vehicles. Energy 2016, 112, 669–678. [Google Scholar] [CrossRef]
- Tao, Y.; Huang, M.H.; Yang, L. Data-driven optimized layout of battery electric vehicle charging infrastructure. Energy 2018, 150, 735–744. [Google Scholar] [CrossRef]
- Sheng, M.M. Research and development of electric vehicle power supply technology. Intern. Combust. Engine Accessories 2022, 3, 190–192. [Google Scholar] [CrossRef]
- Darani, S.K.; Eslami, A.A.; Jabbari, M.; Asefi, H. Parking lot location selection using a fuzzy AHP-TOPSIS framework in Tuyserkan, Iran. J. Urban Plan. Dev. 2018, 144, 04018022. [Google Scholar] [CrossRef]
- Wei, L.; Li, S. Location selection for wind power plants based on weighted fuzzy TOPSIS and grey correlation degree. Renew. Energy Resour. 2019, 27, 135–137. [Google Scholar] [CrossRef]
- Ju, Y.; Ju, D.; Gonzalez, E.D.S.; Giannakis, M.; Wang, A. Study of location selection of electric vehicle charging station based on extended GRP method under picture fuzzy environment. Comput. Ind. Eng. 2019, 135, 1271–1285. [Google Scholar] [CrossRef]
- Guler, Y. Suitable location selection for the electric vehicle fast charging station with AHP and fuzzy AHP methods using GIS. Ann. GIS 2020, 26, 169–189. [Google Scholar] [CrossRef] [Green Version]
- Liang, Y.Y.; Guo, L.L.; Li, J.L.; Zhang, S.; Fei, X.Y. The Impact of Trade Facilitation on Cross-Border E-Commerce Transactions: Analysis Based on the Marine and Land Cross-Border Logistical Practices between China and Countries along the “Belt and Road”. Water 2021, 13, 3567. [Google Scholar] [CrossRef]
- Hasnain, S.; Ali, M.K.; Akhter, J.; Ahmed, B.; Abbas, N. Selection of an industrial boiler for a soda-ash production plant using analytical hierarchy process and TOPSIS approaches. Case Stud. Therm. Eng. 2020, 19, 100636. [Google Scholar] [CrossRef]
- Alao, M.A.; Popoola, O.M.; Ayodele, T.R. Selection of waste-to-energy technology for distributed generation using IDOCRIW-Weighted TOPSIS method: A case study of the City of Johannesburg, South Africa. Renew. Energy 2021, 178, 162–183. [Google Scholar] [CrossRef]
- Efthymiou, D.; Chrysostomou, K.; Morfoulaki, M.; Aifantopoulou, G. Electric vehicles charging infrastructure location: A genetic algorithm approach. Eur. Transp. Res. Rev. 2017, 9, 27. [Google Scholar] [CrossRef] [Green Version]
- Wang, J.; Bai, J.-Y.; Chen, J.-H.; Zhang, J.-Y. Optimal planning of charging station for electric vehicle based on simulated annealing genetic optimization algorithm. In Proceedings of the 2019 International Conference on Energy, Power, Environment and Computer Application (ICEPECA 2019), Wuhan, China, 20–21 January 2019; pp. 100–105. [Google Scholar] [CrossRef]
- Kabli, M.; Quddus, A.; Nurre, S.G.; Marufuzzaman, M.; Usher, J.M. A stochastic programming approach for electric vehicle charging station expansion plans. Int. J. Prod. Econ. 2020, 220, 107461. [Google Scholar] [CrossRef]
- Wang, Y.; Tang, K.W.; Lai, K.X.; Zhao, Z.H.; Xiong, J.; Liu, W.L. Dynamic stochastic planning based on shared electric vehicle charging station planning. Power Grid Technol. 2022, 3, 1–16. [Google Scholar] [CrossRef]
- Qin, Z.J.; Zhang, W.R.; Yang, P.; Li, Y.J. Research on distribution planning of electric vehicle charging station based on discrete location model. IOP Conf. Ser. Earth Environ. Sci. 2019, 252, 032164. [Google Scholar] [CrossRef]
- Bai, X.; Chin, K.S.; Zhou, Z.L. A bi-objective model for location planning of electric vehicle charging stations with GPS trajectory data. Comput. Ind. Eng. 2019, 128, 591–604. [Google Scholar] [CrossRef]
- Yang, L.; Hao, C.X.; Tang, R.H. Location model of charging and battery swap facilities based on electric logistics vehicles. Syst. Eng. Theory Pract. 2019, 39, 1781–1795. [Google Scholar] [CrossRef]
- Pan, M.Y.; Sun, X.K.; Li, X.D.; Chen, H.Y.; Wang, W.X.; Yuan, X.X.; Chen, Z. Layout optimization of charging piles based on cost-controlled ensemble coverage model. Mod. Electr. Power 2021, 38, 230–236. [Google Scholar] [CrossRef]
- Toregas, C.; Swain, R.; Revelle, C.; Bergman, L. The location of emergency services facilities. Oper. Res. 1971, 19, 1363–1373. [Google Scholar] [CrossRef]

| First-Level Indicators | Second-Level Indicators | Indicator Attribute | Source of Indicator | Source of Data |
|---|---|---|---|---|
| B1: economy | C1: gross district product | Positive | Statistical yearbook | |
| C2: fiscal revenue | Positive | |||
| C3: per capita disposable income | Positive | Wang J Y (2018) [10] and so on | ||
| B2: environment | C4: population | Positive | Wang J Y (2018) [10], Wan X H (2020) [13] and so on | |
| C5: land area | Positive | Zhang J (2018) [11] and so on | ||
| C6: population density within an area | Positive | Yao L (2015) [8] and so on | ||
| B3:cost | C7: land price | Negative | Xiang H (2019) [12] and so on | Bureau of Natural Resources |
| C8: construction cost | Negative | Wang J Y (2018) [10], Xiang H (2019) [12] and so on | The questionnaire survey | |
| C9: operatiion cost | Negative | |||
| B4: service quality | C10: the number of charging piles | Positive | China Liaoning Electric vehicle big data supervision platform | |
| C11: utilization | Negative | Wei L (2016) [9] and so on | ||
| C12: charging price | Negative | Wu H F (2020) [14] and so on |
| District | Number of Charging Stations | Number of Charging Piles | Number of Charging Ports | Number of Charging Ports Used | Number of Unused Charging Ports | Utilization Rate |
|---|---|---|---|---|---|---|
| D1 | 10 | 57 | 57 | 19 | 38 | 33.33% |
| D2 | 5 | 32 | 32 | 22 | 10 | 68.75% |
| D3 | 6 | 54 | 84 | 73 | 11 | 86.90% |
| D4 | 2 | 6 | 6 | 6 | 0 | 100% |
| D5 | 3 | 28 | 28 | 12 | 16 | 42.86% |
| D6 | 2 | 28 | 28 | 20 | 8 | 71.43% |
| D7 | 9 | 128 | 128 | 72 | 56 | 56.25% |
| D8 | 6 | 59 | 59 | 54 | 17 | 91.53% |
| D9 | 4 | 29 | 29 | 25 | 4 | 86.21% |
| D10 | 1 | 12 | 12 | 11 | 1 | 91.37% |
| D1 | D2 | D3 | D4 | D5 | D6 | D7 | D8 | D9 | D10 | |
|---|---|---|---|---|---|---|---|---|---|---|
| 947.2 | 965.5 | 776.6 | 564.1 | 982.3 | 227.2 | 546 | 373.4 | 364.4 | 189.3 | |
| 91.1 | 79.3 | 84.6 | 37.5 | 118.5 | 23.9 | 87.5 | 40.6 | 38.1 | 8.6 | |
| 52,852 | 52,510 | 47,854 | 47,379 | 47,373 | 37,527 | 49,158 | 42,273 | 48,681 | 36,908 | |
| 74.4 | 72 | 63.8 | 84.6 | 98.7 | 42.5 | 44.6 | 34.3 | 46.9 | 51 | |
| 59 | 60 | 100 | 66 | 286 | 782 | 734 | 884 | 499 | 1645 | |
| 12,608 | 11,998 | 6380 | 12,812 | 3449 | 544 | 608 | 388 | 939 | 310 | |
| 2441 | 2441 | 2441 | 1826 | 1419 | 358 | 944 | 324 | 706 | 581 | |
| 0.18 | 0.18 | 0.18 | 0.14 | 0.11 | 0.03 | 0.07 | 0.02 | 0.05 | 0.04 | |
| 0.96 | 0.56 | 0.20 | 0.14 | 0.26 | 0.04 | 0.36 | 0.08 | 0.09 | 0.01 | |
| 7 | 3 | 6 | 2 | 3 | 2 | 9 | 6 | 4 | 1 | |
| 33.33 | 68.75 | 86.9 | 100 | 42.86 | 71.43 | 56.25 | 91.53 | 86.21 | 91.37 | |
| 0.76 | 0.76 | 0.77 | 0.94 | 0.76 | 0.78 | 0.76 | 0.78 | 0.76 | 0.78 |
| Index | ||||||||||||
|---|---|---|---|---|---|---|---|---|---|---|---|---|
| Information entropy | 0.862 | 0.890 | 0.898 | 0.869 | 0.732 | 0.704 | 0.818 | 0.813 | 0.943 | 0.866 | 0.855 | 0.954 |
| Weights | 0.077 | 0.061 | 0.057 | 0.073 | 0.149 | 0.164 | 0.101 | 0.104 | 0.032 | 0.074 | 0.081 | 0.026 |
| District | D1 | D2 | D3 | D4 | D5 | D6 | D7 | D8 | D9 | D10 |
|---|---|---|---|---|---|---|---|---|---|---|
| 0.109 | 0.112 | 0.117 | 0.117 | 0.123 | 0.135 | 0.120 | 0.129 | 0.135 | 0.123 | |
| 0.121 | 0.113 | 0.088 | 0.106 | 0.066 | 0.051 | 0.068 | 0.064 | 0.041 | 0.108 |
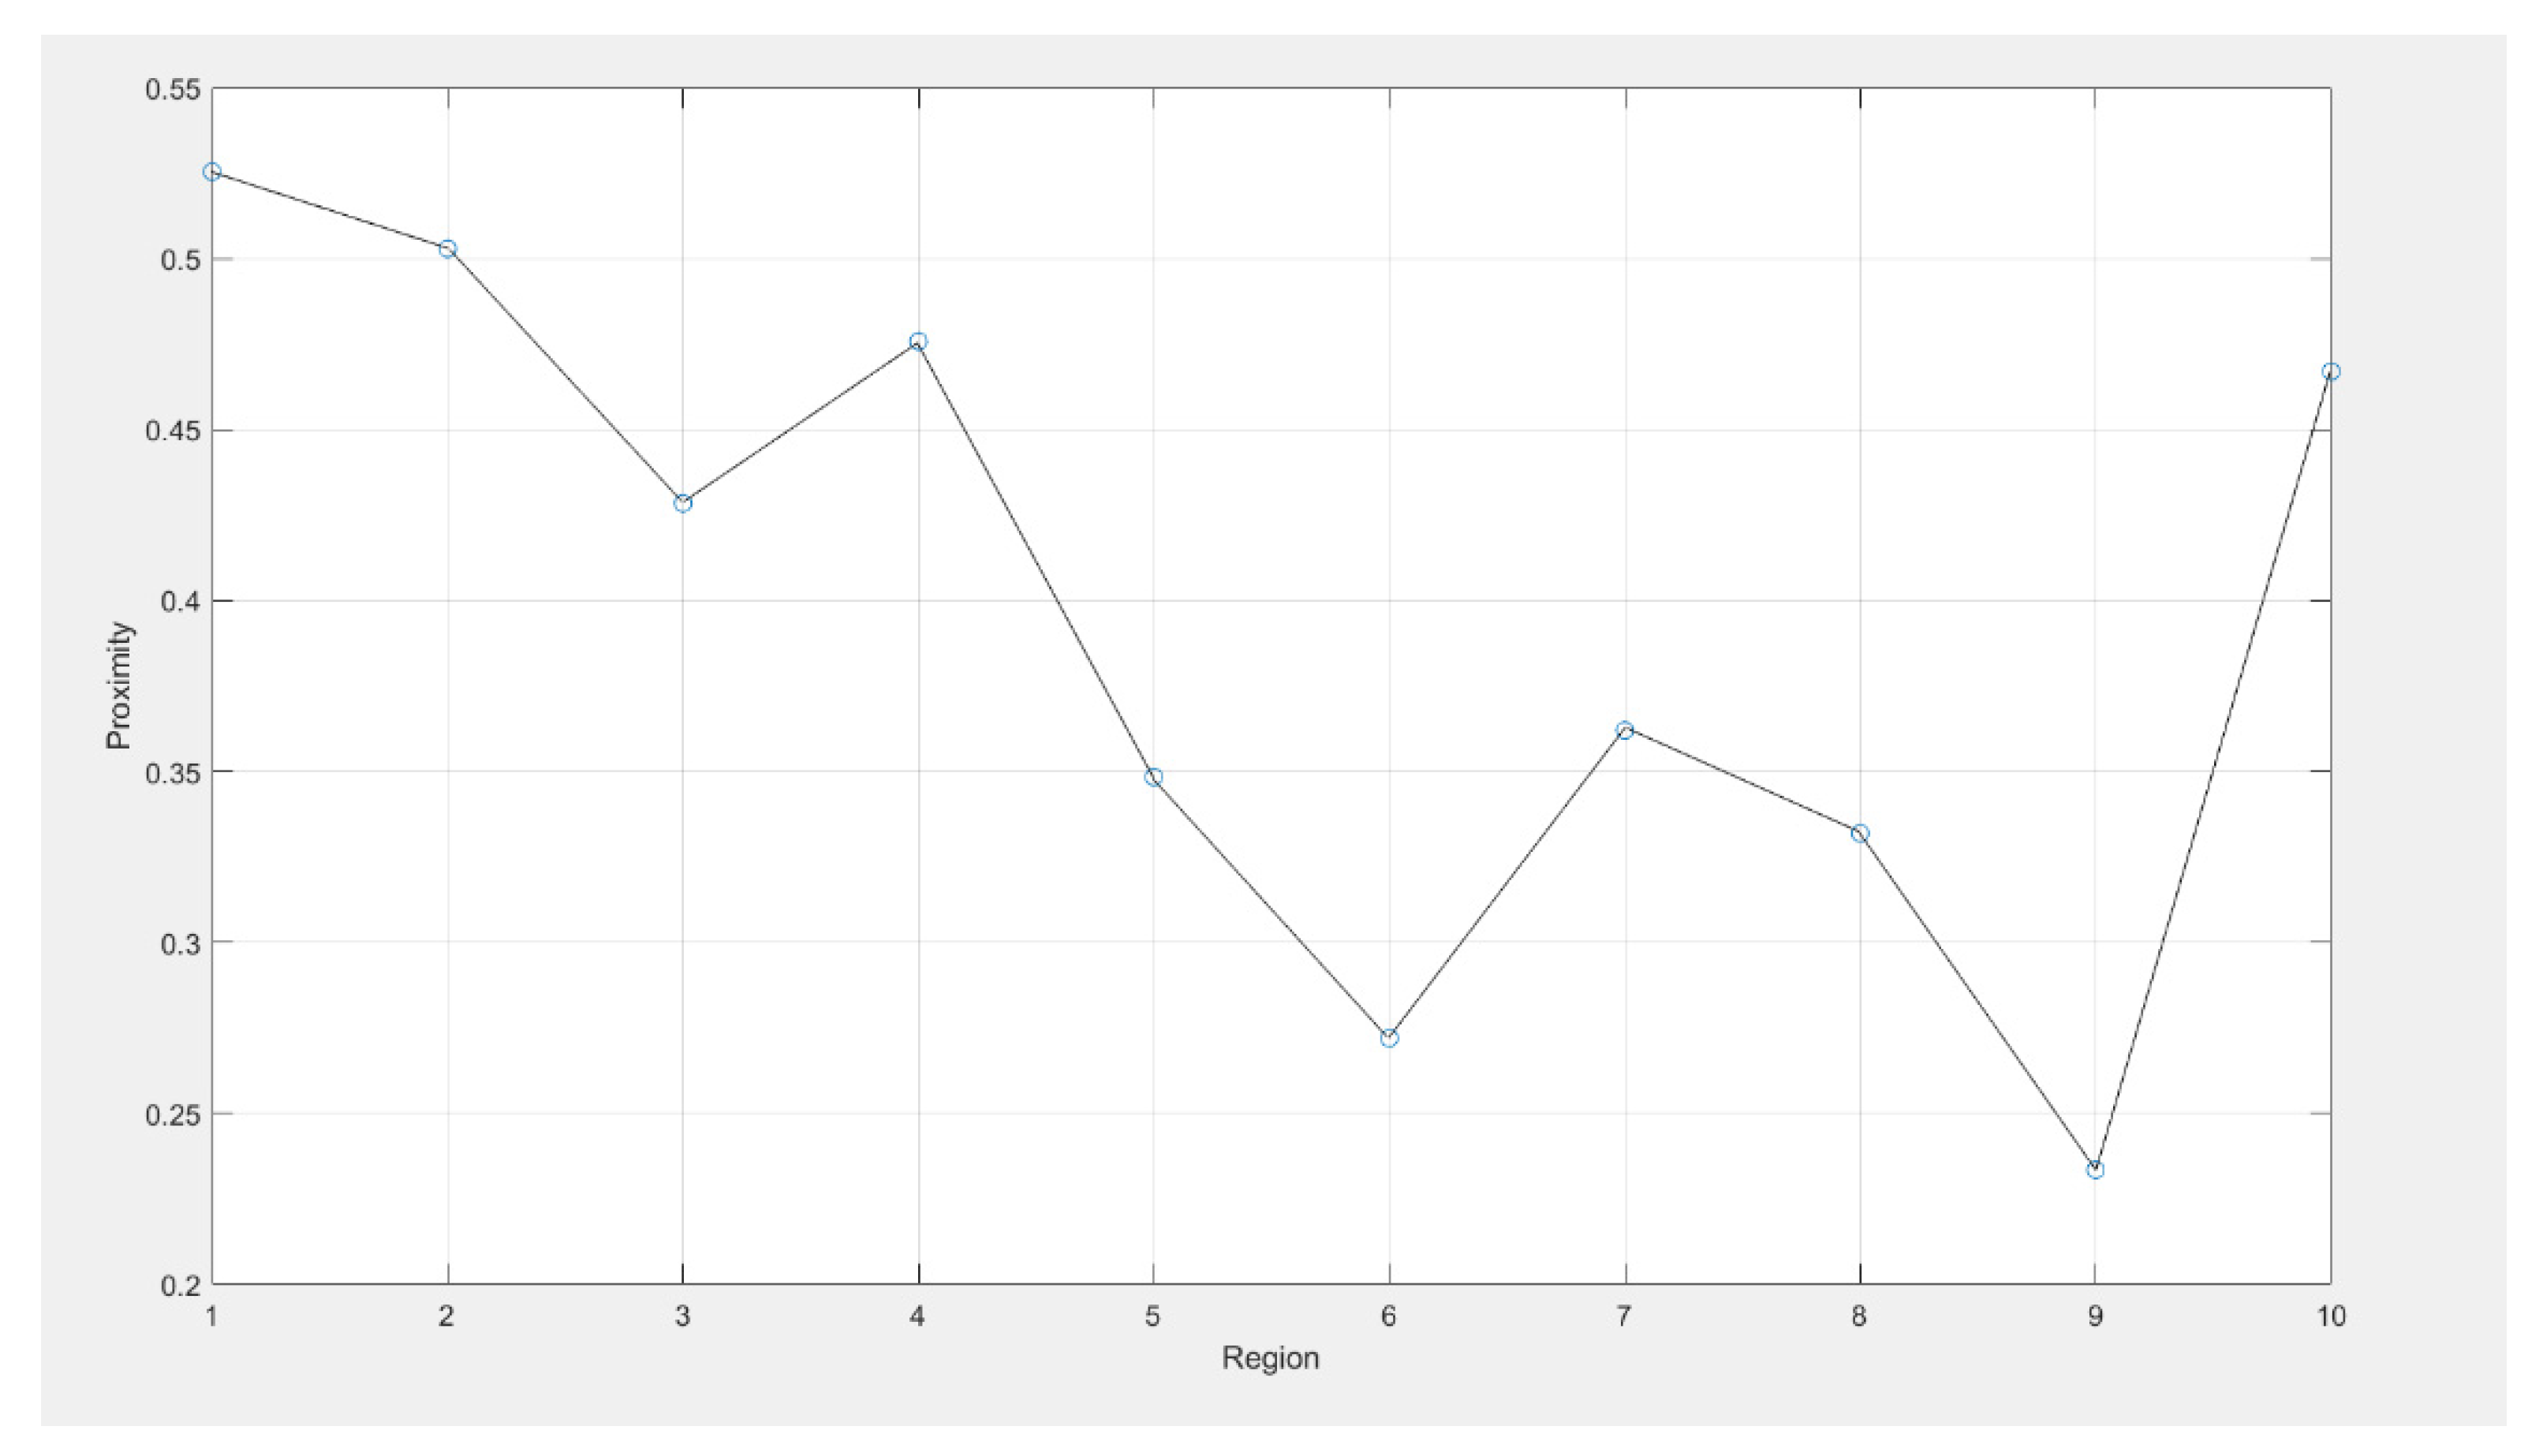
| District | D1 | D2 | D3 | D4 | D5 | D6 | D7 | D8 | D9 | D10 |
|---|---|---|---|---|---|---|---|---|---|---|
| Proximity | 0.5254 | 0.5029 | 0.4284 | 0.4758 | 0.3484 | 0.2720 | 0.3620 | 0.3319 | 0.2335 | 0.4670 |
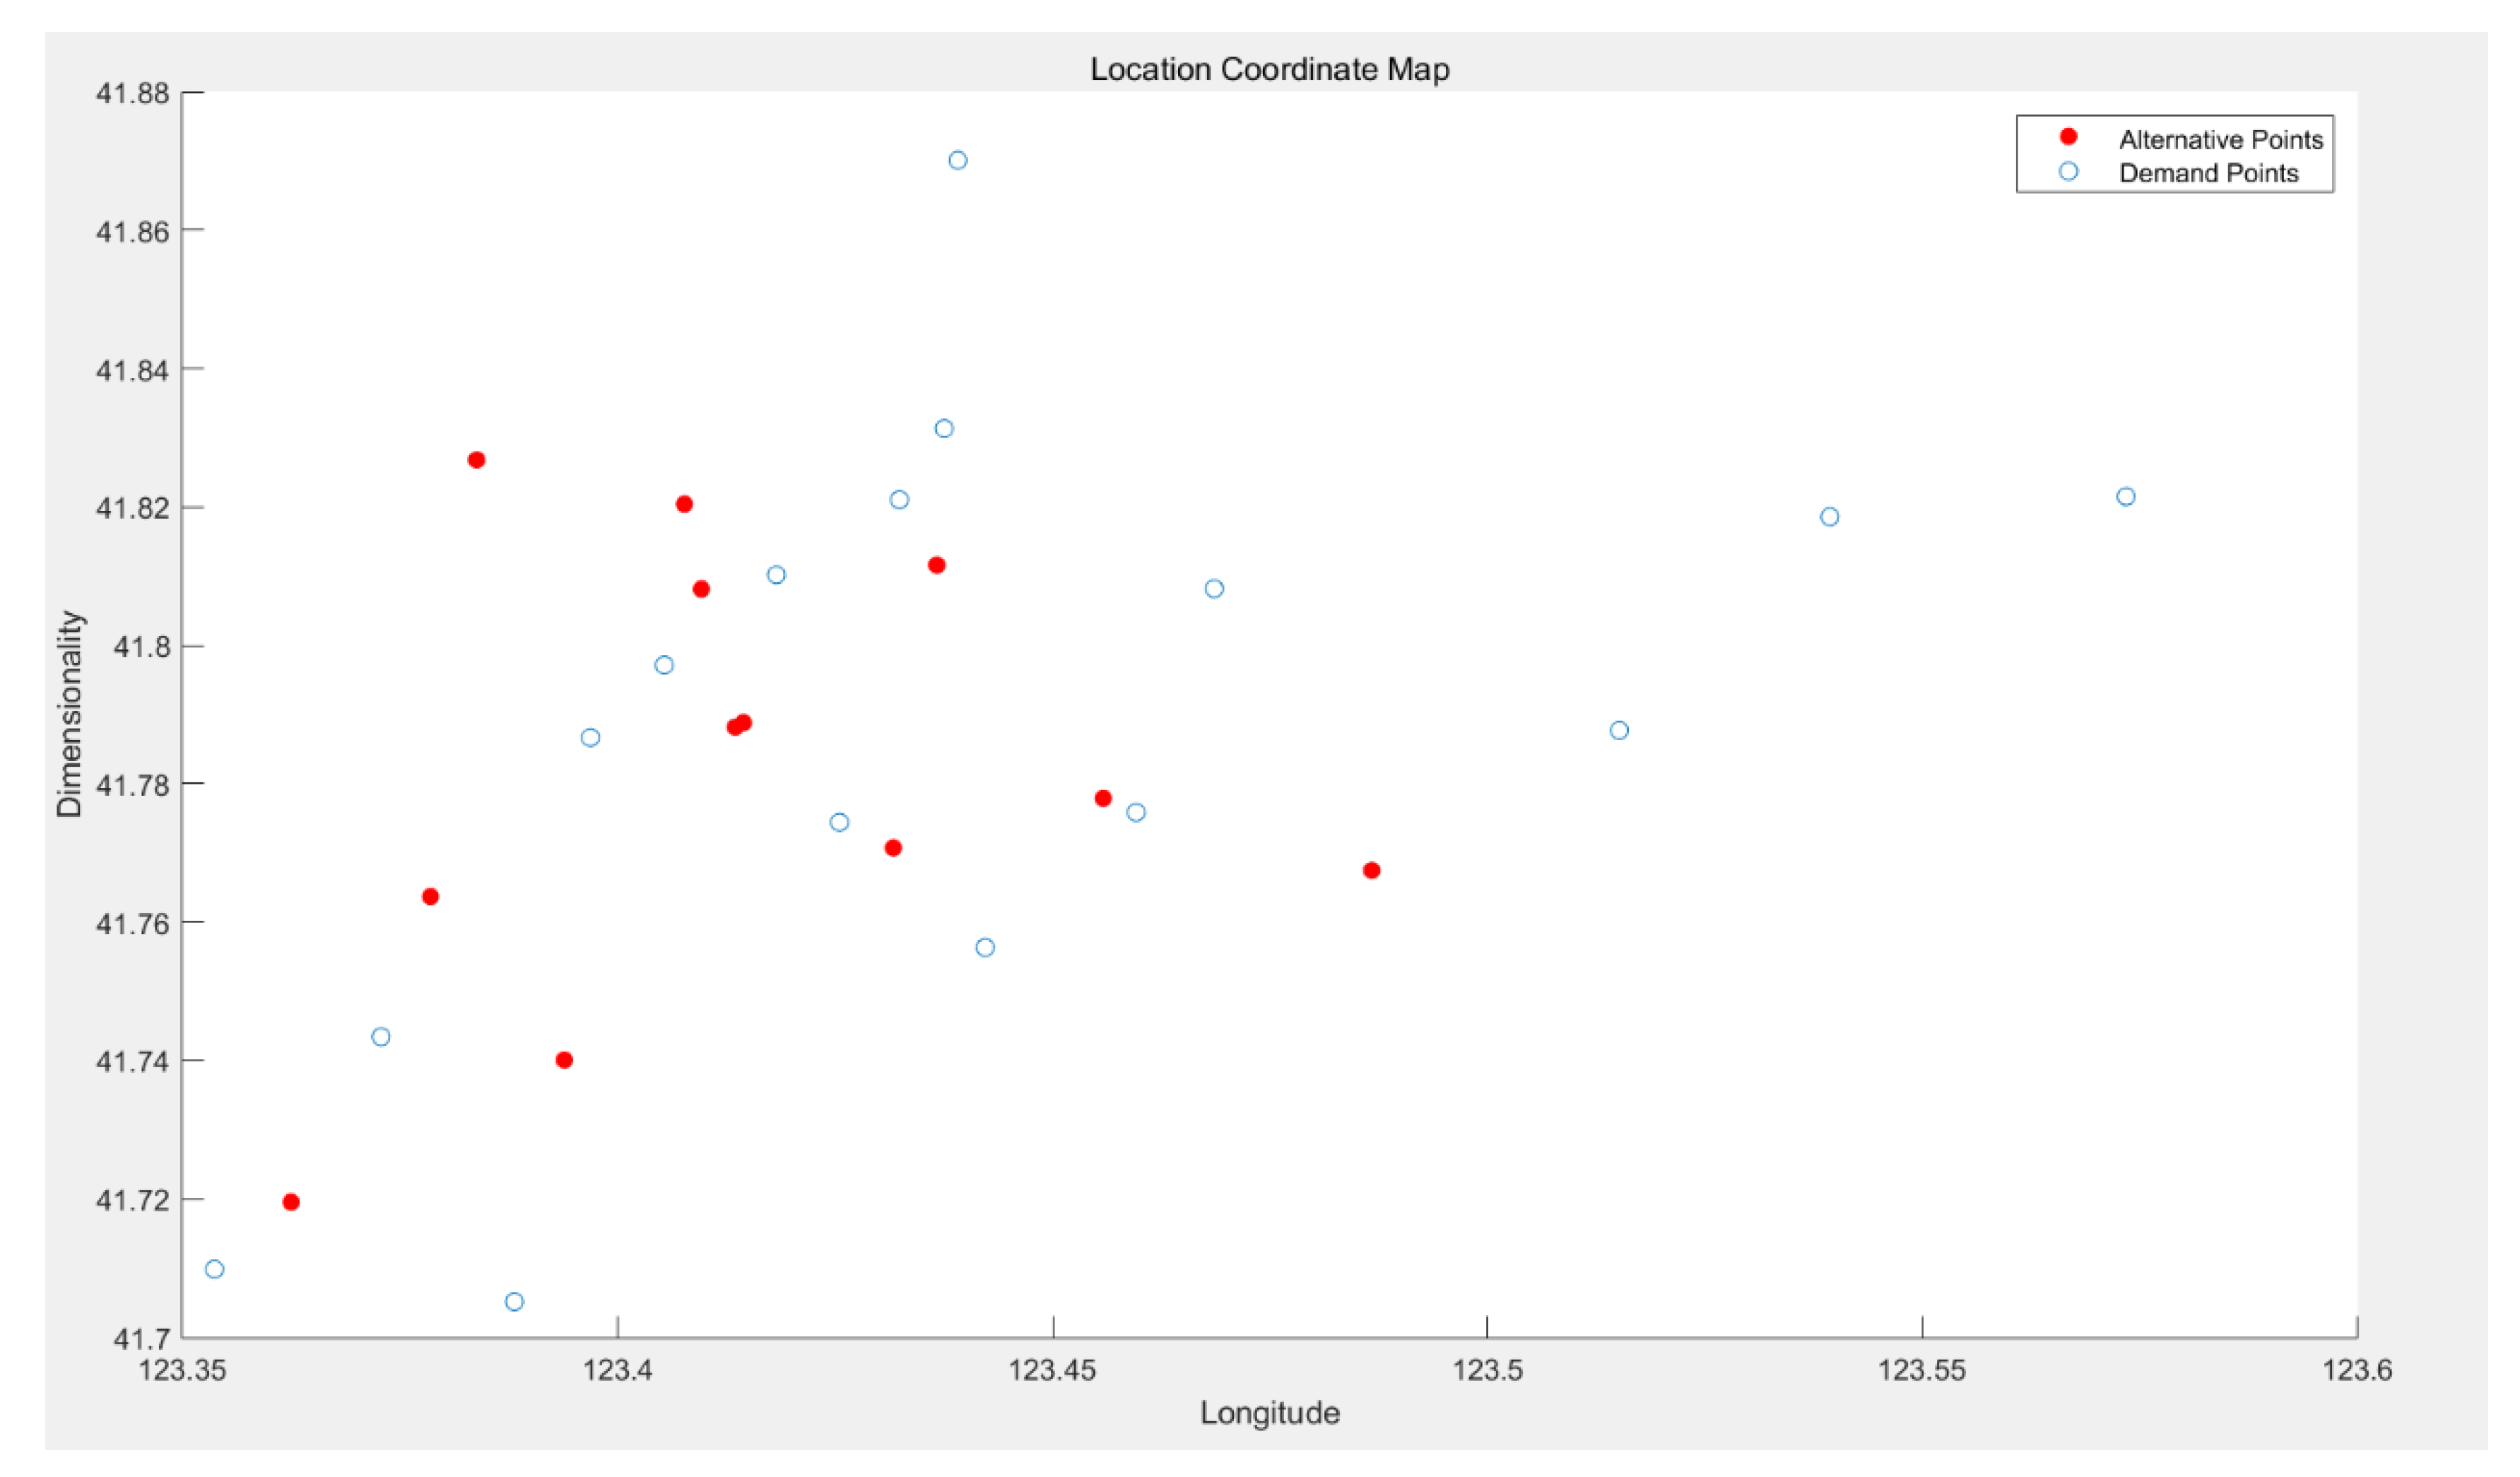
| Candidate Points | Name of the Charging Station | Latitude and Longitude (X, Y) |
|---|---|---|
| Fast Charging Station of the Power Supply Company in the Subcenter of the First District of City S | 123.41445, 41.788826 | |
| Fast Charging Station in the Parking Lot of the Power Supply Company in City S | 123.41351, 41.78819 | |
| Charging Station in the Power Supply Business Hall S in the First District of City S | 123.37849, 41.763702 | |
| Charging Station in the Power Supply Business Hall X in the First District of City S | 123.40962, 41.808136 | |
| Charging Station in the Power Supply Business Hall C in the First District of City S | 123.39387, 41.740097 | |
| Charging Station on Road Z in the First District of City S | 123.36247, 41.71956 | |
| Charging Station in the Power Supply Business Hall Z in the First District of City S | 123.43168, 41.770733 | |
| Charging Station in the Car Rental Company in City S | 123.48667, 41.767483 | |
| Electric vehicle public fast charging station in S city Charging Station in the Parking Lot of the Washington Square in the Second District City S | 123.436676, 41.8116 | |
| Charging Station on Road Wenyi in the Second District City S | 123.4558, 41.7779 | |
| Charging Station in the Power Supply Business Hall in the Fourth District of City S | 123.40768, 41.82042 | |
| Charging Station in Nujiang Power Supply Business Hall in the Fourth District of City S | 123.3838, 41.826805 |
| Demand Point | Longitude and Latitude (X, Y) | Demand Point | Longitude and Latitude (X, Y) |
|---|---|---|---|
| 123.353662, 41.70986 | 123.432386, 41.821043 | ||
| 123.442238, 41.756343 | 123.46856, 41.808196 | ||
| 123.425494, 41.774437 | 123.539312, 41.81859 | ||
| 123.396867, 41.786684 | 123.573367, 41.821507 | ||
| 123.388137, 41.705164 | 123.515103, 41.787712 | ||
| 123.372811, 41.743452 | 123.45959, 41.775882 | ||
| 123.40536, 41.797148 | 123.43753, 41.831327 | ||
| 123.41823, 41.810196 | 123.439101, 41.870088 |
| Candidate Point | Demand Points Covered within the Radius of 3 km | Candidate Point | Demand Points Covered within the Radius of 3 km |
|---|---|---|---|
| None | |||
| None |
| Candidate Point | Longitude and Latitude | District |
|---|---|---|
| 123.37849, 41.763702 | D1 | |
| 123.40962, 41.808136 | D1 | |
| 123.36247, 41.71956 | D1 | |
| 123.48667, 41.767483 | D2 | |
| 123.436676, 41.8116 | D2 | |
| 123.40768, 41.82042 | D4 | |
| 123.372811, 41.743452 | D1 | |
| 123.41823, 41.810196 | D1 | |
| 123.539312, 41.81859 | D2 | |
| 123.573367,41.821507 | D2 | |
| 123.45959, 41.775882 | D2 |
Publisher’s Note: MDPI stays neutral with regard to jurisdictional claims in published maps and institutional affiliations. |
© 2022 by the authors. Licensee MDPI, Basel, Switzerland. This article is an open access article distributed under the terms and conditions of the Creative Commons Attribution (CC BY) license (https://creativecommons.org/licenses/by/4.0/).
Share and Cite
Liang, Y.; Fei, X.; Li, J.; He, X.; Gu, H. Location of Electric Vehicle Charging Piles Based on Set Coverage Model. World Electr. Veh. J. 2022, 13, 77. https://doi.org/10.3390/wevj13050077
Liang Y, Fei X, Li J, He X, Gu H. Location of Electric Vehicle Charging Piles Based on Set Coverage Model. World Electric Vehicle Journal. 2022; 13(5):77. https://doi.org/10.3390/wevj13050077
Chicago/Turabian StyleLiang, Yingying, Xiangyun Fei, Jianlu Li, Xiao He, and He Gu. 2022. "Location of Electric Vehicle Charging Piles Based on Set Coverage Model" World Electric Vehicle Journal 13, no. 5: 77. https://doi.org/10.3390/wevj13050077
APA StyleLiang, Y., Fei, X., Li, J., He, X., & Gu, H. (2022). Location of Electric Vehicle Charging Piles Based on Set Coverage Model. World Electric Vehicle Journal, 13(5), 77. https://doi.org/10.3390/wevj13050077