Article

Research on Application Performance Index System of Pure Electric Buses Based on Extensible Cloud Model

1
Key Laboratory of Operation Safety Technology on Transport Vehicles, Ministry of Transport of the People’s Republic of China, Beijing 100088, China
2
School of Traffic & Transportation, Chongqing Jiaotong University, Chongqing 400074, China
3
Research Institute of Highway Ministry of Transport, Beijing 100088, China
4
Chongqing Ulit Technology Co., Ltd., Chongqing 408319, China
*
Author to whom correspondence should be addressed.
World Electr. Veh. J. 2022, 13(3), 45; https://doi.org/10.3390/wevj13030045
Submission received: 24 January 2022 / Revised: 20 February 2022 / Accepted: 23 February 2022 / Published: 25 February 2022

Abstract

:
In order to help select high-quality electric buses, we established a performance index system for pure electric buses based on an extensible cloud model. With the rapid development of electric buses, choosing a suitable pure electric bus considering its applicability is challenging. Based on the analysis of the characteristics of the passenger car industry, a preliminary evaluation index system for pure electric passenger cars was constructed. The preliminary indicator system was formed based on the optimization of the main points of current laws and regulations, and divided into four aspects: safety assistance system, comfort, convenience, and economy. Then, the index system was determined from multiple perspectives, and the analytic hierarchy process and the entropy weight method were applied to determine the comprehensive weight. Meanwhile, the evaluation level of the index system of pure electric buses was calculated by the extensible cloud model. At last, six electric buses were selected from Chinese electric bus companies as examples to determine the relevant level. The results show that the method has satisfactory feasibility and applicability in the comprehensive evaluation and that it provides a reference for pure electric bus selection based on application performance.

1. Introduction

Pure electric vehicles are completely driven by electricity, without fossil fuels, engines, and transmission shafts. They have high energy density batteries, motors, and electronic control systems. Compared with ordinary fuel vehicles, pure electric vehicles have obvious advantages: low costs, a better experience for the passengers, less noise, and less exhaust. Therefore, vigorously developing pure electric buses is conducive to the development of public transport. Furthermore, exhaust pollution from operating vehicles can be reduced. However, how to choose a suitable pure electric bus considering its applicability has become a challenging problem.
At present, there are many performance evaluation models for electric buses, mainly focusing on battery performance evaluation and environmental impact evaluation. In terms of battery performance evaluation, since the mileage of pure electric buses is less than that of traditional buses, Zhang et al. [1] believe that mileage is the focus of performance evaluation, and the battery energy-saving performance is used as an indicator to build an evaluation model. Jwa et al. [2] compared various electric buses with diesel buses and compared their environmental impacts during the life cycle and found that lithium battery electric buses are better in terms of energy consumption and emissions, but there are still problems in terms of travel. Horita et al. [3] analyzed the coupling between lithium batteries and various types of electric buses and found that lithium batteries are more suitable for small electric buses. In terms of environmental impact assessment, Todorut et al. [4] believe that public transport needs to alleviate the problem of carbon emission pollution and use CO2 emissions as an evaluation indicator for pure electric buses. Subsequently, Varga et al. [5] increased the NOx emission indicator. On this basis, Shauna et al. [6] used fuel economy and emission efficiency as evaluation indicators, conducted comparison experiments between pure electric buses and diesel buses in the cities of Nevada and Iowa, and found that the fuel economy of electric buses increased by at least 29%.
In addition, there are some comprehensive evaluation methods [7]. Li et al. [8] believe that the evaluation method cannot only conduct a single evaluation study in the battery or energy consumption, and proposed a pure electric bus performance evaluation method based on energy consumption and battery life. Looking for a balanced performance evaluation system for electric buses, Barraza et al. [9] proposed a performance evaluation method that takes into account the efficiency and cost involved in different powertrains. Hamurcu et al. [10] proposed a multi-objective decision-making process based on Analytic Hierarchy Process (AHP) and Technique for Order Preference by Similarity to Ideal Solution (TOPSIS). Furthermore, Wolek et al. [11] used MCDM to analyze the strategic decision for the electrification of urban buses in Poland. Romero-Ania et al. [12] used MCDM to analyze sustainable buses in terms of economy, environment, perception, etc. Zhang et al. [13] included the reliability, energy consumption, influencing factors, and emissions of the vehicle in the performance evaluation of hybrid electric buses, and formed a complete comprehensive evaluation framework, which has reference significance for the performance evaluation of pure electric buses. Anttila et al. [14] proposed a performance evaluation method for electric buses based on chassis dynamometer measurements. The method uses powertrain efficiency tests to provide performance testing techniques for heavy-duty electric vehicles under laboratory conditions.Based on real data, Liu et al. [15] proposed an evaluation method for pure electric buses based on road operation tests. Oier et al. [16] and Du et al. [17] proposed electric bus performance evaluation methods from different perspectives based on Stockholm and Chinese cities, respectively.
MCDM is a method to find the best alternative from all feasible alternatives according to some criteria or properties, which is suitable for complex decision problems. Hassanpour et al. [18] used MCDM models to evaluate the household appliance industry and scored the efficiency of the sustainable development of home appliances. Badi et al. [19] obtained the most important criteria for location selection based on the FUCOM method, and Alossta et al. [20] solved the optimal location selection problem through the AHP method combined with the RAFSI model. In the field of logistics, Karamaşa et al. [21] identified priority factors for the impact of logistics outsourcing based on Neutrosophic AHP. Bakır et al. [22] and Blagojević et al. [23] combined Fuzzy AHP with Fuzzy MARCOS and DEA, respectively, to study the application of MCDM in transportation. To sum up, there are many excellent decision-making methods for MCDM. Although AHP is less accurate than new methods such as FUCOM, AHP still has many advantages. First, AHP is concise and easy for decision makers to directly understand and master. Second, AHP has a wide range of applications, and has applications in site selection, logistics, and transportation. Third, AHP has strong practicability and can be used in combination with other methods to make up for its shortcomings.
The extension theory can quantitatively calculate the characteristics of things through the correlation function, but its disadvantage is that it is not easy to deal with the discretization problem [24]. The cloud model is a model of uncertain conversion between qualitative concepts and quantitative values, proposed by Li in 1995 [25]. The cloud model can effectively overcome the above defects and quantitatively describe the transformation situation of the measured indicators at different levels according to the random relationship between the field measured indicators and the evaluation result grades. Combining the cloud model with the extension theory to improve the defects of the extension theory, a comprehensive evaluation model of the extension cloud theory that can realize the combination of qualitative and quantitative description is obtained [26]. At present, this model is rarely used in the evaluation of vehicle index systems. Zhang et al. [27] proposed a comprehensive evaluation study of rail transit and branch line traffic transfer based on an extension cloud model. Wu et al. [28] and Li et al. [29] evaluated the safety and economics of urban rails using a cloud model. Compared with the previous evaluation model, this model is better in evaluation accuracy and precision.
Therefore, in this paper, we combine the objective AHP method with the subjective entropy weight method to determine the comprehensive weight of the application performance index system of pure electric buses, and calculate the evaluation level of the pure electric bus index system based on an extensible cloud model.

2. Construction of the Evaluation Index System for the Operation Performance of Pure Electric Buses

2.1. Principles for the Construction of the Performance Evaluation Index System of Pure Electric Buses

In order to build a comprehensive, reasonable, and feasible evaluation index system, in addition to fully considering the operational characteristics of buses and the technical characteristics of pure electric vehicles, some principles should be followed.
The bus is the main public passenger transportation mode in cities. In megacities, it can also run in parallel with subways and trams on main lines to increase the line coefficient and line network density. Its one-way transport capacity is 800–2000 passengers per hour, and the average transport speed is 16–25 km per hour.
It has the advantages of efficient mobility, relatively low original investment, quick opening of new routes or changes to existing routes, and flexible transportation organization. To analyze the pure electric bus operating performance, it is necessary to consider the operating characteristics of buses. The characteristics of buses are consistent and reflect the characteristics of the bus industry, which should be considered for pure electric vehicles.
(1)
High security requirements
Urban bus passenger safety is the most important part of road safety, and it is also the top priority of urban public safety. It is the first criterion for the needs of transportation companies. Therefore, bus operators must take safety as the first demand, and consider safety as a priority. Vehicles with safety problems are rejected.
In the pure electric bus operation performance evaluation index system, to enter the bus market, buses need to meet access standards in terms of structural safety, etc., and there are relevant test standards and evaluation systems to evaluate the safety of the main body structure of the vehicle.
(2)
Higher comfort requirements
With the continuous improvement of China’s urbanization rate, the urban population is increasing, and the demand for public transportation is gradually increasing. On the one hand, in order to better meet the convenience needs of passengers getting on and off the bus, the bus needs to have two doors at the front and the rear and appropriate aisle space to facilitate the movement of passengers during the morning and evening rush hours. On the other hand, the bus driver also needs to be considered in the bus demand level. Ensuring the safety and comfort of driver facilities and equipment on the vehicle is also a consideration in bus selection.
(3)
High reliability requirements
In order to facilitate bus operation and passengers, bus vehicles have strict time schedules. Vehicles and drivers usually work at fixed hours. Therefore, in the event of a vehicle failure or other situations that cannot be dispatched on time, it is necessary to stop the corresponding shift or adjust the entire transportation plan. Both of these methods can lead to adverse factors such as increased waiting time and increased vehicle congestion in the public transportation system. Therefore, it is necessary to choose high-reliability products as much as possible for public transportation vehicles.
(4)
Ease of maintenance requirements
On the basis of the high reliability of the bus, once the product fails during working hours, it needs to be repaired, and the length of the repair time will affect the degree of impact on the entire timetable. The shorter the time, the lesser the impact on the timetable. Therefore, the bus vehicle should be easy to maintain, and the personnel at the bus station should be able to quickly repair it, instead of it having to travel to a more professional maintenance location, such as a manufacturer, for a longer repair.
(5)
High economic demand
As an operational service industry, bus service needs to be able to reduce operating costs as much as possible, thereby increasing the profits of bus companies. As a means of transportation with high daily operation and shutdown, the cost per unit of time and space is the most important consideration for operating companies. In order to minimize operating costs and increase profits, bus economy is an important consideration.

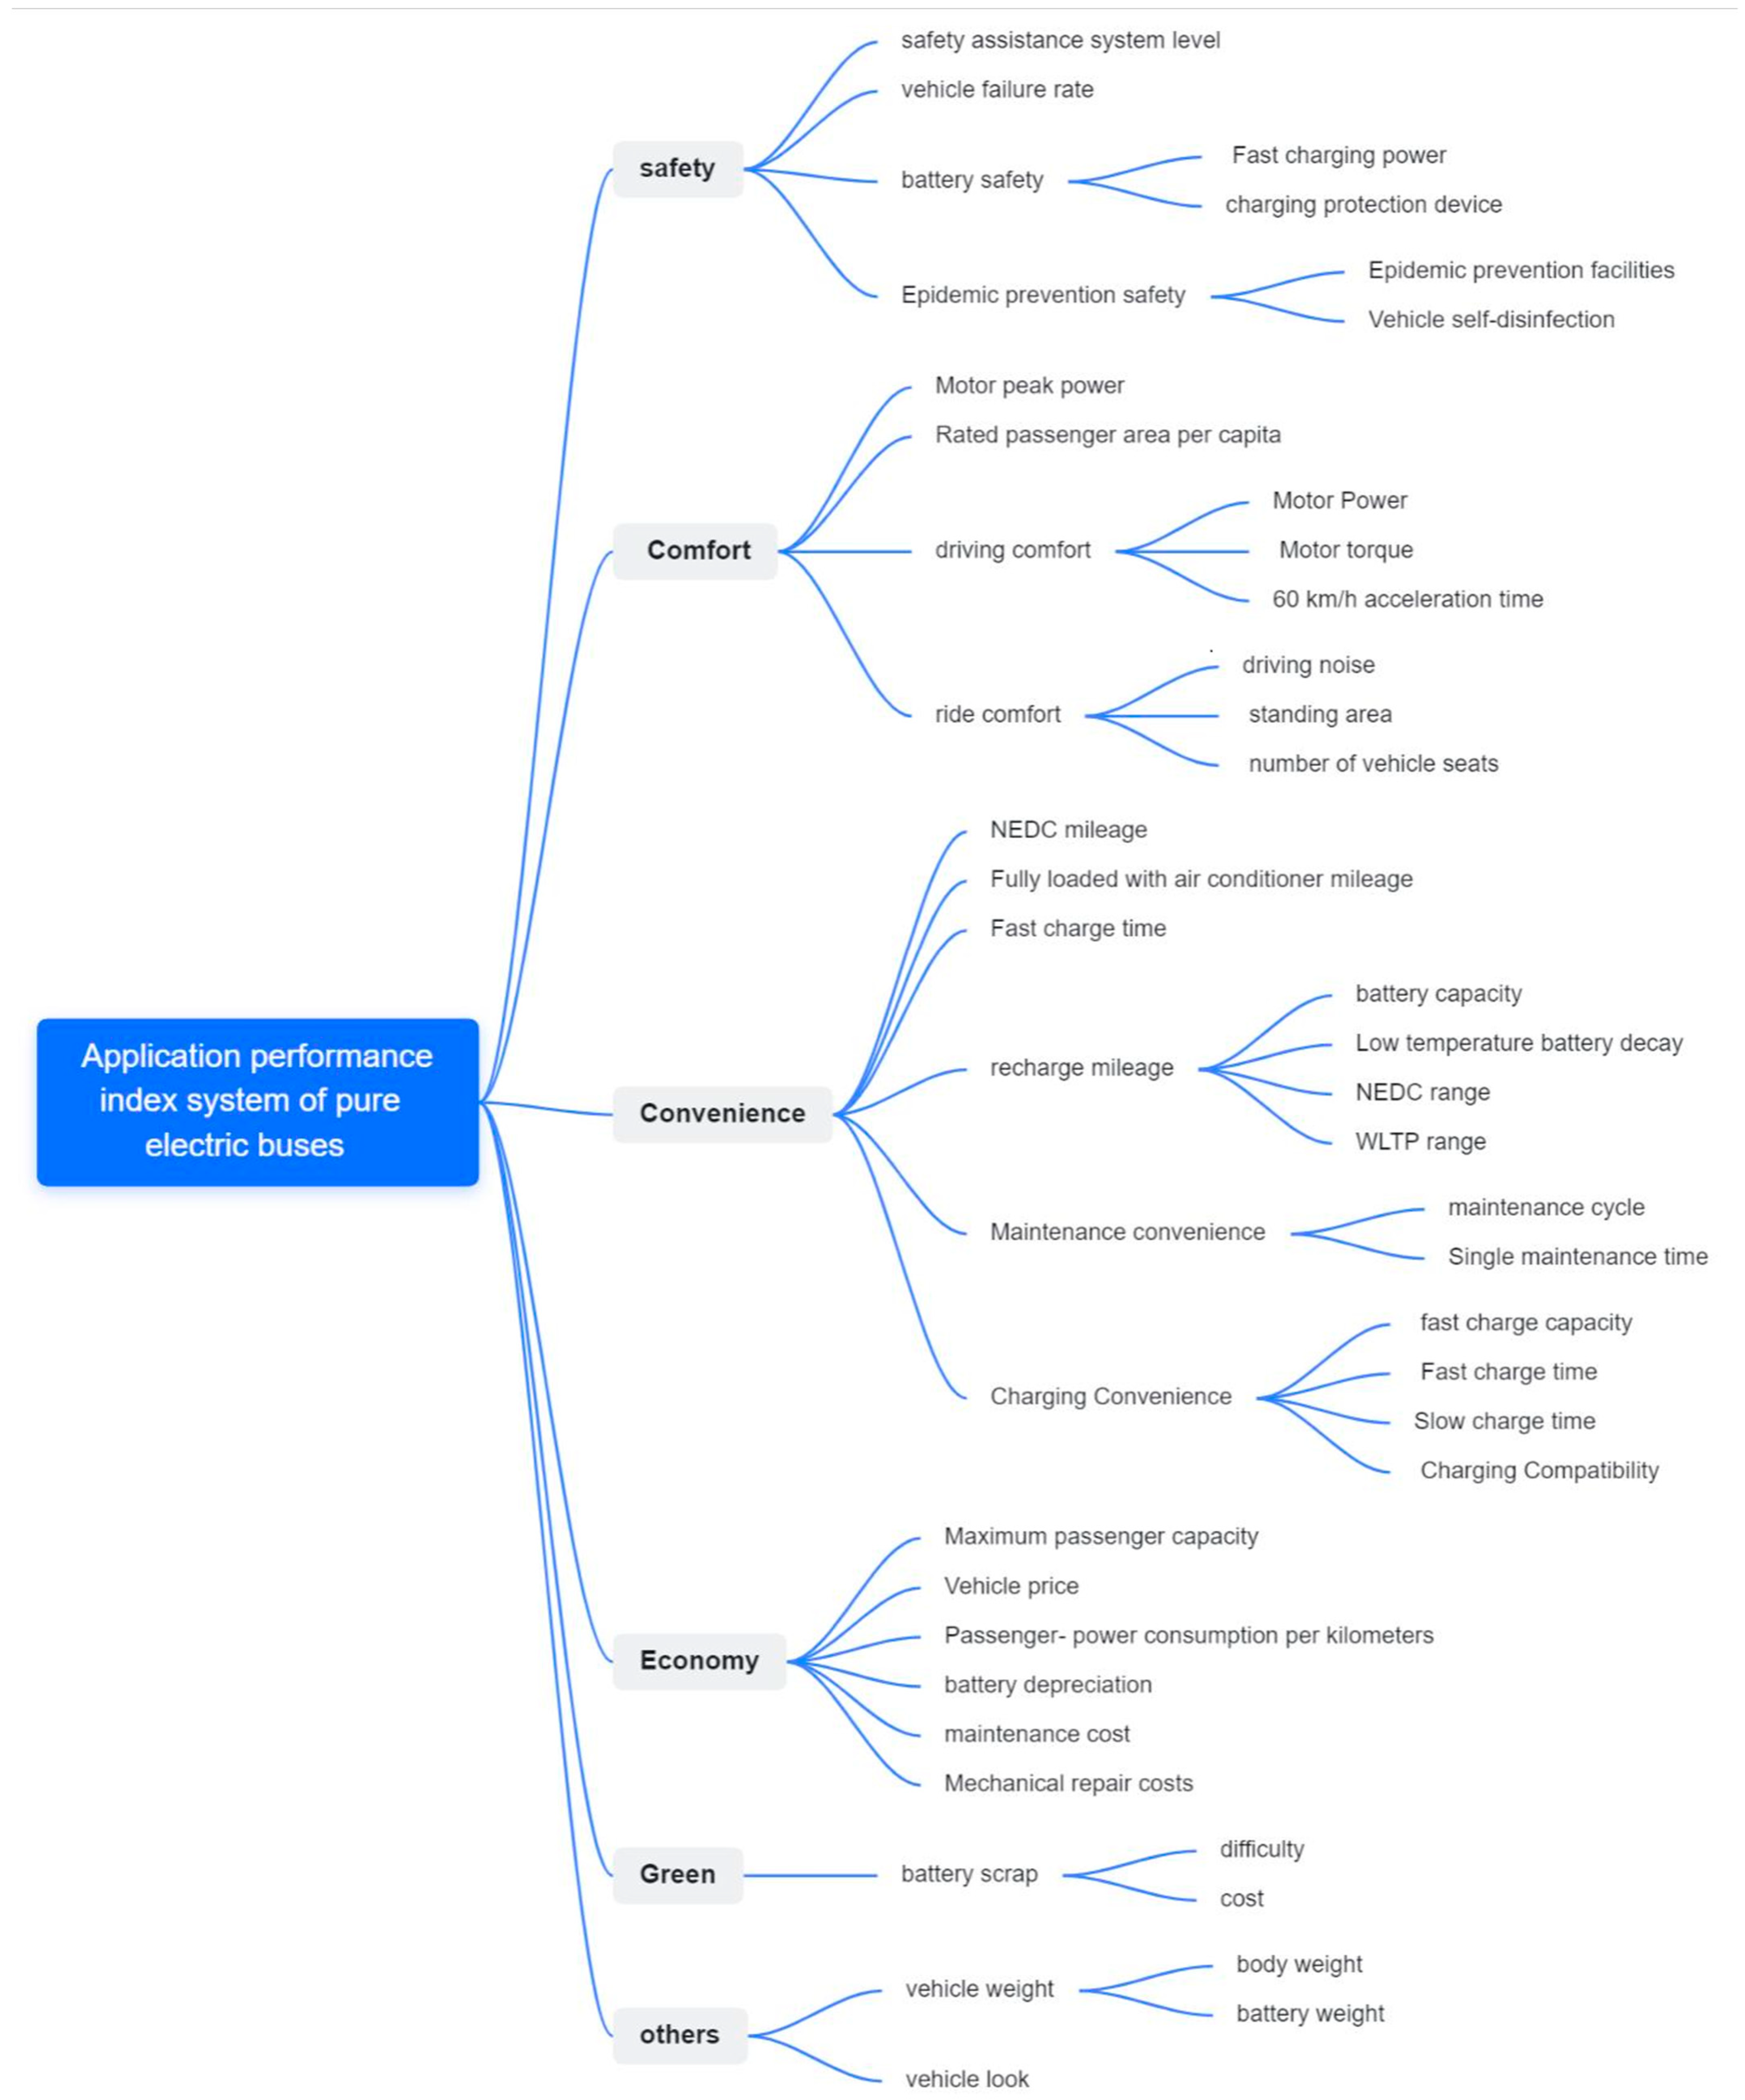
2.2. Construction of the Initial Index System

In order to build a comprehensive, reasonable, and feasible evaluation index system, it is necessary to consider the operational characteristics of buses. Based on relevant research results, in view of the operational characteristics of buses and the technical characteristics of pure electric buses, the initial application performance index system of pure electric buses is shown in Figure 1 [1,3,9].
The standard level of the indicator system includes six aspects of safety, comfort, convenience, economy, green, and others, involving more than 40 specific indicator items.

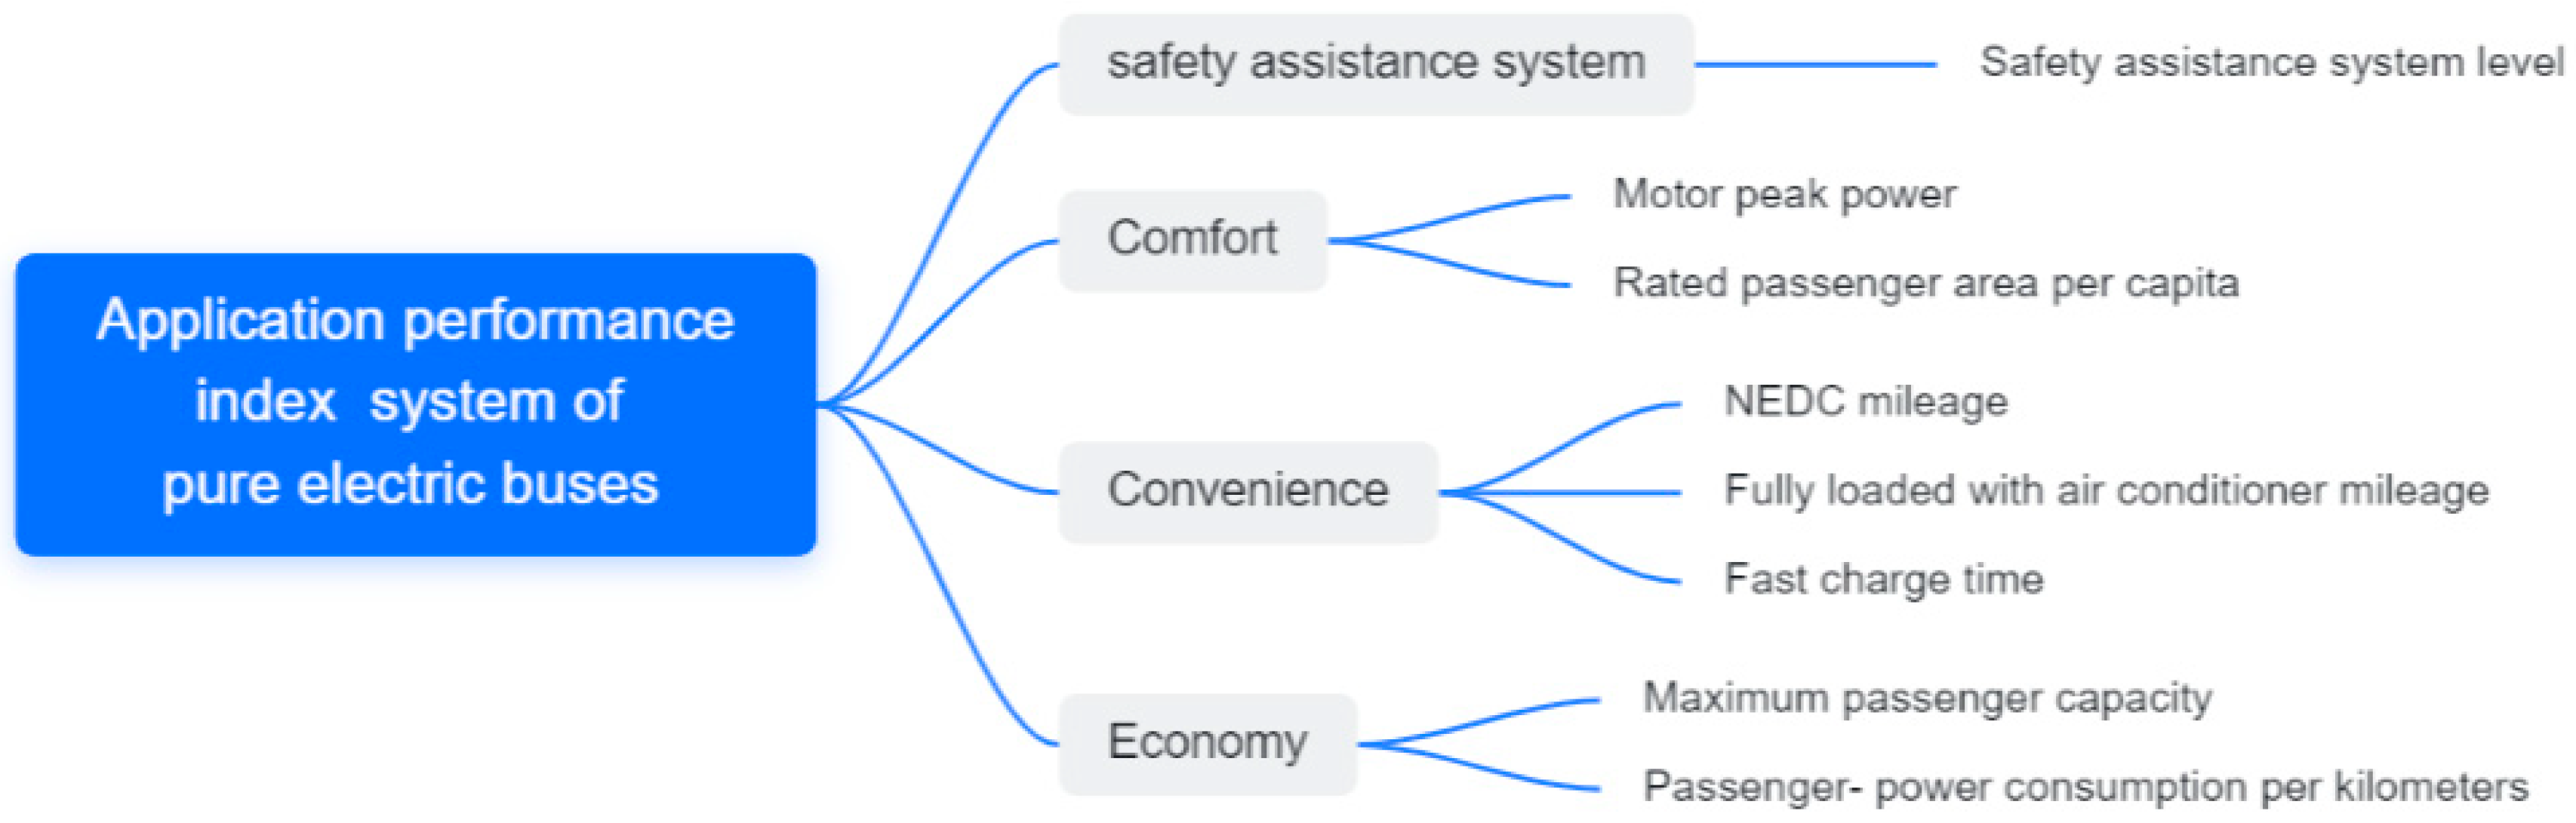
2.3. Optimization of the Index System

In order to further optimize the index system, we used the Delphi method to improve the initial index system [27]. The Delphi method is a predictive process framework based on sending the results of multiple rounds of questionnaires to a panel of experts. After each round of questionnaires, experts receive a summary of the previous round, allowing each expert to adjust their answers based on the panel’s responses. This process combines the benefits of expert analysis with elements of crowd wisdom.
First of all, based on the initial index system, the opinions of transportation companies, transportation management departments, and industry experts are solicited through questionnaires, including whether they pay attention to the initial indicators proposed during the process of purchasing models and whether there are other suggestive indicators. The initial indicator system is optimized by sorting out and summarizing the opinions of all parties, discarding low-interest indicators, and adding new indicators proposed by multiple people, and then consulting again on this basis, summarizing, and adjusting. After two rounds of investigations in this study, the opinions tended to be unanimous, and the final index system was obtained. The application performance index system of pure electric buses is shown in Figure 2.

3. Model for Application Performance Index System of Pure Electric Buses

3.1. Evaluation Index Weighting Based on AHP Weight Method

After determining the evaluation index system of public transport comprehensive service quality, to reflect the evaluation results more accurately, the weight of the indicators must be allocated reasonably. In order to make up for the shortcomings of a single weighting method, we first adopted the combination of AHP in the subjective weighting method and the entropy weighting method in the objective weighting method to determine the subjective and objective weights of the evaluation indicators, and then combined the linear weighting method to AHP and the entropy weight method to obtain the comprehensive weight of the index.
Assuming that the weight vector obtained by AHP is w i = [ w 1 ,   w 2 ,   ,   w n ], the weight vector obtained by the entropy weight method is w i = [ w 1 ,   w 2 ,   ,   w n ], using the linear weighting method to obtain the comprehensive weight vector w i = [ w 1 ,   w 2 ,   ,   w n ].
w i = a w i + b w i
Symbolic notations used in (1) are defined as follows.
w i : Comprehensive weight of the i-th evaluation index;
w i : Subjective weight of the i-th evaluation index;
w i : Objective weight of the i-th evaluation index;
a : Weighting factor for subjective weights; and
b : Weighting factor for objective weights.
In order to make the distribution of weights more reasonable, we used the difference coefficient method to determine the values of a and b [11], and the calculation formula is as follows in (2).
{ a = n n 1 ( 2 n i = 1 n i P i n + 1 n ) b = 1 a
Symbolic notations used in (2) are defined as follows.
n : The number of evaluation indicators; and
P i : The corresponding components in the subjective weight vector sorted obtained by the i-th index from minimum to maximum.

3.2. Application Performance Index System of Pure Electric Buses Based on Extensible Cloud Model

After the analytic hierarchy process, the subjective weight of each evaluation index was determined. Then, the entropy weight method was used to determine the objective weight of each assessment index. On this basis, the extension cloud model was used for evaluation. The evaluation method of the extension cloud model is to use mathematical expressions to associate the randomness and fuzziness of things and realize the uncertainty conversion between qualitative concepts and quantitative values. The specific steps are shown in Figure 3.
(1)
Extension cloud theory
Matter–element extension theory refers to matter–element as the basic element for describing things, expressed as R = ( N , C , V ) , where N is the name of the described thing, C is the characteristic of the thing, and V is the characteristic value of the thing [27]. It can study problems from both qualitative and quantitative perspectives. Thus, the change process of things can be represented more objectively. In the traditional matter–element evaluation model, V is often regarded as a fixed value, ignoring its own randomness and ambiguity, which easily causes partial information loss. Therefore, in this work, we introduced the normal cloud model into the matter–element extension theory for analysis.
The normal cloud model can be represented by three eigenvalues: expected E x , entropy E n , and super entropy H e .
E x represents the cloud distribution center value corresponding to cloud droplets at a certain evaluation level, which can best reflect the classification level of the transfer evaluation index.
E n represents the value range of a certain evaluation level, reflecting the randomness of data collection in the evaluation process.
H e represents the randomness of the membership degree of a certain evaluation level, which reveals the correlation between the randomness and ambiguity of the evaluation index level in the transfer evaluation process.
The extension cloud model uses the normal cloud model ( E x , E n , H e ) to replace the eigenvalue V of the matter in the matter–element extension theory, so as to realize the mathematical description of the randomness and fuzziness in the evaluation process. The extension cloud model is shown as follows in (3):
R = [ M   C 1   ( E x 1 ,   E n 1 ,   H e 1 )           C 2   ( E x 2 ,   E n 2 ,   H e 2 )         C n   ( E x n ,   E n n ,   H e n ) ]
Symbolic notations used in (3) are defined as follows.
M : Buses to be evaluated;
C i : The i-th evaluation index for application performance index of pure electric buses; and
( E x i , E n i , H e i ): The cloud description for evaluation index C i .
(2)
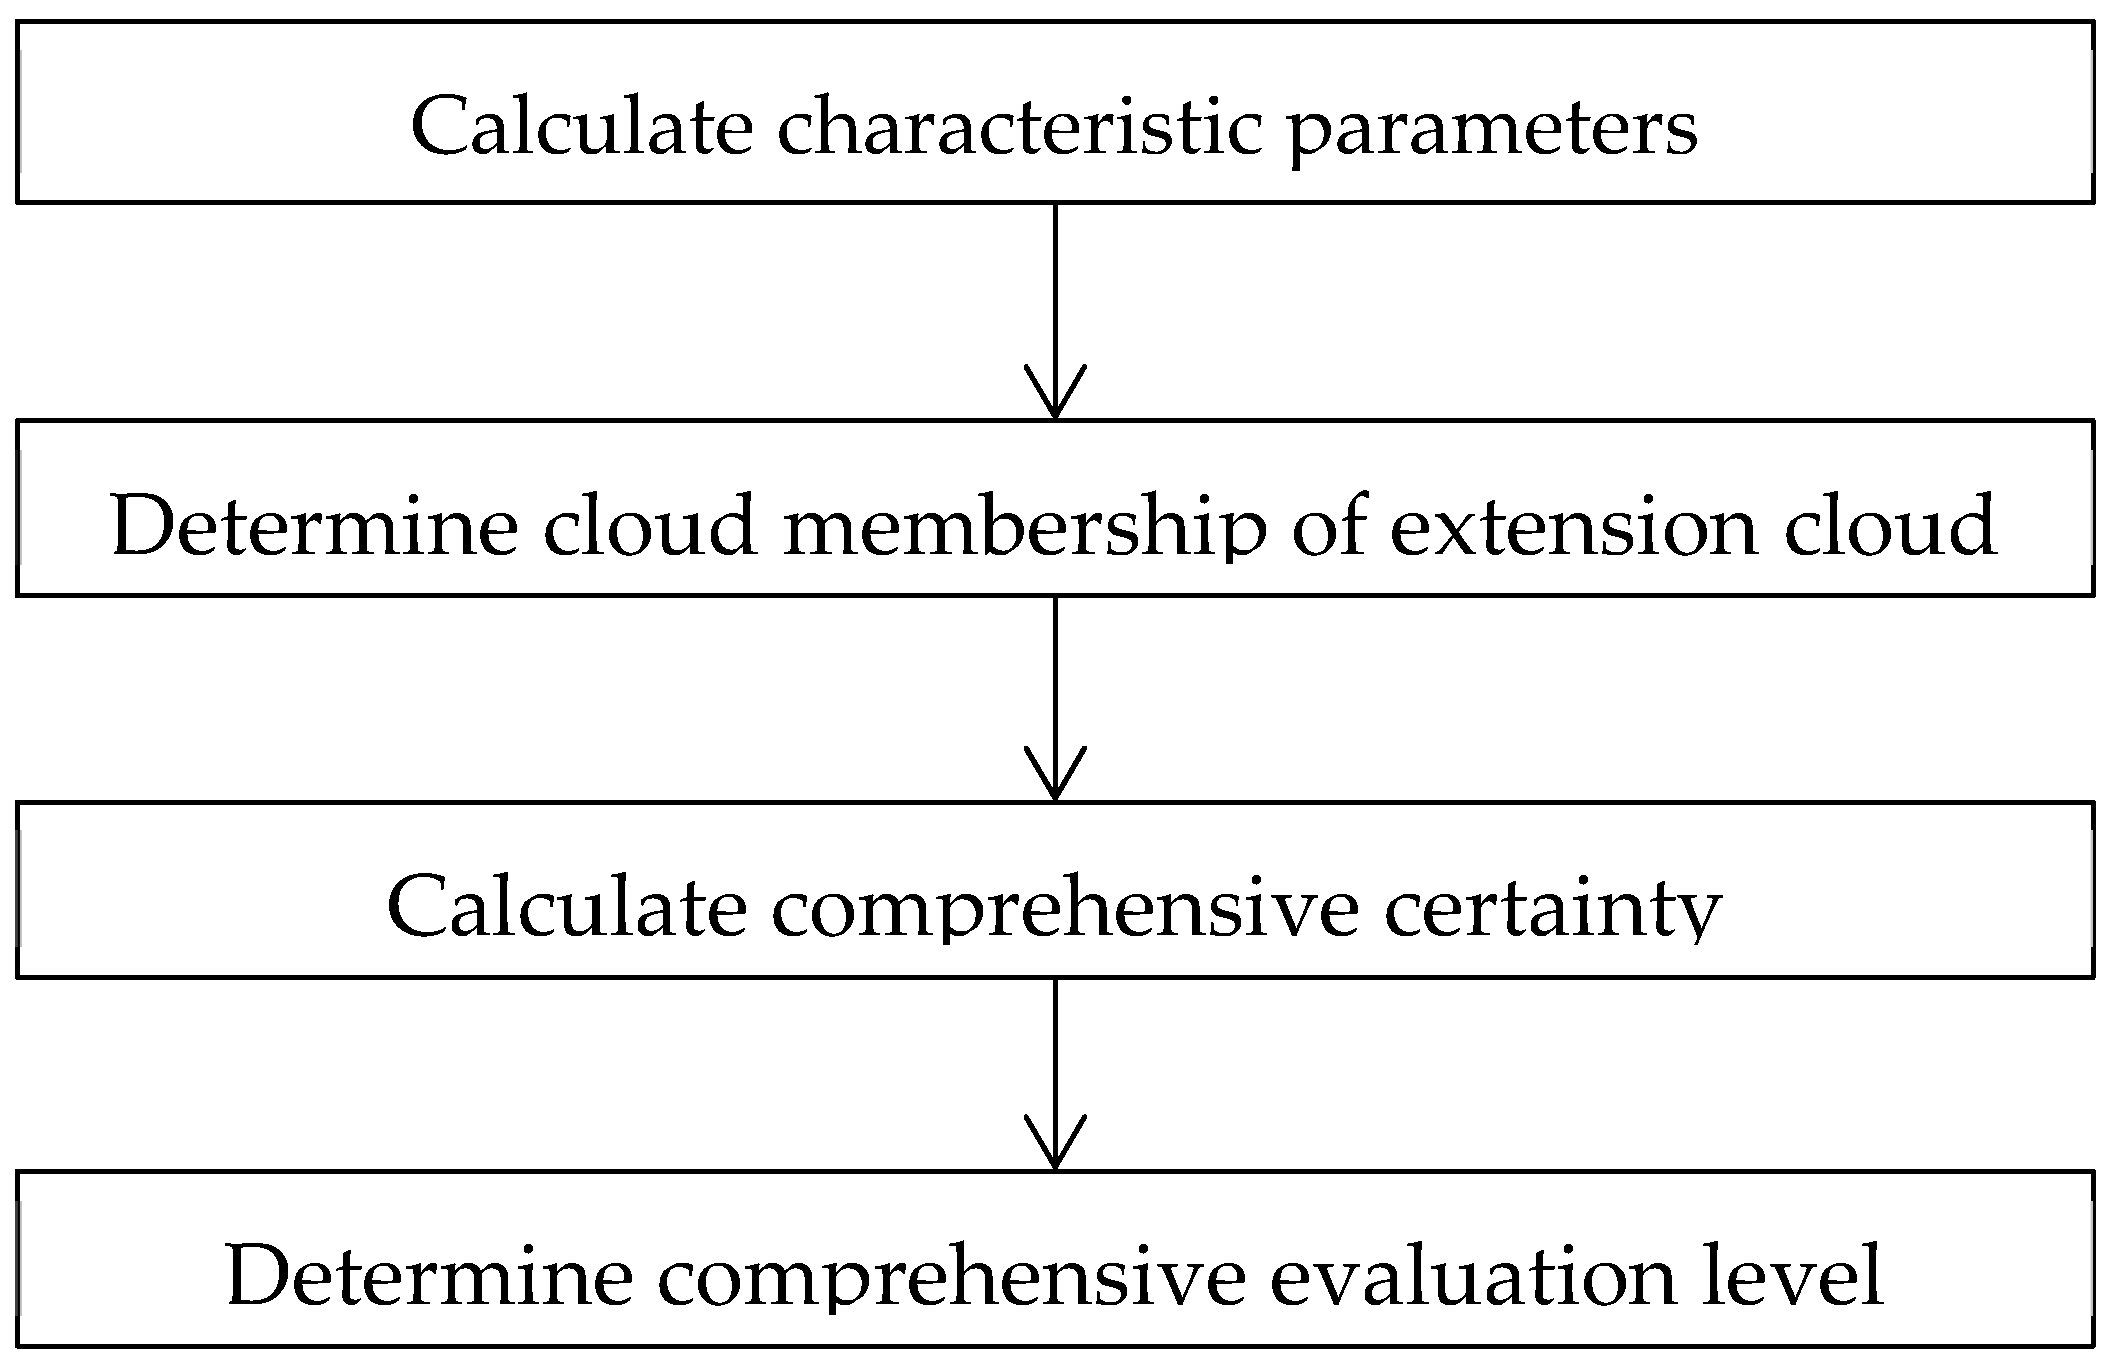
Calculation of characteristic parameters
Assuming that the upper and lower critical values of the evaluation level corresponding to the comprehensive bus service quality evaluation index i ( i = 1 , 2 , , n ) are H max and H min , respectively, the calculation formulas of the parameters E x , E n , and H e are shown in (4).
{ E x = ( H max + H min ) / 2 E n = ( H max + H min ) / 2.355 H e = λ × E n
Symbolic notations used in (4) are defined as follows.
λ : A constant determined according to the degree of fuzziness, and its value is generally set as 0.1 [28,29].
(3)
Determination of cloud membership in extension cloud model
Here, we consider each index value x as a cloud droplet, and generate a normally distributed random number E n ~ N ( E n ,   H e 2 ) with expected value E n and standard deviation H e . After determining the number of cloud droplets N , the cloud membership degree μ between each index value x and the normal cloud model is calculated.
μ = exp { ( x E x ) 2 2 ( E n ) 2 }
Symbolic notations used in (5) are defined as follows.
μ : Membership degree between index value x and extension cloud model; and
E n : Random numbers with a normal distribution.
According to (5), the cloud membership degree between each evaluation index value and the normal cloud model can be obtained, and a comprehensive judgment matrix U is formed:
U = [ μ 11   μ 12   μ 13   μ 14   μ 15 μ 21   μ 22   μ 23   μ 24   μ 25             μ n 1   μ n 2   μ n 3   μ n 4   μ n 5 ]
Symbolic notations used in (6) are defined as follows.
μ i j : Cloud membership degree between the valuation index for application performance index of pure electric buses C i and the j-th level normal cloud model ( i = 1 , 2 , , 8 ; j = 1 , 2 , 3 , 4 , 5 ) ; and
j : Evaluation level.
(4)
Determination method of the evaluation level for the application performance
According to the comprehensive weight value obtained above, combined with the comprehensive judgment matrix, the comprehensive certainty Q and comprehensive evaluation score R for the application performance index of pure electric buses can be calculated:
Q = i = 1 8 w i U
R = j = 1 5 b j f j j = 1 5 b j
Symbolic notations used in (8) are defined as follows.
b j : Value of the j-th component corresponding to the vector Q ; and
f j : The score value of the evaluation level j. The score values corresponding to the evaluation levels 1 to 5 in this paper are 1, 2, 3, 4, and 5, respectively.
Due to the randomness in solving the membership degree, it is necessary to solve it multiple times to reduce the influence of random factors. The calculation method of the expected value E x r , the entropy E n r , and the reliability factor θ of the comprehensive evaluation score is shown in (9).
{ E x r = i = 1 l R i ( x ) / l E n r = 1 l i = 1 l [ R i ( x ) E x r ] 2 θ = E x r E n r
Symbolic notations used in (9) are defined as follows.
l : Number of operations;
R i : The comprehensive evaluation score obtained by the i-th calculation; and
θ: The degree of dispersion of the evaluation results. Its value is inversely proportional to the credibility.

4. Case Study

We selected six electric buses from Chinese electric bus companies for the case analysis. All data on the selected vehicles come from the published data on the official websites of the electric bus manufacturers. In order to ensure the anonymity of the specific model of the buses, the buses are numbered. The details are shown in Table 1.

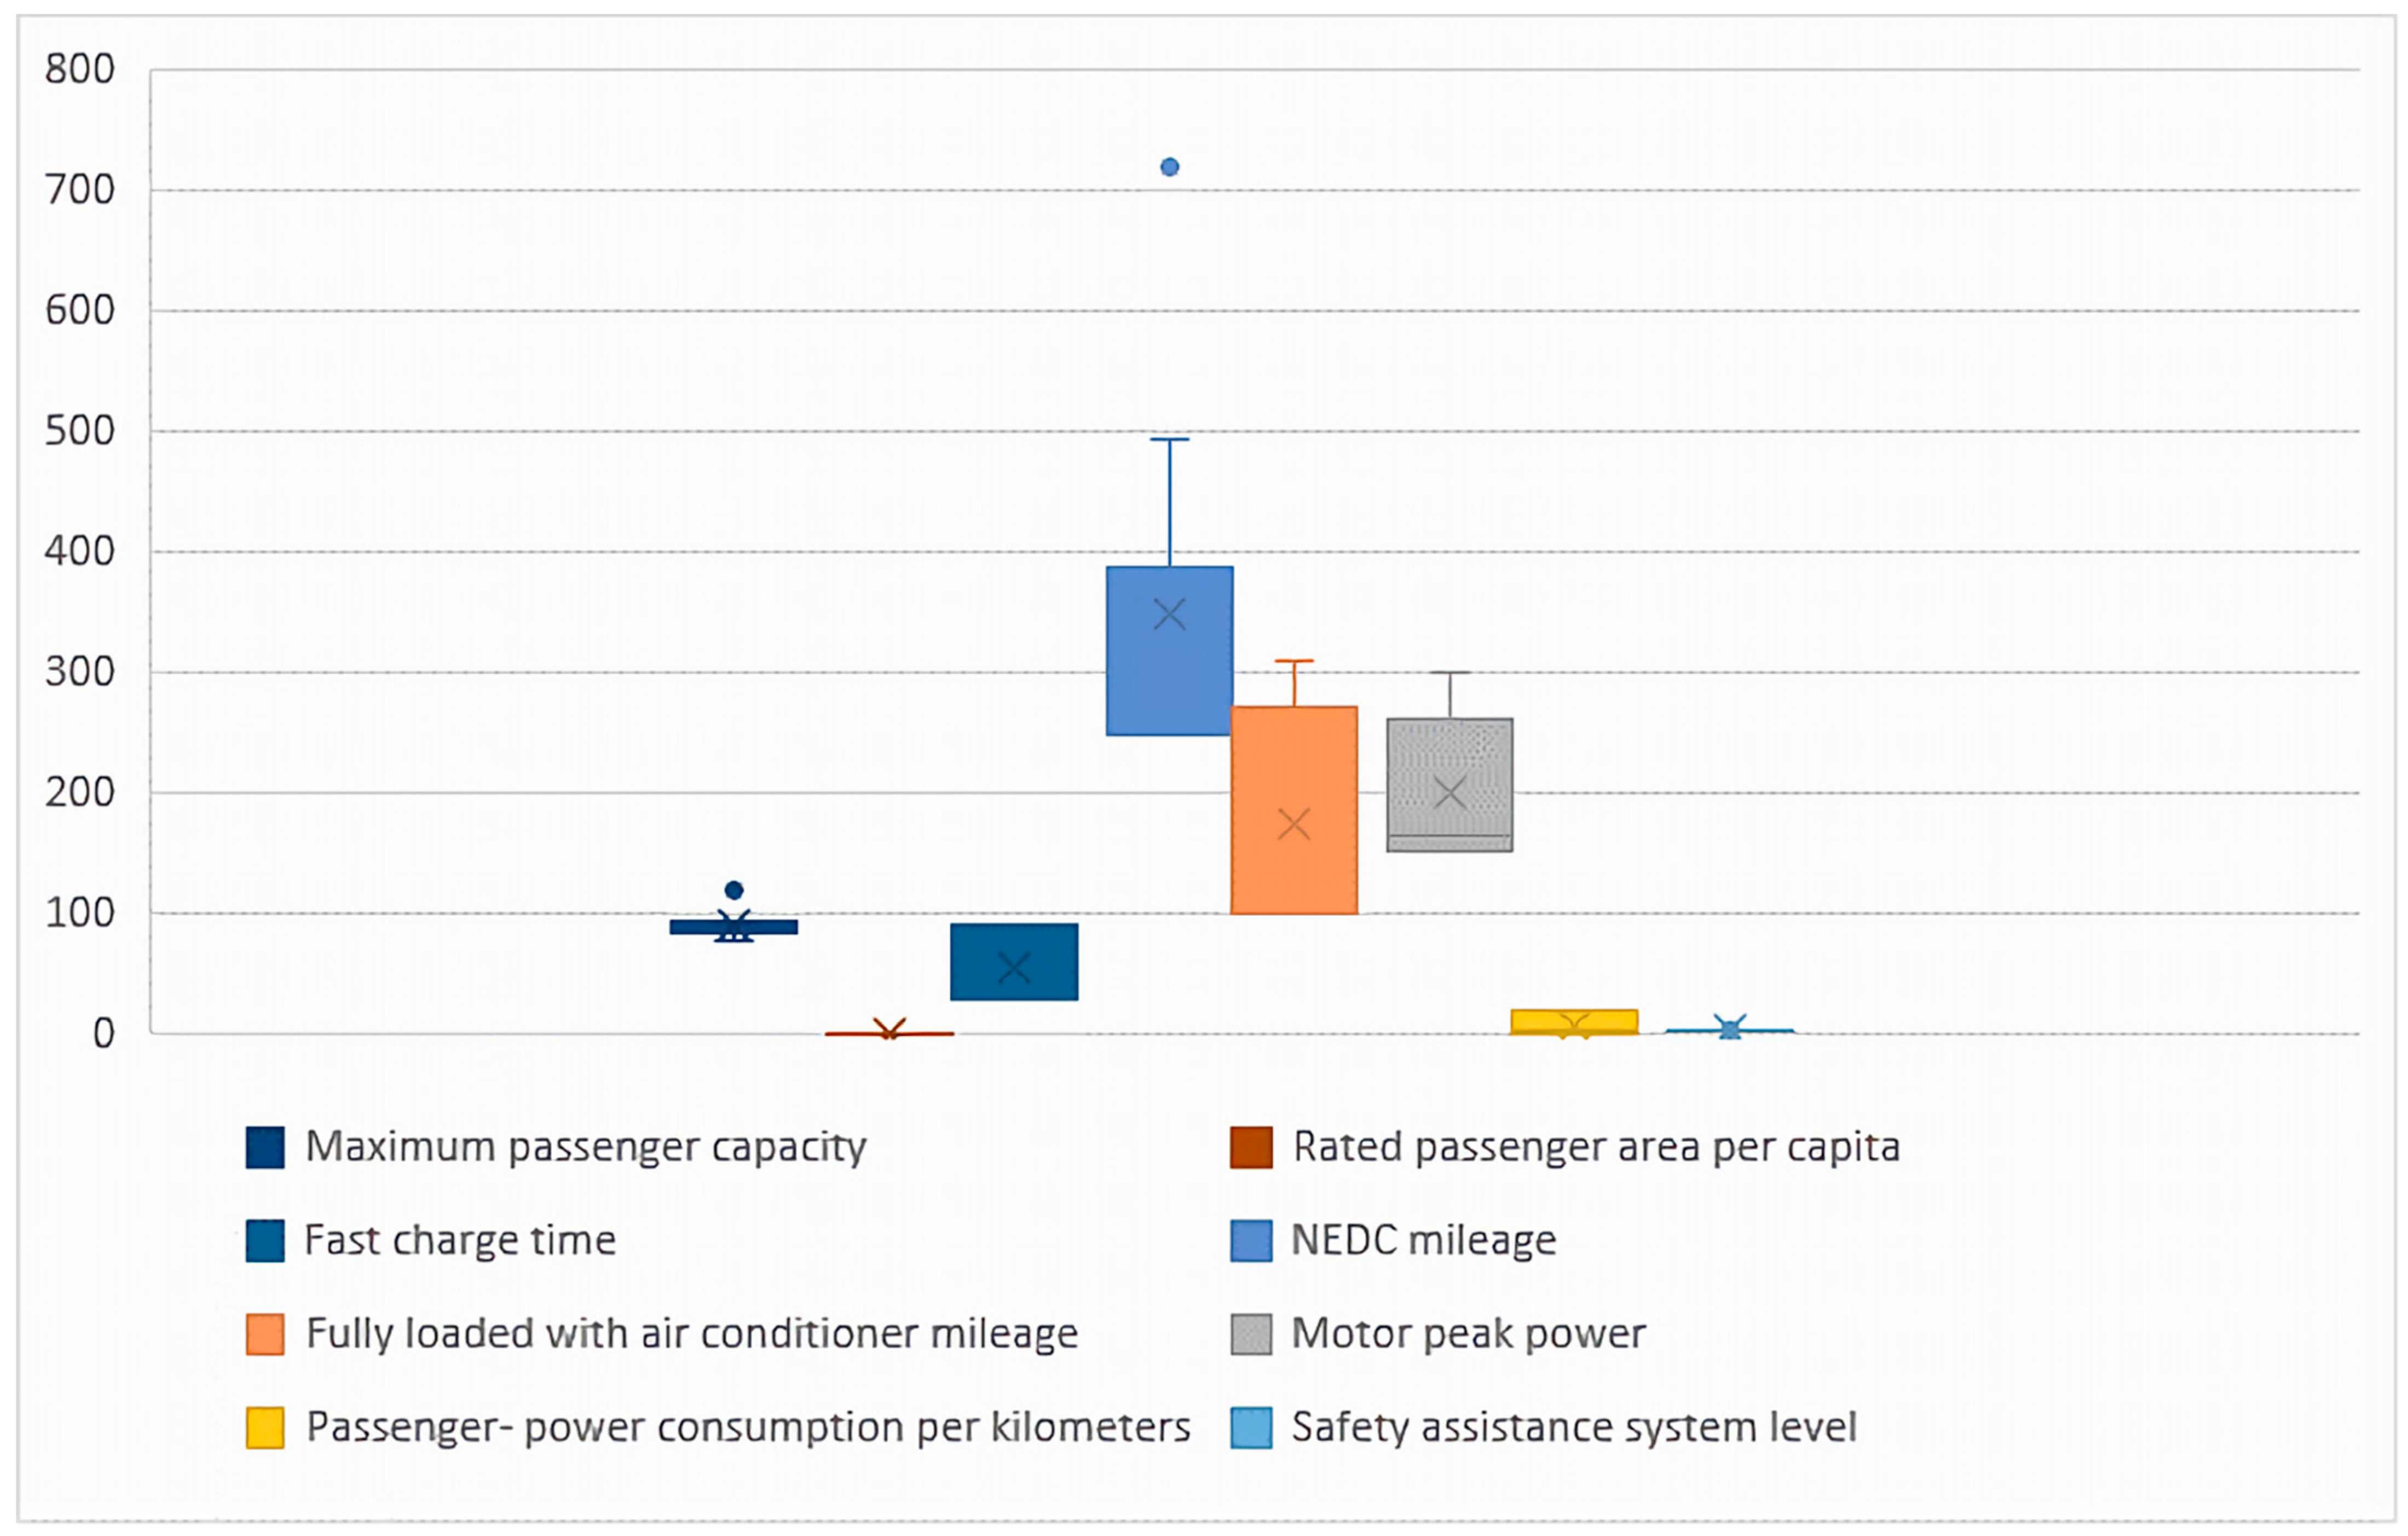
4.1. Data Collection

According to the existing relevant research results, we divided the evaluation indicators of comprehensive bus service quality into five evaluation levels: fail, poor, average, good, and excellent.
Based on the 20 models of electric buses published by the national public data, and according to the quintiles of the boxplots, SPSS software was used to determine the value ranges of the five different levels of each evaluation index, representing the critical values of different levels, and the specific division results are shown in Figure 4.
Based on these performance measurement indicators identified for electric bus applications, questionnaires and field surveys were used to collect the data. The survey was carried out by a professional online survey company. The indicators of this survey primarily include four dimensions: safety, comfort, convenience, and economy. Meanwhile, the validity of the questionnaire was guaranteed by the judgment rules set in the background before submission. The eight evaluation indicators included peak engine power, nominal passenger surface per capita, NEDC cruise range, full charge air-conditioning mileage, and fast recharge time. A total of 120 questionnaires were delivered and 15 invalid questionnaires were eliminated, leaving 105 valid questionnaires. The effective collection rate of the questionnaire was 87.5%, which met the sampling rate requirement. The statistics of this survey are presented in Table 2.

4.2. Determination of Indicator Weight

Using the analytic hierarchy process, the subjective weight of each evaluation index was determined. The original data obtained from the survey are shown in Table 2. The entropy weight method was used to determine the objective weight of each assessment index, and the subjective weight values were reorganized in ascending order. Based on Equations (1) and (2), the overall weights obtained are presented in Table 3.

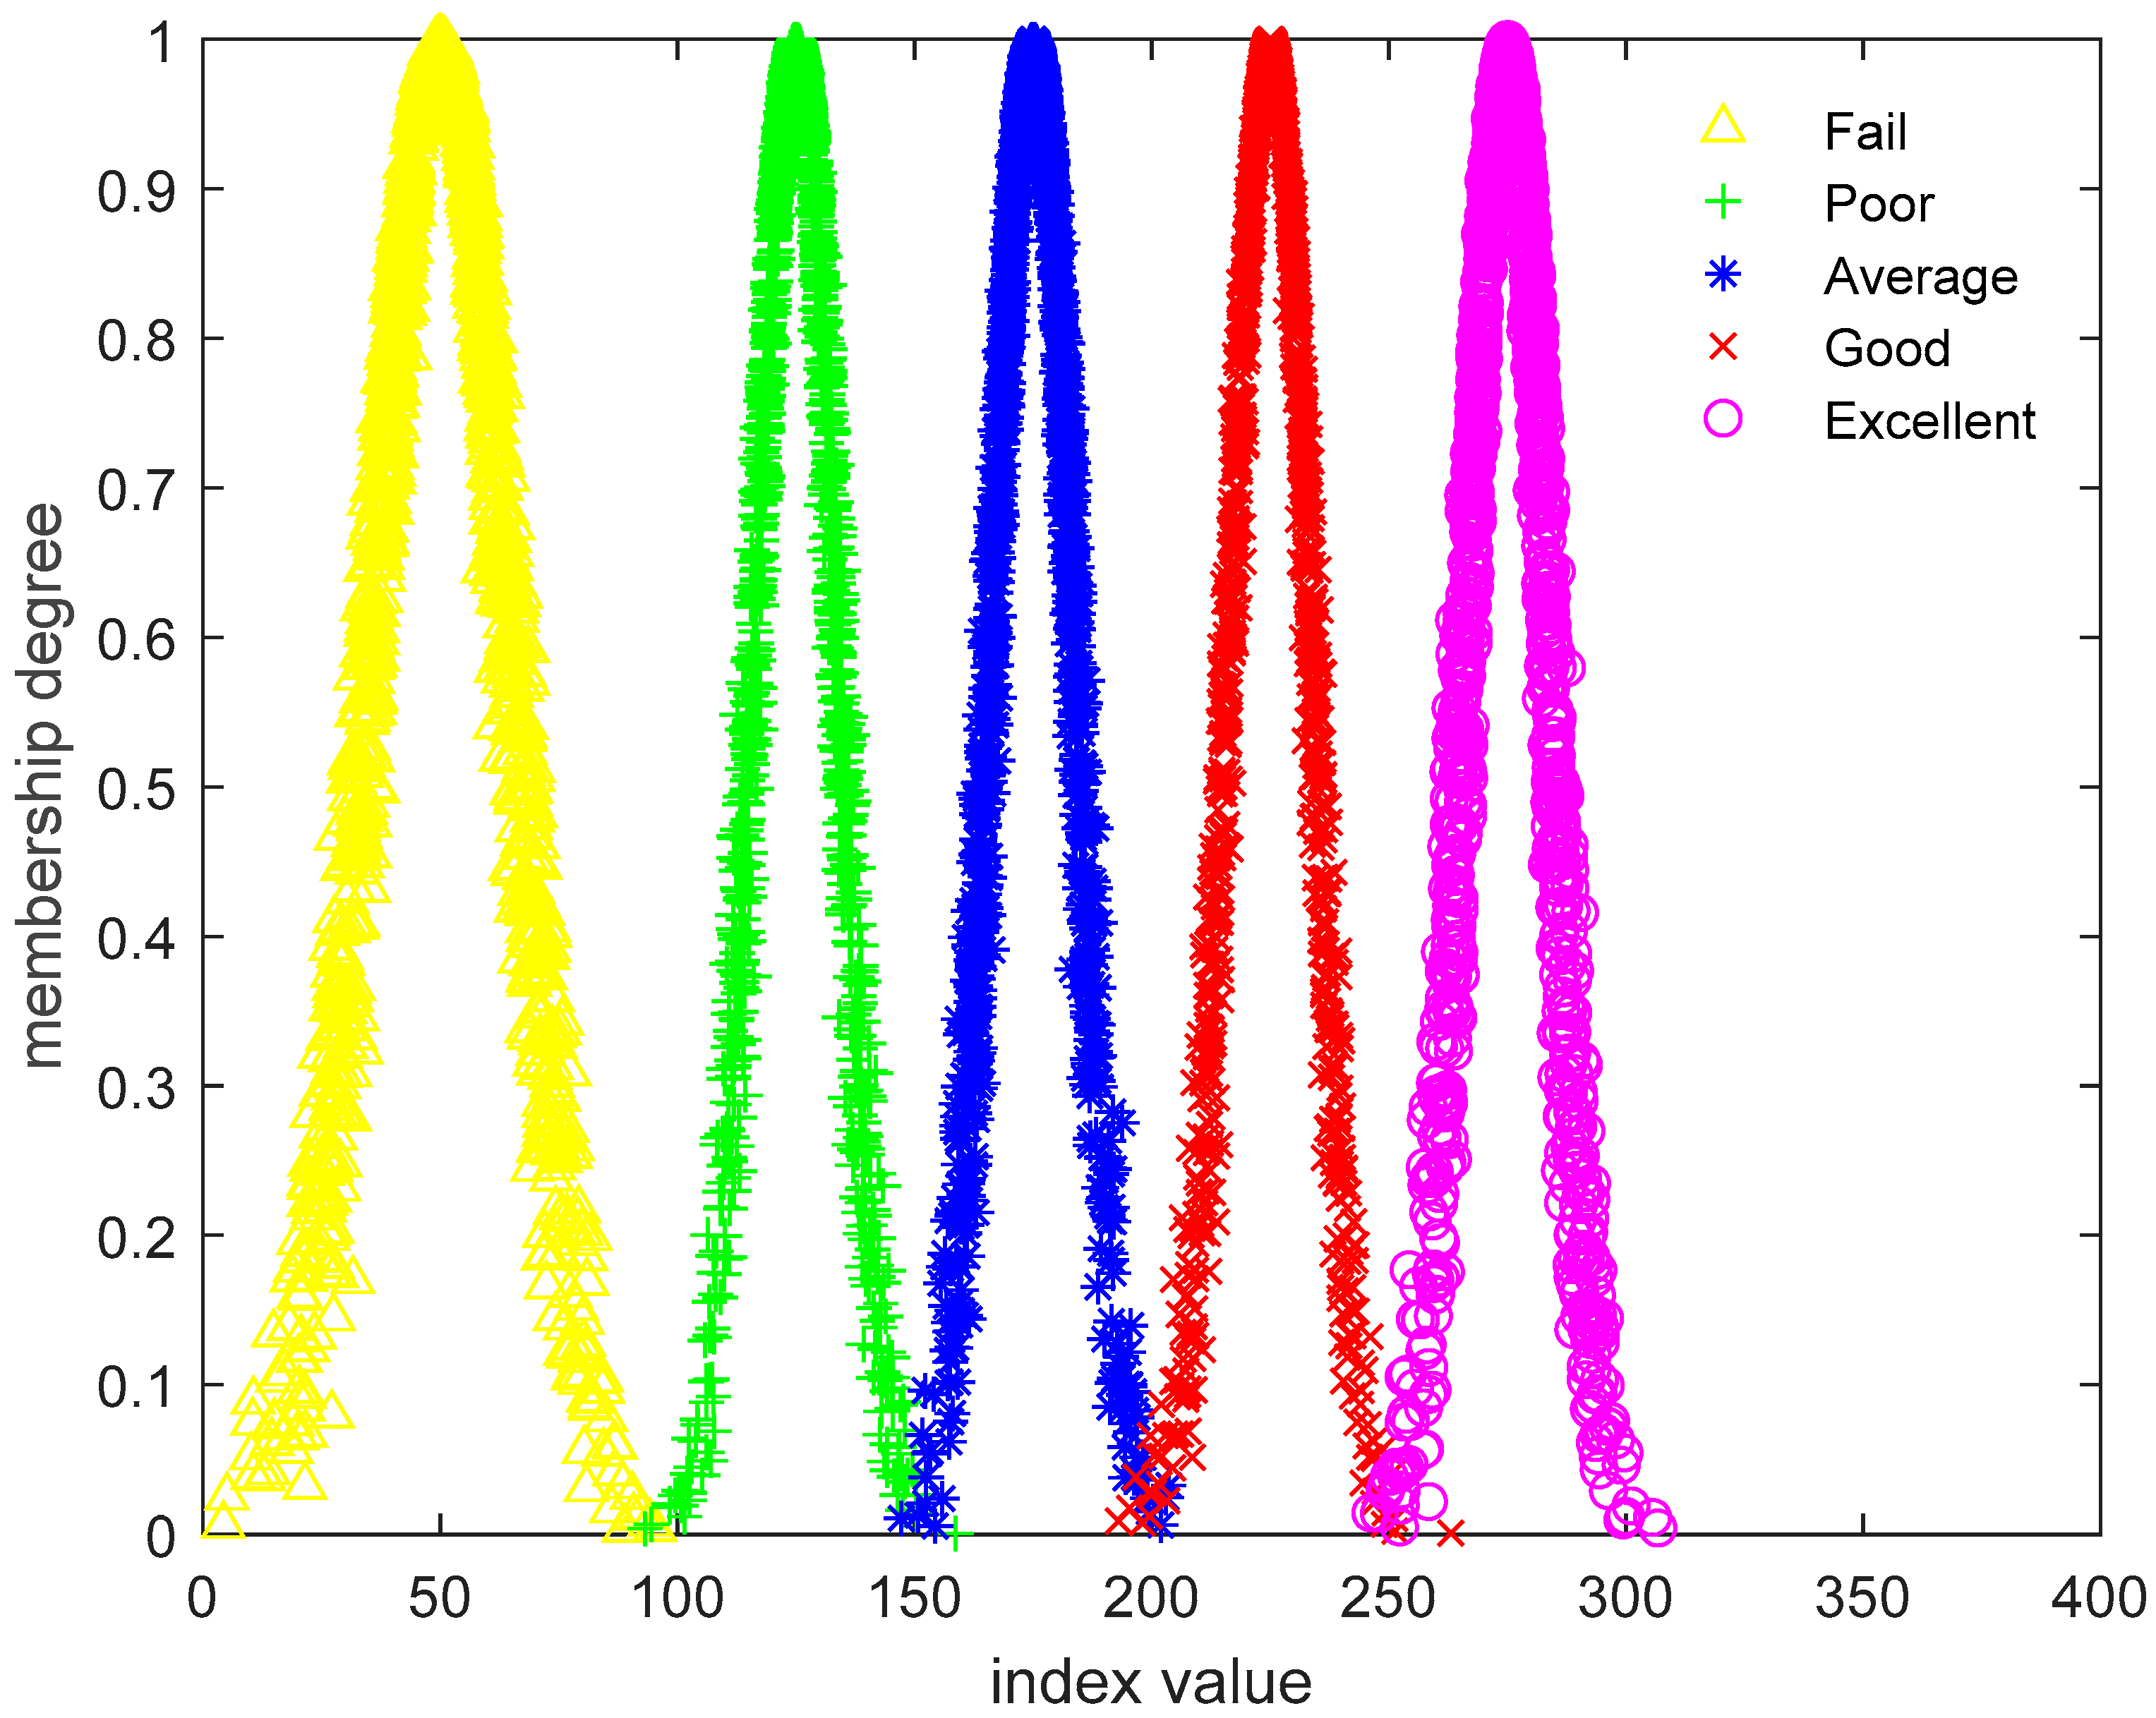
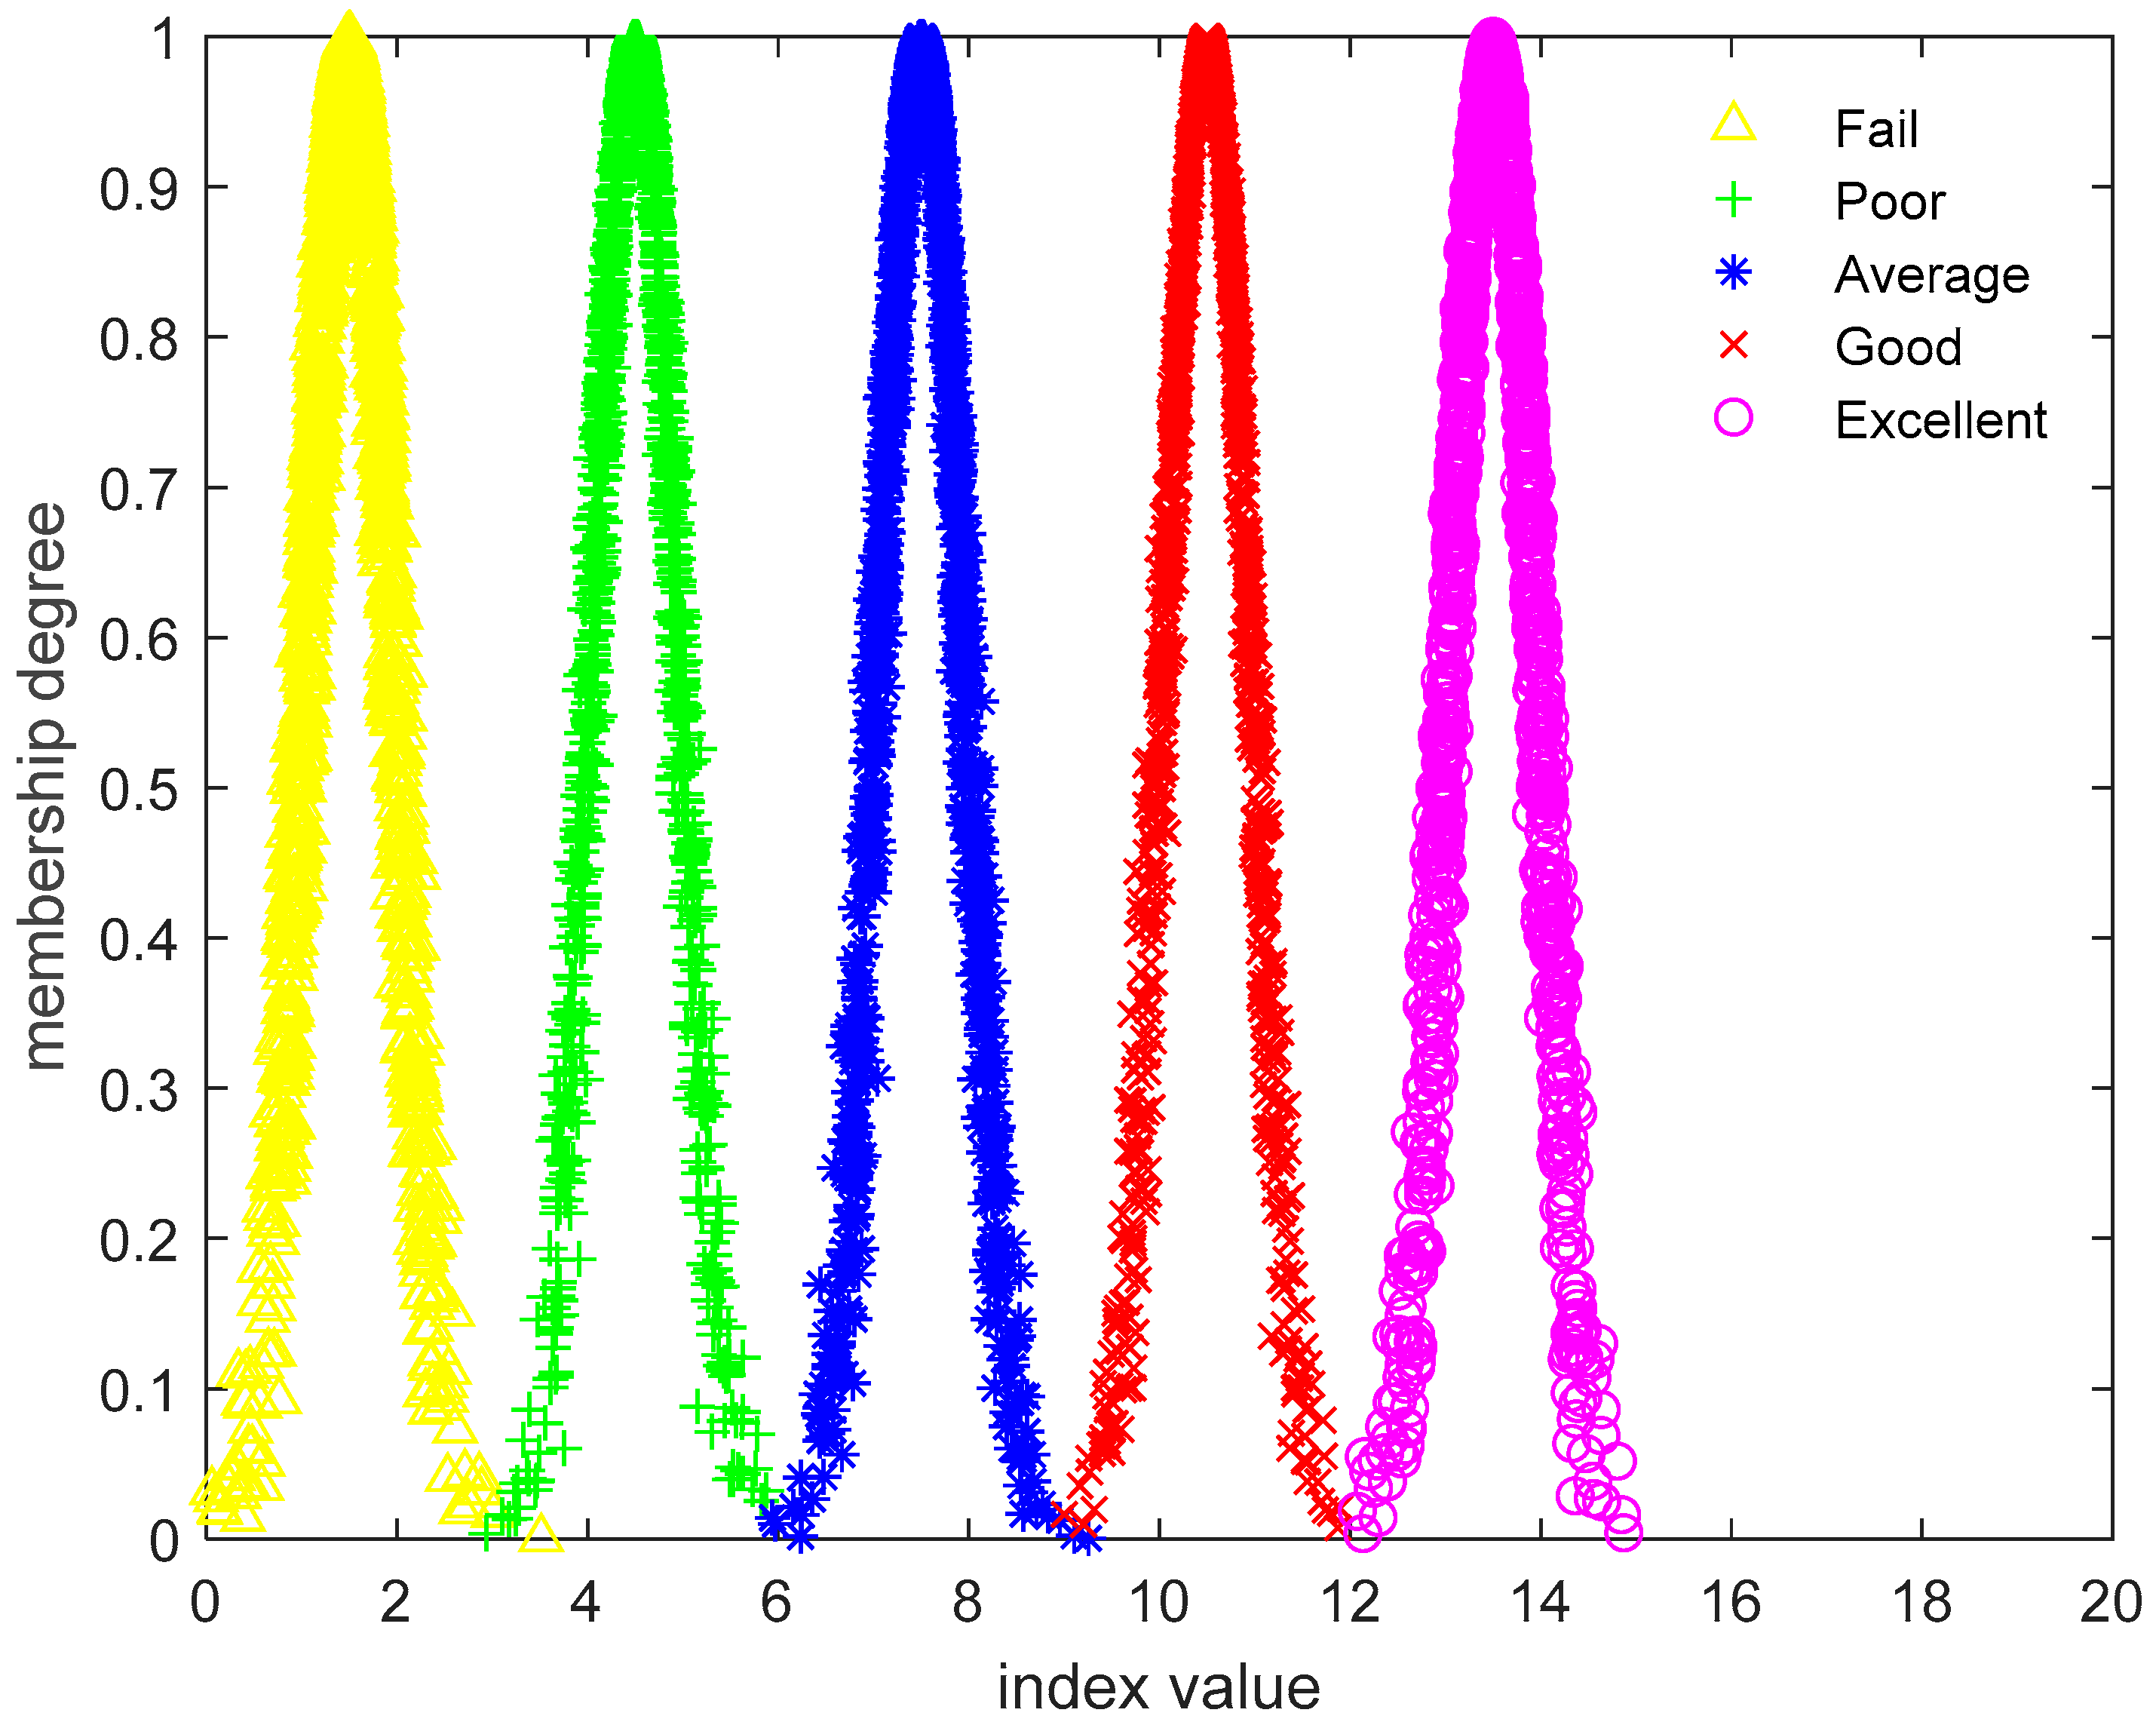
4.3. Evaluation Index Cloud Model Construction

According to the classification of performance evaluation indexes of electric bus applications, the numerical characteristic values of the normal cloud model of each evaluation index were calculated through MATLAB, as shown in Table 4.

4.4. Membership Degree Calculation of Each Indicator

After obtaining the evaluation index cloud model, Equations (3)–(6) were used for software programming calculations to obtain the different levels of cloud membership corresponding to each bus’s membership degree, shown in Figure 5 and Figure 6. Taking the example of electric bus A, the results are given in Table 5.

4.5. Evaluation Result and Analysis

Based on the index level matrix and the overall weight of each site, we substituted Equations (7)–(9) to obtain the overall certainty of each site. According to the principle of maximum certainty, the level with the maximum certainty was selected as the application performance evaluation level of the electric bus, as shown in Table 6. The evaluation results show that the application performance evaluation levels of electric bus B are excellent; the application performance evaluation levels of electric bus A are good; and the application performance evaluation levels of electric buses C, D, E, and F are medium. These conclusions are consistent with the actual situation of the investigation, indicating that the transfer evaluation model has certain feasibility and applicability.

5. Conclusions

With the rapid development of electric vehicles, the characteristics of low-cost, pleasant experience, and low pollution have gradually become important directions for future transportation development. The changing technical characteristics warrant vehicle operation performance evaluations.
Based on the operation characteristics and demands of buses, we proposed in this work a pure electric bus operation performance evaluation index system and put forward eight evaluation indexes from the four aspects of safety assistance system, comfort, convenience, and economy, which can reflect the bus operation characteristics of pure electric buses.
The evaluation index system can rely on the existing data collection channels to obtain data for evaluation at a lower cost, which has high practicability. Then, the digital characteristics and comprehensive evaluation grade of the evaluation index cloud can be calculated. Compared with relevant studies, we proposed to use the extension cloud model to evaluate the indicators of electric buses based on ACH and other methods. The evaluation results were tested by indicators, grades, and reliability factors, so as to obtain better applicability.
Furthermore, with the further implementation of China’s policy support for electric buses, a more scientific method is urgently needed to select electric buses. The findings in this paper could help electric bus purchasing departments and cities determine the most suitable electric bus models. Using this indicator system to evaluate the operating performance of pure electric buses can help bus companies purchase cars and manufacturers to build cars. Similarly, this model could also be used with slight modifications in other transportation vehicle decisions.
The main potential future research directions are divided into two parts. On the one hand, considering some of the limitations of the current pure electric buses, research on electric hybrid buses can be carried out in the future. On the other hand, with the rapid development of unmanned buses and autonomous driving technologies, the evaluation indicators and evaluation criteria used to select models, especially in terms of intelligent driving, may also change in order to help the selection of pure electric buses and promote the construction of a favorable market environment for the survival of the fittest.

Author Contributions

Conceptualization, X.H. and M.Z.; methodology, J.Z. and X.H.; software, M.Z. and B.L.; validation, X.H., J.Z., R.G. and X.C.; formal analysis, B.L. and G.D.; investigation, R.G. and G.D.; resources, G.D.; data curation, R.G.; writing—original draft preparation, M.Z.; writing—review and editing, X.H. and J.Z.; visualization, J.Z. and X.C.; supervision, X.H.; project administration, X.H.; funding acquisition, R.G. All authors have read and agreed to the published version of the manuscript.

Funding

This research was supported in part by the Opening Project of Key Laboratory of Operation Safety Technology on Transport Vehicles, Ministry of Transport, PRC, under grant no. 2020-8402, and in part by the Funds of Chongqing Jiaotong University (Grant no. 21JDKJC-A019) and the Chongqing Postgraduate Joint Training Base Project (Chongqing Jiaotong University-Chongqing Ulit Technology Co., Ltd. Joint Training Base for Postgraduates in Transportation).

Institutional Review Board Statement

Not applicable.

Informed Consent Statement

Not applicable.

Data Availability Statement

Data are available on request due to privacy restrictions.

Conflicts of Interest

The authors declare no conflict of interest.

References

  1. Zhang, Y.L.; Yuan, W.; Fu, R. Design of an energy-saving driving strategy for electric buses. IEEE Access 2019, 7, 157693–157706. [Google Scholar] [CrossRef]
  2. Jwa, K.; Lim, O. Comparative life cycle assessment of lithium-ion battery electric bus and Diesel bus from well to wheel. Energy Procedia 2018, 145, 223–227. [Google Scholar] [CrossRef]
  3. Horita, T.; Shimazaki, J. Performance evaluation of lithium-ion batteries on small electric bus. Electr. Eng. Jpn. 2017, 198, 68–76. [Google Scholar] [CrossRef]
  4. Todorut, A.; Cordos, N.; Iclodean, C. Replacing diesel buses with electric buses for sustainable public transportation and reduction of CO2 emissions. Pol. J. Environ. Stud. 2020, 29, 3339–3351. [Google Scholar] [CrossRef]
  5. Varga, B.O.; Mariasiu, F.; Miclea, C.D. Direct and indirect environmental aspects of an electric bus fleet under service. Energies 2020, 13, 336. [Google Scholar] [CrossRef] [Green Version]
  6. Hallmark, S.; Sperry, B.; Mudgal, A. In-use fuel economy of hybrid-electric school buses in Iowa. J. Air Waste Manag. Assoc. 2011, 61, 504–510. [Google Scholar] [CrossRef]
  7. Jônatas, A.M.; João, P.T.; Carlos, H.A. A review of electric bus vehicles research topics—Methods and trends. Renew. Sustain. Energy Rev. 2022, 159, 112211. [Google Scholar]
  8. Li, L.F.; Liu, Q. Acceleration curve optimization for electric vehicle based on energy consumption and battery life. Energy 2019, 169, 1039–1053. [Google Scholar] [CrossRef]
  9. Barraza, O.; Estrada, M. Battery electric bus network: Efficient design and cost comparison of different powertrains. Sustainability 2021, 13, 4745. [Google Scholar] [CrossRef]
  10. Hamurcu, M.; Eren, T. Electric bus selection with multicriteria decision analysis for green transportation. Sustainability 2020, 12, 2777. [Google Scholar] [CrossRef] [Green Version]
  11. Wolek, M.; Jagiello, A.; Wolanski, M. Multi-criteria analysis in the decision-making process on the electrification of public transport in cities in Poland: A case study analysis. Energies 2021, 14, 6391. [Google Scholar] [CrossRef]
  12. Romero-Ania, A.; Gutierrez, L.R.; Oliva, M. Multiple criteria decision analysis of sustainable urban public transport systems. Mathematics 2021, 9, 1844. [Google Scholar] [CrossRef]
  13. Zhang, J.H.; Zhao, L.J.; Hou, F.S. Technology evaluation of Chinese hybrid electric bus demonstration. Mitig. Adapt. Strateg. Glob. Chang. 2015, 20, 797–815. [Google Scholar] [CrossRef]
  14. Anttila, J.; Tota, S.S.; Todorov, Y. Electric city bus performance evaluation by chassis dynamometer measurements. In Proceedings of the 2020 IEEE Vehicle Power and Propulsion Conference (VPPC), Gijon, Spain, 18 November–16 December 2020; pp. 1–5. [Google Scholar]
  15. Liu, Y.; He, J.; Lu, W.; Yan, X.; Cheng, C. Evaluation method to select pure electric buses based on road operation tests. World Electr. Veh. J. 2020, 11, 4. [Google Scholar] [CrossRef] [Green Version]
  16. Oier, L.B.G.; Maria, X.; Semida, S. A framework for the assessment of electric bus charging station construction: A case study for Stockholm’s inner city. Sustain. Cities Soc. 2022, 78, 103610. [Google Scholar]
  17. Du, J.Y.; Li, F.Q.; Li, J.Q.; Wu, X.G.; Song, Z.Y.; Zou, Y.F.; Minggao, O. Evaluating the technological evolution of battery electric buses: China as a case. Energy 2019, 176, 309–319. [Google Scholar] [CrossRef]
  18. Hassanpour, M.; Pamucar, D. Evaluation of Iranian household appliance industries using MCDM models. Oper. Res. Eng. Sci. Theory Appl. 2019, 2, 1–25. [Google Scholar] [CrossRef]
  19. Badi, I.; Kridish, M. Landfill site selection using a novel FUCOM-CODAS model: A case study in Libya. Sci. Afr. 2020, 9, e00537. [Google Scholar] [CrossRef]
  20. Alossta, A.; Elmansouri, O.; Badi, I. Resolving a location selection problem by means of an integrated AHP-RAFSI approach. Rep. Mech. Eng. 2021, 2, 135–142. [Google Scholar] [CrossRef]
  21. Karamaşa, Ç.; Demir, E.; Memiş, S.; Korucuk, S. Weighting the factors affecting logistics outsourcing. Decis. Mak. Appl. Manag. Eng. 2021, 4, 19–32. [Google Scholar] [CrossRef]
  22. Bakır, M.; Atalık, Ö. Application of fuzzy AHP and fuzzy MARCOS approach for the evaluation of E-service quality in the airline industry. Decis. Mak. Appl. Manag. Eng. 2021, 4, 127–152. [Google Scholar] [CrossRef]
  23. Blagojević, A.; Vesković, S.; Kasalica, S.; Gojić, A.; Allamani, A. The application of the fuzzy AHP and DEA for measuring the efficiency of freight transport railway undertakings. Oper. Res. Eng. Sci. Theory Appl. 2020, 3, 1–23. [Google Scholar] [CrossRef]
  24. Song, S.Y.; Wang, Q.; Sun, T. Extenics evaluation of engineering geological division of foundation soil in Tianjin Binhai New Area. J. Northeast. Univ. Nat. 2014, 35, 1502–1506. [Google Scholar]
  25. Li, D.; Du, Y. Uncerlain Artificial Intelligence; National Defense Industry Press: Beijing, China, 2005. [Google Scholar]
  26. Wang, H.L.; Liang, Y.S. Evaluation model of highway pavement performance based on extension cloud theory. China Foreign Highway 2015, 35, 6370. [Google Scholar]
  27. Zhang, Y.P.; Yang, J.F. Research on the comprehensive evaluation of rail transit and feeder transit transfer based on extensible cloud model. J. Railw. Sci. Eng. 2016, 38, 59–67. [Google Scholar]
  28. Wu, H.W.; Zhen, J.; Zhang, J. Urban rail transit operation safety evaluation based on an improved CRITIC method and cloud model. J. Rail Transp. Plan. Manag. 2020, 16, 100206. [Google Scholar] [CrossRef]
  29. Li, L.B.; Guo, X.J.; Fu, J.N. Evaluation approach of passenger satisfaction for urban rail transit based on cloud model. J. Tongji Univ. Nat. Sci. 2019, 47, 378–385. [Google Scholar]
Figure 1. The initial application performance index system of pure electric buses.
Wevj 13 00045 g001
Figure 2. Application performance index system of pure electric buses.
Wevj 13 00045 g002
Figure 3. Calculation process of the extension cloud model.
Wevj 13 00045 g003
Figure 4. Boxplots of each evaluation index.
Wevj 13 00045 g004
Figure 5. Cloud drop chart of indicator I1.
Wevj 13 00045 g005
Figure 6. Cloud drop chart of indicator I6.
Wevj 13 00045 g006
Table 1. Related indicators of 6 chosen electric buses.
Bus NumberABCDEF
Safety assistance system level11139878
Motor peak power (kw)200300260260150165
Rated passenger area per capita (m2)0.28180.26140.32840.28530.35580.3477
NEDC mileage (km)335350720495250250
Fully loaded with air conditioner mileage (km)270220290260100100
Fast charge time (min)909090603030
Maximum passenger capacity9511993928677
Passenger power consumption per kilometer (KWh)13.84013.55912.97910.77413.48819.610
Table 2. Evaluation scale.
FailPoorAverageGoodExcellent
I1<33–66–99–12>12
I2<150150–175175–200200–225>225
I3<0.20.2–0.2750.275–0.350.35–0.425>0.425
I4<250250–350350–450450–550>550
I5<100100–150150–200200–250250–300
I6>12090–12060–9030–60<30
I7<8080–9090–100100–110110–120
I8>1514~1513–1412–13<12
Table 3. The indicator weights.
I1I2I3I4I5I6I7I8
Subjective0.65510.06770.06690.05900.04380.02830.05070.0284
Objective0.28760.09070.08410.15710.10420.10950.08070.0860
Comprehensive0.53230.07540.07260.09180.06400.05550.06070.0477
Table 4. Cloud model of each evaluation index.
FailPoorAverageGoodExcellent
I1(1.5, 1.274, 0.127)(4.5, 1.274, 0.127)(7.5, 1.274, 0.127)(10.5, 1.274, 0.127)(13.5, 1.274, 0.127)
I2(75, 63.694, 6.369)(162.5, 10.616, 1.062)(187.5, 10.616, 1.062)(212.5, 10.616, 1.062)(237.5, 10.616, 1.062)
I3(0.1, 0.085, 0.008)(0.2375, 0.032, 0.003)(0.3125, 0.032, 0.003)(0.3875, 0.032, 0.003)(0.4625, 0.032, 0.003)
I4(125, 106.157, 10.616)(300, 42.463, 4.246)(400, 42.463, 4.246)(500, 42.463, 4.246)(600, 42.463, 4.246)
I5(50, 42.463, 4.246)(125, 21.231, 2.123)(175, 21.231, 2.123)(225, 21.231, 2.123)(275, 21.231, 2.123)
I6(135, 12.739, 1.274)(105, 12.739, 1.274)(75, 12.739, 1.274)(45, 12.739, 1.274)(15, 12.739, 1.274)
I7(40, 33.97, 3.397)(85, 4.246, 0.425)(95, 4.246, 0.425)(105, 4.246, 0.425)(115, 4.246, 0.425)
I8(17.5, 2.123, 0.212)(14.5, 0.425, 0.042)(13.5, 0.425, 0.042)(12.5, 0.425, 0.042)(8.5, 2.972, 0.297)
Table 5. Membership degree of electric bus A.
FailPoorAverageGoodExcellent
I10.00000.00000.01220.49280.0776
I20.00010.00010.03770.03770.0001
I30.00730.02760.04570.00030.0000
I40.01300.06540.02850.00000.0000
I50.00000.00000.00000.00680.0622
I60.00010.02770.02770.00010.0000
I70.01640.00380.06070.00380.0000
I80.00190.01430.03460.00030.0002
Table 6. Comprehensive evaluation of each electric bus.
FailPoorAverageGoodExcellent
A0.03880.13890.24710.54190.1402
B0.02660.13250.14770.14250.5345
C0.02010.04040.43470.30620.0637
D0.02570.05140.62590.21390.1083
E0.14130.25510.57630.08740.0286
F0.12530.17390.54060.13860.0279
Publisher’s Note: MDPI stays neutral with regard to jurisdictional claims in published maps and institutional affiliations.

