Abstract
To address the problem in which wheel longitudinal slip rate directly affects the dynamics and handling stability of a vehicle under driving conditions, front and rear dual-motor four-wheel drive electric vehicles (4WD EVs) were selected as the research object in this study. An acceleration slip regulation (ASR) control strategy based on nonlinear model predictive control (NMPC) is proposed. First, the vehicle dynamics model and the Simulink/CarSim co-simulation platform were built. Second, an ASR controller with intervention and exit mechanisms was designed with the control objective of tracking reference speed or optimal slip rate. Then, considering the problem that the left and right wheels could not freely distribute torque under the condition of a split road surface, the motor output torque was determined in accordance with the wheel with the larger slip rate to enhance passibility. Finally, on the basis of the built Simulink/CarSim co-simulation platform, slip rate control simulation experiments were performed on a snow-covered road, a wet asphalt road, a docking road, and a split road. The designed controller can better track target slip rate and it exhibits better dynamic performance and stability than the method with PID control under different road conditions, especially under low speed and low adhesion road conditions, and its robustness can also meet the requirements.
1. Introduction
Pure electric vehicles (EVs) are new energy vehicles driven by motors with batteries as a power source. Compared with traditional vehicles, they exhibit the advantages of not consuming fossil fuels and producing zero emissions during operation; thus, EVs are highly valued by society as an important tool for future development of the automotive industry [1]. EVs, with four-wheel drive (4WD EVs), will provide a higher degree of initiative and electrification to the chassis, improving the performance of the entire vehicle, making the overall structure more compact, and achieving higher transmission efficiency and freer control of the vehicle [2]. In contrast with centralized-drive EVs, front-and-rear axle independent-drive EVs can control the front and rear motors independently, and thus, they exhibit unique advantages in vehicle stability control, vehicle maneuverability enhancement, and motor efficiency improvement [3,4,5]. Front-and-rear axle dual-motor pure EVs have become a popular research topic [6,7,8,9].
The acceleration slip regulation (ASR) system has been widely used in vehicles driven by an internal combustion engine (ICE). Compared with torque output by ICE, torque output via motor presents the characteristics of quick response and large quantity, making EVs more prone to slipping [10,11,12]. This phenomenon will result in the speed of 4WD EVs being uncontrollable, whereafter stability and dynamics cannot be guaranteed. Therefore, the ASR control strategy of 4WD EVs is important.
To solve the aforementioned problems, scholars have conducted numerous related studies. MPC has received wide attention due to its advantages in solving constrained, nonlinear problems [13]. Yuan et al. [14] presented a nonlinear model predictive control (NMPC) for an antilock braking system (ABS) and a traction control system (TCS). Reference tracking was not used because slip rate was solely controlled through the constraints of NMPC formulation. Davide et al. [15] presented a TCS for EVs with in-wheel motors; this TCS is based on explicit NMPC. The proposed controller achieved good results in the simulation and real vehicle verification. Chen et al. [16] proposed an ASR strategy by using fuzzy control. The results of their study indicated that the proposed strategy is an effective technique for improving the dynamic performance and stability of EVs. They focused on controlling the slip rate to remain below the optimal slip rate. In this manner, vehicle stability is guaranteed, but dynamic performance is sacrificed to a certain extent. Guo et al. [17] presented an ASR control strategy based on the classification of road conditions and the calculation of the optimal slip rate for road conditions. In accordance with the real-time slip rate, an appropriate motor torque can be calculated by the control algorithm to track the reference value. These researchers focused on tracking the optimal slip rate, which can maximize the power of a vehicle. However, when driver acceleration demand is small, the actual slip rate is less than the optimal slip rate, and the vehicle is in a stable state. At this moment, turning on the controller will increase computational burden. Therefore, the problem of a controller’s intervention and exit must be solved.
In the current study, an ASR control strategy for EVs based on NMPC with intervention and exit mechanisms is proposed. The algorithm is divided into three modules: the speed control module based on a proportional–integral–derivative (PID) controller, the slip rate control module based on an NMPC controller, and the torque selection module. The PID controller outputs the corresponding torque in accordance with the difference between actual and target vehicle speeds. The NMPC controller outputs the corresponding torque in accordance with the relationship between the actual and optimal slip rates. The torque selection module is responsible for coordinating the torque output of the two controllers, ensuring that the vehicle obtains the most suitable torque input in a certain state. The overall control block diagram is shown in Figure 1. In order to highlight the advantages of the proposed algorithm, we compared it with ASR-PID (contains PID speed controller, PID slip rate controller, intervention and exit mechanisms) and WASR (without acceleration slip regulation). The simulation results show that the proposed algorithm can achieve better results, especially under low speed and low adhesion road conditions.
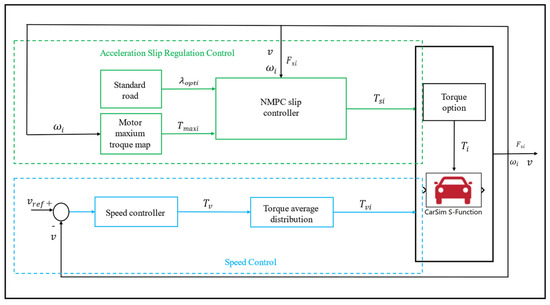
Figure 1.
ASR control block diagram.
The structure of this paper is as follows. In Section 2, we establish the vehicle dynamics model, the motion model of a single wheel, the tire longitudinal force calculation model, and the longitudinal slip model. In Section 3, the speed control strategy is first introduced; then, the NMPC and torque selection mechanism are described. Finally, the overall control block diagram is provided. In Section 4, the control strategy is verified through the co-simulation of Simulink/CarSim.
2. System Model Establishment
2.1. Vehicle Longitudinal Movement
In accordance with Newton’s law, the motion equations of a vehicle are shown as follows [18]. Figure 2 illustrates the longitudinal dynamic model of a vehicle.
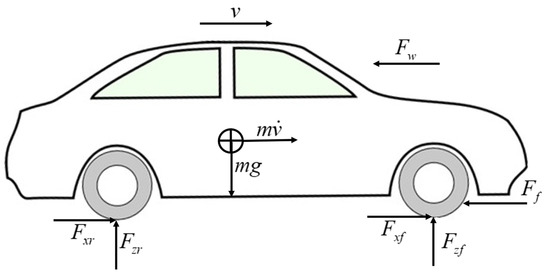 where is the mass of the vehicle; is the acceleration of the vehicle; , , , and are the longitudinal forces of the front left, front right, rear left, and rear right tires, respectively; and and are the air resistance and rolling resistance, respectively.

Figure 2.
The longitudinal dynamic model of a vehicle.
2.2. Four Wheels’ Rotation Movement
The wheels’ rotation movement describes the relationship between the applied torque and the longitudinal force generated, which is shown in Figure 3.
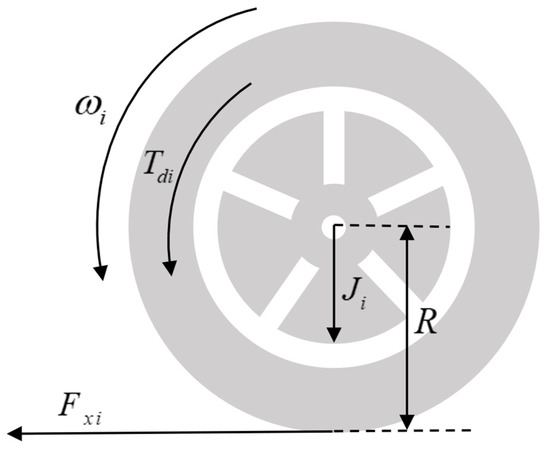 where is the wheel moment of inertia, is the wheel angular acceleration, is the torque acting on the wheel, and is wheel rolling radius.

Figure 3.
The wheel dynamics model.
2.3. Tire Longitudinal Force Calculation Model
The calculation of the longitudinal force of the tire is crucial for the longitudinal dynamics of a vehicle. Researchers typically establish a tire model to obtain the longitudinal force of a tire. Here, the μ–s curve of the standard road proposed by Burckhardt is used to replace the tire model [19], which is shown in Figure 4.
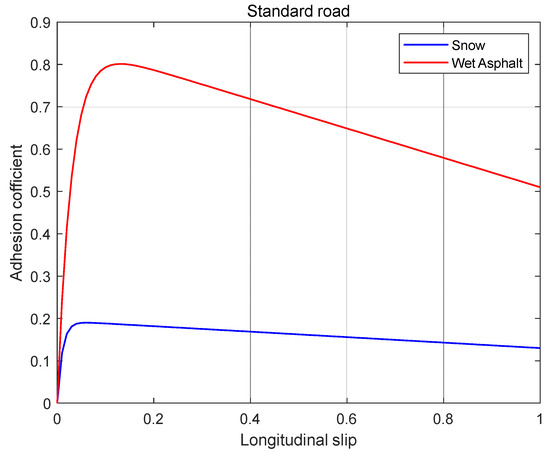 where , , and are the coefficients related to the road surface. Their values are provided in Table 1. is the slip rate.

Figure 4.
Adhesion coefficient vs. slip.

Table 1.
The relevant parameters of a standard road.
In accordance with Formula (3), the following conclusion can be drawn:
Let . We obtain
where is the optimum slip rate, and is the maximum road adhesion coefficient.
The calculation method for tire longitudinal force is
The vertical force of each tire can be calculated using the following formula:
In the current study, the longitudinal motion of a vehicle is considered, and the influence of lateral acceleration is disregarded. The above formula can be simplified as
where , , , and are the vertical loads of the four wheels; a and b are the distance from the center of mass to the front and rear axles, respectively; g is the gravitational acceleration; is the height from the center of mass to the ground; and is the longitudinal acceleration of a vehicle.
2.4. Longitudinal Slip Calculation Model
The longitudinal slip of the tire is the key to calculating its longitudinal force. The relationship of longitudinal slip with vehicle speed and wheel angular speed can be described as
3. Control Strategy
3.1. PID-Based Speed Controller Design
The speed control module is specifically established to simulate the driver’s expected torque output. It consists of a PID controller and an average torque distribution. The total control torque can be expressed by the following formula:
where is the total control torque; is the difference between reference and actual speeds; and , , and are the proportional, integral, and differential parameters of the PID controller, respectively.
The torque adopts the principle of equal distribution, and the torque of each wheel can be expressed as
where is the torque of each wheel.
3.2. NMPC-Based Slip Controller Design
Wheel slip rate is set as the direct control variable by the general slip rate control. When the vehicle uses slip rate as the control variable in the low-speed starting stage, errors and disturbances in vehicle speed estimation will exert a relatively greater effect, and the lag of the motor torque will cause larger buffeting. The primary reason for this phenomenon is that disturbances and delays are passed directly to the control variable. Considering this deficiency, a slip rate control algorithm with wheel speed as the control variable is proposed to compensate for the defect of the controller at low vehicle speed. From the definition of slip rate, the tracking reference wheel slip rate signal is equivalent to the tracking reference wheel speed signal.
A minimum vehicle speed strategy is designed to prevent the effects of vehicle speed errors and disturbances on the controller when starting at a low speed. That is, when the estimated vehicle speed is less than a certain value, the fixed value vehicle speed is used in calculating reference wheel speed.
From Formula (2), the following can be determined:
From Formula (1),
3.2.1. Model Discretization
The state-space equation of slip control can be described as
The state-space equations of the system are discretized using Euler’s method. ∆t is defined as the sampling step size. By applying it to the state-space model at sampling time k, the preceding formula can be discretized as
where is the state variable, is the input for system control, is the output for system control, represents the gradient of the system state change at time k, and the output matrix is .
is defined as the control time domain, is the prediction time domain, and . At sampling time k, the control sequence and the output sequence of the system are expressed as follows:
Here, is the output reference sequence that represents the optimal angular velocity sequence . At sampling time k, is the sequence of changes in the control input. It is calculated such that , and its value is 0 when k exceeds the control time domain.
At sampling time k, the predicted state and output are
3.2.2. Description of Optimization Problem
The primary objective of the control requirement is to track the optimal slip rate and ensure that the vehicle can obtain a large longitudinal force to fully utilize the road adhesion coefficient and improve possibility. Therefore, a cost function is added to meet the requirements for tracking the optimal angular speed.
To preserve driver comfort, the change rate of the control action should not be excessively large, because such a condition may lead to serious torque ripple. That is, the change rate of the control variable should be sufficiently small to ensure comfort during acceleration. Thus, a cost function is added to limit the change rate of the control variable.
By combining the aforementioned control objectives, the following cost function is proposed:
3.3. Design of Intervention and Exit Mechanisms
In practical applications, being fully controlled by the controller is unnecessary, and driver’s demand torque must also be comprehensively considered. Therefore, for the selection of driver’s demand torque and controller’s control torque, the current study designs intervention and exit mechanisms for the control algorithm to ensure that the motor output torque conforms to the current state of the vehicle.
To avoid the failure of the intervention and exit mechanisms due to the chattering of the slip rate at low speed, the NMPC controller is always turned on when . The specific flowchart is shown in Figure 5:
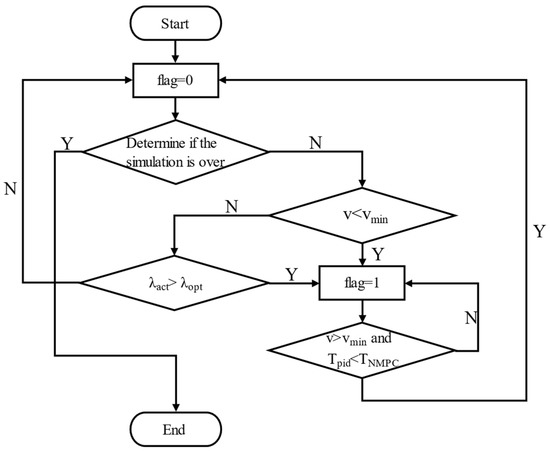 where is the actual slip rate, is the optimal slip rate, is driver’s demand torque, and is the output torque of the NMPC controller.

Figure 5.
The process of the torque option.
The controller is turned on when flag = 1, and the driver takes over when flag = 0.
4. Simulation and Analysis
MATLAB/CarSim co-simulation was conducted to verify the effectiveness of the proposed algorithm. The optimization toolbox fmincon in MATLAB is suitable for solving constrained and nonlinear problems; therefore, it could be used to solve the optimization problem in this study.
The simulations were performed under four different conditions: low adhesion road, high adhesion road, docking road, and split road. In addition, every condition included two aspects: vehicle starting and vehicle acceleration, the former initial velocity was 0 km/h, the latter initial velocity was 30 km/h. The road surface is assumed to be flat and smooth, and the vehicle will drive straight on these roads except on the split road. These test maneuvers are typical maneuvers developed for evaluating the performance characteristics of a vehicle [20].
In order to ensure that the controller can adapt to various single road surfaces, the simulation tests of low adhesion and high adhesion road surfaces are carried out. When the vehicle enters the low adhesion road from the high adhesion road, the wheels will rotate violently if the driving torque cannot be reduced rapidly, which will greatly reduce the stability; from the low adhesion road to the high adhesion road, the vehicle’s dynamic performance will be limited to a large extent if the torque cannot increase rapidly. In order to ensure that the controller can respond quickly to this, the simulation test of the docking road is carried out.
Driving on a split road is a very critical test maneuver, since the vehicle will experience severe instability if the driver does not react immediately to correct the course of the vehicle. During this test, due to the asymmetric driving forces generated on the left and right tires, the vehicle will be pushed to the side of the road that has a lower coefficient of friction. Therefore, it is necessary to a conduct simulation test on a split road.
The major parameters of the class A 4WD EV are listed in Table 2. To improve the realism of the simulation and the validity of the results, the white noise is added to the simulation process. Finally, the robustness of the whole control system is analyzed. The simulation results are as follows:

Table 2.
Major parameters of the EV.
4.1. Low Adhesion Road
The simulation condition is a snow-covered road. The road adhesion coefficient is 0.19. The optimal slip rate is 0.06. The reference speed is 0–15 km/h and 30–45 km/h. The target speed is reached within 2 s, and this speed is maintained until the end of the simulation The simulation results are shown in Figure 6 and Figure 7.
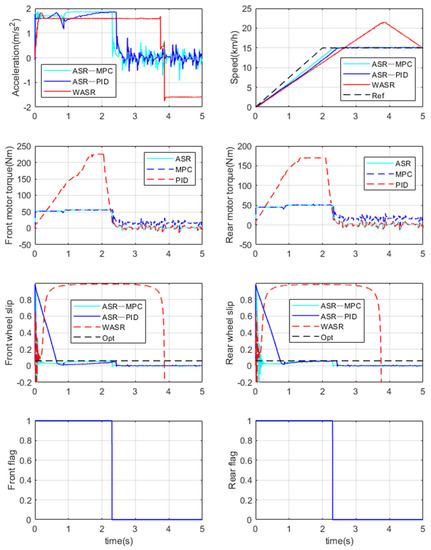
Figure 6.
Vehicle starts under a low adhesion coefficient road.
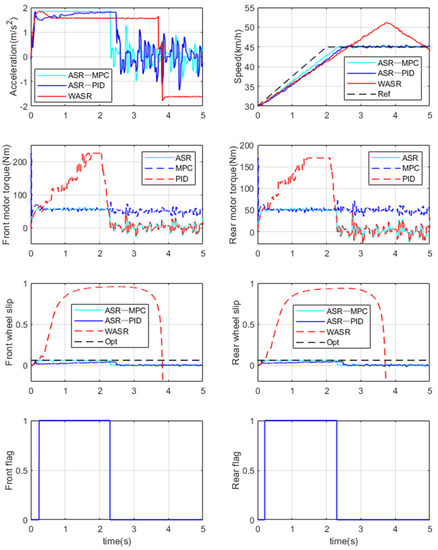
Figure 7.
Vehicle accelerates under a low adhesion coefficient road.
As shown in the figure, the designed controller achieves ideal results compared with the WASR (without acceleration slip regulation), which only contains the PID speed controller. ASR-MPC is the simulation result of the designed algorithm, ASR-PID contains PID speed and a PID slip rate controller, which also contains intervention and exit mechanisms. “Ref” and “Opt” are the reference vehicle speed and the optimal wheel slip rate, respectively. In order to clearly show the role of the intervention and exit mechanisms, only the simulation results of ASR-MPC are shown in the second and fourth lines of the above simulation figures. In vehicle starts condition of ASR-MPC, at 0–2.2 s, the slip rate controller is always on. At 0–0.8 s, vehicle velocity is less than 5 km/h, the actual slip rate cannot track the optimal slip rate because of the reference angular speed is a fixed value and the motor output torque is limited. An actual slip rate of 0.8–2.2 s can track the optimal slip rate well, and acceleration remains at 1.83 m/s2. After 2.2 s, the NMPC is turned off, and acceleration rapidly drops close to 0, because the reference speed has been tracked at this time, and thus, continuing to accelerate becomes unnecessary. The simulation results of ASR-PID are similar to those of ASR-MPC. The difference is that the first arrival reference speed of ASR-PID is slightly slower than that of ASR-MPC, because the latter has better slip rate control. In contrast with WASR, acceleration is maintained at 1.65 m/s2 most of the time, and the slip rate is close to 1. After reaching the reference speed, acceleration cannot be reduced in time, and the simulation reports an error at 4.6 s. This working condition is extremely dangerous and should be avoided. In the torque diagram, MPC and PID are the slip rate control output torque and driver output torque, respectively, in ASR control. ASR is the final output torque of the front and rear axle motors. Under the action of the intervention and exit mechanisms, the front and rear axle motors can always select a more suitable torque as the output.
During vehicle acceleration, the simulation results are similar to those of a vehicle starting. The difference is that the former slip rate changes smoothly and the NMPC is closed in the beginning of the simulation, while the latter fluctuates evidently and the NMPC is turned on. The reason for this phenomenon is that the latter starts at a speed of 0, and a small fluctuation in wheel angle can cause a considerable change in slip rate. To suppress this phenomenon, the NMPC is turned on when the vehicle speed is less than the minimum vehicle speed vmin.
4.2. High Adhesion Road
The simulation condition is a wet asphalt road. The road adhesion coefficient is 0.8, and the optimal slip rate is 0.13. The reference speed is 0–55 km/h and 30–85 km/h. The target speed is reached within 2 s, and this speed is maintained until the end of the simulation. The simulation results are shown in Figure 8 and Figure 9.
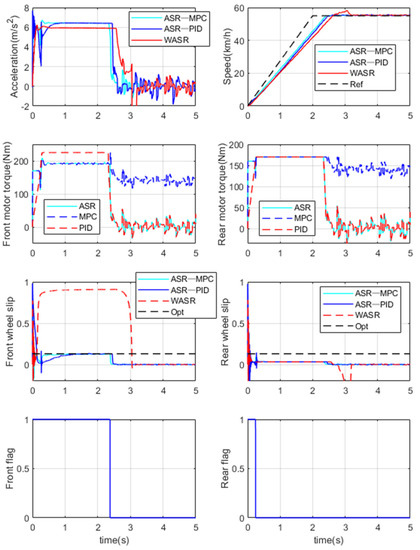
Figure 8.
Vehicle starts under a high adhesion coefficient road.
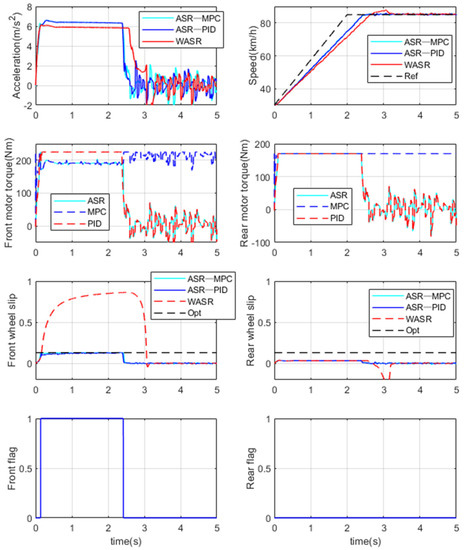
Figure 9.
Vehicle accelerates under a high adhesion coefficient road.
As shown by the results, ASR-MPC and ASR-PID are more dynamic than WASR and has a faster speed response. In ASR-MPC control, the NMPC is turned on when vehicle speed is greater than vmin, and the front wheel slip rate can effectively track the optimal slip rate. However, the rear wheel slip rate cannot track the optimal slip rate, because the load is transferred backward during the acceleration process, and the rear axle wheels require a larger motor torque to generate the same slip rate. The slip rate cannot continue increasing due to the limitation of the motor torque. The control effect of ASR-PID is basically consistent with that of ASR-MPC. In WASR control, the wheel slip rate is large at 0.2–3 s. The handling stability of the vehicle is considerably reduced at this time. This condition is more dangerous, and the rear wheel slip rate is always kept at a small value due to load transfer. When speed is greater than vmin, the slip rate can track the optimal slip rate if flag = 1, and the slip rate remains below the optimal slip rate if flag = 0. Therefore, the designed algorithm can also play an important role in a road surface with a high adhesion coefficient. The expected results can be achieved regardless of the starting and acceleration.
4.3. Docking Road
The road adhesion coefficient is 0.8 in the first 5 m, 0.19 in 5–15 m, and 0.8 after 15 m. The reference speed is 0–50 km/h and 30–80 km/h. The target speed is reached within 2 s, and this speed is maintained until the end of the simulation. The target slip rates are 0.13 and 0.06 when the adhesion coefficients are 0.8 and 0.19, respectively. The simulation results are shown in Figure 10 and Figure 11.
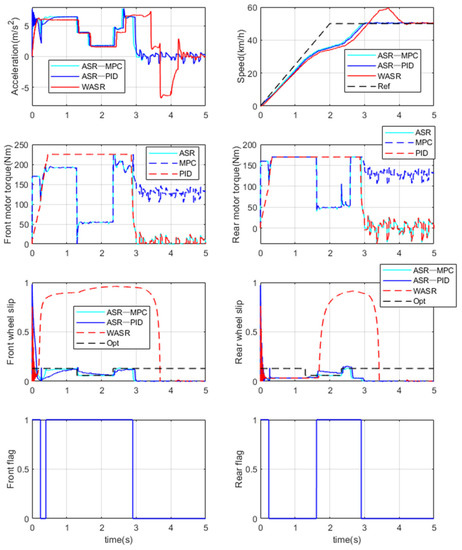
Figure 10.
Vehicle starts on a docking road.
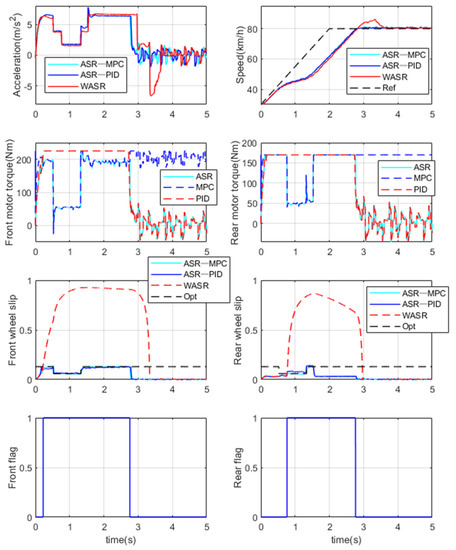
Figure 11.
Vehicle accelerates on a docking road.
In accordance with the preceding simulation results, the vehicle starting process is as expected. However, the vehicle acceleration results have two unusual aspects. First, the slip rate of the rear wheel can keep up with the optimal slip rate immediately after entering the high adhesion road from the low adhesion road, because the reference slip rate is obtained on the basis of the front wheels. When the front wheels have just entered the high adhesion road from the low adhesion road, the rear wheels are still in the low adhesion road, and thus, their slip rate increases rapidly as the rear motor torque increases. Second, WASR acceleration is greater than ASR-MPC and ASR-PID acceleration in the second half of the acceleration process. The reason for this phenomenon is that wheel angular speed is excessively high, such that it can maintain a large slip rate after entering the high adhesion road from the low adhesion road in WASR. Meanwhile, in ASR-MPC and ASR-PID, the rear wheels’ slip rate decreases rapidly after the vehicle enters the high adhesion road. The adhesion–longitudinal slip curve can determine that the longitudinal force generated by the rear wheels of WASR is greater than that of ASR-MPC and ASR-PID, and the total longitudinal force is also related in this manner.
4.4. Split Road
The road adhesion coefficient of the left wheels is 0.8 in the first 5 m, 0.19 in 5–15 m, and 0.8 after 15 m. Meanwhile, that of the right wheels is 0.8. The reference speed is 0–50 km/h and 30–80 km/h. The target speed is reached within 2 s, and it is maintained until the end of the simulation. The simulation results are shown in Figure 12 and Figure 13.
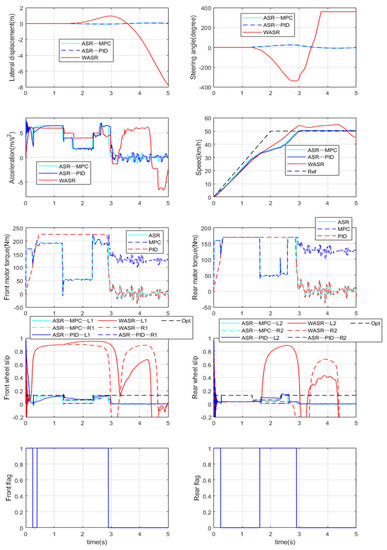
Figure 12.
Vehicle starts on a split road.
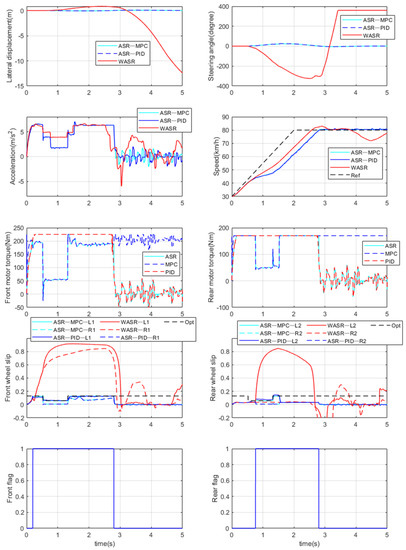
Figure 13.
Vehicle accelerates on a split road.
When entering the split road, the output torque of the motor is determined by the wheel with the smaller optimum slip rate. At 5–15 m, the optimal slip rate of the left wheels is 0.06. The vehicle has dual motors on the front and rear axles; hence, the torque of the left and right wheels on the same axis should be equal. When the left wheels keep up with the optimal slip rate, the output torque of the motor makes the right wheels’ actual slip rate less than 0.06, while the optimal slip rate of the right wheels is 0.13. If the actual slip rate is less than the optimal slip rate, then the generated longitudinal force increases with an increase in slip rate. In the simulation process, the longitudinal force generated by the right wheels is smaller than that of the left wheels. When the vehicle is traveling, differential steering is generated due to the difference in longitudinal force of the left and right wheels, and the vehicle is slightly deflected to the right. Accordingly, the PID controller is added to ensure that the vehicle drives on the split road within the 5–15 m interval.
As shown in the figure, ASR-MPC and ASR-PID have a smaller steering wheel angle and a smaller lateral displacement than WASR. The former is kept near the centerline of the lane. The maximum steering wheel angle is around 25°, and the maximum deviation does not exceed 0.08 m. The simulation runs smoothly throughout the whole process. Meanwhile, the latter’s maximum steering wheel angle reaches the limit value of 360°, and the maximum deviation reaches 15 m. Safety is particularly important when driving on the split road; hence, power is sacrificed to a certain extent to ensure the smooth running of the vehicle.
A, B, C, D, and E in Table 3 represent the time taken to reach the reference speed for the first time, the time taken to stabilize at the reference speed, whether speed has an overshoot, the maximum steering wheel angle, and the maximum lateral displacement, respectively. “In” in B indicates that the steady speed is not reached at the end of the simulation. Different road surfaces and conditions have varying reference speeds. The difference between the maximum and minimum reference speeds of the same road surface under different conditions is the same.

Table 3.
A comparison of the simulation results.
Table 3 clearly shows that, except for the docking road, the acceleration time of the same road surface under different conditions tends to be the same. The reason for the difference in the docking road is that under acceleration condition, when the low adhesion road enters the high adhesion road, the angular speed of the rear wheels of WASR is excessively high, such that the slip rate can still be maintained at a large value immediately after entering the high adhesion road. Meanwhile, the angular speed of the rear wheels of ASR-MPC and ASR-PID is low, and the slip rate of the rear wheels decreases rapidly after entering the high adhesion road. The longitudinal adhesion coefficient–slip rate relationship curve can determine that the longitudinal force generated by WASR is greater than that generated by ASR-MPC and ASR-PID. Thus, the acceleration of WASR in the second half is greater than that of ASR-MPC and ASR-PID.
To keep the vehicle running on the split road, a PID controller is added to offset the differential steering caused by the difference in longitudinal force of the left and right wheels. ASR-MPC and ASR-PID always achieve a smaller lateral displacement with a smaller steering wheel angle. The control effect of ASR-MPC at low speed and low adhesion is obviously better than that of ASR-PID, the simulation results of the two at other working conditions are close. The effectiveness of the proposed algorithm is fully verified through the preceding simulation tests.
4.5. Robustness Analysis
In order to verify the robustness of the control system, the vehicle body mass in CarSim is set to 0.8, 1 and 1.2 times the original body mass, and working condition is set to vehicle starts under a low adhesion coefficient road. The simulation results are shown in Figure 14.
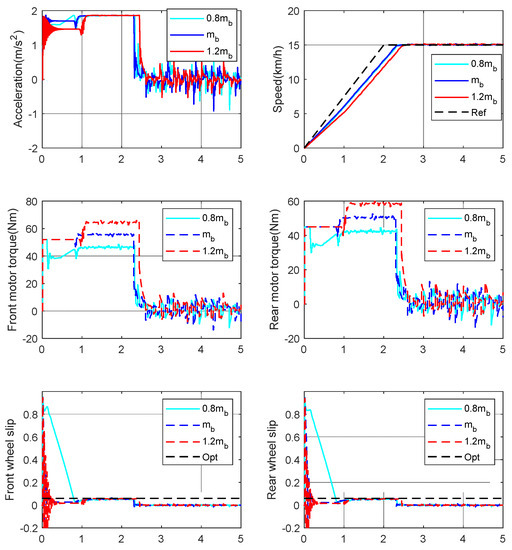 where refers to the original body mass, 0.8 and 1.2 represent 0.8 times and 1.2 times the body mass, respectively.

Figure 14.
The robustness verification.
From the above simulation results, it can be seen that the simulation result is the best when the body mass is , because the body mass in the control algorithm is the same; when the body mass is 0.8, the slip ratio decreases slowly from a large value. The reason for this is that the optimal wheel angular speed is a fixed value if the vehicle speed is less than . It takes a short time to track the optimal wheel speed for the reason that the vehicle weight is small. With the increase of vehicle speed, the slip ratio decreases gradually; when the body mass is 1.2, the reference speed tracking time of the vehicle speed is greater than the 0.8 and . This phenomenon occurs because the maximum output torque of the motor is limited when the vehicle speed is less than , which results in the wheel slip rate being kept at a small value, and therefore the acceleration is small. In general, under these three body masses, the simulation can achieve the desired results, and the robustness of the controller has been verified.
5. Conclusions
This study proposes an ASR control system for 4WD EVs based on NMPC with intervention and exit mechanisms to solve the problem of wheel slipping and uncontrollable speed under acceleration conditions. Considering dynamic performance and comfort problems caused by severe torque fluctuation, a cost function for tracking the optimal slip rate and limiting torque change rate is established. An optimal solution is then found using the optimization toolbox fmincon in MATLAB. Intervention and exit mechanisms are designed for the controller to solve the problem of switching between slip rate tracking and speed tracking. The effectiveness of the proposed controller is evaluated on a low adhesion road, a high adhesion road, a docking road, and a split road. The simulation results show that the proposed controller can accurately control the longitudinal slip of the four wheels in accordance with the optimal slip rate and reference speed, and the robustness can also meet the requirements.
Author Contributions
Conceptualization, Y.J. and Z.S.; methodology, W.S., Y.J., Z.S. and H.C.; software, W.S. and Y.J.; validation, W.S. and Z.Y.; formal analysis, H.C., Z.Y. and D.L.; investigation, W.S. and Z.Y.; writing—original draft preparation, W.S. and Y.J.; writing—review & editing, H.C. and Z.S.; visualization, D.L.; supervision, Y.J. and H.C.; project administration, H.C.; funding acquisition, H.C. All authors have read and agreed to the published version of the manuscript.
Funding
This research was funded in part by the Perspective Study Funding of Nanchang Automotive Institute of Intelligence and New Energy, Tongji University, grant number [TPD-TC202110-09], and in part by the Starting Research Fund from the Shanghai Customs College, grant number [kyqd202204].
Conflicts of Interest
The authors declare no conflict of interest.
References
- Liu, Z.; Hao, H.; Cheng, X.; Zhao, F. Critical issues of energy efficient and new energy vehicles development in China. Energy Policy 2018, 115, 92–97. [Google Scholar] [CrossRef]
- Emadi, A. Advanced Electric Drive Vehicles; CRC Press: Boca Raton, FL, USA, 2014. [Google Scholar]
- Nguyen, C.T.; Walker, P.D.; Zhang, N. Optimization and coordinated control of gear shift and mode transition for a dual-motor electric vehicle. Mech. Syst. Signal Process. 2021, 158, 107731. [Google Scholar] [CrossRef]
- Yang, Y.; He, Q.; Chen, Y.; Fu, C. Efficiency optimization and control strategy of regenerative braking system with dual motor. Energies 2020, 13, 711. [Google Scholar] [CrossRef]
- Hu, X.; Li, Y.; Lv, C.; Liu, Y. Optimal energy management and sizing of a dual motor-driven electric powertrain. IEEE Trans. Power Electron. 2018, 34, 7489–7501. [Google Scholar] [CrossRef]
- Interrupt-Free Operation of Dual-Motor Four-Wheel Drive Electric Vehicle under Inverter Failure. Available online: https://ieeexplore.ieee.org/document/9103127 (accessed on 30 September 2022).
- Xiong, H.; Zhu, X.; Zhang, R. Energy recovery strategy numerical simulation for dual axle drive pure electric vehicle based on motor loss model and big data calculation. Complexity 2018, 2018, 4071743. [Google Scholar] [CrossRef]
- Driving-Cycle-Oriented Design Optimization of A Permanent Magnet Hub Motor Drive System for A Four-Wheel-Drive Electric Vehicle. Available online: https://ieeexplore.ieee.org/abstract/document/9141333 (accessed on 30 September 2022).
- Heydari, S.; Fajri, P.; Shadmand, M.; Sabzehgar, R. Maximizing harvested energy through regenerative braking process in dual-motor all-wheel drive electric vehicles. In Proceedings of the 2020 IEEE Transportation Electrification Conference & Expo (ITEC), Chicago, IL, USA, 23–26 June 2020; pp. 1246–1250. [Google Scholar]
- He, H.; Yu, X.; Sun, F.; Zhang, C. Study on power performance of traction motor system for electric vehicle. Proc. -Chin. Soc. Electr. Eng. 2006, 26, 136. [Google Scholar]
- Ding, X.; Wang, Z.; Zhang, L. Hybrid Control-Based Acceleration Slip Regulation for Four-Wheel-Independent-Actuated Electric Vehicles. IEEE Trans. Transp. Electrif. 2021, 7, 1976–1989. [Google Scholar] [CrossRef]
- Hori, Y. Future vehicle driven by electricity and control-research on four wheel motored “UOT Electric March II”. In Proceedings of the 7th International Workshop on Advanced Motion Control (Cat. No.02TH8623), Maribor, Slovenia, 3–5 July 2002; pp. 1–14. [Google Scholar] [CrossRef]
- Wang, F.; Chen, H.; Guo, L.; Hu, Y. Predictive safety control for road vehicles after a tire blowout. Sci. China Inf. Sci. 2018, 61, 1–3. [Google Scholar] [CrossRef]
- Yuan, L.; Zhao, H.; Chen, H.; Ren, B. Nonlinear MPC-based slip control for electric vehicles with vehicle safety constraints. Mechatronics 2016, 38, 1–15. [Google Scholar] [CrossRef]
- Tavernini, D.; Metzler, M.; Gruber, P.; Sorniotti, A. Explicit Nonlinear Model Predictive Control for Electric Vehicle Traction Control. IEEE Trans. Control Syst. Technol. 2019, 27, 1438–1451. [Google Scholar] [CrossRef]
- Chen, Q.; Kang, S.; Chen, H.; Liu, Y.; Bai, J. Acceleration slip regulation of distributed driving electric vehicle based on road identification. IEEE Access 2020, 8, 144585–144591. [Google Scholar] [CrossRef]
- Guo, L.; Xu, H.; Zou, J. Acceleration slip regulation control strategy for four-wheel independent drive electric vehicles. IEEJ Trans. Electr. Electron. Eng. 2019, 14, 630–639. [Google Scholar] [CrossRef]
- Peng, J.; He, H.; Feng, N. Simulation research on an electric vehicle chassis system based on a collaborative control system. Energies 2013, 6, 312–328. [Google Scholar] [CrossRef]
- Burckhardt, M. Fahrwerktechnik: Radschlupf-Regelsysteme: Reifenverhalten, Zeitablaeufe, Messung des Drehzustands der Raeder, Anti-Blockier-System (ABS), Theorie Hydraulikkreislaeufe, Antriebs-Schlupf-Regelung (ASR), Theorie Hydraulikkreislaeufe, elektronische Regeleinheiten, Leistungsgrenzen, ausgefuehrte Anti-Blockier-Systeme und Antriebs-Schlupf-Regelungen; Vogel Business Media: Würzburg, Germany, 1993; Available online: https://www.zvab.com/9783802304774/Fahrwerktechnik-Radschlupf-Regelsysteme-Burckhardt-Manfred-3802304772/plp (accessed on 29 September 2022).
- Jalali, K. Stability control of electric vehicles with in-wheel motors. Mech. Syst. Signal Process. 2010, 118, 340–359. [Google Scholar]
Publisher’s Note: MDPI stays neutral with regard to jurisdictional claims in published maps and institutional affiliations. |
© 2022 by the authors. Licensee MDPI, Basel, Switzerland. This article is an open access article distributed under the terms and conditions of the Creative Commons Attribution (CC BY) license (https://creativecommons.org/licenses/by/4.0/).