Abstract
In this paper, a novel and complete navigation system is proposed for mobile ground vehicles in a park environment. LiDAR map representation and maintenance, dynamic objects detection and removal, hierarchal path planning and model-free local planning are developed in the system. The system is formulated in three layers. In the global layer, given the global point cloud map of the environment, the traverse area is detected and its skeleton graph is extracted to represent the global topology of the environment. Then, in the middle layer, the global map is divided into several submaps and each submap is represented by a modified multi-layer grid map. In the local layer, considering the dynamics of the environment, according to the real-time LiDAR observation, a probabilistic distribution-based representation and its updating mechanism are proposed. Based on the hierarchal environment map representation, the path planning and local planning are performed in a hierarchal way. Considering the complexity of the motion model estimation, a model free local planner is used. Extensive experiments are conducted in the real environment and the source code will be made open for the robotics community.
1. Introduction
Ground vehicle navigation has been extensively studied and developed in recent decades. Alongside traffic scenes, park scenarios are becoming a more important application task environment, representing the last 1km of navigation. The robust, stable, and flexible navigation function has become a fundamental requirement for mobile ground vehicles and many navigation systems have been successfully developed. However, due to rough and irregular terrain, complex dynamic cases, and a changing environment, constructing an effective and adaptable navigation system is still necessary.
At present, the mainstream perception methods mainly include vision-based [1,2] and LiDAR-based methods, as well as vision–language methods [3,4,5]. There are many related studies using them for navigation systems. Vision-based methods can provide rich environmental information with cameras, but are vulnerable to changes in light conditions, and the computational cost is large. The method based on LiDAR is more robust and suitable for all-day navigation tasks in the park environment.
Navigation systems are highly involved with environment representation. The performance of the environment-representing method plays an important role during the navigation process. For LiDAR-based maps, point cloud-based maps are in a raw style, while the information is redundant and less informative, including the topological information and occupancy information. Among the existing navigation systems, the environment representation methods can be classified into the following classes: a 2D grid map, which is incapable of representing 3D information, and a 2.5D map, which is a more expressive form based on the multi-layer 2D structure. Instead of using grid cells, in [6], the map directly uses raw point cloud and sample points for the nodes and to construct a probability road map.
An effective map representation should have the following characteristics. Firstly, topological information should be clear. Secondly, it should be easily updated. Thirdly, it should be easily and efficiently retrieved. Thus, in this paper, we propose a novel multi-layer map for a 3D environment with rough ground terrain. Based on the map module, the path planning and local planner modules are proposed to formulate a full navigation system. A star on the global topological map, hybrid A star on the middle map, model-free planner on the local map. Our contributions are as follows.
- We developed a map representation and maintenance form based on a multi-layer map architecture, proposed a ground detection method based on regional ground plane fitting and a topology extraction method based on probabilistic road map, and an integrated dynamic objects removal algorithm;
- Based on the hierarchical navigation architecture, we established a three-level planner for path planning and dynamic obstacle avoidance at different distances; The method in this paper is integrated into a real unmanned mobile platform, and the experimental tests are carried out in a complex park environment to verify the effectiveness of the navigation system.
2. Related Work
Research into navigation systems has a long history. In recent years, related research on navigation systems has mainly focused on three aspects, namely state estimation, autonomous navigation and motion planning. The CMU-exploration [7] developed by the Robotics Institute of Carnegie Mellon University is a stable navigation system. Obstacle avoidance [8], autonomous exploration [9,10] and traversable area analysis [11] are included in the system’s autonomous navigation algorithm. Based on the simulation platform and the ground robot platform, it is easy to test the performance of the navigation system in different simulation environments and different real-world scenarios.
For a mobile robot system, reliable observation of the environment is the basis of state estimation and autonomous function achievement, and mapping also plays an important role in robotics. As an active sensor, LiDAR is widely used in unmanned systems because of its wide data coverage, high accuracy and strong reliability. LiDAR-based mapping methods mainly include SLAM methods [12] and point cloud stitching methods based on RTK/GPS localization [13]. RTK/GPS can be used in an open, well-signaled environment to obtain absolute location information in real time without cumulative error, based on which maps can be built in conjunction with LiDAR [14]. Google’s Baidu unmanned vehicles [15] have adopted GPS-based multi-sensor fusion localization and mapping methods. However, RTK/GPS may locate incorrectly due to poor signal indoors or heavily obscured environments, in which case localization and mapping can be achieved through SLAM algorithms. The LOAM (LiDAR Odometry and Mapping) [16] proposed by Zhang et al. is a classic method based on point cloud geometric feature matching, and can achieve efficient real-time localization. Additionally, they use low-frequency optimization thread to reduce cumulative errors. The LeGO-LOAM [17] proposed by Shan et al. is based on LOAM for lightweight improvement and adds ground optimization and loop detection. LIO-SAM [18] is based on a multi-sensor fusion framework that fuses tightly coupled IMU with the addition of GPS observation factor.
For map representation, researchers are looking for an expression form that is informative and easy to maintain. In addition to the point cloud map, the grid map has the advantages of easy construction and maintenance, clear correspondence with the real environment, and a small storage space. The combination with multiple layers is a common form of the accurate characterization of the environment in detail. Peter et al. designed a model containing layers such as an obstacle layer, elevation layer, normal vector layer, etc. [19]. The structure is shown in Figure 1.
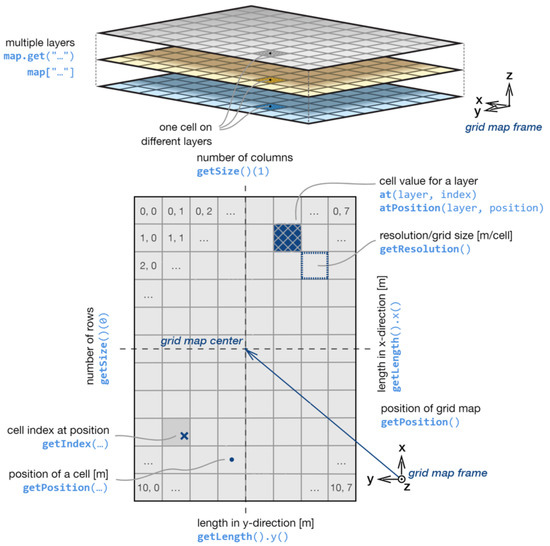
Figure 1.
Structure of multi-layer grid map: multi-layer structure (upper part) and grid data structure of each layer (lower part).
For good localization performance and reliable path planning, a ‘clean’ map containing only static objects in the environment is expected, which is necessary for the navigation system. Researchers have proposed many methods based on ray-tracing or visibility [20,21,22] for dynamic object removal and static map construction, which may have disadvantages [23], as shown in Figure 2, while achieving certain effects. As shown in Figure 2a, the static ground plane is regarded as a dynamic object when the incident angle is too large. For the case in Figure 2b, if there is no point cloud behind the high part of the dynamic object due to the open terrain, the high part cannot be removed. Meanwhile, occlusion has always been a troubling problem, if a dynamic object is partially occluded by a static object, the occluded part cannot be removed, as shown in Figure 2c.
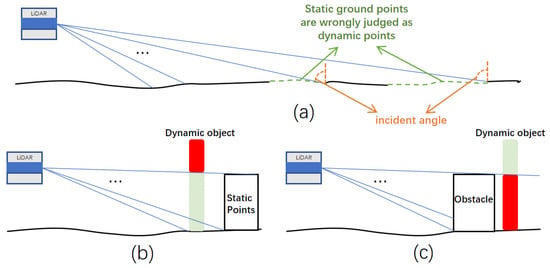
Figure 2.
Shortcomings of visibility-based methods: (a) Ground error identification. (b) The red part is not removed because of the empty scene behind. (c) The red part is not removed because of occlusion.
In order to analyse the dynamic objects in the environment, there are also many works using target recognition and tracking. Vision-based recognition and tracking methods have been extensively studied and applied [24,25,26,27]. Three-dimensional target detection algorithms based on laser point cloud can be divided into traditional methods and deep learning methods [28,29,30,31]. Ref. [28] uses the method in [32] to extract the feature fragments of the target, and uses the clustering algorithm to obtain the target point cloud. In [30], the laser point cloud is represented in the form of aerial view and combined with a convolutional neural network (CNN) for target detection and tracking. However, the laser point cloud is sparse when the target is far away; therefore, the recognition effect will be significantly reduced, and false recognition or tracking is harmful to environment modeling.
Traditional planning algorithms can be divided into graph-based algorithms and sampling-based algorithms. Classical graph search algorithms include Dijkstra’s algorithm [33], A* [34] and sampling-based algorithms include RRT [35] and RRT* [36], etc. In order to solve the adaptation problem for different scenarios and different platforms, numerous techniques have been developed to solve the autonomous planning problem. For planning collision-free and safe paths online for autonomous underwater vehicles, Juan David proposed an improved approach [37]. Liu et al. proposed the MAPPER algorithm to realize Multi-agent navigation in dynamic environments [38]. O. Peltzer et al., from Stanford University, proposed the FIG-OP algorithm for autonomous exploration of large-scale unknown environments [39].
Our navigation system combines existing mapping methods and planning algorithms, introduces model constraints, a multi-layer framework, and realizes autonomous perception and autonomous navigation of LIDAR-only ground vehicles for park environments based on multi-layer maps and multi-level planners.
3. Proposed System
Our navigation system is formulated in a hierarchical way. The system is mainly divided into the following two modules: the mapping representation module and planning module.
3.1. System Framework
As shown in Figure 3, the mapping representation module contains six sub-modules for navigation, namely global point cloud map, traverse area detection and representation, dynamic objects detection and removal, topological skeleton extraction, middle map construction and local map maintenance. Correspondingly, the planning module is also divided into different levels, which are responsible for planning from the global level to the local; in descending order, the hierarchy is as follows: the global planner, middle planner and local planner. To meet the requirements of the three-level planner, we use the global traversable topology map for the top-level global planner. For the more refined requirements of the middle level local planner, we use appropriate scales to divide the map into local areas and combine the observation information to form a submap. Furthermore, for the requirements of motion and obstacle avoidance control of the bottom-layer local planner, we combine real-time observation to update the local submap in real time to ensure the safety and reliability of navigation.
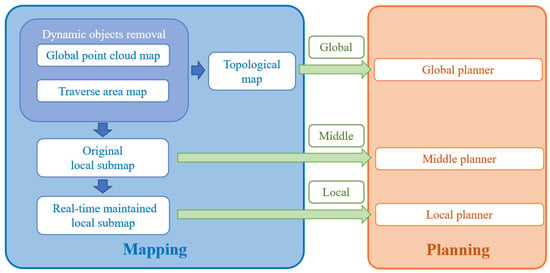
Figure 3.
System framework (our navigation system includes mapping and planning modules, forming a three-level structure).
3.2. Mapping Representation Module
Accurate and complete map representation is the prerequisite for a mobile robot navigation system and high-level applications. Traditional point clouds and feature maps organized by octree and grid maps can meet the needs of single problem such as global localization and path planning. But they can’t meet the needs of long-term, multi-task application scenarios for multi-element and continuous environment modeling. In the field of auto-driving, multi-level vector maps are widely used because they contain different types of data needed for the whole process of auto-driving. Now the collection, post-processing and verification of vector maps require a lot of computation and manual verification, which limits the range of application. The goal of our navigation system is to build a multi-level, multi-element and maintainable map.
3.2.1. Global Raw Point Cloud Map
A global map is the basis of navigation systems and is necessary for global path planning. In our navigation system, we chose to use SLAM methods to build global point cloud maps, such as LeGO-LOAM, hdl-graph-SLAM [40], and LIO-SAM. An optional method is to use real-time localization through RTK (Real-time kinematic) for laser scan stitching to build a global point cloud map. Then, appropriate downsampling is performed according to the application requirements and scenario. Subsequently, a static map, topological map, and grid map are all generated from the raw point cloud map.
3.2.2. Traverse Area Detection and Representation
The traverse area is derived from the raw point cloud scans, which is the basis of a grid map and topological map, and provides optional path planning ranges to ensure the security, reliability and rapidity of the overall navigation system. The traverse area detection in our system is processed in real time during the scanning of LiDAR. That is, when a laser scan frame is obtained, the point cloud of the ground is extracted from the frame in real time; then, the raw point cloud and the ground point cloud are stitched to generate the raw global map and map of the traverse area, respectively.
Although LiDAR can detect data a hundred meters away, points that are too far away become sparse and unreliable. So, we take the LiDAR position as the center, and draw a circular area of interest by distance, denoted as . Then, we organize and represent point cloud in by defining vertical bins, a process referred to as bin-wise organization. That is, we use bins to divide the point cloud into equal-interval azimuth angles and radial distances on the horizontal x-y plane, including points that can be projected vertically into their ranges, as shown in Figure 4a. Each bin is denoted as , as shown in Equation (1), where are the indexes according to radial distance and angular direction .
where , and represents the points in , and represent the maximum of , respectively. However, this method results in bins that are too small near the center of the area of interest and too few points in these bins, which may lead to subsequent misjudgments. So, we chose to increase the angle range of the inner circle sectors, as shown in Figure 4b.
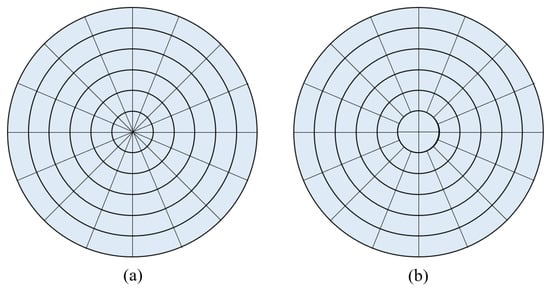
Figure 4.
Bin-wise organization of laser point cloud: (a) Division method according to the equal-interval azimuth angles and radial distances; (b) Adjusted division method.
In the park environment, the ground is not generally flat as a whole, so it is inappropriate to use uniform ground coefficients to describe the traversable area. Therefore, our system uses the method of regional ground plane fitting to detect the traversable area. Based on bin-wise organization, select the point with the lowest height (i.e., z value) in each bin. If its height is lower than the possible ground-level threshold (determined by the height of the LiDAR and actual environmental conditions), it may be a potential ground point, and take it as a seed point. Then, the flatness test of seed points is taken. The local ground surface can generally be regarded as a horizontal or slightly inclined plane, the changes of height and distance of the ground scan points in the small neighborhood should be nearly uniform, while the scanning point cloud of the road edge and the grass will change sharply or irregularly. Based on the above characteristic, on the same scan line of the seed point, take N points left and right of the seed point and then denote its neighborhood. Additionally, calculate the sum of the distances from the points in the neighborhood to the seed point. If the sum value is less than the set distance threshold and the height of the point is less than the set height threshold (the threshold takes a specific value after sorting all the points on the scan line where the seed point is located), then keep it; otherwise, discard it. Therefore, this step can exclude the edge of the road and grass point cloud, as shown in Figure 5.

Figure 5.
(a) Possible situation of real ground points. (b) Possible situation of grass points. (c) Possible situation of road edge points (where the big red circle is the tested scanning point, and the small red circles are its neighborhood points).
Let be the mean z value of the filtered seed points. The initial estimated ground points set is obtained as follows:
represents the z value of the scan point, and indicates the height margin. Then, we process the flatness test of the points in and discard points if they do not satisfy the smoothness criteria. If i-th inner points set is , then its covariance matrix can be calculated with the following Formula (3):
|·| represents the number of elements in the set, and represents the average position coordinates of . Then, a principal component analysis (PCA) is used to calculate its three eigenvectors, of which the normal vector with the smallest eigenvalue is most likely to be the normal vector representation of the ground. Denote that eigenvector as ; the plane equation can be obtained with the following formula:
Further, if the angle between the normal vector and the vertical direction is greater than , it will be considered as incorrectly fitted ground (i.e., traversable area), and point clouds in corresponding local areas will be regarded as non-ground points (i.e., non-traversable area).
3.2.3. Dynamic Point Cloud Detection and Removal
The conventional construction of a point cloud map is generally a sequential accumulation process of LiDAR scanning data. Therefore, dynamic objects such as pedestrians and vehicles will be included in the map which may cause interference for map-based localization and reasonable path planning [20]. According to the characteristics that dynamic objects in the park environment are inevitably in contact with the ground and the shortcomings of visibility-based methods in Figure 2, our method removes dynamic objects based on the vertical occupancy ratio [23], which does not depend on visibility and can effectively avoid the above drawbacks. The general process of this method is shown in Figure 6.

Figure 6.
The pipeline of dynamic objects removal algorithm.
It is assumed that the point cloud map is obtained by some methods and it may contain dynamic objects. Besides the map, the inputs also include laser scan data of the same or different terms, and it is assumed that the pose information corresponding to the scans can be accurately registered to the map. We define the original point cloud map as M, the laser scan data at a certain time t as , and the pose under the map coordinate system corresponding to is .
First, use to find the position of the LiDAR in the map at time t, and take this position as the center to extract the point cloud of the region of interest according to the horizontal 2D distance, which is denoted as . Similarly, in , the point cloud of the region of interest is extracted at the same distance with the LiDAR as the center, and is denoted as . Then, similarly to the operation of extracting the region of interest in the ground detection process, we take the LiDAR position as the center and use the definition of the vertical bin to organize and represent the point clouds of and . Each bin is denoted as ⊂ and ⊂ according to the angle and radial distance, as shown in Equation (1). On the basis of the above method of expression and organization, the vertical occupancy ratio (VOR) of each bin is defined as follows:
where points ∈, ∈. From the above definition, if there are static or no objects in the corresponding bin of the map and current scan, the VOR should be close to 1. For the case where there are no dynamic objects in the map but there are dynamic objects in the current scan, the VOR will be greater than 1. For the case where there are dynamic objects in the map but no dynamic objects in the current scan, the VOR of the corresponding bin should be significantly less than 1. Therefore, if the VOR is close to 1 or greater than 1, no additional operation on the map is required. If the VOR is obviously less than 1, the dynamic point cloud in the map needs to be removed.
However, deleting the point cloud of dynamic objects directly from bins results in vacant holes in the map. Therefore, we chose to perform a regional ground surface fitting in the corresponding bin ∈, to compensate for the static ground points for the vacant holes.
3.2.4. Topological Skeleton Extraction
The global topological map is constructed based on the grid map. First, the point cloud map of the traversed area without dynamic objects is projected into a global grid map. Instead of considering the height fluctuations of the ground and real-time dynamic objects factors, the traversable areas are directly projected to free grids, while other projections are occupied grids.
Then, we construct a distance function for the free grid, which is used to represent the distance between the free grid and the nearest occupied grid, and denote the corresponding distance as the distance value. In addition, based on the principle of the probabilistic road map, random sampling is carried out in this global grid map, and sample points located in the free area are denoted as . Areas located at intersections and covered by a large traversable area will have a greater sampling probability, which ensures the efficiency of generating sampling points. For each sample grid , centered on itself, a local grid submap of L × L size is intercepted, and is denoted as . In , update the original to the free grid with the largest distance value. Then, the construction of a probabilistic road map is based on the updated sample points set, i.e., build connections and perform collision-free detection on the sample points. Finally, the topological skeleton representation of the global traverse area is obtained, and we use it for global planner navigation.
3.2.5. Middle Map Construction
Based on the x-y plane, the global point cloud map is divided into 30 m × 30 m square areas that are connected and non-intersecting. In order to make the path planning reasonable and forward-looking, we construct the local submap in the navigation process as follows: First, we obtain the current position information of the mobile platform through the localization algorithm, and derive which square area the current position is located in with the lookup table method. Next, take the square area currently located at the center and obtain its eight-neighborhood square areas in the global map to form a 3 × 3 array, as shown in Figure 7a. The array of these nine square areas is used as the current submap for navigation. In addition, as the mobile platform moves, if the current located square area changes, the submap is updated accordingly with this new square area at the center, as shown in Figure 7b.
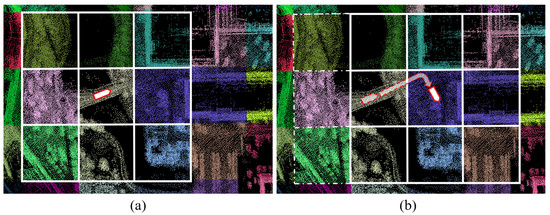
Figure 7.
Point cloud map segmentation: (a) Submap before moving. (b) Submap after moving.
After dividing the point cloud map, project the appropriate submaps to grid submaps. The resolution of the grid is comprehensively determined by the environmental conditions, the task accuracy requirements, the volume, and the flexibility of the mobile platform. In addition, in the park environment, the ground height is not consistent in macro. Therefore, it is inappropriate to directly calculate the occupancy probability of the grid according to the altitude information of the point cloud. To solve this problem, we choose to take the ground plane coefficients information into consider for each grid. That is, for each grid, if the grid contains a traversable ground point cloud, the method in Section 3.2.2 will be used to obtain ground coefficients, and the relative height is obtained by subtracting the corresponding local ground height from the original height of points in the grid. Then, the occupancy probability is calculated using the relative height. For the grid without ground points, it is directly set to the occupied state. If the point cloud in a grid is denoted as , the relative height of is denoted as (); then, the calculation formula of the occupancy probability of the grid is as follows:
and above are fixed height interval parameters. In order to reduce the interference of tree branches and roofs, we usually filter out points above a certain height before calculating .
In addition, our system uses the form of a 2.5D map to describe the grid map. The information in each grid includes the occupancy probability, ground coefficients, and distribution of point cloud in the grid which is fitted into a three-dimensional Gaussian function.
Moreover, for the middle planner navigation module, if the destination target is not within the current submap range, the last target point based on the current local submap should be on the boundary of the submap.
3.2.6. Local Map Maintenance
Static and invariant local maps represent the infrastructure information of the environment. However, they cannot reflect real-time dynamic changes, such as pedestrians, vehicles and static obstacles that newly appear or disappear. Therefore, we need to update and maintain local maps based on real-time observations. We can obtain real-time point cloud distribution which is fitted into a three-dimensional Gaussian function, and calculate the occupancy probability of grids in grid submap at the current time according to the laser scan information. Based on the 2.5D description form of the grid map, an information layer representing the real-time state is established, and the information of distribution and occupancy probability is updated into it. Moreover, the current occupancy probability takes precedence over the original occupancy probability in the navigation module.
3.3. The Planning Module
As an important part of the navigation system, path planning uses the existing map’s prior information or real-time sensor data to plan a safe, short and smooth path for the vehicle to reach the goal area or goal point. As shown in Figure 8, our planning module is divided into three sub-modules, namely the global planner, middle planner and local planner. The global planner roughly plans a passable path in the entire campus, which consists of several waypoints. The middle planner plans between the two waypoints planned by the global planner, and obtains a smooth path that conforms to the vehicle dynamics constraints. The local planner executes the path planned by the middle planner, avoiding local obstacles and re-planning when necessary.
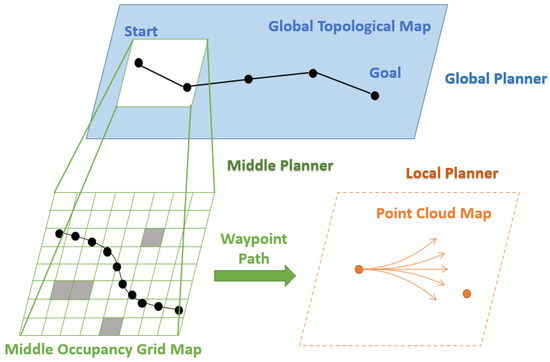
Figure 8.
Planning Framework.
The motion planning methods for mobile robots in dynamic environments include sampling-based methods and trajectory optimization-based methods. The basic idea of the sampling-based method is to perform random sampling in the workspace or configuration space to find a collision-free trajectory connecting the starting point and the target point. The random sampling motion planning does not need to model the environment, but sacrifices completeness and optimality.
The method based on trajectory optimization has high computational complexity and requires high control accuracy of the robot. Therefore, we construct a motion control method based on kinematic elements and incorporate the nonholonomic kinematic constraints of the mobile platform into it. The mobile platform can stably avoid obstacles and approach the target point under the guidance of motion elements.
3.3.1. Global Planner
The main function of the global planner is to accept the manually input target point and plan a feasible path for the vehicle to reach the target point in the global map. The global planner combines the global topology map and the traverse area to set up some waypoints in the global map.
As one of the classic graph-search algorithms, A* has good performance and accuracy. It uses heuristic information to find the optimal path, which is suitable for the path-planning algorithm as the topmost layer in the waypoint graph. Since the global planner uses the waypoint map jointly processed by the PRM and the distance map, it can find a near-optimal global path faster. A flow chart demonstrating the process from the setting up of the global target point to the completion of the path is provided in Figure 9.

Figure 9.
Global planning flowchart.
The map used by the global planner is maintained and updated for a long time. When a global target point is obtained, the global planner determines connectivity in the waypoint graph. If it is connected in the waypoint map, it will directly find a feasible path and hand it over to the local planner for execution. Otherwise, it will actively explore and generate new waypoints; if it is really unreachable, it will return relevant information.
3.3.2. Middle Planner
The Hybrid A* algorithm is a graph-search algorithm that improves on the A* algorithm. As shown in Figure 10, the difference from the ordinary A* algorithm is that the path planned by Hybrid A* considers the kinematic constraints of the vehicle, that is, it satisfies the maximum curvature constraint of the vehicle. The heuristic function is crucial to the search efficiency of the A* algorithm, and it is crucial to study reasonable and effective heuristics to estimate the cost of expanding nodes to the target point. In the Hybrid A* algorithm, the heuristic function is divided into two types: the non-integrity constraint heuristic cost without obstacles and the integrity heuristic cost with obstacles.
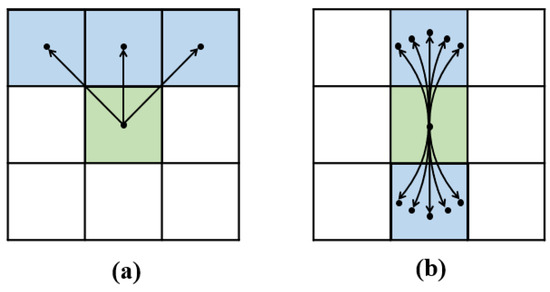
Figure 10.
Node expansion diagram: (a) A* node expansion; (b) hybrid A* node expansion.
In the middle planner, the pose information of the current vehicle and the grid map for path planning are received from the localization module, and the waypoint information is received from the global planner. Waypoint information contains a series of local target points planned by the global planner. The search space of Hybrid A* not only considers the expansion in the x and y directions, but also considers the exploration in different angles. Compared with the exploration space of ordinary A*, the node expansion of Hybrid A* is three-dimensional. In the front and rear directions, the middle planner plans five paths divided by equal angles. Since we need to consider the kinematic constraints of the vehicle, we use the Reeds–Shepp curve.
In a middle-level path-planning process, the current position of the mobile robot, the local grid map and the local goal points in the waypoint information are used as the input of the algorithm. By comparing the size of the cost value h1 of the nonholonomic constraint heuristic cost without obstacles and the cost value h2 of the completeness heuristic cost with obstacles, the larger cost is selected as the cost value of Hybrid A* h(n) = max(h1, h2). The planner will select the path with the lowest cost, split the path into waypoints and publish them to the local planner.
3.3.3. Local Planner
The local planner subscribes to the waypoint information published by the middle planner, and plans the waypoints as local target points in turn. The local planner is mainly composed of the following four parts:
- Free Path: The free path uses the sampled discrete points for forward simulation, which represents the possible movement of the vehicle in the future. As shown in Figure 11, through multiple data uniform interpolation and data fitting, 729 possible paths are planned as candidates;
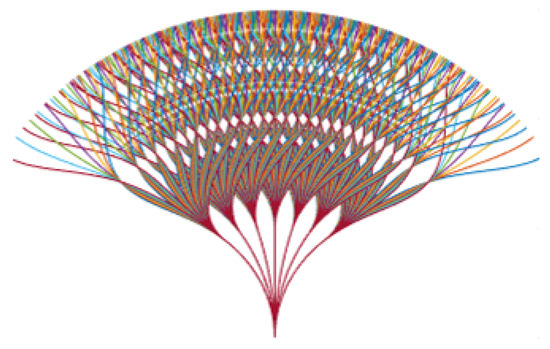 Figure 11. Generation results of sampling-based Free path.
 - Voxel Grid: For collision checking, the local planner uses a voxel grid with Free Path overlaid. Considering the occlusion of the vehicle radius, the voxel grid is generated within a certain range according to the spline distance;
- Collision Detection: After the voxel grid is generated, in order to be more efficient in the screening of local paths, each grid and path index are calculated offline. By finding neighbors within a specified distance around a waypoint in a set of paths that belong to a set of voxel grids. Finally, the index relationship table between each voxel grid and the feasible path are obtained.
- Path Filtering: First, the planner will filter the blocked paths, which can be achieved by using the index relationship table. From the remaining paths, set up a cost function based on the point cloud height between the ground threshold and the obstacle threshold. At the same time, the angle difference between each path and the target point and the angle difference between the direction of the path and the current vehicle orientation are used to calculate the cost.
4. Experiment
4.1. Traverse Area Detection
As described in Section 3.3.2, our traverse area detection algorithm is real-time. That is, we extract the ground points from the laser point cloud of each frame (or key frame for the SLAM method) during the mapping process. We use the laser scan frames collected in the park environment as the testing data. The experimental results are shown in Figure 12. The results show that our algorithm performs effective and robust ground point cloud detection in the presence of vehicles, trees and fences. The segmentation effect is satisfactory. In order to show the generalization of our method, we not only used VLP-16 LiDAR to collect data in the campus environment as shown in Figure 12a for experiments. The point cloud in KITTI dataset collected by 64-line LiDAR was also tested, as shown in Figure 12b.
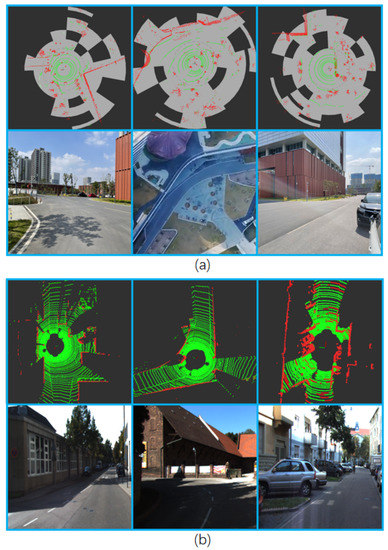
Figure 12.
Results of traverse area detection experiment: The upper part of (a,b) is the segmented point cloud (the green part is the divided ground point cloud, the red part is the non-ground point cloud, and the gray part represents the bins described in Section 3.2.2), and the lower part is the corresponding picture.
4.2. Dynamic Detection and Removal
In the original point cloud map, there will inevitably be dynamic objects. Furthermore, the trajectory of dynamic objects will accumulate in the map along with the construction process. As shown in Figure 13, in addition to the environmental structures of ground and walls, there are dynamic objects—walking people (red points in right part of Figure 13), as well as static objects—pillar buildings. We use the method in Section 3.2.3 to remove dynamic objects without affecting the static part of the environment.
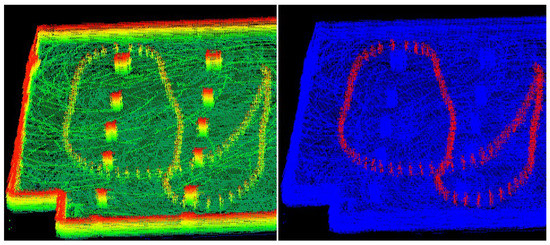
Figure 13.
(Left) Part of the original point cloud map. (Right) Annotations of dynamic objects (red points) and static parts (blue points) in the map.
During dynamic object detection, the extracted region of interest (black point cloud in the figure) and the resolved dynamic object (red point cloud in the figure) are shown in Figure 14.

Figure 14.
Discrimination of dynamic objects (red points) in the region of interest (black points).
After distinguishing the dynamic objects and the static parts, we remove the dynamic point cloud. The resultant static point cloud map of the environment we obtained is shown in Figure 15. In addition, because our algorithm performs regional ground plane fitting on the corresponding region of dynamic points suppression to compensate for the mistakenly deleted ground points, we can see that there are no vacant holes in the static map.
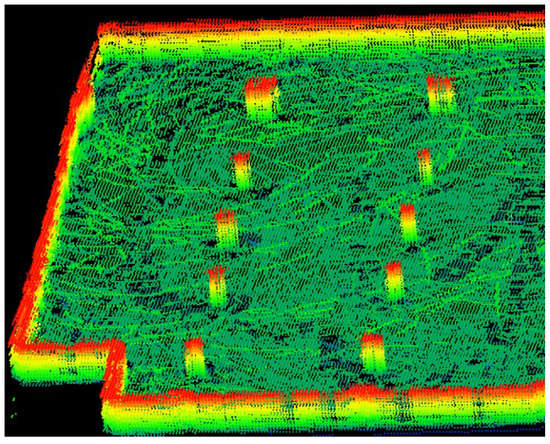
Figure 15.
The static point cloud map.
4.3. Planning Results
We divide the global static point cloud map into fixed size local submaps according to the method in Section 3.2.4. The result is shown in Figure 16, and we represent each submap with a different colored point cloud for clarity.

Figure 16.
Map segmentation result: global (left) and local (right) perspectives.
For the path planning algorithm, we design two experiments to verify the effectiveness of the planning algorithm. The first experiment is for the global planner, and the second experiment is for the middle planner. Taking the entire campus map as input, through random sampling and iterative optimization combined with the distance map, we generated the topology map, which is shown in Figure 17. The red dots in the figure are the sampling points, which represents the nodes in the topology graph. The red line segment represents the feasible path. An optimization function using distance as a penalty factor converges the path to the position farthest from surrounding obstacles. Based on this topology map, the global planner will plan a path from the start point to the goal point.
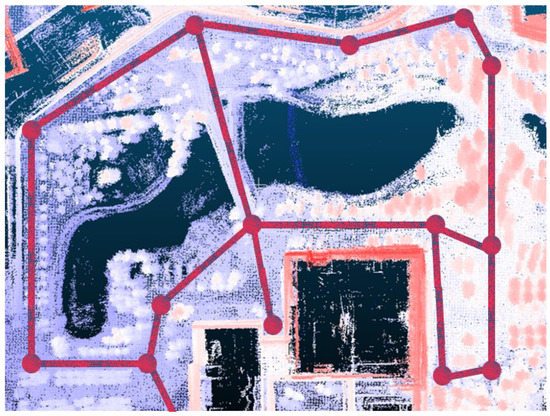
Figure 17.
Global topology map in the park environment.
The middle planner is based on the grid map, and plans a local passable path according to the information such as the occupancy of the grid. In the garage scene where many pillars exist, we set the start and end points through the global planner. The middle planner uses the hybrid A* algorithm and uses the Euclidean distance as the cost estimate in the heuristic search to plan an unobstructed path. As shown in Figure 18, the blue point is the starting point, the red point is the ending point, and the green point is the path planned by the middle planner. The result of path planning is evaluated according to the following three parts: distance from obstacles, length of path, and maximum corner of path.
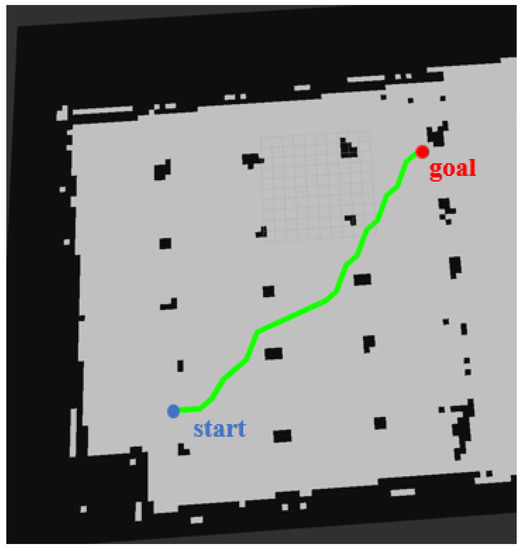
Figure 18.
The path planned by the middle planner.
4.4. Dynamic Obstacle Avodiance
In order to test the dynamic obstacle avoidance ability of the navigation algorithm, we arrange pedestrians to actively block the driving path of vehicles. As shown in Figure 19, the vehicle is driving in a straight line in the current lane, with the driving direction of the vehicle as the front, and a pedestrian in the left front is walking perpendicular to the driving direction of the vehicle. The red and blue arrows represent the movement directions of pedestrians and vehicles, respectively.
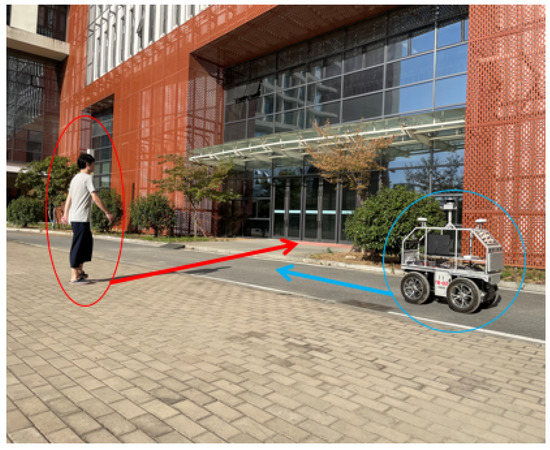
Figure 19.
The stage when the vehicle and the pedestrian are far apart.
Pedestrians will block the vehicle’s forward path as much as possible to verify the dynamic obstacle avoidance ability. When the navigation system determines that there are dynamic obstacles blocking the path, it will update the path in time, which is implemented on the local planner. As shown in Figure 20, when a pedestrian moves in front of the car, the vehicle obviously has a deflection angle to the left, and it can avoid colliding with the pedestrian by turning.
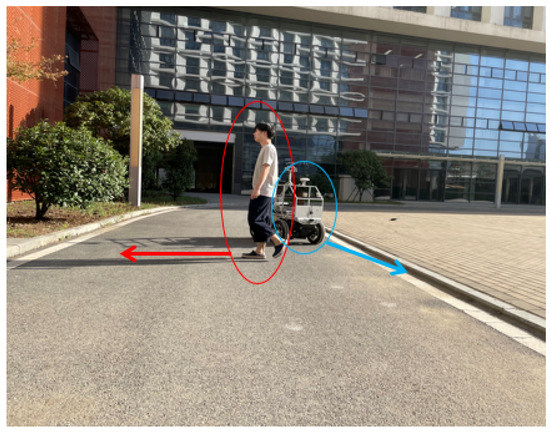
Figure 20.
The stage when the vehicle and pedestrian approach each other.
As shown in Figure 21, since the local planner only re-plans in a local area, after bypassing pedestrians, the vehicle will still return to the path planned by the middle planner to continue driving. When the feasibility of the middle planning path cannot be guaranteed, the local optimal path is used as the current travel path.
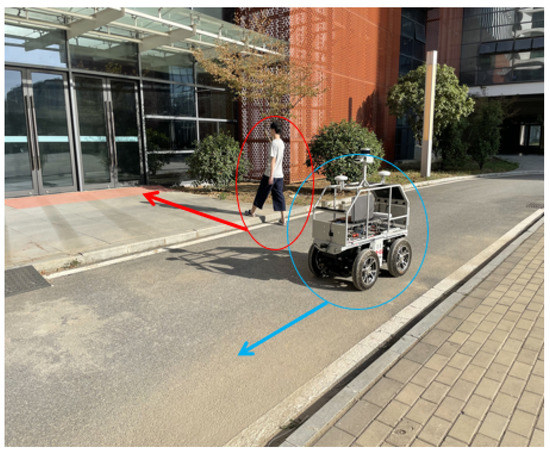
Figure 21.
The stage after the vehicle actively avoids pedestrians.
As shown in Figure 22, it shows the dynamic obstacle avoidance capability in other scenarios in the park.

Figure 22.
Dynamic obstacle avoidance in the park scene: (a) when the robot is far away from pedestrians; (b) the robot avoids pedestrians; (c) the robot continues to perform navigation tasks.
5. Conclusions
We propose an LiDAR-only ground vehicle navigation system for park environments. Through hierarchical design, our system can achieve smooth navigation both globally and locally. The global map and planner provide road information and traversable paths of the entire park. The middle-level map and planner are responsible for local map maintenance and local path planning, and the bottom-level planner combines real-time perception information with complete dynamic obstacle avoidance. We have completed multiple validation experiments in real park environments, and the experimental results demonstrate that our system can perform reliable and robust navigation in real scenarios.
Author Contributions
Conceptualization, K.W., J.L., M.X., Z.C. and J.W.; data curation, J.L.; formal analysis, M.X. and Z.C.; funding acquisition, J.W.; investigation, J.W.; methodology, K.W., J.L., M.X. and J.W.; project administration, Z.C. and J.W.; software, K.W. and J.L.; supervision, J.W.; validation, K.W. and Z.C.; visualization, K.W. and M.X.; writing—original draft, K.W. and J.L.; writing—review and editing, Z.C. and J.W. All authors have read and agreed to the published version of the manuscript.
Funding
This work was funded by the National Natural Science Foundation of China, grant number 62103393.
Data Availability Statement
Not applicable.
Conflicts of Interest
The authors declare no conflict of interest.
References
- Gupta, S.; Tolani, V.; Davidson, J.; Levine, S.; Sukthankar, R.; Malik, J. Cognitive Mapping and Planning for Visual Navigation. arXiv 2017, arXiv:1702.03920. [Google Scholar] [CrossRef]
- Zhu, W.; Qi, Y.; Narayana, P.; Sone, K.; Basu, S.; Wang, X.E.; Wu, Q.; Eckstein, M.; Wang, W.Y. Diagnosing Vision-and-Language Navigation: What Really Matters. arXiv 2021, arXiv:2103.16561. [Google Scholar] [CrossRef]
- An, D.; Qi, Y.; Huang, Y.; Wu, Q.; Wang, L.; Tan, T. Neighbor-view Enhanced Model for Vision and Language Navigation. arXiv 2021, arXiv:2107.07201. [Google Scholar] [CrossRef]
- Qi, Y.; Wu, Q.; Anderson, P.; Wang, X.; Wang, W.Y.; Shen, C.; Hengel, A. REVERIE: Remote Embodied Visual Referring Expression in Real Indoor Environments. arXiv 2019, arXiv:1904.10151. [Google Scholar] [CrossRef]
- Qi, Y.; Pan, Z.; Hong, Y.; Yang, M.H.; Hengel, A.; Wu, Q. The Road to Know-Where: An Object-and-Room Informed Sequential BERT for Indoor Vision-Language Navigation. arXiv 2021, arXiv:2104.04167. [Google Scholar] [CrossRef]
- Shan, T.; Wang, J.; Englot, B.J.; Doherty, K. Bayesian Generalized Kernel Inference for Terrain Traversability Mapping. In Proceedings of the Conference on Robot Learning, Zürich, Switzerland, 29–31 October 2018. [Google Scholar]
- Cao, C.; Zhu, H.; Yang, F.; Xia, Y.; Choset, H.; Oh, J.; Zhang, J. Autonomous exploration development environment and the planning algorithms. In Proceedings of the 2022 International Conference on Robotics and Automation (ICRA), Philadelphia, PA, USA, 23–27 May 2022; pp. 8921–8928. [Google Scholar]
- Zhu, H.; Cao, C.; Xia, Y.; Scherer, S.; Zhang, J.; Wang, W. DSVP: Dual-Stage Viewpoint Planner for Rapid Exploration by Dynamic Expansion. In Proceedings of the 2021 IEEE/RSJ International Conference on Intelligent Robots and Systems (IROS), Prague, Czech Republic, 25–29 October 2021; pp. 7623–7630. [Google Scholar] [CrossRef]
- Cao, C.; Zhu, H.; Choset, H.; Zhang, J. TARE: A Hierarchical Framework for Efficiently Exploring Complex 3D Environments. In Proceedings of the Robotics: Science and Systems, New York, NY, USA, 27 June–1 July 2021. [Google Scholar]
- Cao, C.; Zhu, H.; Choset, H.; Zhang, J. Exploring Large and Complex Environments Fast and Efficiently. In Proceedings of the IEEE International Conference on Robotics and Automation, Xi’an, China, 30 May–5 June 2021. [Google Scholar]
- Yang, F.; Cao, C.; Zhu, H.; Oh, J.; Zhang, J. FAR planner: Fast, attemptable route planner using dynamic visibility update. arXiv 2021, arXiv:2110.09460. [Google Scholar]
- Wang, J.; Xu, M.; Foroughi, F.; Dai, D.; Chen, Z. Fastergicp: Acceptance-rejection sampling based 3d lidar odometry. IEEE Robot. Autom. Lett. 2021, 7, 255–262. [Google Scholar] [CrossRef]
- Vallet, J. GPS/IMU and LiDAR integration to aerial photogrammetry: Development and practical experiences with Helimap System. Vorträge Dreiländertagung 2007, 27, 1–10. [Google Scholar]
- Yan, W.Y.; Shaker, A.; El-Ashmawy, N. Urban land cover classification using airborne LiDAR data: A review. Remote. Sens. Environ. 2015, 158, 295–310. [Google Scholar] [CrossRef]
- Luo, J.; Yan, B.; Wood, K. InnoGPS for data-driven exploration of design opportunities and directions: The case of Google driverless car project. J. Mech. Des. 2017, 139, 111416. [Google Scholar] [CrossRef]
- Ji, Z.; Singh, S. LOAM: Lidar Odometry and Mapping in Real-time. In Proceedings of the Robotics: Science and Systems Conference, Berkeley, CA, USA, 12–16 July 2014. [Google Scholar]
- Shan, T.; Englot, B. LeGO-LOAM: Lightweight and Ground-Optimized Lidar Odometry and Mapping on Variable Terrain. In Proceedings of the 2018 IEEE/RSJ International Conference on Intelligent Robots and Systems (IROS), Madrid, Spain, 1–5 October 2018. [Google Scholar]
- Shan, T.; Englot, B.; Meyers, D.; Wang, W.; Ratti, C.; Rus, D. Lio-sam: Tightly-coupled lidar inertial odometry via smoothing and mapping. In Proceedings of the 2020 IEEE/RSJ International Conference on Intelligent Robots and Systems (IROS), Las Vegas, NV, USA, 24 October–24 January 2020; pp. 5135–5142. [Google Scholar]
- Fankhauser, P.; Hutter, M. A Universal Grid Map Library: Implementation and Use Case for Rough Terrain Navigation; Springer: Berlin/Heidelberg, Germany, 2016. [Google Scholar]
- Kim, G.; Kim, A. Remove, then Revert: Static Point cloud Map Construction using Multiresolution Range Images. In Proceedings of the 2020 IEEE/RSJ International Conference on Intelligent Robots and Systems (IROS), Las Vegas, NA, USA, 25–29 October 2020. [Google Scholar]
- Yoon, D.; Tang, T.; Barfoot, T. Mapless Online Detection of Dynamic Objects in 3D Lidar. In Proceedings of the Canadian Conference on Computer and Robot Vision, Ingston, QC, Canada, 29–31 May 2019. [Google Scholar]
- Schauer, J.; Nuechter, A. The Peopleremover—Removing Dynamic Objects From 3-D Point Cloud Data by Traversing a Voxel Occupancy Grid. IEEE Robot. Autom. Lett. 2018, 3, 1679–1686. [Google Scholar] [CrossRef]
- Lim, H.; Hwang, S.; Myung, H. ERASOR: Egocentric Ratio of Pseudo Occupancy-based Dynamic Object Removal for Static 3D Point Cloud Map Building. IEEE Robot. Autom. Lett. 2021, 6, 2272–2279. [Google Scholar] [CrossRef]
- Jiang, S.; Qi, Y.; Zhang, H.; Bai, Z.; Lu, X.; Wang, P. D3D: Dual 3-D Convolutional Network for Real-Time Action Recognition. IEEE Trans. Ind. Inform. 2021, 17, 4584–4593. [Google Scholar] [CrossRef]
- Qi, Y.; Qin, L.; Zhang, S.; Qing, M.; Yao, H. Robust visual tracking via scale-and-state-awareness. Neurocomputing 2021, 329, 75–85. [Google Scholar] [CrossRef]
- Yang, Y.; Li, G.; Qi, Y.; Huang, Q. Release the Power of Online-Training for Robust Visual Tracking. In Proceedings of the AAAI Conference on Artificial Intelligence, New York, NY, USA, 7–12 February 2020; Volume 34, pp. 12645–12652. [Google Scholar] [CrossRef]
- Voigtlaender, P.; Luiten, J.; Torr, P.H.S.; Leibe, B. Siam R-CNN: Visual Tracking by Re-Detection. arXiv 2019, arXiv:1911.12836. [Google Scholar] [CrossRef]
- Wu, Q.; Wang, P.; Wang, X.; He, X.; Zhu, W. Visual Question Answering—From Theory to Application; Advances in Computer Vision and Pattern Recognition; Springer: Berlin/Heidelberg, Germany, 2022. [Google Scholar] [CrossRef]
- Shi, S.; Wang, X.; Li, H. PointRCNN: 3D Object Proposal Generation and Detection From Point Cloud. In Proceedings of the 2019 IEEE/CVF Conference on Computer Vision and Pattern Recognition (CVPR), Long Beach, CA, USA, 15–20 June 2019; pp. 770–779. [Google Scholar] [CrossRef]
- Lang, A.H.; Vora, S.; Caesar, H.; Zhou, L.; Yang, J.; Beijbom, O. PointPillars: Fast Encoders for Object Detection From Point Clouds. In Proceedings of the 2019 IEEE/CVF Conference on Computer Vision and Pattern Recognition (CVPR), Long Beach, CA, USA, 15–20 June 2019; pp. 12689–12697. [Google Scholar] [CrossRef]
- Zhou, Y.; Tuzel, O. VoxelNet: End-to-End Learning for Point Cloud Based 3D Object Detection. In Proceedings of the 2018 IEEE/CVF Conference on Computer Vision and Pattern Recognition, Salt Lake City, UT, USA, 18–22 June 2018; pp. 4490–4499. [Google Scholar] [CrossRef]
- Mendes, A.; Bento, L.; Nunes, U. Multi-target detection and tracking with a laser scanner. In Proceedings of the IEEE Intelligent Vehicles Symposium, Parma, Italy, 14–17 June 2004; pp. 796–801. [Google Scholar] [CrossRef]
- Dijkstrae, W. A note on two problems in connexion with graphs. Numer. Math. 1959, 1, 269–271. [Google Scholar] [CrossRef]
- Hart, P.E.; Nilsson, N.J.; Raphael, B. A Formal Basis for the Heuristic Determination of Minimum Cost Paths. IEEE Trans. Syst. Sci. Cybern. 2007, 4, 100–107. [Google Scholar] [CrossRef]
- LaValle, S.M.; Kuffner, J.J., Jr. Randomized kinodynamic planning. Int. J. Robot. Res. 2001, 20, 378–400. [Google Scholar] [CrossRef]
- Karaman, S.; Frazzoli, E. Sampling-based algorithms for optimal motion planning. Int. J. Robot. Res. 2011, 30, 846–894. [Google Scholar] [CrossRef]
- Hernández, J.; Moll, M.; Vidal, E.; Carreras, M.; Kavraki, L.E. Planning feasible and safe paths online for autonomous underwater vehicles in unknown environments. In Proceedings of the IEEE/RSJ International Conference on Intelligent Robots and Systems, Daejeon, Korea, 9–14 October 2016. [Google Scholar]
- Liu, Z.; Chen, B.; Zhou, H.; Koushik, G.; Hebert, M.; Zhao, D. Mapper: Multi-agent path planning with evolutionary reinforcement learning in mixed dynamic environments. In Proceedings of the 2020 IEEE/RSJ International Conference on Intelligent Robots and Systems (IROS), Las Vegas, NV, USA, 25–29 October 2020; pp. 11748–11754. [Google Scholar]
- Peltzer, O.; Bouman, A.; Kim, S.K.; Senanayake, R.; Ott, J.; Delecki, H.; Sobue, M.; Kochenderfer, M.; Schwager, M.; Burdick, J.; et al. FIG-OP: Exploring Large-Scale Unknown Environments on a Fixed Time Budget. arXiv 2022, arXiv:2203.06316. [Google Scholar]
- Koide, K. A Portable 3D LIDAR-based System for Long-term and Wide-area People Behavior Measurement. Int. J. Adv. Robot. Syst. 2019, 16, 1–16. [Google Scholar] [CrossRef]
Publisher’s Note: MDPI stays neutral with regard to jurisdictional claims in published maps and institutional affiliations. |
© 2022 by the authors. Licensee MDPI, Basel, Switzerland. This article is an open access article distributed under the terms and conditions of the Creative Commons Attribution (CC BY) license (https://creativecommons.org/licenses/by/4.0/).