Article

Optimal Planning of Electric Vehicle Charging Station Considering Mutual Benefit of Users and Power Grid

1
School of Automation, Wuhan University of Technology, Wuhan 430070, China
2
Shenzhen Research Institute, Wuhan University of Technology, Shenzhen 518000, China
3
State Grid Zhejiang Electric Power Research Institute, Hangzhou 310014, China
*
Author to whom correspondence should be addressed.
World Electr. Veh. J. 2021, 12(4), 244; https://doi.org/10.3390/wevj12040244
Submission received: 12 October 2021 / Revised: 9 November 2021 / Accepted: 11 November 2021 / Published: 15 November 2021

Abstract

:
A reasonable plan for charging stations is critical to the widespread use of electric vehicles. In this paper, we propose an optimal planning method for electric vehicle charging stations. First of all, we put forward a forecasting method for the distribution of electric vehicle fast charging demand in urban areas. Next, a new mathematical model that considers the mutual benefit of electric vehicle users and the power grid is set up, aiming to minimize the social cost of charging stations. Then, the model is solved by the Voronoi diagram combined with improved particle swarm optimization. In the end, the proposed method is applied to an urban area, simulation results demonstrate that the proposed method can yield optimal location and capacity of each charging station. A contrasting case is carried out to verify that improved particle swarm optimization is more effective in finding the global optimal solution than particle swarm optimization.

1. Introduction

As an essential part of the electric vehicle (EV) industry, charging stations have a great influence on the users’ tendency to use EVs [1]. A well-chosen location and capacity plan for charging stations can not only lower the cost of investment and reduce the risks of power grid, but also provide EV users with convenient charging services [2].
Recently, research on the planning of EV charging stations are growing rapidly. The objectives of these studies can be gathered into two groups: (i) minimization of planning costs; (ii) meeting charging demands. With the objective of minimizing planning costs, [3,4] mainly considered the construction cost of charging station and put forward a location and capacity planning strategy of charging station. Reference [5] set up an optimal planning model of charging station to minimize the sum of construction cost and network loss cost. Reference [6] addressed an integrated planning model for the optimal sizing and allocation of the fast charging stations to minimize the annual investment cost. Based on the theory of life cycle cost, [7] established a minimum life cycle cost model which included investment cost, operation cost, maintenance cost, failure cost, and scrap cost of charging stations. However, the studies mentioned above have not considered the benefits of users. As for the researches focusing on meeting charging demands, [8] determined the optimal layout for charging infrastructures by considering actual vehicle usage data and the estimated charging demand of different areas. Reference [9] established a double-layer location choosing model by taking EV users’ charging demand into account. References [10,11] investigated EV users’ charging characters to find out the optimal charging station construction plan. Reference [12] considered the incentive-based charging demand response procedure and introduced the reward and punishment mechanism into the research of location and capacity selection of charging stations. However, the division of charging stations’ service areas has not been well studied in these studies.
To sum up, most of the existing studies on planning of electric vehicle charging stations have ignored the benefits of users and the division of charging station’s service area. In addition, these studies mainly use particle swarm optimization (PSO) to solve the model, but PSO is not so effective in finding the global optimal solution [13]. Compared with the existing works, the main contributions of this paper can be summarized as follows:
(1)
An optimal electric vehicle charging station location and capacity model is proposed, which considers the mutual benefit of users and the power grid.
(2)
Based on the Voronoi diagram and improved particle swarm optimization (IPSO), a solution model is developed to determine location, capacity, and service area of each charging station. The remainder of this paper is organized as follows. Section 2 presents the forecasting model of EV’s fast charging demand. Section 3 presents the location and capacity model of EV charging stations. Section 4 gives the solution method. Section 5 conducts case studies to verify the effectiveness of the proposed method. Section 6 summarizes the paper.

2. Forecasting of EV’s Fast Charging Demand

Vehicles are mainly distributed in residential, commercial, and office areas in the city. Daily power load can reflect the consumption level and the EV purchasing power of each area to some degree [14]. Therefore, the number of EVs in each area can be forecasted by the daily power load. It can be supposed that most EV users recharge their batteries through slow charging piles, while a small proportion of EV users prefer fast charging and need to go to the charging station. Set the geometric center point of each area as a fast charging demand point. The total number of EVs in the planning area is n a , then the number of EVs at fast charging demand point j [15] is
n j = α P j P n a j J C N
where n j is the number of EVs at fast charging demand point j . α is the ratio of fast charging. P j is the power load of fast charging demand point j . P is the total power load in the planning area. J C N is the set of fast charging demand points.

3. Location and Capacity Model

Based on the prediction of EV fast charging demand distribution, we propose a location and capacity model of EV charging station.

3.1. Location Model

This paper aims at minimizing the sum of the construction and operation cost of charging station, the loss cost of EV users on the way to the charging station, the network loss cost of power grid [16,17]. The objective function is
min F cos t = F 1 + F 2 + F 3
F 1 = i J C S f C S N i r 0 1 + r 0 z 1 + r 0 z 1 + u C S N i
F 2 = 365 a p i J C S j J C N i n j λ i j d i j
F 3 = 365 p T M i C C u + C F e + N i C L + C W
f C S N i = W + q N i + e N i 2
N i . min N i N i . max i J C S
λ i j d i j d max i J C S , j J C N i
λ i j D i j D min i , j J C S ; i j
where F cos t is the annual social cost of the charging station. F 1 is the annual construction and operation cost of the charging station. F 2 is the annual loss cost of EV users on the way to the charging station. F 3 is the annual network loss cost of power grid. J C S is the set of charging stations. f C S N i is the construction cost function of charging station i . N i is the number of chargers in the charging station i . r 0 is the discount rate. z is the depreciation life of the charging station. u C S N i is the operation cost function of charging station i , which can be valued according to a certain percentage of the construction cost. W is the basic investment, which includes the initial construction cost and land purchase cost of the charging station. q is the price of a charger. e is the auxiliary investment coefficient of a charger. a is the amount of electricity consumed by EV to travel one kilometer. p is the charging price of EV. J C N i is the collection of fast charging demand points located in the service area of charging station i . λ i j is the zigzag coefficient of the road between charging station i and fast charging demand point j . d i j is the linear space distance between charging station i and fast charging demand point j . T is the daily work time of charging station. M i is the number of transformers in charging station i . C C u and C F e are copper loss and iron loss converted to a transformer, respectively. C L and C W are the line loss and charging loss converted to a charger, respectively. Equation (7) is the constraint on the number of chargers in charging station, N i . min and N i . max are the minimum and maximum number of chargers in charging station i , respectively. Equation (8) is the constraint on the maximum distance between charging station and fast charging demand point. d max is the maximum distance between charging station and fast charging demand point. Equation (9) is the constraint on the minimum distance between charging stations. D i j is the linear distance between charging station i and j . D min is the minimum distance between charging stations.

3.2. Capacity Model

The number of chargers in the charging station is not only related to the number of the EVs with fast charging demand in charging station’s service area, but also to the number of the EVs in a queue that users can accept when they are waiting in the charging station [15]. The number of chargers in the charging station can be calculated as
N i = μ i j J C N i n j n s i J C S
where μ i is the probability of EV users arriving at the charging station i at the same time. n s is the number of EVs in a queue that can be accepted by EV users.

4. Solution of Model

Considering that the EV charging station location and capacity model contains many variables such as the location of charging station, the distance between the fast charging demand points and the charging station, and the number of chargers in the charging station, among others. It is difficult to solve the model by using conventional methods. Therefore, we use IPSO [18] combined with Voronoi diagram [19] to solve the model. The solving process is shown in Figure 1.
The solving process is mainly divided into the following steps:
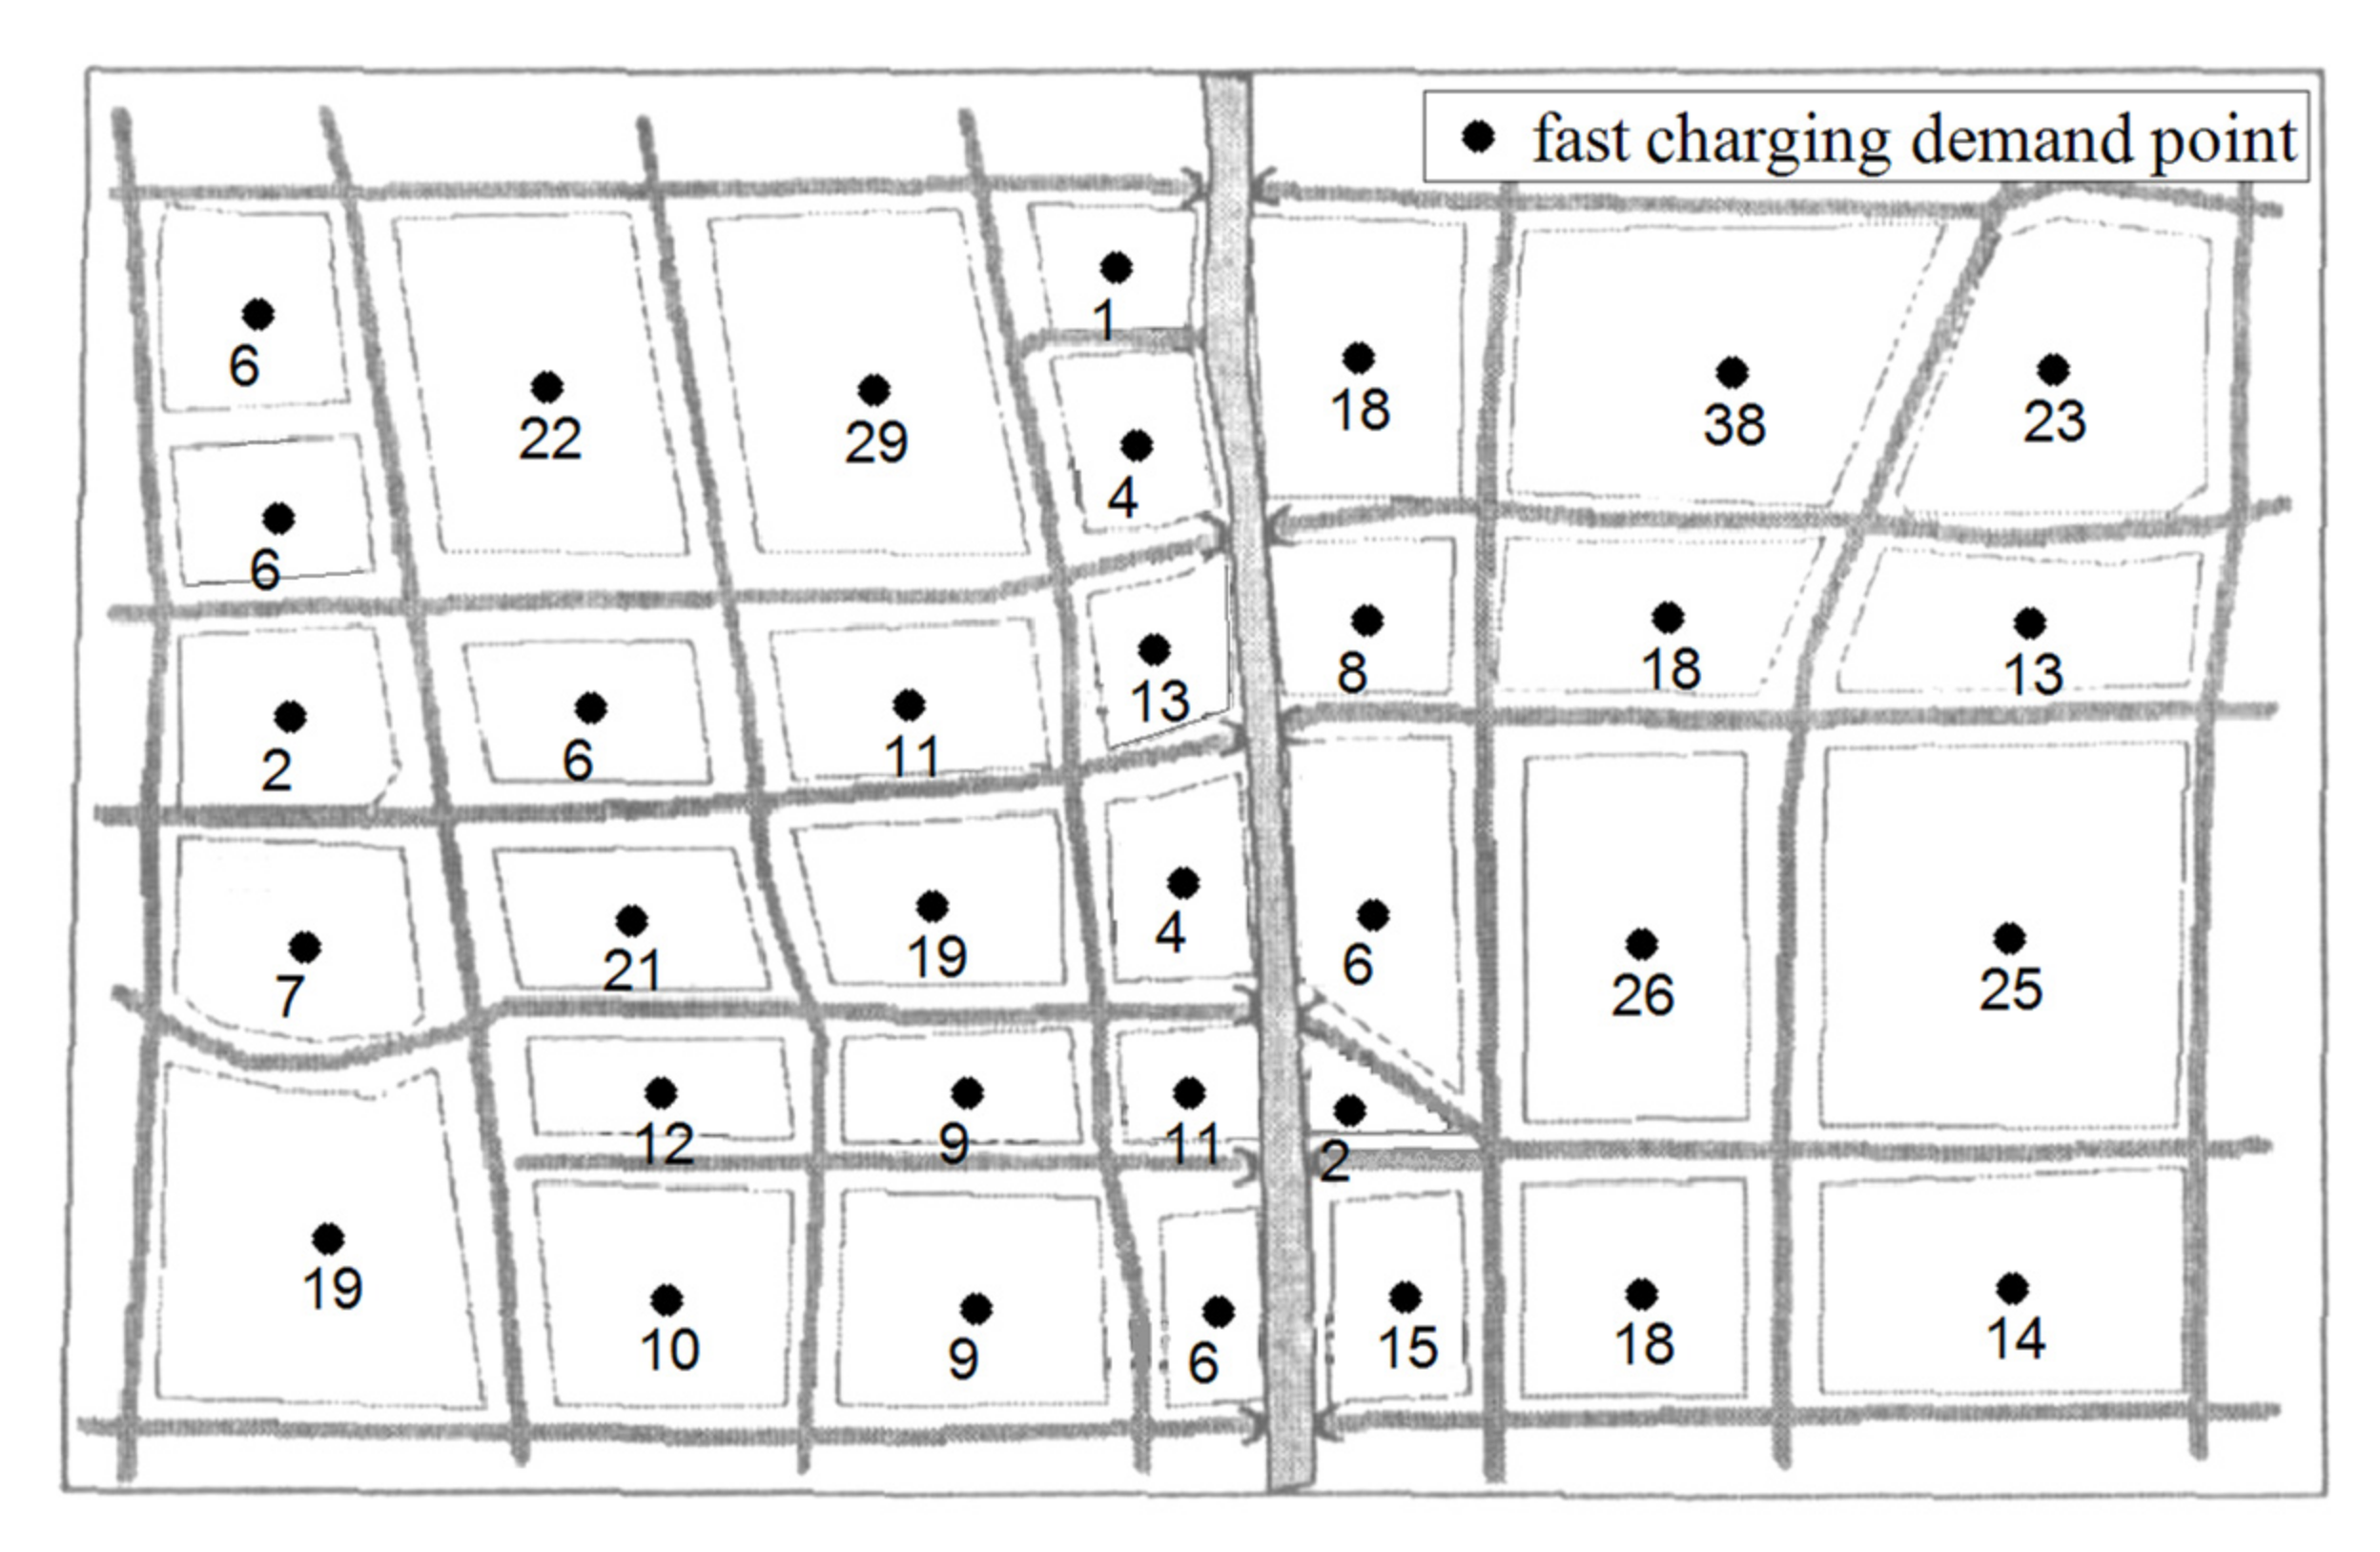
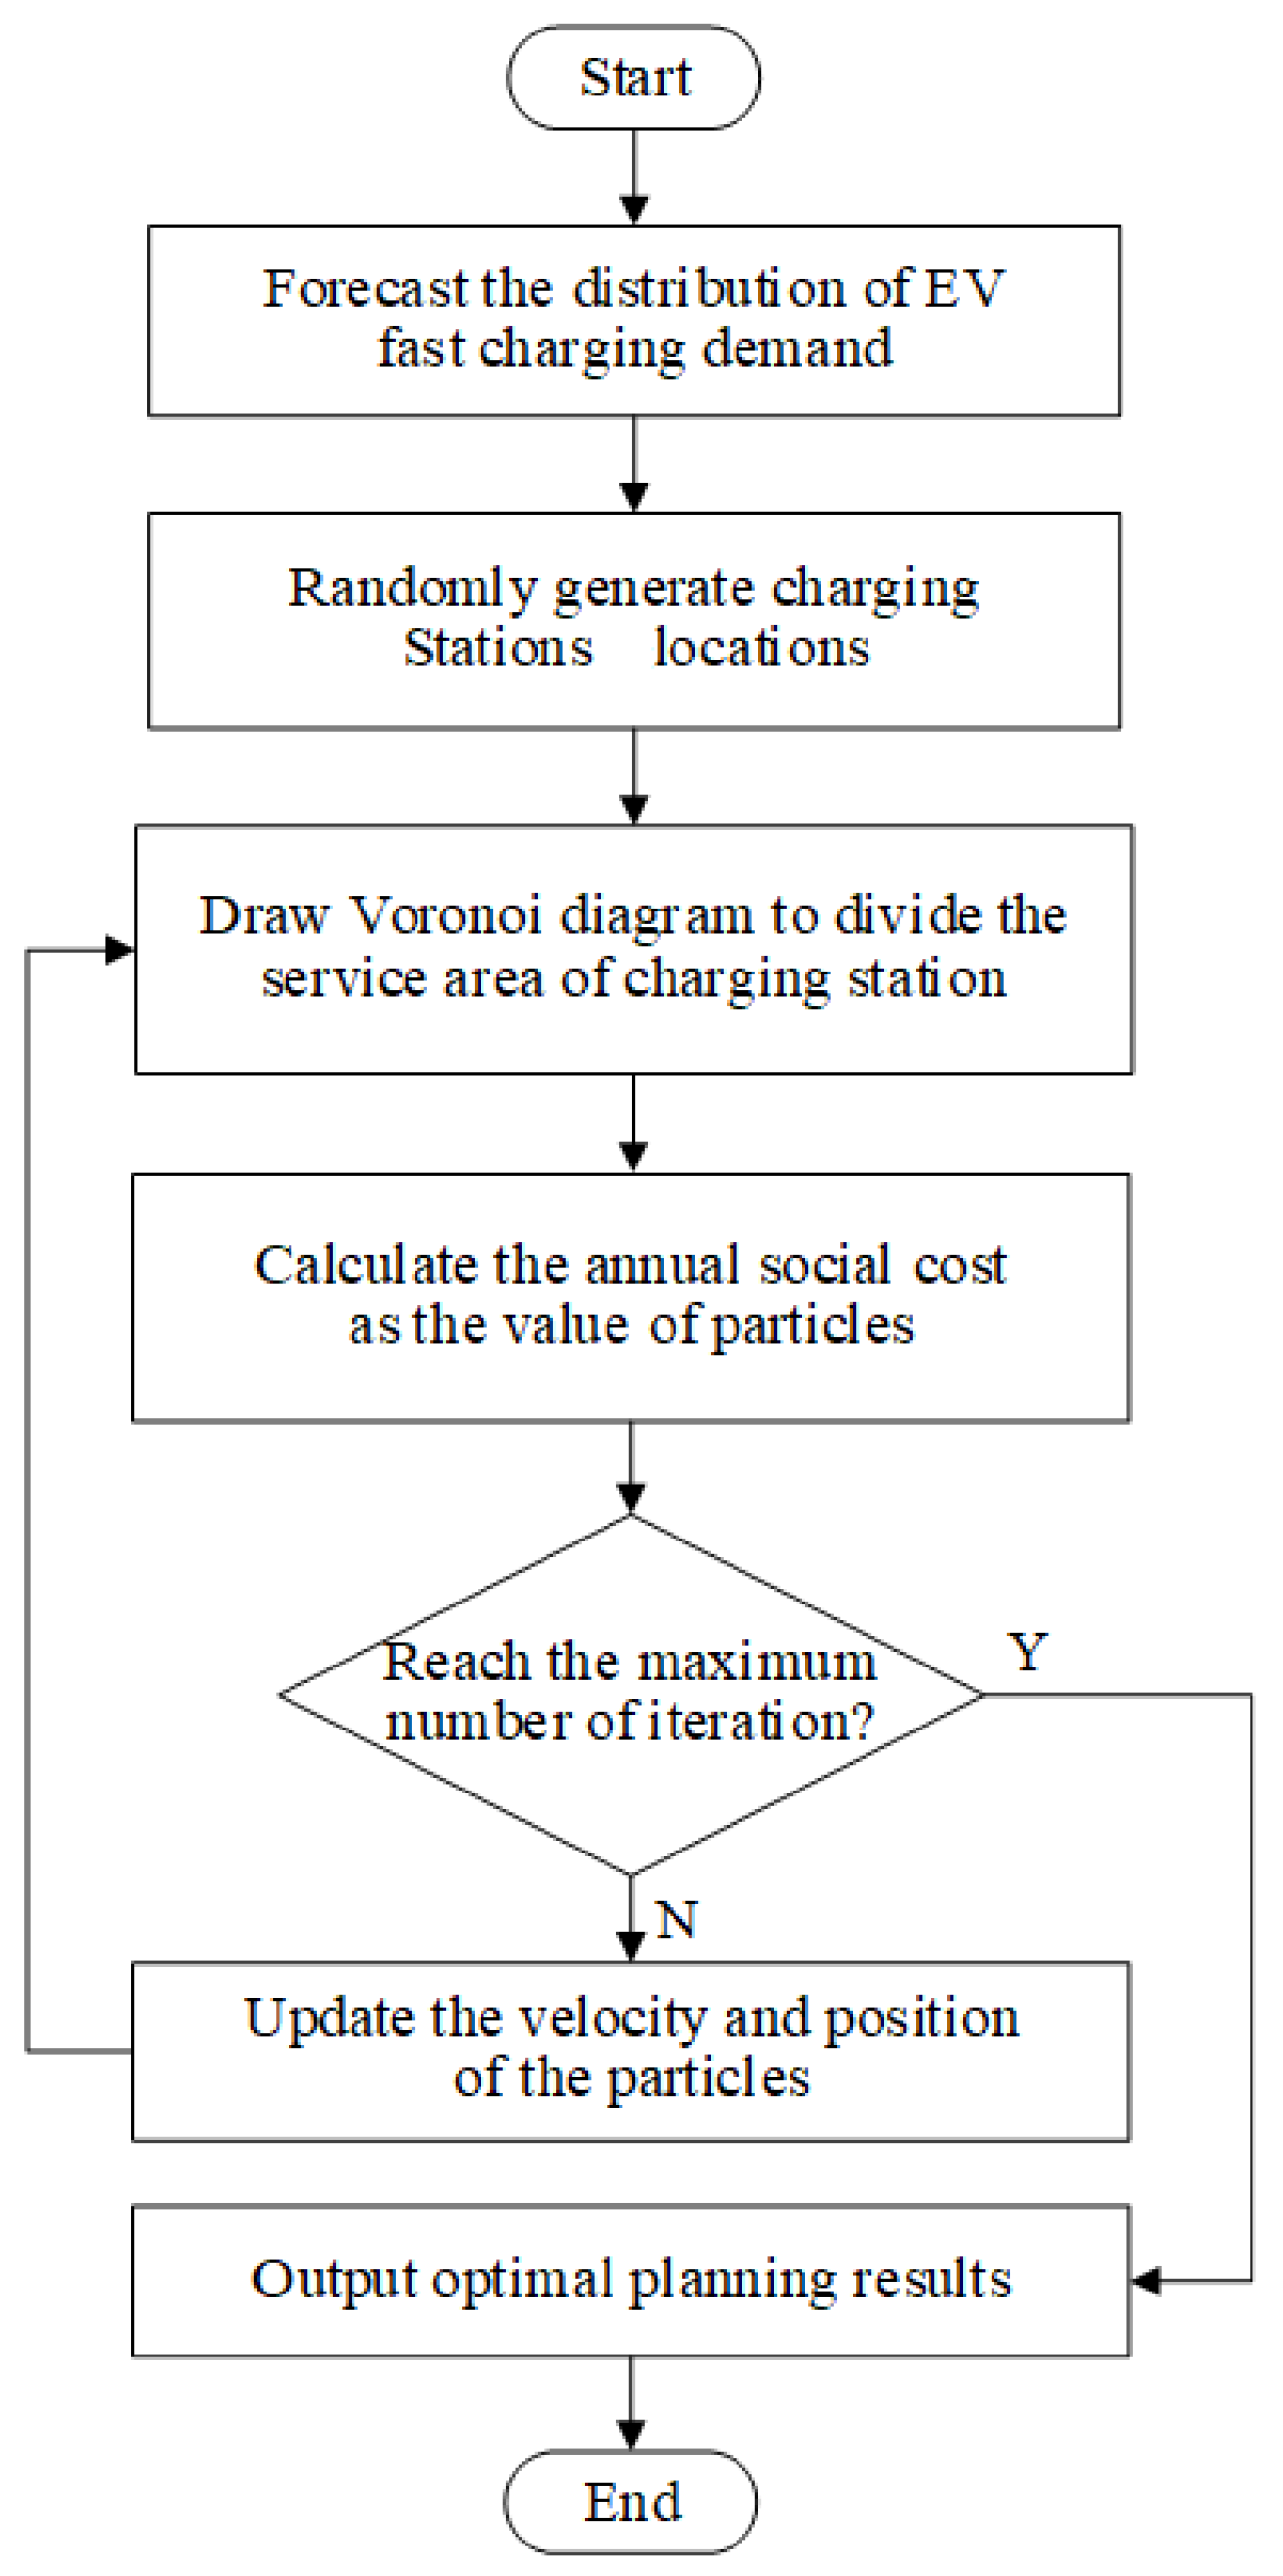
  • Step 1: Forecast the number of EVs at each fast charging demand point according to (1).
  • Step 2: Randomly generate n c charging stations’ locations in the planning area, and use the locations of charging stations as the positions of particles.
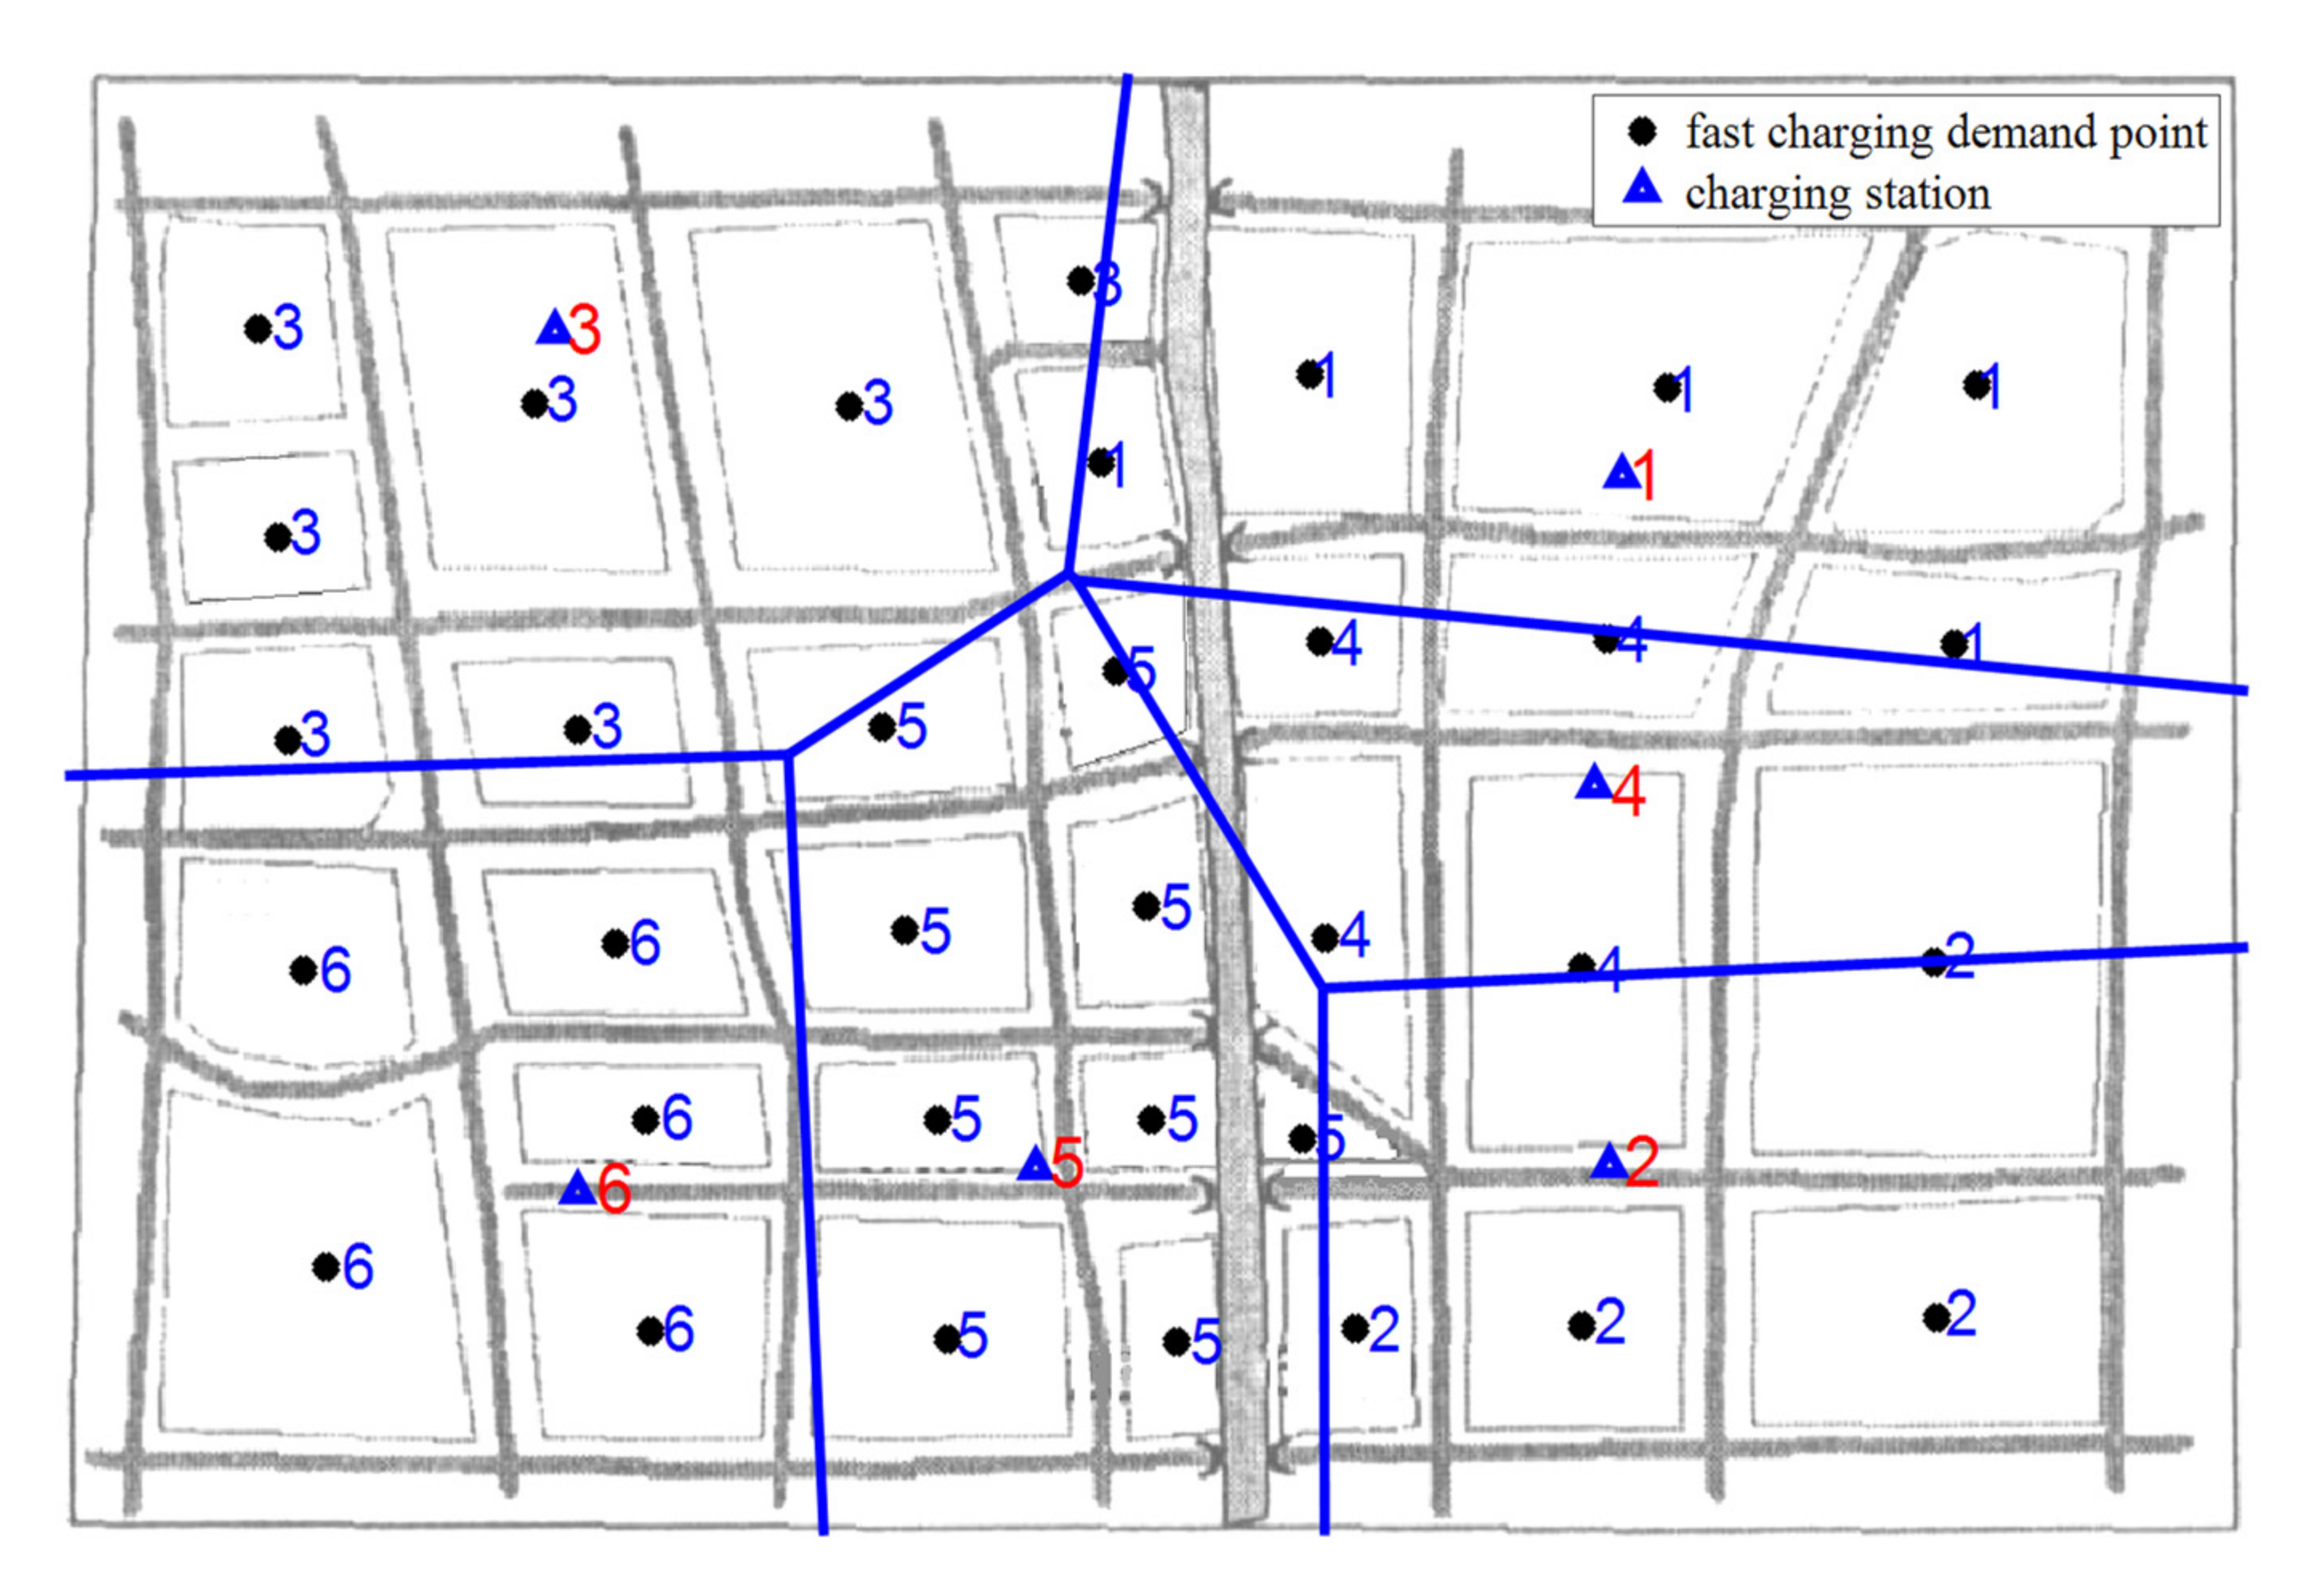
  • Step 3: Taking the position of particle as the growing point, then use Voronoi diagram to divide the service area of each charging station. Use (10) to determine the capacity of charging station.
  • Step 4: Calculate the annual construction and operation cost of charging station, the annual loss cost of users on the way to the charging station, and the annual network loss cost of power grid respectively according to (3), (4), (5), and (6). Then use (2) to calculate the annual social cost of charging station and take it as the value of particle. Finally, find the individual optimal value P b e s t and the global optimal value G b e s t and use the penalty function to deal with the particles that do not meet the constraints.
  • Step 5: Determine whether reach the maximum number of iterations. If not, go to step 6, otherwise go to step 7.
  • Step 6: Update the speed and position of particles, go to step 3 and the number of iterations plus one.
  • Step 7: Output each charging station’s optimal location and its service area, the planning costs, and the number of chargers in each charging station.

5. Case Study and Discussion

The proposed model is tested on an urban area which consists of 34 functional areas. We have used MATLAB R2016a to formulate the desired model, the simulation is carried out on a PC with Intel Core i5-6200 @ 2.30 GHz processor and 8 GB RAM.

5.1. Case Description

The total area of the planning area is 8.2 km 2 , six charging stations are planned to be built in the planning area. The forecasting value of power load in this area is 177.52 MW [15], and each functional area’s power load is shown in Figure 2.
The number of EVs in the planning area is 4500, and the proportion of EVs with fast charging demand is 10% [15], so the number of EVs with fast charging demand is 450. According to (1), the distribution of EVs with fast charging demand is shown in Figure 3, where the black dot represents the fast-charging demand point, and the number beside the dot represents the number of EVs with fast charging demand.
According to [16,17], the basic investment of charging station is 200 × 104 ¥. The price of a charger is 5 × 10⁴ ¥. The auxiliary investment coefficient of a charger is 1.5 × 10⁴ ¥. The depreciation life of charging station is 20 years, and the discount rate is 0.08. The operation cost is 15% of the construction cost. EV’s battery consumption is 0.3 kWh/km. The charging price of EV is 1 ¥/kWh. The zigzag coefficient of road is 1.2. The daily work time of a charging station is 20 h a day. The copper loss and iron loss of the transformer is 0.04 ¥/kWh, the line loss and charging loss of charger is 0.05 ¥/kWh. The simultaneous arrival rate of EVs is 0.6, and the number of EVs in a queue that can be accepted by EV users is 3. The minimum number of chargers in the charging station is 10 and the maximum is 20. The maximum distance between fast charging demand point and charging station is 1.5 km. The minimum distance between charging stations is 0.5 km.

5.2. Simulation Analysis and Discussion

We suppose that the number of particle swarm is 20 and the maximum number of iterations is 300. The simulation results are shown in Figure 4. The minimum annual social cost of charging station is 441.59 × 10⁴ ¥, the costs and the number of chargers in each charging station are shown in Table 1.
In Figure 4, the blue triangles represent EV charging stations, and the red number next to the triangle is the serial number of the charging station. The black dots represent the fast-charging demand points, and the blue numbers beside the dots represent the serial number of the charging station to which the fast-charging demand point belongs. Each charging station’s service area is divided by the blue line. The specific service results of each charging station are as follows: No.1 charging station serves four fast charging demand points; No.2 charging station serves four fast charging demand points; No.3 charging station serves seven fast charging demand points; No.4 charging station serves seven fast charging demand points; No.5 charging station serves five fast charging demand points; No.6 charging station serves seven fast charging demand points. As shown in Figure 4, charging stations are evenly distributed in the planning area and their service areas are clearly divided. Each charging station is close to the center of gravity of fast charging demand points so that users can get convenient charging services. As can be seen from Table 1, 89 chargers need to be equipped in the planning area. Each charging station’s construction and operation cost, loss cost of users, and network loss cost are different. Among them, the construction and operation cost play a major role in the total cost, which is proportional to the number of chargers. The number of chargers is determined by the number of EVs in charging station’s service area, so the charging station which serves more EVs has higher construction and operation cost. Although the loss cost of users is relatively low, it reflects users’ satisfaction during the charging process.
In order to verify that IPSO has better global optimization ability, we use PSO combined with Voronoi diagram to solve the model. The simulation results are shown in Figure 5 and Table 2. The iterative process is shown in Figure 6.
In Figure 5, the specific planning results of each charging station are as follows: No.1 charging station serves five fast charging demand points; No.2 charging station serves four fast charging demand points; No. 3 charging station serves seven fast charging demand points; No.4 charging station serves four fast charging demand points; No. 5 charging station serves nine fast charging demand points; No.6 charging station serves five fast charging demand points. Charging stations are evenly distributed in the planning area and they are close to the center of gravity of fast charging demand points.
As can be seen from Table 2, the planning results obtained by IPSO have a lower annual social cost. The planning results obtained by PSO show that 90 chargers need to be equipped in the planning area, which leads to an increase in the annual construction and operation cost and the annual network loss cost. From Figure 6, we can see that IPSO finds the optimal solution after about 85 iterations, while PSO finds the optimal solution after about 190 iterations, which means IPSO is more effective in finding the global optimal solution than PSO.

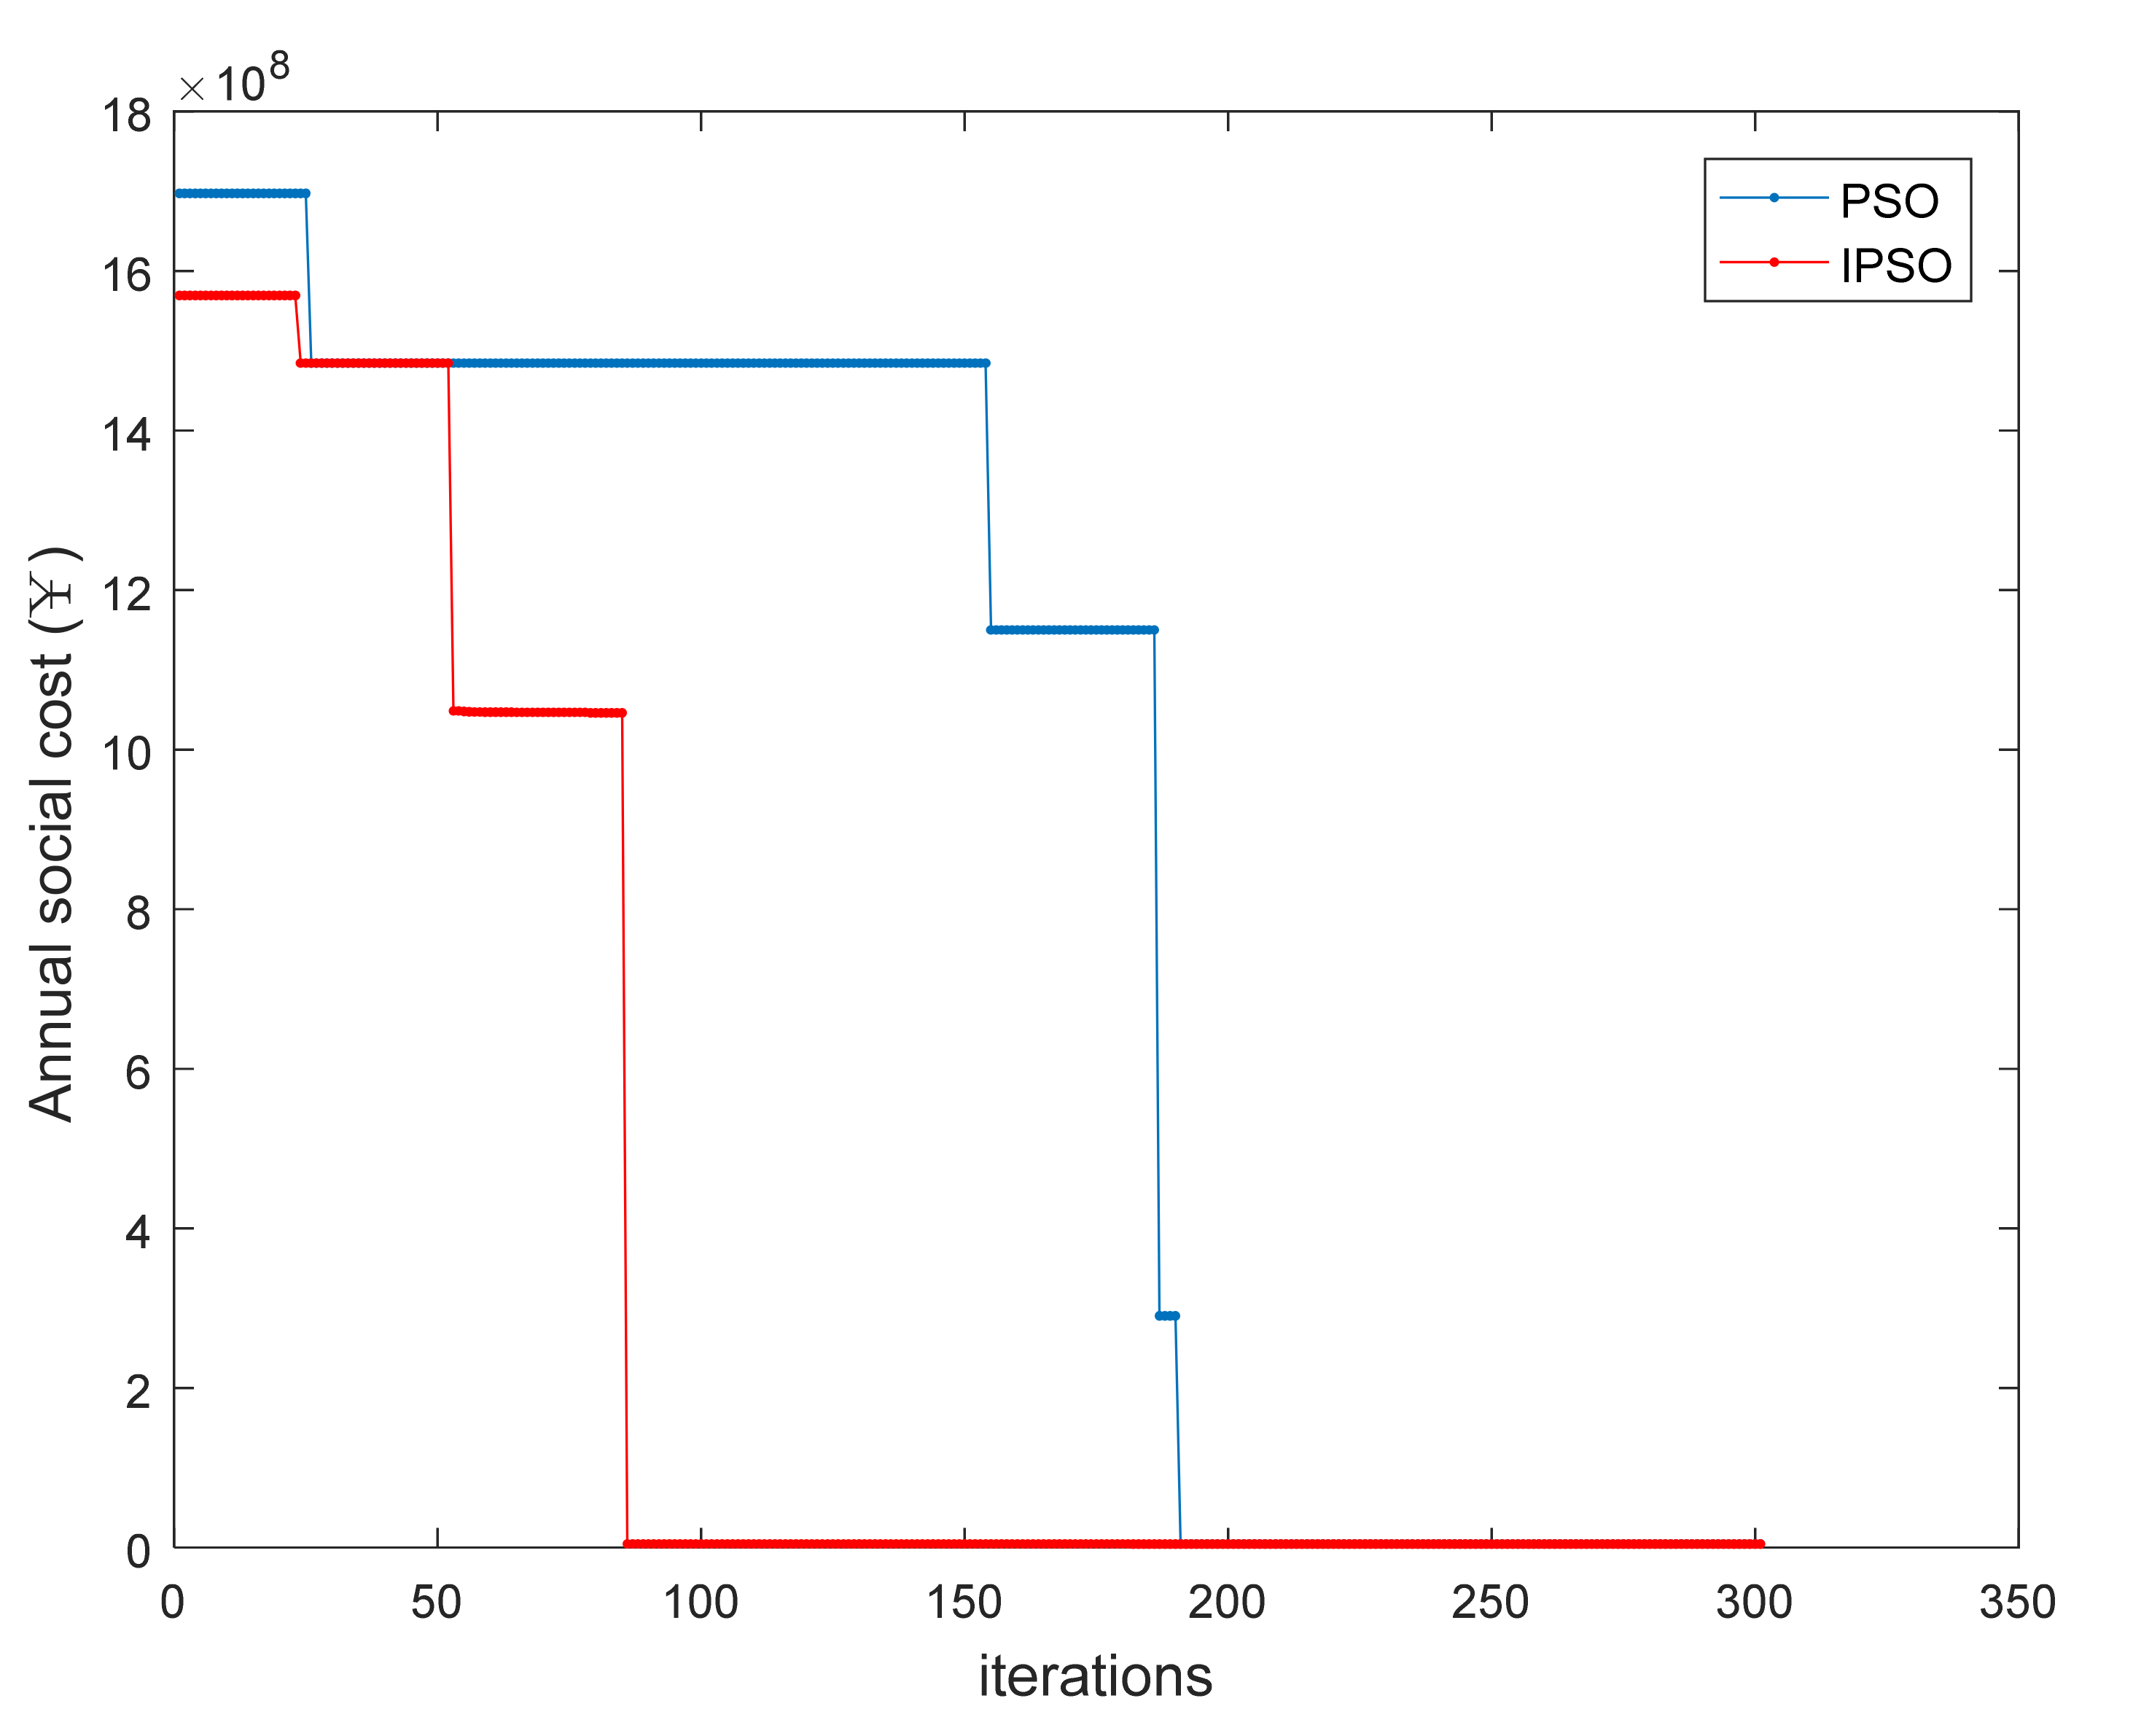
5.3. Comparison of Different Method

To prove the advancement of the proposed method, the planning results of the proposed method and method in [3,20] are compared in Table 3.
The results show that [3] has also considered the benefits of users and establishes a universal simulation platform to get the optimal location and size of charging stations, but the service areas of the charging stations have not been divided. In [20], objective function has been improved to take into account the profit of charging stations. However, genetic algorithm is used to solve the model, the efficiency of genetic algorithm is lower than other optimization algorithms.
The comparison results show that the proposed method comprehensively considers the interests of charging station, users, and the power grid, and it can get not only the optimal location and capacity of a charging station, but also the service area of that charging station.

6. Conclusions

With the increasing penetration of EVs, charging infrastructure planning should be more scientific and rational. This paper proposes an optimal charging station location and capacity model which considers mutual benefit of users and the power grid. The model is solved by Voronoi diagram combined with IPSO to determine location, capacity, and service area of each charging station. The simulation results show that charging stations are evenly distributed in the planning area and are close to fast charging demand points, users can get convenient charging services. In addition, IPSO can get a better planning scheme with lower costs and fewer iterations compared to PSO.

Author Contributions

Conceptualization, H.H., J.T., B.Z. and L.Z.; Methodology, H.H. and J.T.; Software, J.T.; Validation, H.H.; Formal analysis, H.H., B.Z., L.Z. and C.X.; Investigation, J.T. and Y.W.; Resources, H.H., B.Z. and L.Z.; Data curation, H.H., B.Z., L.Z. and J.T.; Writing—original draft preparation, H.H. and J.T.; Writing—review and editing, H.H. and J.T.; Visualization, J.T.; Supervision, H.H. and C.X.; Project administration, H.H., B.Z. and L.Z.; Funding acquisition, H.H. and Y.W. All authors have read and agreed to the published version of the manuscript.

Funding

This research was funded by Project Supported by National Key Research and Development by Program of China, grant number 2020YFB1506802; National Natural Science Foundation of China, grant number 52177110 and Shenzhen Science and Technology Program, grant number JCYJ20210324131409026.

Data Availability Statement

The datasets used and/or analyzed during the current study are available from the corresponding author on reasonable request.

Conflicts of Interest

The authors declare no conflict of interest.

References

  1. Luo, L.Z.; Gu, W.; Zhou, S.Y.; Huang, H.; Gao, S.; Han, J.; Wu, Z.; Dou, X.B. Optimal planning of electric vehicle charging stations comprising multi-types of charging facilities. Appl. Energy 2018, 226, 1087–1099. [Google Scholar] [CrossRef]
  2. Yao, W.F.; Zhao, J.H.; Wen, F.S.; Dong, Z.Y.; Xue, Y.S.; Xu, Y.; Meng, K. A Multi-Objective Collaborative Planning Strategy for Integrated Power Distribution and Electric Vehicle Charging Systems. IEEE Trans. Power Syst. 2014, 29, 1811–1821. [Google Scholar] [CrossRef]
  3. Kong, W.W.; Luo, Y.G.; Feng, G.X.; Li, K.Q.; Peng, H.E. Optimal location planning method of fast charging station for electric vehicles considering operators, drivers, vehicles, traffic flow and power grid. Energy 2019, 186, 115826. [Google Scholar] [CrossRef]
  4. Zhou, B.; Chen, G.; Huang, T.W.; Song, Q.K.; Yuan, Y.F. Planning PEV Fast-Charging Stations Using Data-Driven Distributionally Robust Optimization Approach Based on phi-Divergence. IEEE Trans. Transp. Electrif. 2020, 6, 170–180. [Google Scholar] [CrossRef]
  5. Liu, Z.P.; Wen, F.S.; Ledwich, G. Optimal Planning of Electric-Vehicle Charging Stations in Distribution Systems. IEEE Trans. Power Deliv. 2013, 28, 102–110. [Google Scholar] [CrossRef]
  6. Aghapour, R.; Sepasian, M.S.; Arasteh, H.; Vahidinasab, V.; Catalao, J.P.S. Probabilistic planning of electric vehicles charging stations in an integrated electricity-transport system. Electr. Power Syst. Res. 2020, 189, 106698. [Google Scholar] [CrossRef]
  7. Zheng, Y.; Dong, Z.Y.; Xu, Y.; Meng, K.; Zhao, J.H.; Qiu, J. Electric Vehicle Battery Charging/Swap Stations in Distribution Systems: Comparison Study and Optimal Planning. IEEE Trans. Power Syst. 2014, 29, 221–229. [Google Scholar] [CrossRef]
  8. Andrenacci, N.; Ragona, R.; Valenti, G. A demand-side approach to the optimal deployment of electric vehicle charging stations in metropolitan areas. Appl. Energy 2016, 182, 39–46. [Google Scholar] [CrossRef]
  9. Zeng, B.; Dong, H.Q.; Sioshansi, R.; Xu, F.Q.; Zeng, M. Bilevel Robust Optimization of Electric Vehicle Charging Stations with Distributed Energy Resources. IEEE Trans. Ind. Appl. 2020, 56, 5836–5847. [Google Scholar] [CrossRef]
  10. Xu, Q.S.; Cai, T.T.; Liu, Y.J.; Yao, L.Z.; Zeng, P.L. Location planning of charging stations for electric vehicles based on drivers’ behaviours and travel chain. Autom. Electr. Power Syst. 2016, 40, 59–65. [Google Scholar]
  11. Fu, F.J.; Fang, Y.X.; Dong, H.Z.; Chen, W.F. Optimized allocation of charging stations for electric vehicles based on historical trajectories. Autom. Electr. Power Syst. 2018, 42, 72–80. [Google Scholar]
  12. Simorgh, H.; Doagou-Mojarrad, H.; Razmi, H.; Gharehpetian, G.B. Cost-based optimal siting and sizing of electric vehicle charging stations considering demand response programmes. IET Gener. Transm. Distrib. 2018, 12, 1712–1720. [Google Scholar] [CrossRef]
  13. Liu, Z.F.; Zhang, W.; Wang, Z.L. Optimal planning of charging station for electric vehicle based on quantum PSO algorithm. Proc. CSEE 2012, 32, 39–45. [Google Scholar]
  14. Cai, Z.L.; Shu, H.C. Long-term development scale and charging load forecasting of electric vehicle. In Proceedings of the International Conference on Renewable Energy and Environmental Technology (REET 2013), Jilin, China, 21–22 September 2013; pp. 3194–3200. [Google Scholar]
  15. Xiong, H.; Xiang, T.Y.; Rong, X.; Chen, H.K. Optimal allocation of electric vehicle battery swap stations. Electr. Power Autom. Equip. 2012, 32, 1–6. [Google Scholar]
  16. Xiong, H.; Xiang, T.Y.; Zhu, Y.G.; Song, X.D.; Chen, H.; Chen, H.K. Electric vehicle public charging stations location optimal planning. Autom. Electr. Power Syst. 2012, 36, 65–70. [Google Scholar]
  17. Ai, X.; Li, Y.Z.; Wang, K.Y.; Hu, J.J. Locating and sizing of electric vehicle charging station based on chaotic simulated annealing particle swarm optimization algorithm. Electr. Power Autom. Equip. 2018, 38, 9–14. [Google Scholar]
  18. Bao, Y. Study on Site Selection of Electric Vehicle Charging Stations in Dalian. Master’s Thesis, Dalian Jiaotong University, Dalian, China, 2018. [Google Scholar]
  19. Zhao, B.Y.; Chen, J.H.; Guo, J.T.; Chen, Y.P.; Zhang, Z.X. Location and capacity of electric vehicle charging station based on Voronoi diagram and improved gravity search algorithm. J. Guangdong Univ. Technol. 2021, 38, 72–78. [Google Scholar]
  20. Tian, M.Y.; Tang, B.; Yang, X.; Xia, X.Y. Planning of Electric Vehicle Charging Stations Considering Charging Demands and Acceptance Capacity of Distribution Network. Power Syst. Technol. 2021, 45, 498–506. [Google Scholar]
Figure 1. Integrated solution combining Voronoi diagram with IPSO.
Wevj 12 00244 g001
Figure 2. Power load in each area.
Wevj 12 00244 g002
Figure 3. Distribution of EVs with fast charging demand.
Wevj 12 00244 g003
Figure 4. Charging stations’ locations and their service areas obtained by IPSO and Voronoi diagram.
Wevj 12 00244 g004
Figure 5. Charging stations’ locations and their service areas obtained by PSO and Voronoi diagram.
Wevj 12 00244 g005
Figure 6. The iterative process.
Wevj 12 00244 g006
Table 1. Optimal planning result of charging stations.
Charging Station No.Number of ChargersNumber of EVs in Its Service AreaAnnual Construction and Operation Cost (×104 ¥)Annual Loss Cost of Users
(×104 ¥)
Annual Network Loss Cost
(×104 ¥)
1199797.980.451.74
2147066.070.411.31
3167977.770.581.46
4147166.070.381.31
5115751.130.321.04
6157771.740.461.39
Table 2. Comparison of simulation results.
AlgorithmNumber of Chargers in Each Charging StationAnnual Social Cost
(×104 ¥)
Annual Construction and Operation Cost (×104 ¥)Annual Loss Cost of Users (×104 ¥)Annual Network Loss Cost
(×104 ¥)
PSO19,14,14,
12,17,14
446.93436.082.488.38
IPSO19,14,16,
14,11,15
441.59430.752.598.25
Table 3. Comparison of different methods.
MethodsMethod 1
[3]
Method 2
[20]
Proposed Method
ObjectivesConstruction cost + power loss cost of vehicle + time loss cost of driverConstruction cost +
operating profit
Construction and operation cost + loss cost of users
+ network loss cost
Algorithm
/Platform
Universal simulation platformGenetic algorithm
/MATLAB
IPSO + Voronoi diagram/MATLAB
ResultsOptimal location and size of charging stationOptimal location and size of charging stationOptimal location, capacity, and service area of charging station
Publisher’s Note: MDPI stays neutral with regard to jurisdictional claims in published maps and institutional affiliations.

