Article

Hydrogen Safety Prediction and Analysis of Hydrogen Refueling Station Leakage Accidents and Process Using Multi-Relevance Machine Learning

School of Computer and Computing Science, Zhejiang University City College, Hangzhou 310015, China
*
Author to whom correspondence should be addressed.
World Electr. Veh. J. 2021, 12(4), 185; https://doi.org/10.3390/wevj12040185
Submission received: 17 August 2021 / Revised: 22 September 2021 / Accepted: 8 October 2021 / Published: 13 October 2021

Abstract

:
Hydrogen energy vehicles are being increasingly widely used. To ensure the safety of hydrogenation stations, research into the detection of hydrogen leaks is required. Offline analysis using data machine learning is achieved using Spark SQL and Spark MLlib technology. In this study, to determine the safety status of a hydrogen refueling station, we used multiple algorithm models to perform calculation and analysis: a multi-source data association prediction algorithm, a random gradient descent algorithm, a deep neural network optimization algorithm, and other algorithm models. We successfully analyzed the data, including the potential relationships, internal relationships, and operation laws between the data, to detect the safety statuses of hydrogen refueling stations.

1. Introduction

The world needs to embrace the transition to clean energy. The Intergovernmental Panel on Climate Change (IPCC) reports that climate change is one of the main challenges facing our modern society [1]. The carbon dioxide (CO2) emissions of fossil-fuel-powered vehicles are currently responsible for approximately one-quarter of the total emissions of greenhouse gases into the atmosphere. The development of sustainable mobility has become a key mandate for reducing the impact of global climate change. It is therefore essential to examine the use of renewable fuels instead of fossil fuels to reduce greenhouse gas emissions, e.g., [2,3,4], to achieve sustainable transportation. Hydrogen energy can meet these requirements of sustainable development. Hydrogen refueling stations will be built for the high-level development of hydrogen programs, and hydrogen will need to be transported from the source to the station. Most of the hydrogen storage measures have been independently developed by two Chinese hydrogen refueling stations using advanced technology: compression devices, equipped with an engine and a central system. However, the costs of constructing hydrogen power plants and hydrogen compressor hydrogenation equipment are relatively high. Among the construction costs for hydrogenation power plants, the total cost of a single hydrogen compressor is the highest, followed by the safety and maintenance costs.
Through a literature review and investigation of some hydrogenation stations, we found that the safety monitoring of hydrogenation stations involves manual data monitoring based on a set safety threshold for the hydrogen concentration or pressure in the container, rather than real-time dynamic monitoring during vehicle hydrogenation. Starting with this problem, we studied the safety problems in real-time monitoring for vehicle hydrogenation to ensure the safety of the hydrogenation station in operation. It has high technical practicability and application value [5].
The characteristics of hydrogen determine the compatibility of hydrogen and materials; that is, for hydrogen systems in high-pressure environments, the careful selection of metal materials is required, which is closely related to the safety of hydrogen in use, such as in hydrogen storage bottles, pipes, valves, instruments, and pipe fittings. When the temperature and voltage of the material reach certain values, hydrogen is easily dissociated and forms ultra-small-diameter hydrogen atoms that penetrate into the metal material. After entering the metal material, the hydrogen atoms are oxidized and converted into hydrogen molecules in the internal material, and react with the carbon element in the internal material, resulting in decarbonization and producing methane. Acetylene produces oxidation resistance and stress resistance inside the material, slowly reducing the plasticity and yield hardness of the material, causing cracks and fractures. Therefore, hydrogen refueling stations present certain safety hazards [6].
The explosive concentration range of hydrogen is 18.3~59.0v%, and the combustion range is 4.0~75.0v%. The literature records the combustion concentration range of hydrogen (4.0~75.0v%) as the explosive concentration range, which amplifies the explosiveness of hydrogen. When hydrogen combusts, the calorific value per unit volume and the explosive energy per unit volume are relatively low. The anti-fatigue performance of hydrogen regarding the explosive energy per unit volume is 57% that of gasoline. When the specific gravity of air is 3.4~4.0 (air = 1), the specific gravity of gasoline vapor is 1, and that of hydrogen is only 0.0695. When gasoline leaks into the air, it accumulates on the ground. Hydrogen and natural gas are flammable and explosive gases. Compared with hydrogen, it’s easily diffuses upward into the air and has good mechanical properties in a confined space. Hydrogen is not more dangerous than natural gas [7]. It is important to analyze the data and the potential relationship, internal relationship and operation law between the data using various algorithm models to determine the safety status of hydrogen refueling stations [8].

2. Hydrogen Safety Algorithm

2.1. Hydrogen Safety Algorithm

A PLC imports many types of hydrogen refueling station data; if a simple linear regression algorithm is used, it will consume a lot of time and negatively impact the model’s results. Therefore, the stochastic gradient descent method was adopted, the temperature was the prediction target, and the characteristic data were used for data correlation fitting [9].
In a two-equation model, J(θ) changes downward in Equation (1); the algorithm ends at the point at which θ cannot continue to decrease. The loss function corresponds to the granularity of each sample in the training set, and the above batch gradient descent corresponds to all the training samples in Equations (2) and (3). The following describes the various measures in sklearn: the mean square error (MSE) is the average of the cost function of minimizing the sum of squares (SSE) in the linear regression model fitting process. The stochastic gradient descent of the loss function of each sample is minimized. Although not every iteration of the loss function is toward the global optimal direction [10], the overall direction is toward the global optimal solution, and the final result is often close to the global optimal solution [11].
The formula is as follows:
θ i = θ i δ δ θ J ( θ ) = θ i α ( h θ ( x ) y ) x i
J ( θ ) = 1 m i = 1 m 1 2 ( y i h θ ( x i ) 2 = 1 m i = 1 m cos t ( θ , ( x i , y i ) )
cos t ( θ , ( x ^ i , y ^ i ) ) = 1 / 2 ( y ^ i x _ i ) ) ^ 2
1 m i = 1 m ( y i y i ˙ ) 2

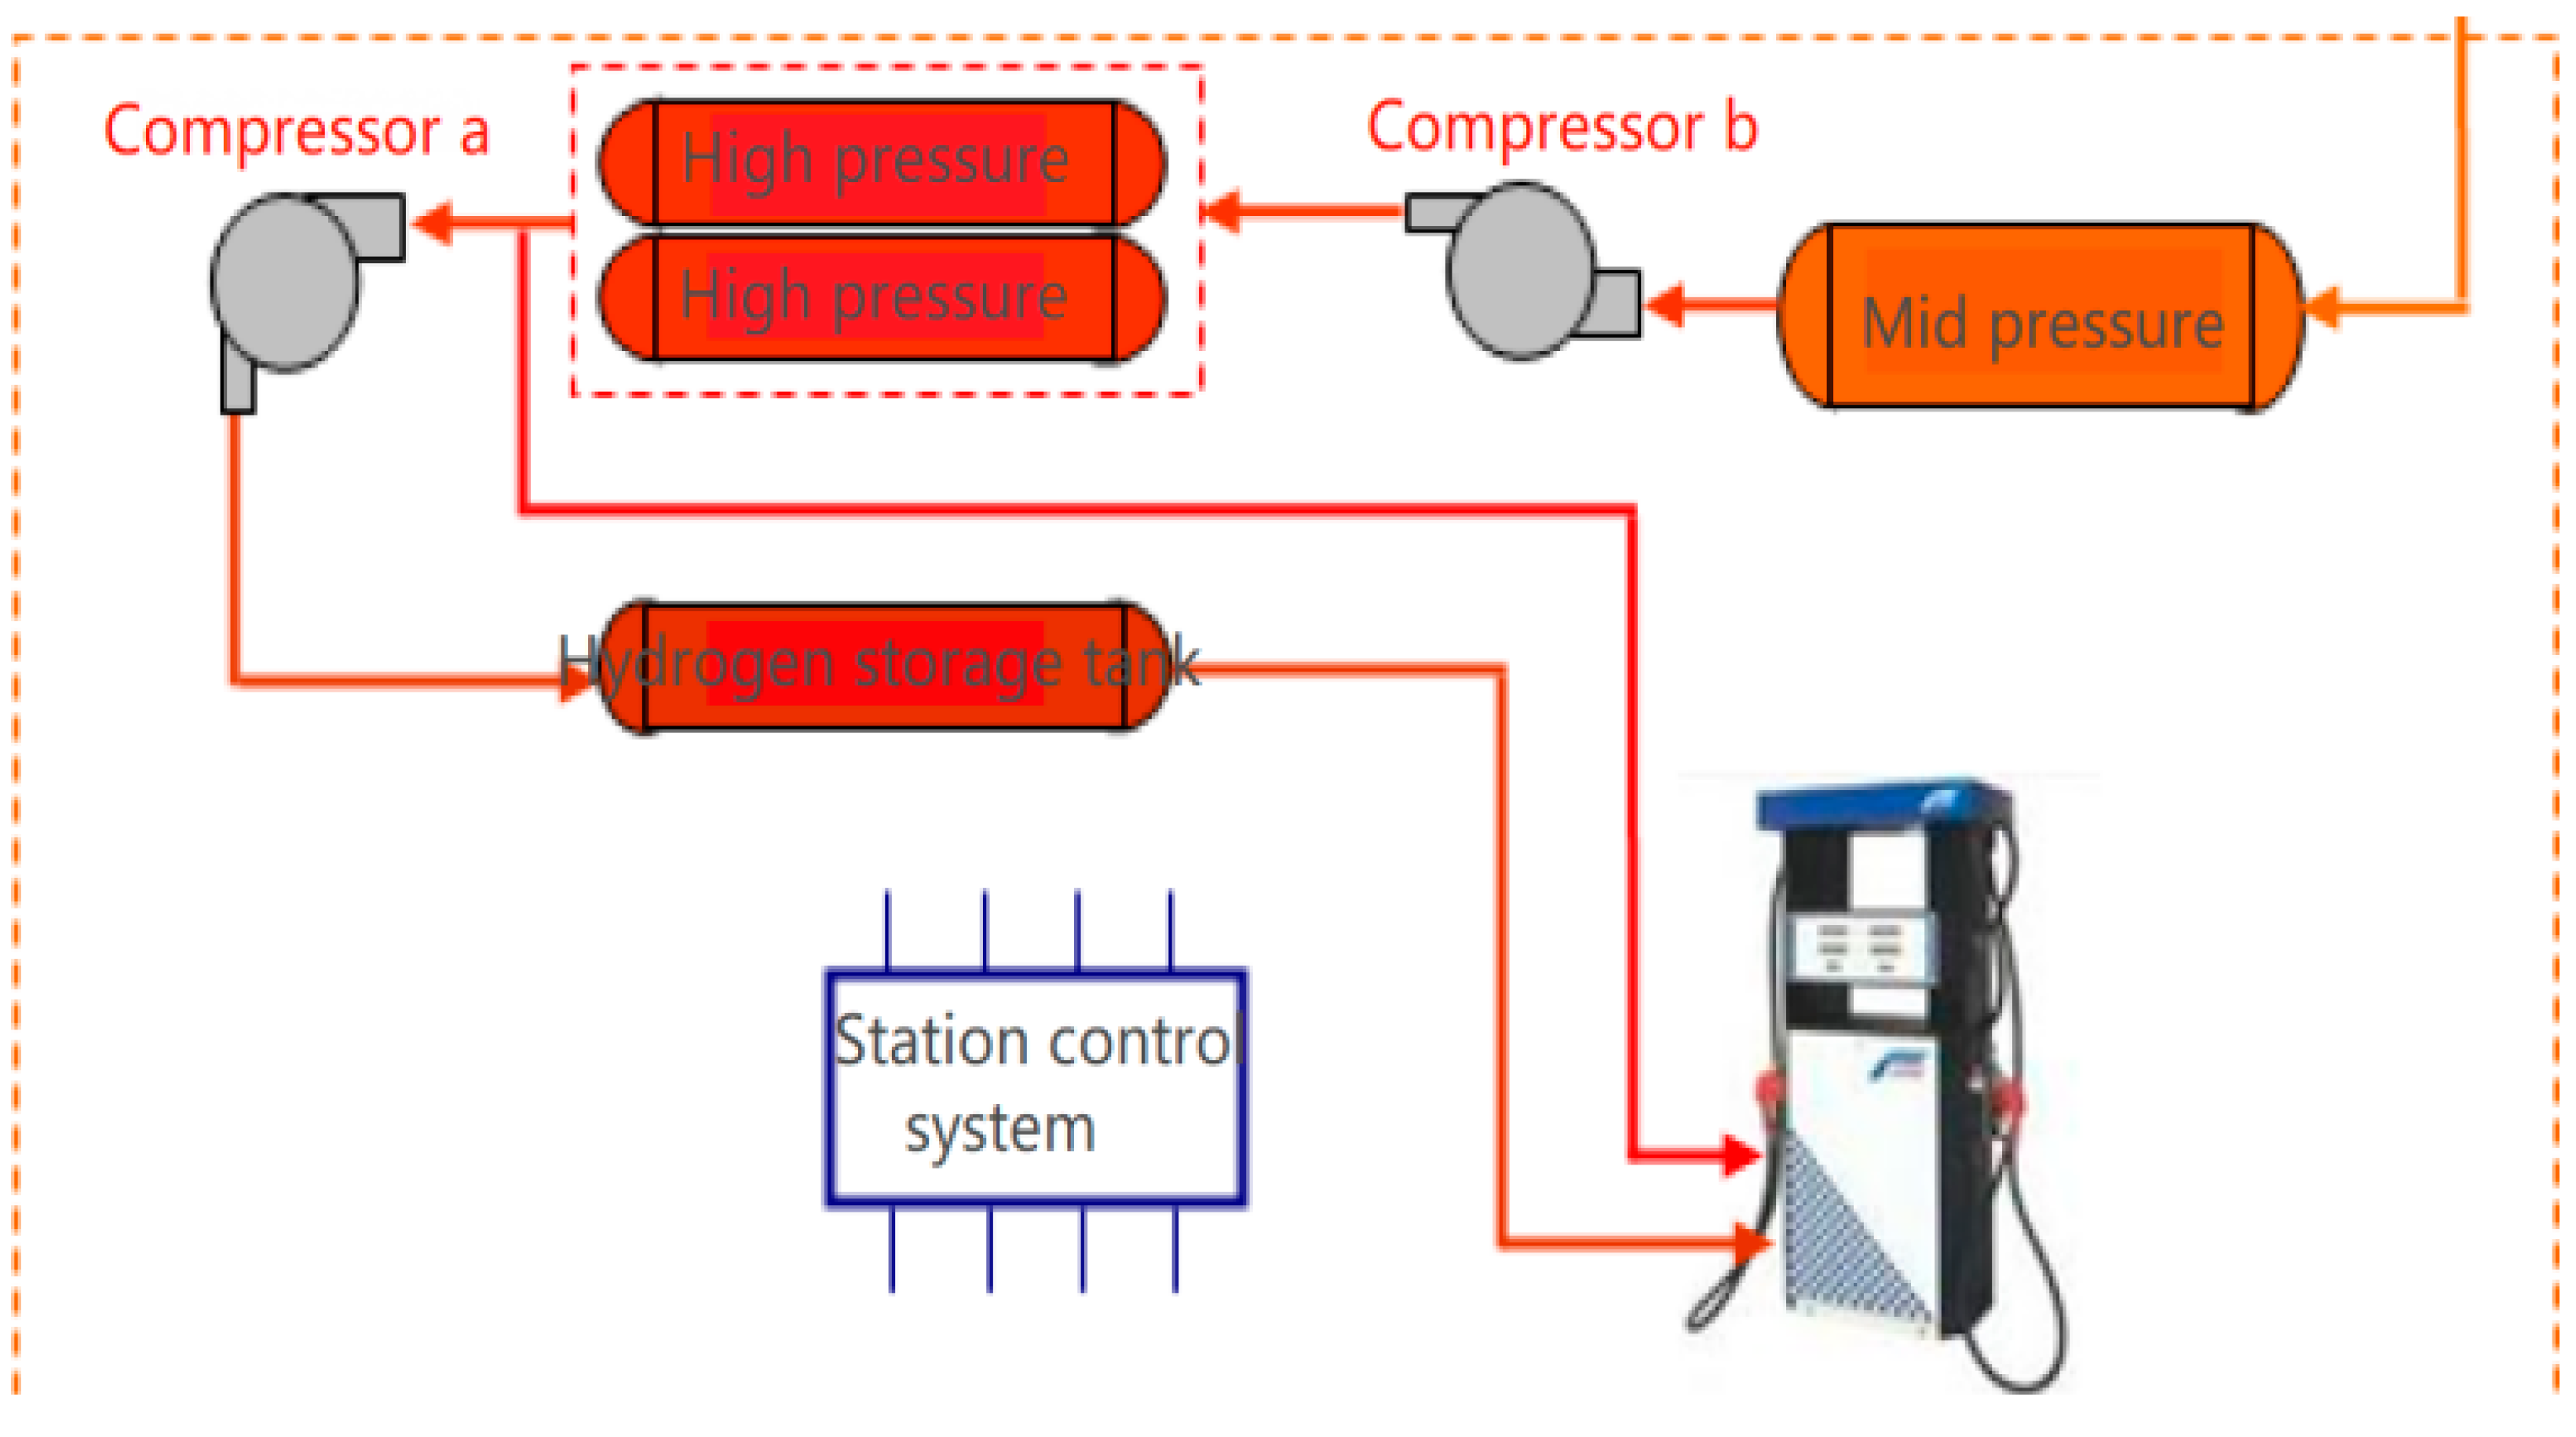
2.2. High-Pressure Hydrogen for Fuel Cell Vehicles

The hydrogen storage cylinder is usually refueled to a pressure level of 35 or 70 MPa. After the dispenser terminates the refueling, the warm fuel tank slowly cools down as heat is transferred to its cooler surroundings. The decreasing gas temperature is accompanied by a pressure decrease, and this decrease continues until the gas temperature is equal to the ambient temperature. The “settled” pressure is less than the pressure immediately after refueling. If this pressure is less than the nominal working pressure (NWP), the tank has been underfilled [12].
It can be seen that the estimation of the tank volume is an important link in the compensation algorithm, which can be derived from the actual gas state equation:
PV = ZmRT,
where V represents the volume of the hydrogen tank, Z is the compressibility factor, m is the mass of hydrogen, and R is the universal gas constant. After the filling of a small amount of H2, the amount of H2 injected into the tank is:
∆m = V (P2/Z2T2 − P1/Z1T1)/R,
where the subscript 1 represents the parameter before the filling and the subscript 2 represents the parameter after the filling, therefore, [p1,p4] [13]:
V = R∆m/(P2/Z2T2 − P1/Z1T1),
In (7), only Z2 and T2 are unknown, and Z2 is a function of P2 and T2, so T2 prediction will provide an accurate value for V. According to the above formula, the tank volume is calculated, and according to the value of the tank volume, if the pressure is less than the nominal working pressure (NWP), the current hydrogen storage tank needs to be charged or the gas tank needs to be replaced.

2.3. Operating Restrictions When Refueling Hydrogen Tanks

For security reasons, ISO 15869 stipulates that the hydrogen temperature cannot exceed 85 °C. The precooled temperature should not be less than −40 °C. Too fast filling will result in a significant temperature rise, so the maximum mass filling rate is prescribed as 60 g/s (equivalent to 10 kg/180 s) [14]. On the other hand, if the filling rate is too slow, the filling time will exceed 5 min. Since the temperature rise is significant and should be controlled, many researchers have studied the temperature behavior of hydrogen tanks during fast filling. With no control, the gas temperature is likely to exceed 85 °C [15].

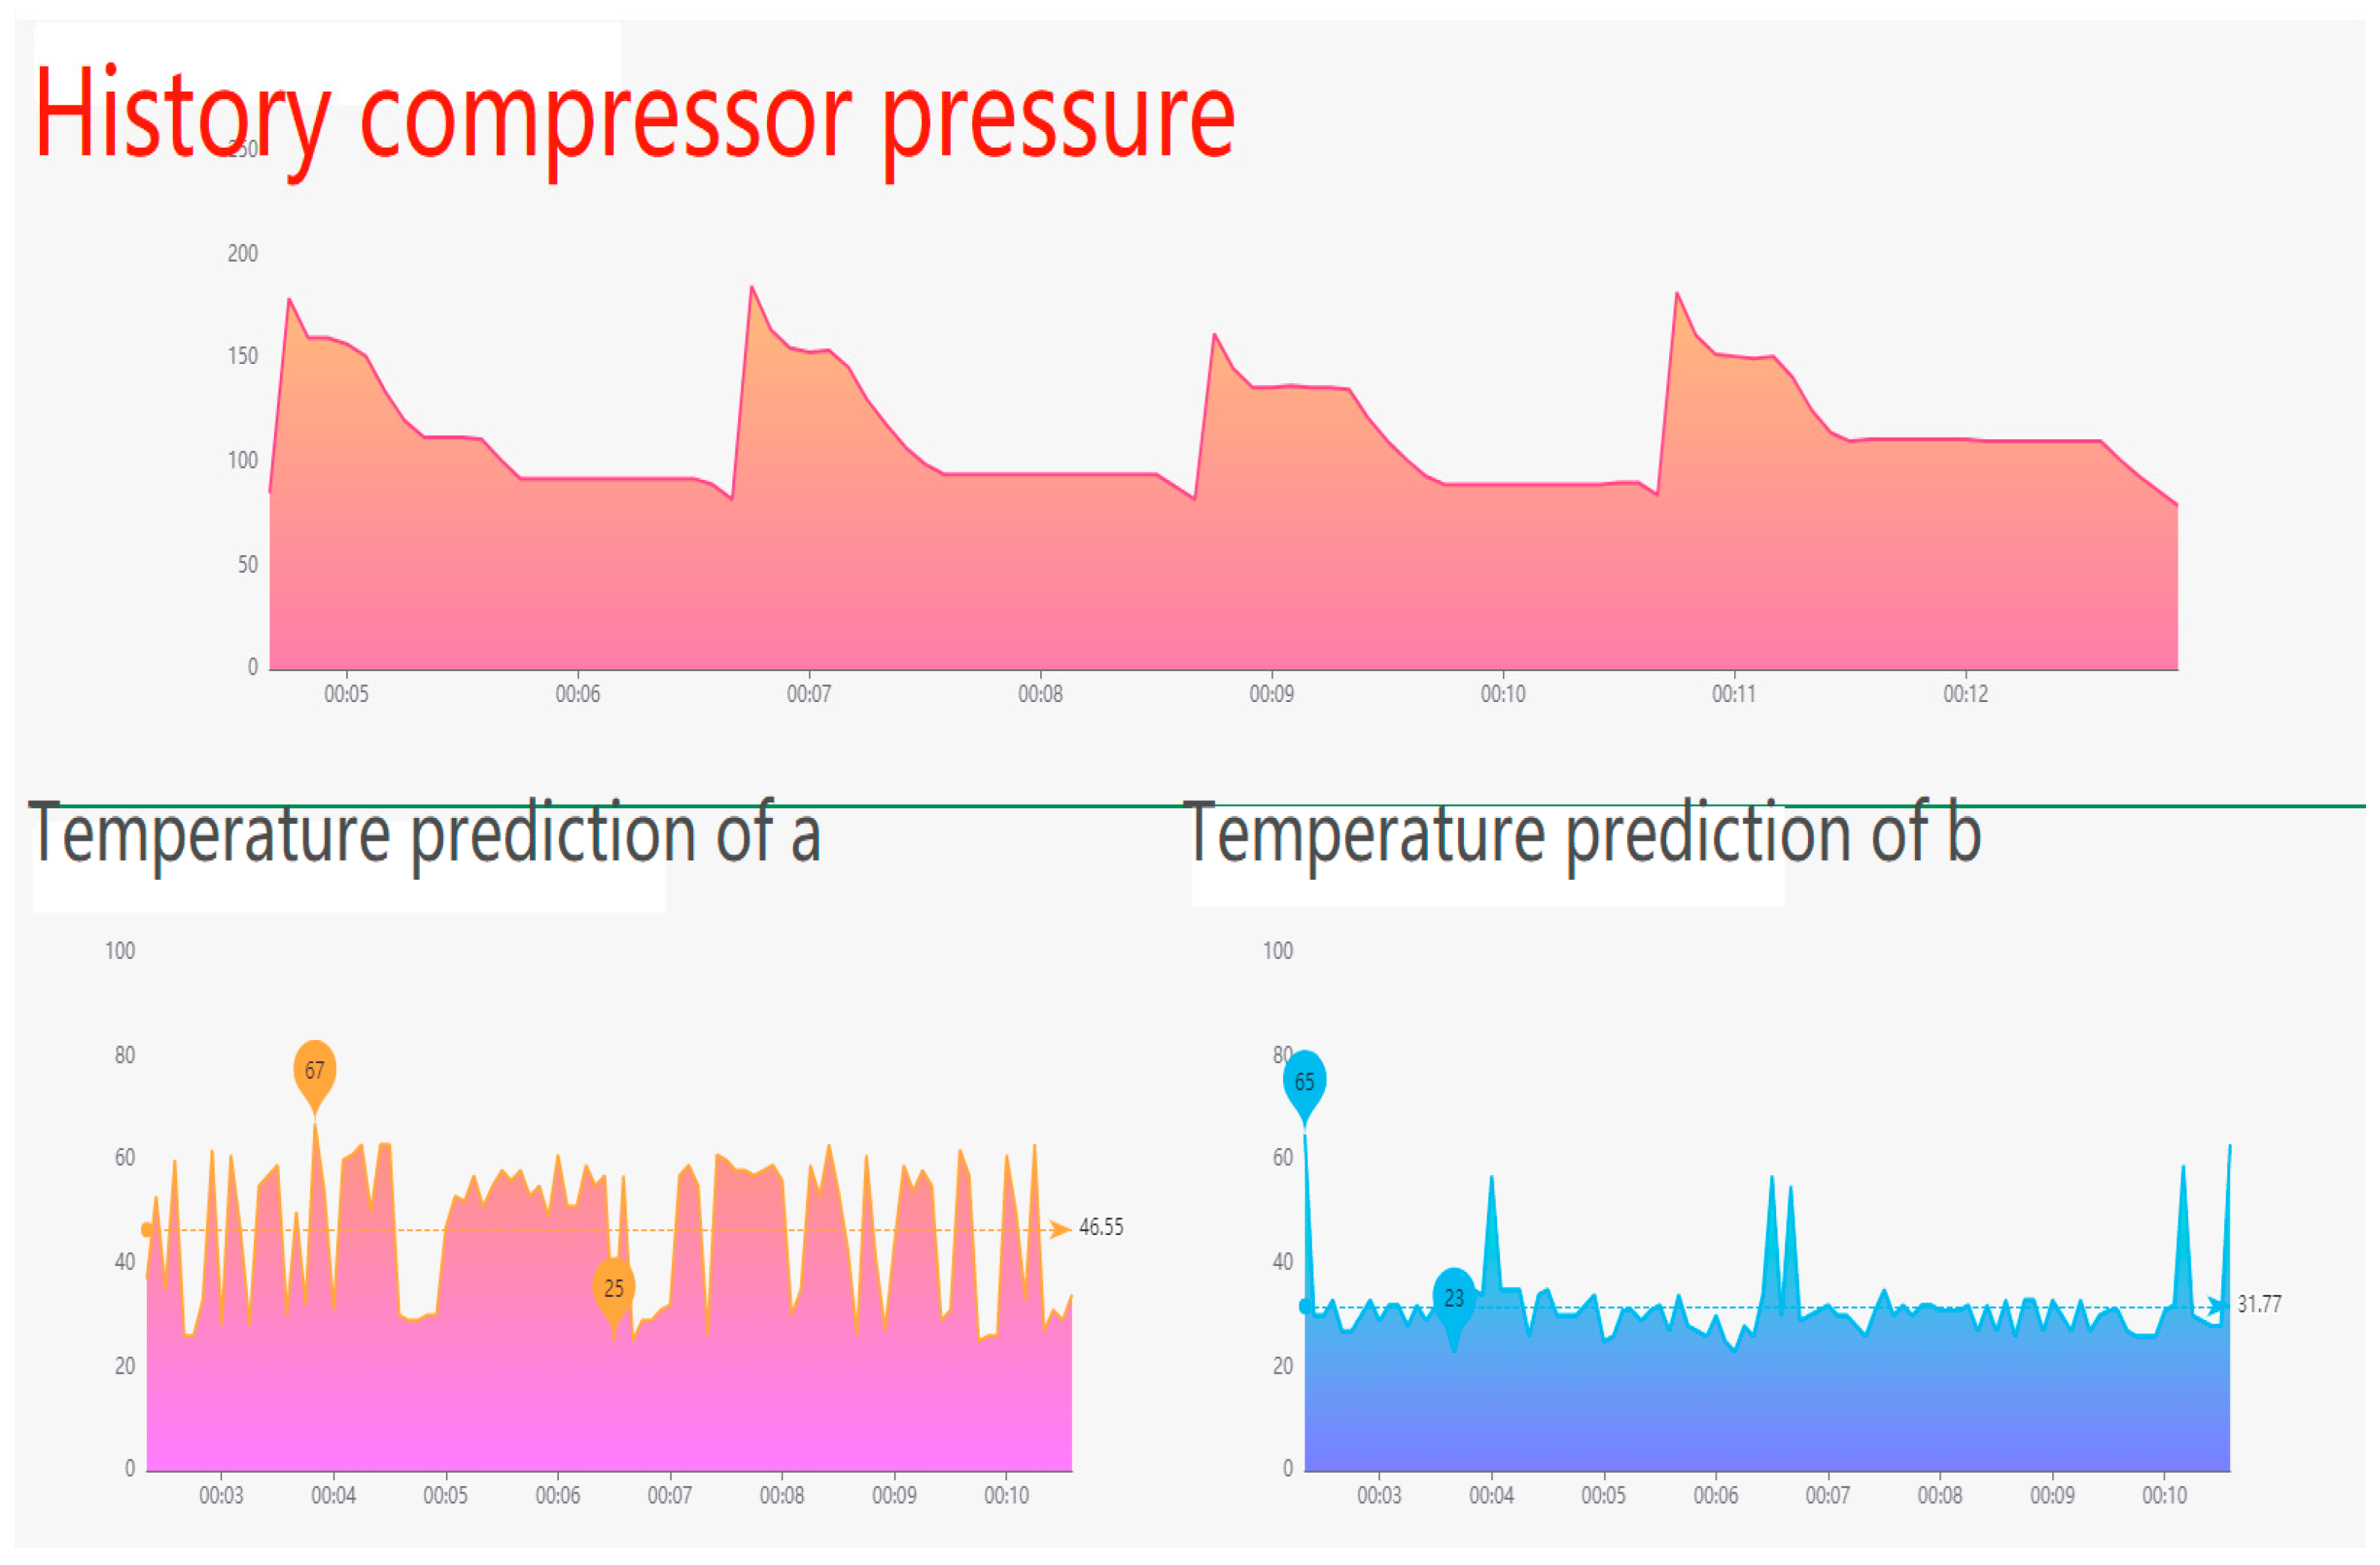
3. Analysis and Results

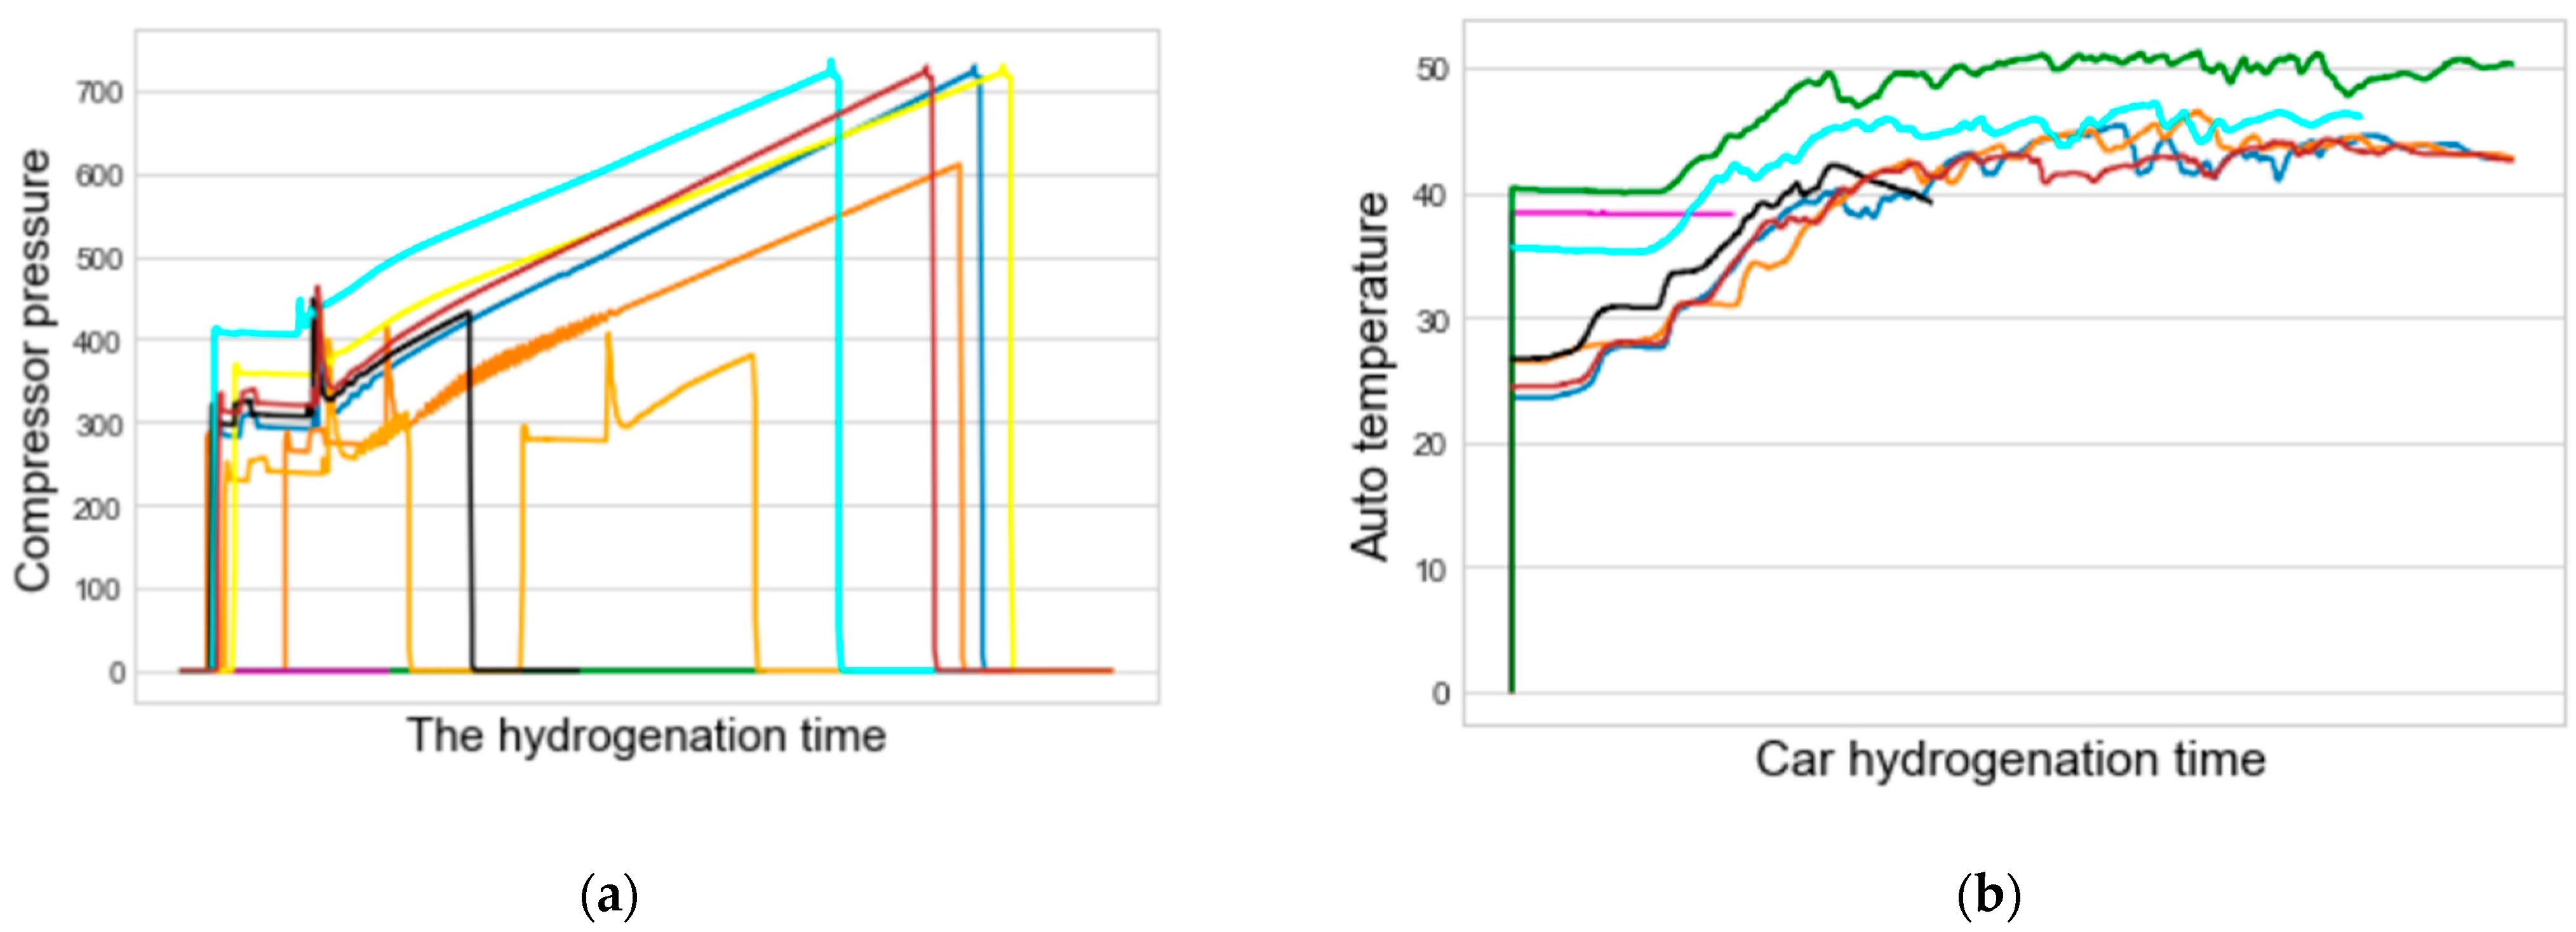
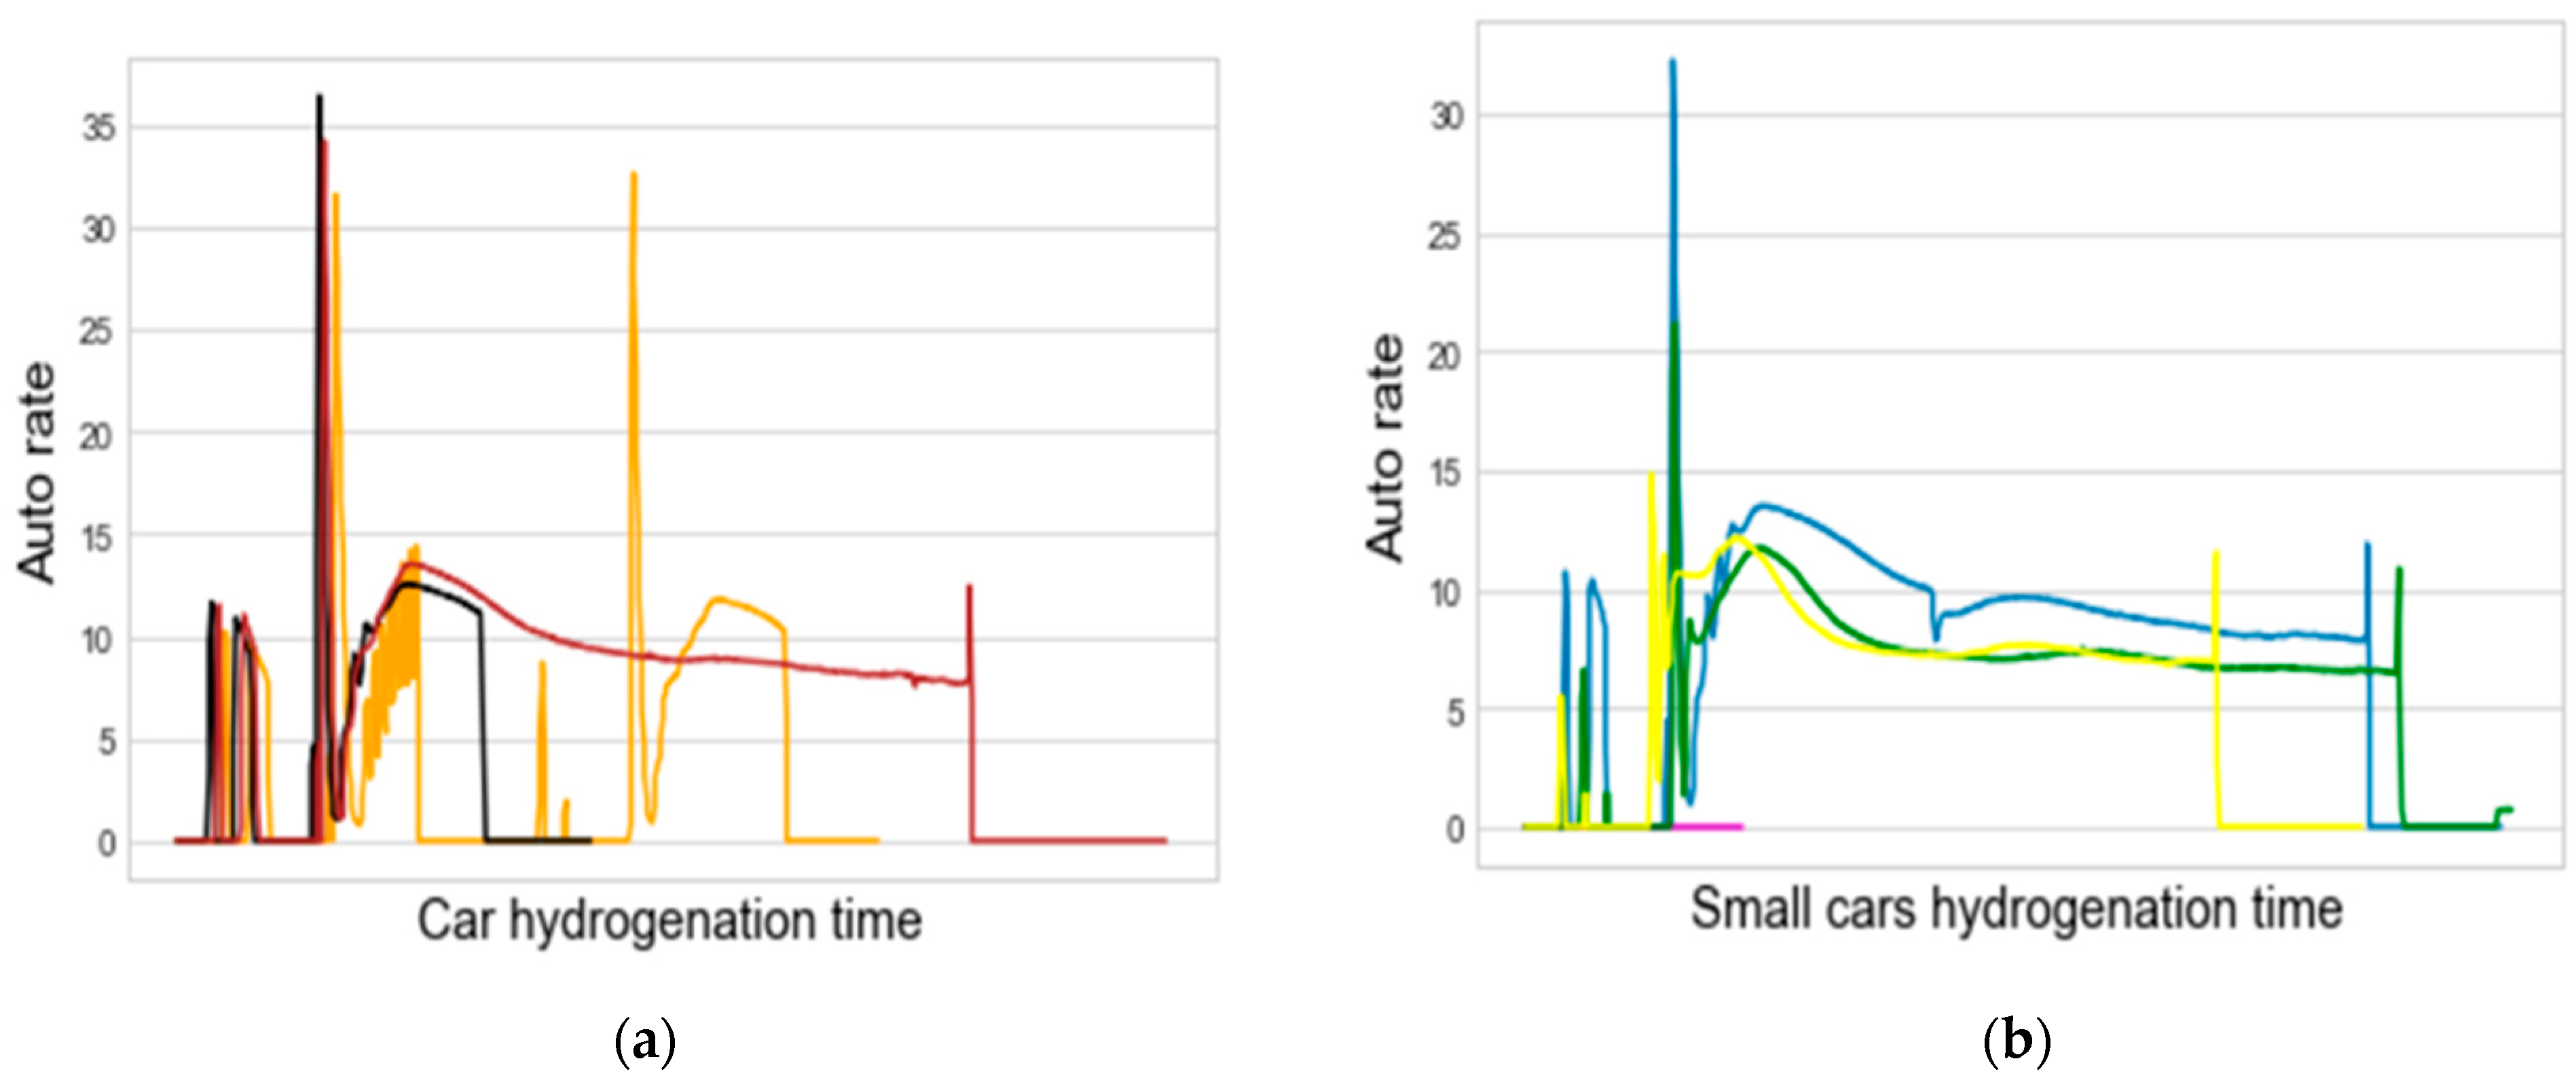
3.1. Hydrogen Data Analysis

By analyzing the types of hydrogenation data, we can obtain the important factors affecting hydrogen safety. A total of 1.206 million pieces of experimental data were used, and each set of data included nine different hydrogen data types related to hydrogenation safety, obtained by correlation analysis [16].
Any missing values were filtered out as abnormal data. Because missing data cause serious deviations in subsequent calculations, it is important to clean up and summarize the data before analysis, as shown in Table 1.
Through multiple linear correlation calculations, it was found that temperature had the greatest influence on the safety factor.

3.2. Hydrogenation Process of Hydrogen Station
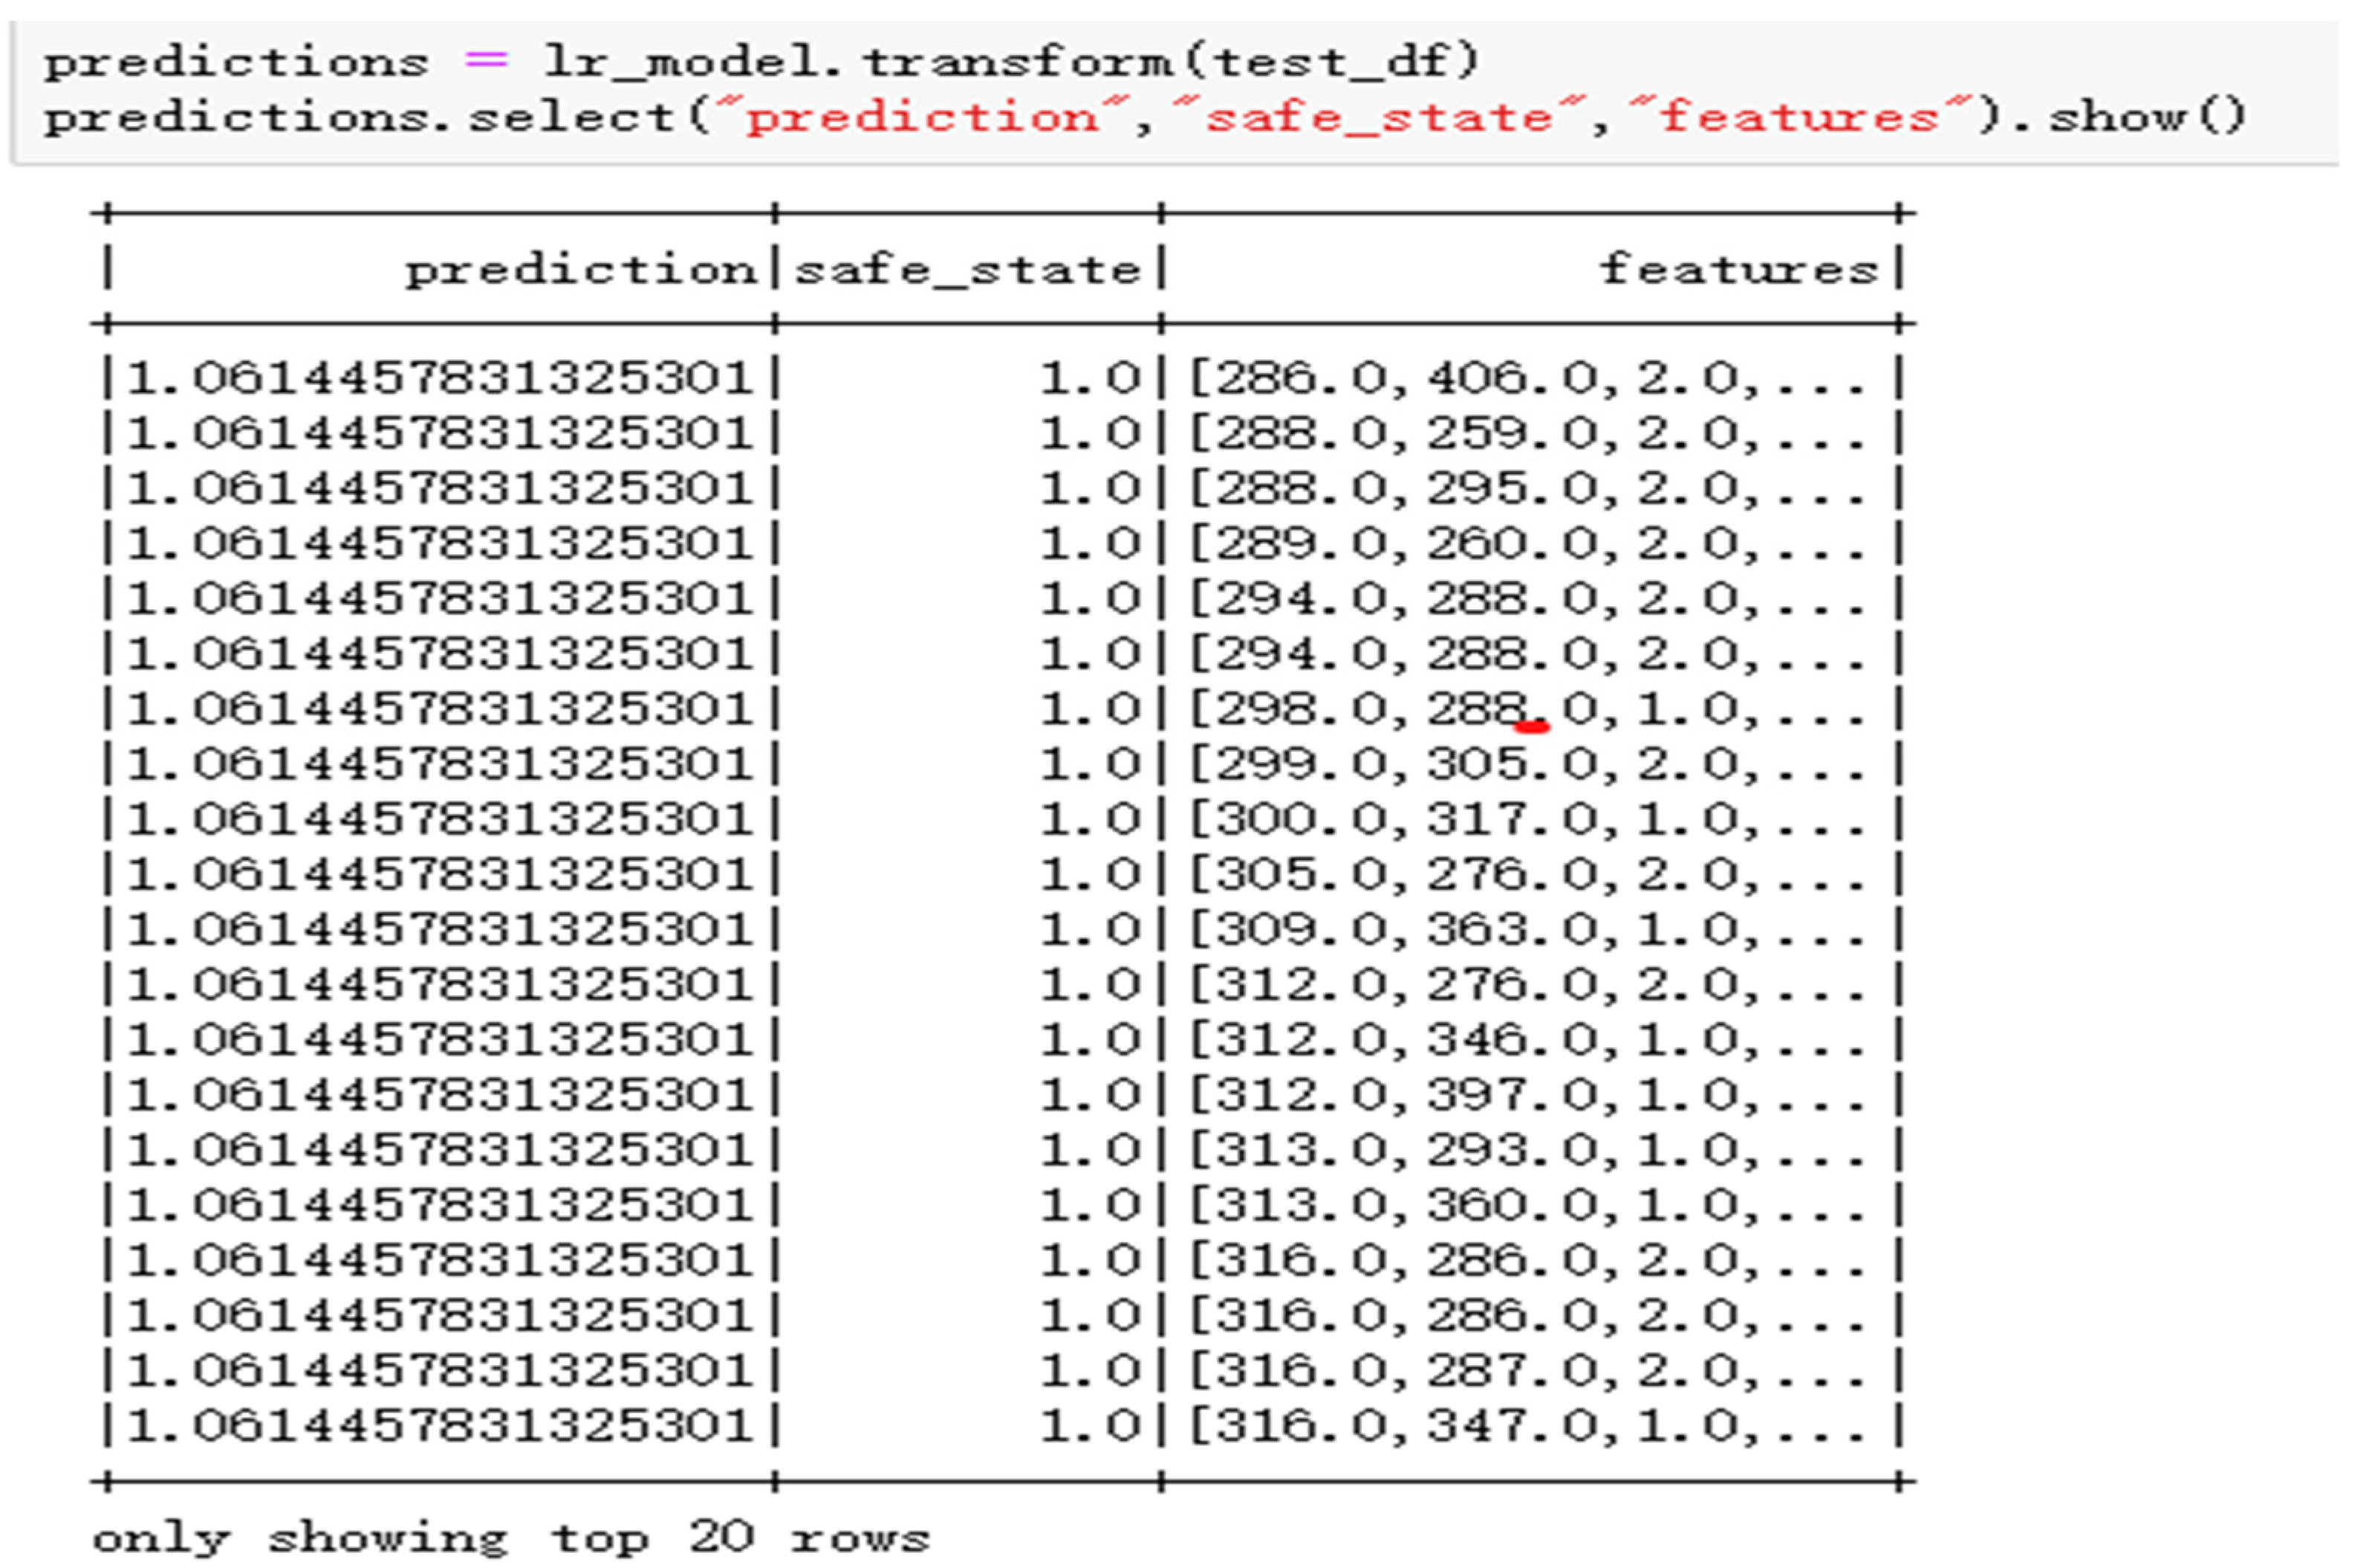
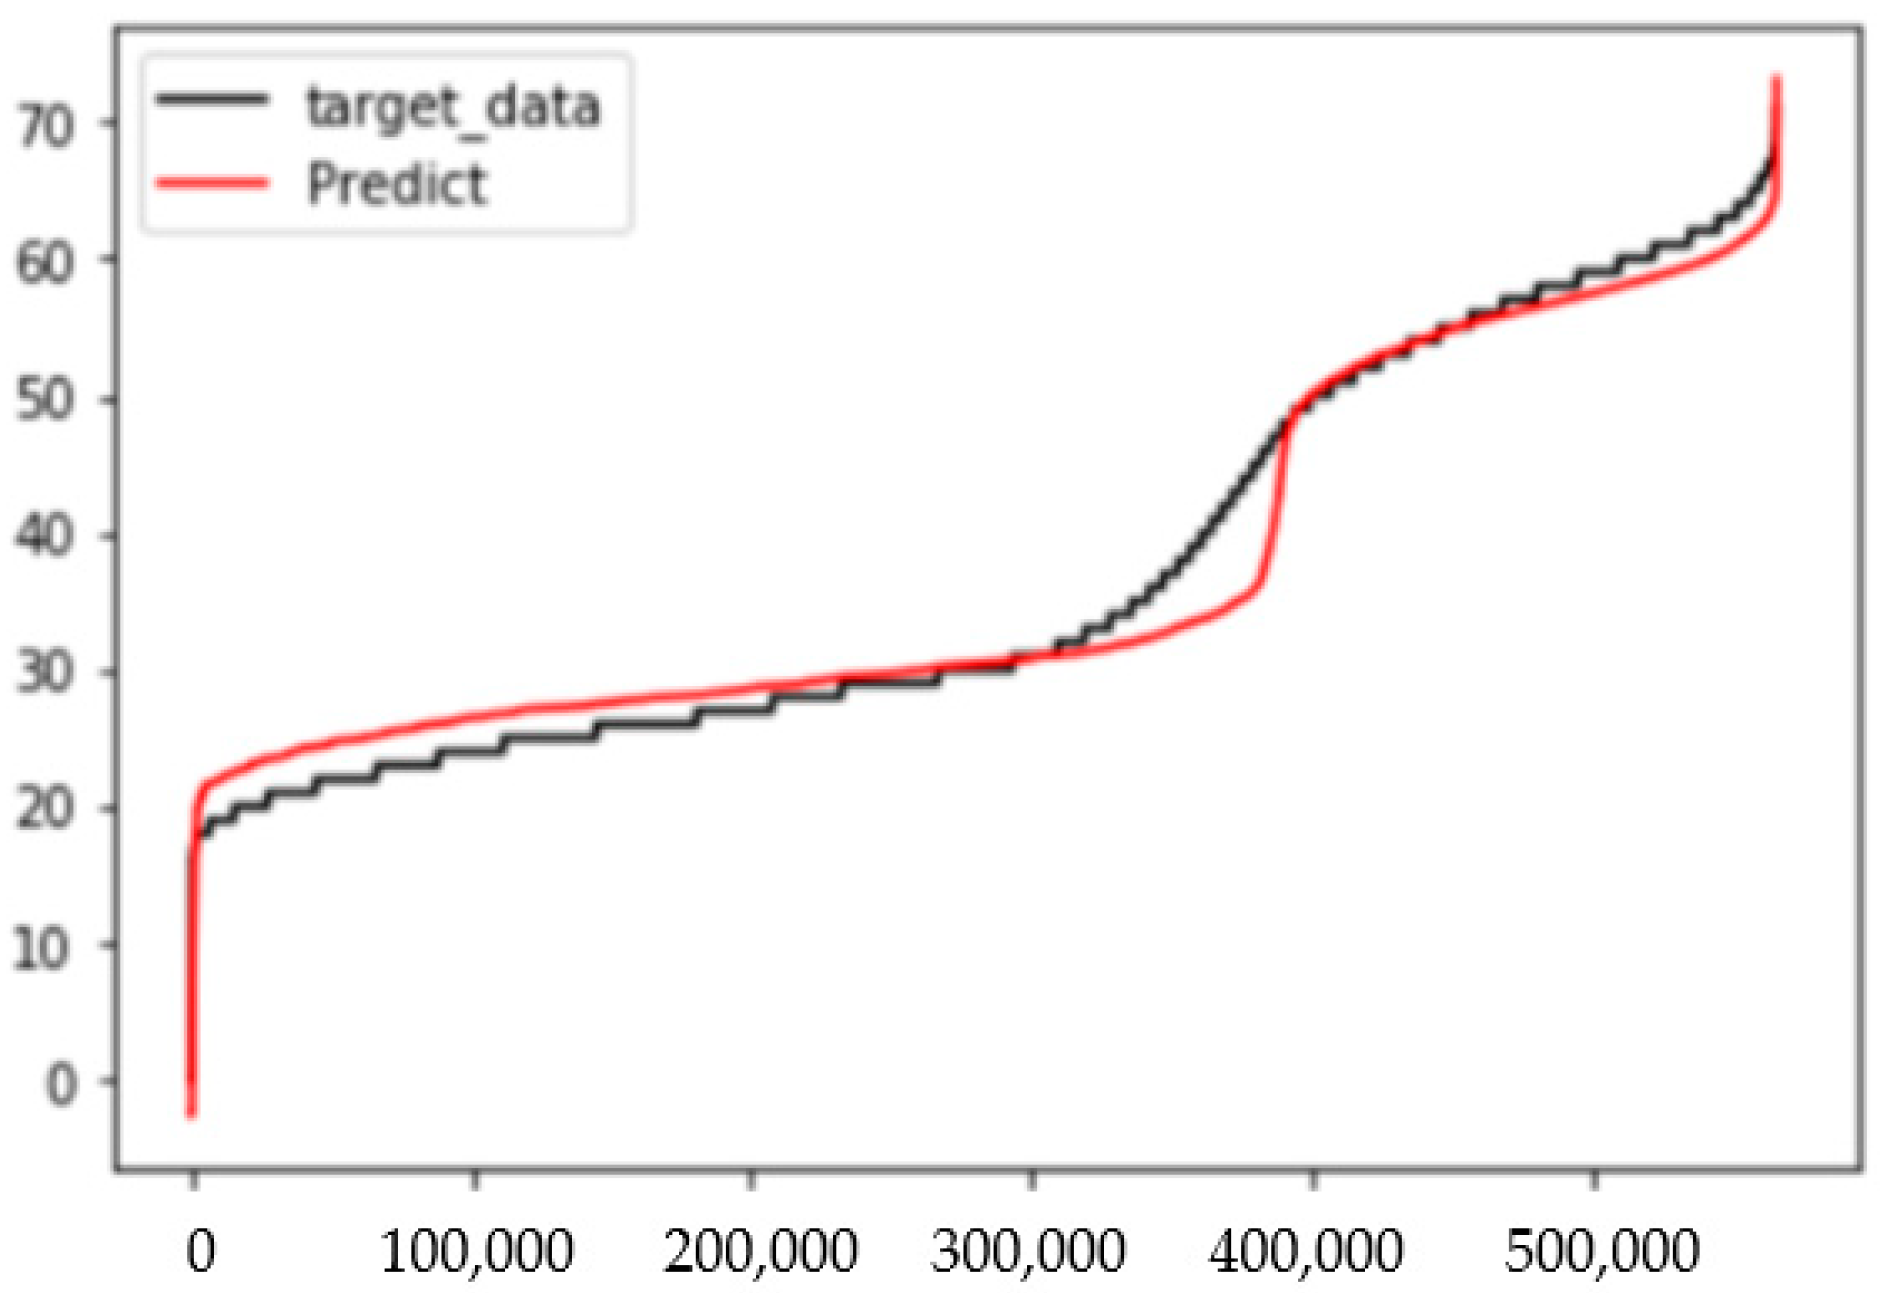
This work analyzed the hydrogenation data for the abovementioned hydrogen refueling station, and the hydrogenation process is described, which will be beneficial for matching the weight coefficient of the entire data and improving the accuracy of the algorithm [8,9]. The hydrogen refueling process for the hydrogen refueling station is shown in Figure 1.
System control is the safety hub of the hydrogen refueling station, with the function of checking all the current sensor data. When the real-time data exceed the predicted safety threshold or a developing trend suggests that they may exceed the safety value, an early warning is required to shut down the filling port and compressor of the hydrogen refueling station.
According to the hydrogenation process of the hydrogenation station shown in the figure above, the sensor collects five external data: the “time point” (indicated by the timestamp), “compressor pressure value”, “hydrogen pressure”, “hydrogenation temperature”, and “hydrogenation rate” at the filling port of the hydrogenator. Obtaining four fitting curves is helpful for early warnings for the trend and upper limit for hydrogenation safety in the actual external environment. Since the ultimate goal is to refuel the vehicle, it is necessary to analyze the hydrogen data when refueling the vehicle and reflect whether the current hydrogen refueling process needs to adjust the flow or air pressure according to these data to reduce the risk during hydrogenation.
The equipment studied in this work belongs to a 70 MPa gas filling station. As shown in the data analysis table in Figure 2 below, one can observe multiple fitting curves between the compressor’s interior’s pressure and the vehicle hydrogenation time. When the pressure of the compressor rises to 30 MPa, it can be said that the filling machine of the external vehicle has begun to work. As the pressure of the hydrogen storage tank and the compressor gradually stabilized, the compressor began to further pressurize. In the “car temperature” graph on the right, it can be observed that the car temperature also rose. By simulating more than 100,000 hydrogenation data, combined with hydrogenation safety assessments, the vehicle’s maximum hydrogenation upper limit temperature was determined to be 55 °C. If the temperature of the vehicle is higher than 55 °C during hydrogenation, the sensor should provide an early warning to cool the vehicle or reduce the hydrogenation flow.
The flow data for the filling machine are important reference data. According to the flow data for the filling machine, we can further judge whether there is an abnormal phenomenon in the current filling system. This study analyzed the sensor data, and divided the large-scale vehicles and the small- and medium-sized vehicles according to the fitting trend process for the filling machine. In Figure 3, the left graph shows the flow of the large vehicle filling machine. According to the multiple linear regression fitting, under the premise of ensuring that the incoming data had no safety hazards, the current flow rates of the filling ports of large vehicles ranged from 0 to 40, and there were two peaks. The overall data show a blocky peak shape. If the flow rate exceeds 40, there may be an abnormal situation in the current filling port, and the filling should be stopped and checked manually. For small and medium-sized cars, the maximum number of lines was 35, and there was only one peak, after which the rate stabilized and gradually decreased. If the peak value is exceeded, there may be an abnormal situation at the current filling port. The filling should be stopped, and manual verification should be carried out.

3.3. Results

According to the data summarized in Figure 1 and Table 1, the hydrogenation data and hydrogenation process were analyzed in detail. The hydrogenation cylinder pressurizes the gas to the high-pressure hydrogen storage cylinder and the medium-pressure hydrogen storage cylinder through the compressor; the two hydrogen storage cylinders do not work at the same time. Temperature sensors are distributed at the outlet of the compressor to detect the outlet temperature.
In this study, pyspark MLlib was used to analyze the algorithm, and the “safe state” was set as the prediction target; the rest of the data were set as the characteristic values [17,18]. The data were divided into a training set and test set for a numerical simulation. Finally, according to the stochastic gradient descent algorithm provided above, a minimum point convergence can be obtained, to find the optimal function x. In the algorithm, the data source of the input layer is related to the entire hydrogenation process. The model includes tanked hydrogen trucks, two hydrogen compressors, high-pressure compressors, and medium-pressure compressors, as well as a final gas dispenser and gas filling trucks. All the data are linked by the same time stamp, and there are temperature and pressure sensors in all the devices. The filling flow also involves the filling port. Monitoring the filling flow rate can most intuitively indicate whether the current external hydrogenation environment is safe. Using the pyspark MLlib algorithm for data analysis, the predicted safety factor and related feature label data can be obtained [19].
Based on the above values, the data in the training set can be used to predict the possible periodic values of each piece of equipment in the hydrogenation station during the hydrogenation process and predict whether the current state or future state is abnormal or dangerous according to the generated values. Predict the current state or future state, as shown in Figure 4.
In order to obtain an unbiased estimation of model performance, it is important to use unknown data to evaluate the test in the training process. Therefore, the data set needs to be divided into a training data set and a test data set. The former is used to train the model, and the latter is used to evaluate the generalization performance of the model on unknown data.
According to the feature results predicted by pyspark MLlib, the data were preprocessed, and the outlet temperatures of compressors A and B were extracted and stored in the cloud database for further analysis [20,21].
At the same time, the outlet temperatures of compressors A and B were transmitted from the back end to the front end, and the direction of data flow was displayed using the Echart function. When there is a fluctuation, it means that the filling machine is working for the vehicle and needs to be pressurized before filling. The following high-pressure temperature prediction and medium-pressure temperature prediction are the inlet temperatures of the high-pressure hydrogen storage tank and the medium-pressure hydrogen storage tank connected to compressors A and B, respectively, which are important characteristic indicators of system safety. Therefore, the calculation method, high-pressure temperature and medium-pressure temperature are visually monitored. As shown in Figure 5, we extracted the predicted feature data and filtered out the predicted equipment temperature of the compressor for visualization. The horizontal axis is the start time, and its unit is seconds.
The algorithm can predict real-time data based on historical data and provide early warnings based on the set safety threshold. If the predicted data exceed the safety threshold, an early warning is given to prevent danger. As relatively confidential places in China, hydrogen refueling stations have certain requirements for privacy. More detailed data that threaten confidentiality are therefore not suitable for display and analysis; therefore, this system does not take them into consideration.
Because different hydrogen refueling stations have different design drawings and general hydrogen refueling methods, the design of the large-screen display system for this system is different, so it cannot be flexibly applied to various hydrogen refueling stations and has certain limitations and shortcomings of inflexibility. The above shortcomings are not unable to be remedied or improved, but they require time and effort to address, as well as data and equipment support, especially regarding data requirements.
According to the research results, the use of machine learning can improve the accuracy with which the possible development of hydrogen leakage accidents is predicted. The optimization of the model is inseparable from the accuracy and comprehensiveness of the data. Considering the environment of hydrogen refueling stations on a large scale and introducing potential dangerous scenarios into algorithm analysis will greatly improve the prediction and research of hydrogen safety analysis.
Finally, the multiple linear regression model z = H(w) for the outlet temperature of compressor A is obtained, z is the outlet temperature of compressor A, β1 is the state of compressor A (1 means on; 2 means off), β2 is the inlet pressure of compressor A, and β3 is the pressure of compressor A. For the outlet pressure, β4 is the state of compressor B (1 means on; 2 means off), β5 is the inlet pressure of compressor B, and β6 is the output pressure of compressor B. β7 is the output temperature of compressor B, as shown in Theorem 8:
z = 6.84 β 1 ( 2.443 e + 08 ) ( β 2 β 5 ) + 0.054 β 3 + 1.74 β 4 0.06 β 6 + 0.804 β 7 + 15.346
Using multiple linear regression and spark milib for big data machine learning analysis, the obtained parameter values can be used for the linkage analysis of relevant hydrogenation machines in the process of vehicle hydrogenation. Finally, Z is the temperature of compressor A. When the temperature reaches a certain threshold, the current equipment should be treated with a decompression gradient to ensure safety. These parameters are flexible and changeable. They can be improved according to the workflows of different hydrogenation station equipment. Finally, this logic can be written into the central control machine for automatic control and reduce labor costs and human omissions. It is believed that the idea presented in this paper can be better developed in follow-up studies, providing greater assurance of safety in the hydrogenation process.

4. Discussion

Through the model established above, the equipment’s real-time data input model was compared with the prediction results, and the equipment control strategy was obtained. Taking temperature as an example, the operating temperature of the equipment was predicted according to the model, and the control strategy was specified to ensure that the equipment operated within a safe temperature range, ensuring safe operation.
To verify the credibility and validity of the results, gradient decision tree regression prediction was used to mine and analyze the important feature values of the data. The data were divided into a training set and test set in a 7:3 ratio. From the visualization system, various feature values were further predicted. To test the effect of model prediction, we simulated the predicted results and the actual target. Figure 6 shows the target gas temperature sorting results for the equipment. The test results are in line with the predicted results, which further proves that the model has practical application value.

Author Contributions

J.D.; methodology and writing—review and editing; W.Y., formal analysis; Y.R., data curation. All authors have read and agreed to the published version of the manuscript.

Funding

The work was supported by The National Key Research and Development Program of China (No. 2019YFB1505203).

Conflicts of Interest

The authors declare no conflict of interest.

References

  1. Intergovernmental Panel on Climate Change (IPCC). Climate Change 2014: Synthesis Report. Contribution of Working Groups I, II and III to the Fifth Assessment Report of the Intergovernmental Panel on Climate Change; Pachauri, R.K., Meyer, L.A., Eds.; IPCC: Geneva, Switzerland, 2014. [Google Scholar]
  2. Takahashi, Y. Fieldwork of Casa Rural de Espana: Energy Self-Sufficient Rural Cottage in Spain; International Workshop on Environment & Engineering: Hong Kong, China, 21–22 September 2014. [Google Scholar]
  3. Takahashi, Y.; Bahcevandziev, K.; Moreira, P.M. Fieldwork of Agriculture Science in North Portugal. In Proceedings of the JSME Conference on Robotics and Mechatronics, Kyoto, Japan, 17–19 May 2015. [Google Scholar]
  4. Jokela, T.; Cattiau, V.; Tavares, P.; Chevallier, L.; Bouscayrol, A.; Pereirinha, P.; Silva, L.; Trovao, J. Carbon Care Action of IEEE-VPPC’14. In Proceedings of the 2015 IEEE Vehicle Power and Propulsion Conference (VPPC), Montreal, QC, Canada, 19–22 October 2015; Volume 6, pp. 1–6. [Google Scholar]
  5. Skiba, R. Competency Standards for Emerging Hydrogen Related Activities. Open J. Saf. Sci. Technol. 2020, 10, 42–52. [Google Scholar] [CrossRef]
  6. Wu, W.; Jing, X.; Du, W.; Chen, G. Learning dynamics of gradient descent optimization in deep neural networks. Sci. China Inf. Sci. 2021, 64, 17–31. [Google Scholar] [CrossRef]
  7. Xie, T.; Zhang, C.; Xu, Y. Collaborative parameter updating method based on historical gradient mean variance reduction. J. Electron. Inf. Technol. 2021, 43, 956–964. [Google Scholar]
  8. Su, T.-S.; Lin, P.-R.; Shu, Y.-L.; Tseng, J.-M.; Kao, C.-S. Analysis of the Multi-Relationships and Their Structures for Safety Culture. Open J. Saf. Sci. Technol. 2012, 2, 89–97. [Google Scholar] [CrossRef] [Green Version]
  9. Shi, Z. Cognitive Machine Learning. Int. J. Intell. Sci. 2019, 9, 111–121. [Google Scholar] [CrossRef] [Green Version]
  10. Dou, Y.; Chen, S. Research on requirement description in program mining. Comput. Eng. Appl. 2006, 10, 46–49. [Google Scholar]
  11. Rei, M.-H.; Kao, Y.-L.; Yeh, G.-T.; Chen, S.-C. The Influence of the Hydrogen Supply Modes on a Hydrogen Refueling Station. Mod. Econ. 2020, 11, 867–880. [Google Scholar] [CrossRef] [Green Version]
  12. Powars, C.; Unnasch, S.; Kassoy, E.; Venkatesh, S.; Pope, G.; Williams, J. California Hydrogen Fueling Station Guidelines; TR-03-163a; California Energy Commission: Sacramento, CA, USA, 2004. [Google Scholar]
  13. Xi, M.; Pan, X.; Li, Z.; Ma, J. Research progress of fast filling of high pressure hydrogen for fuel cell vehicles. In Proceedings of the 2011 International Conference on Electric Information and Control Engineering, Wuhan, China, 15–17 April 2011; pp. 2545–2548. [Google Scholar] [CrossRef]
  14. Schneider, J. Fueling Specification for 70 MPa Compressed Hydrogen Vehicles; ARB Workshop: Sacramento, CA, USA, 2004. [Google Scholar]
  15. Werlen, E. Thermal effects related to H2 fast filling in high pressure vessels depending on vessels type and filling procedures: Modeling, trials and studies. In Proceedings of the 1st European Hydrogen Energy Conference, Grenoble, France, 2–5 September 2003. [Google Scholar]
  16. Zhang, Z.; Zhang, G.; Liu, Y.; Kang, Q. Present situation and Prospect of hydrogenation station construction in China. Energy Saving 2018, 37, 16–19. [Google Scholar]
  17. Feyz, M.; Hasti, V.; Gore, J.; Nalim, M. Large eddy simulation of hot jet ignition in moderate and high-reactivity mixtures. Comput. Fluids 2019, 183, 28–37. [Google Scholar] [CrossRef]
  18. Zhen, N.; Wang, F. Step size rule of stochastic recursive gradient algorithm in machine learning. J. Taiyuan Norm. Univ. Nat. Sci. Ed. 2020, 19, 6–10. [Google Scholar]
  19. Du, X.; Chen, Y. Comparison of different feature selection criteria of decision tree algorithm in spark mllib. J. Taiyuan Norm. Univ. Nat. Sci. Ed. 2020, 19, 37–39, 51. [Google Scholar]
  20. Deshai, N.; Sekhar, B.V.D.S.; Venkataramana, S. MLlib: Machine Learning in Apache Spark. Int. J. Recent Technol. Eng. IJRTE 2019, 8, 13. [Google Scholar]
  21. Selvam, S.; Muthukumar, P.; Sajeev, S.; Venkatramanan, S.; Chung, S.; Brindha, K.; Babu, D.S.; Murugan, R. Quantification of submarine groundwater discharge (SGD) using radon, radium tracers and nutrient inputs in Punnakayal, south coast of India. Geosci. Front. 2021, 12, 29–38. [Google Scholar] [CrossRef]
Figure 1. Hydrogenation process.
Wevj 12 00185 g001
Figure 2. (a) The relationship between the normalized hydrogenation time and hydrogenation truck pressure. (b) The relationship between the normalized hydrogenation time and hydrogenation car temperature.
Wevj 12 00185 g002
Figure 3. (a) The relationship between the hydrogenation rate and hydrogen time for small and medium-sized automobiles. (b) The relationship between the hydrogenation rate and hydrogenation time for large automobiles.
Wevj 12 00185 g003
Figure 4. Predicted values for various devices.
Wevj 12 00185 g004
Figure 5. Predicted values for various devices.
Wevj 12 00185 g005
Figure 6. Test model fit using the test set.
Wevj 12 00185 g006
Table 1. Hydrogen data description.
NameStddevMax
Pressure_in_a65.337350.0
Pressure_out_a160.751420.0
Temp_out_a15.32068.0
Pressure_in_b30.446192.0
Temp_out_b10.07867.0
High_pressure_out32.632412.0
Mid_pressure_out41.676414.0
Safe_state0.2192.0
Hydrogenation time2.4499
Publisher’s Note: MDPI stays neutral with regard to jurisdictional claims in published maps and institutional affiliations.

