Abstract
For the capacity estimation problem of cells in series-retired battery modules, this paper proposed three different methods from the perspective of data-driven, battery curve matching and recession characteristics for different applications. Firstly, based on the premise that the battery history data are available, the features of the IC curve are selected as input for the linear regression models. To avoid multicollinearity among features, we apply a filter-based feature selection method to eliminate redundant features. The results show that the average errors with Multiple Linear Regression are within 1.5%. Secondly, for the situation with a lack of historical operating data, the battery-curve-matching-based method is proposed based on the Dynamic Time Warping algorithm. This method could achieve the curve matching between the reference cell and target cell, and then the curve contraction coefficients can be obtained. The result shows that the method’s average error is 2.34%. Thirdly, whereas the tougher situation is that only part of the battery curve is available, we present a substitute method based on the battery degradation mechanism. This method can estimate most of the battery plant capacity through the partial battery curve. The result shows that the method’s average error is within 2%. Lastly, we contrast the applicability and limitations of every method based on the retired battery test data after deep cycling aging.
1. Introduction
The retired LIBs usually retain 70–80% of their original capacity. Scrapping and directly recycling is a huge waste of resources. The retired LIBs can be used in charging stations, communication base stations, mobile charging cars, low-speed EVs, energy storage systems (ESSs), and other applications with lower performance after assessment and sorting. Thus, they have considerable economic and environmental value. The reuse of retired LIBs is called echelon utilization [1] or second-life application. The second-life application can extend the service life of LIBs, maximize the value of the life cycle and reduce the running cost. It can also alleviate the recycling pressure caused by large-scale LIB retirement and reduce the total development and utilization of raw materials for LIBs [2]. Due to the difference in aging characteristics and the increasing inconsistency of batteries in long-term service and varying operating conditions, not all LIBs can be used in second-life application. Thus, the battery performance evaluation before second-life application is very necessary. The state of health estimation methods of the LIBs can be divided into four types at present. The first method is to measure directly. The performance parameters, such as battery capacity, can be obtained by full-charge or discharge, and the resistance can be obtained through the Hybrid Pulse Power Characterization test [3]. Further, the origin voltage or current signals can be transferred to ICA and DVA, which can express battery aging characteristics and state feature obvious [4]. The model-based method can represent the dynamic characteristics of LIBs in different aging stages and different current excitation. Several common battery models include electrochemical models, and equivalent-circuit models often contain a large number of parameters, which may have a strong dependence on battery capacity. The dynamic model parameters can be obtained through some observers, such as the multi-scale extended Kalman filter [5], the particle filter (PF) [6] and the nonlinear predictive filter [7]. However, it is difficult to establish an accurate model for retired batteries, as testing cost and parameters differed considerably. The data-driven methods are based on battery historical data, and some machine learning (ML) or artificial intelligence (AI) algorithms are used to estimate SOH by learning the relationship between features of battery operation data (V, I, T) and battery SOH (capacity, resistance, energy). The method has become more and more popular for its flexibility and the great nonlinear curve fitting capability. Those methods include linear regression (LR) [8], support vector machine (SVM) [9], Gaussian process regression (GPR) [10], artificial neural network (ANN) [11] and some deep-learning algorithms [12]. Contrastingly, the historical operating data before the decommissioning interface of the retired battery is usually unknown and the aging characteristics of second-use batteries are different due to different operating conditions, which bring difficulties to the capacity estimation of the battery. Methods for obtaining additional test data to quickly and accurately evaluate the battery capacity when no historical monitoring data for retired LIBs are available is the key to achieving battery second-life application.
In this paper, we take the retired LFP battery modules as the research object. Given the fast estimation of the cell capacity, three estimating methods that need small batch data are proposed to achieve the fast estimation capacity of retired batteries. First, the IC curve is derived and the peak area value is extracted as a capacity feature. Then, the filter method is selected to choose the key features and the linear regression is applied to estimate the capacity. Through this method, the battery capacity can be evaluated with some sampling data. Furthermore, for batteries that do not have historical monitoring data, we present a battery-curve-matching method and a degradation-mechanism-based method to estimate the capacity. The curve-matching method obtains the curve-matching relation between the reference cell and target cell. Then, the contraction coefficients can be obtained through calculating the slope of the warping path, then the capacity can be easily estimated. The degradation-mechanism-based method can estimate the capacity through the changes of the partial battery curve; compared to the above methods, it needs a narrower common voltage range in the module. The effectiveness of the proposed methods has been validated through experimentation.
The remainder of this paper is structure as follows: Section 2 gives a brief introduction of the experiment platform and test produced. Section 3 describes the ICA method, the principles of linear regression and the capacity estimation framework for retired LIBs. Section 4 introduces the principles of the dynamic time warping algorithm and the curve-matching-based method is proposed. The final part of this section describes some interesting decay trends of LFP cells, and the mechanism-based method is purposed. Experimental results, validation, and discussion are in Section 5; Section 6 offers a conclusion.
2. Experiment Setup
In this study, six retired LFP battery modules are obtained from an electric bus. Each battery module consists of 8 series-connected battery cells, the rated capacity is 200 Ah, and the rated voltage is 25.6 V. The decommissioning interface rated capacity of the battery module is 150 Ah. As shown in Figure 1, the experiment platform is composed of an Arbin BT-2000 module tester and a cell tester. The Arbin BT-2000 module tester can charge or discharge up to 100 A, with a maximum voltage of 60 V. All of the test was conducted in a constant temperature (25 °C) in a DGBELL temperature cabinet with high precision. The cell tester can charge or discharge with a maximum voltage of 5 V and a maximum of 20 A.
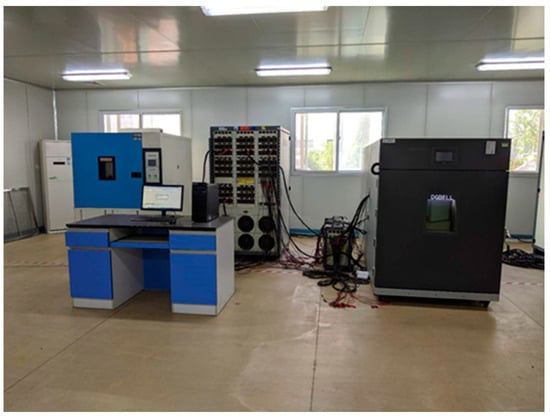
Figure 1.
Battery pack test platform.
To obtain battery pack and cell decommissioning interface performance, the module level and cell level battery performance test was conducted. The battery packs are charged/discharged with constant currents: (1) charge at 0.1 C (15 A) until any cell’s voltage reaches 3.65 V, then it rests for 1 h; (2) discharge at 0.1 C until any cell reaches 2.5 V, then its rests for 1 h. In the cell capacity tests, the cells are charged/discharged with the same current rate (0.1 C) as the battery module, and the cut off voltages for the charge/discharge processes are 3.65 and 2.5 V, respectively. Between charge and discharge regimes, batteries are set to rest for 1 h. Batteries are cycled three times and the charge capacities of batteries in the second cycle are considered to be the maximum available capacities. In order to get battery module cycling aging data, two retired modules are selected to carry out the cycle life tests under the peak shaving operating condition. In this condition, the battery state of charge (SOC) operates in the range of 10–90%. The packs are charged/discharged with constant currents. The charge current rate is 3/8 C (56 A) and the discharge rate up to 1/2 C (75 A). We conduct the cell performance test and module performance test after the 1000th cycle; the test processes are the same as above. Owing to the fact that one module expanded after the 700th cycle, the cycle life test for it was aborted. Through the battery test, we get the 48 cells’ interface capacity data, the 8 aged cells’ capacity data, module interface capacity data and aged capacity test data. Some of the cells’ interface capacity data are shown in Figure 2. The capacity is varied in those retired cells, the maximum capacity is 213.34 Ah, the minimum capacity is 147.8 Ah, the range is 65.5 Ah and the standard deviation is 19.34 Ah.
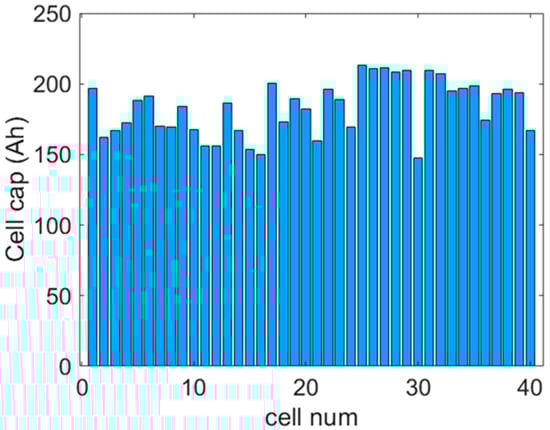
Figure 2.
Interface capacity of retired LFP batteries.
3. IC-Features-Based Method
The causes of capacity decline in an LFP battery can be roughly divided into active material loss, lithium-ion inventory loss, and internal resistance increase [13]. These decay processes are difficult to obtain directly from the charge–discharge curve. The IC curve can transform the voltage plateau on the original V–Q curve into redox peaks that are easy to analyze and identify. Then, the degradation of each part of the battery curve can be characterized by the characteristic information of each peak. The corresponding relationship between the IC curve and the V–Q curve of an LFP battery is shown in Figure 3. The voltage platform of the battery shows five characteristic capacity peaks on the IC curve. The area of each peak can represent the capacity of each platform on the battery curve, and the position changes of the peak can represent the change of the internal resistance of the battery. From the shape of the IC curve, it can be found that most of the capacity of the battery is located in the platform area of the battery, and the fast polarization section at both ends accounts for a small proportion.
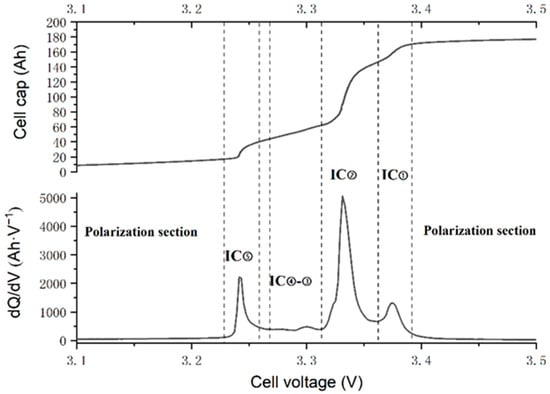
Figure 3.
IC curve and V−Q curve of LiFePO4 battery.
In order to explore the aging characteristics of retired batteries, we obtained the cycle aging data of second-life application battery packs under laboratory conditions. Then, a cell in the battery pack was selected to analyze its IC curve decay trend, and the battery IC curves under different cycle conditions are shown in Figure 4. The decline of the cell can be characterized by the obvious decline of the first peak and the decline of the second peak on the IC curve. However, the other positions are basically unchanged or change little. Therefore, the conjecture that the capacity decline of the battery is dominated by peak ① and peak ② is proposed, which brings inspiration to feature selection based on the IC curve. In this paper, the IC peak area (PA) characteristics of each cell were extracted, and the correlation scatter diagram and correlation thermodynamic diagram (Figure 5a) were drawn based on the initial performance test data of a batch of retired batteries. From the correlation scatter diagram, we can find that PA ① and PA ② have a strong linear correlation with battery capacity, while PA ⑤ has a weak correlation with battery capacity. In the meantime, there is a strong correlation between PA ② and PA ⑤, which will be discussed in detail in Section 4. In order to quantitatively describe the correlation between the features and battery capacity, Pearson correlation coefficient was introduced. The correlation coefficient between battery capacity and the features of IC curves is calculated using Equation (1):
where and represent two sets of data, represent the covariance between and , and and represent the standard deviation of two sets. represent mathematical expectation and , represent the mean value of each set. The results of the correlation coefficient between the battery capacity and features of IC curves and the coefficient between features are presented as a variable correlation heatmap in Figure 5b. The results show that PA ① has a strong linear correlation with capacity, PA ② has a moderate correlation with capacity, and PA ⑤ only has a weak correlation with capacity. Besides, PA ② and PA ⑤ show obvious collinearity, which should be avoided. Considering the IC curve decay trend as shown in Figure 4, PA ② may decrease obviously in the recirculation test, and there is no clear correlation between PA ① and PA ②. PA ① and PA ② are selected for regression.
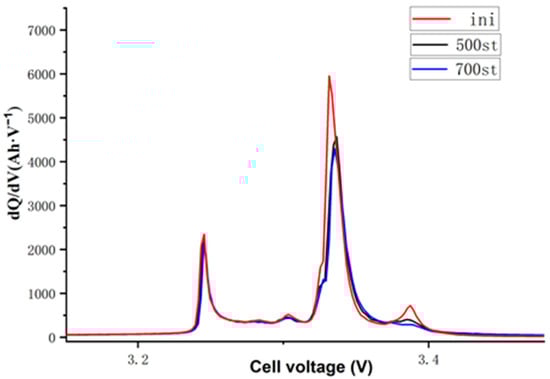
Figure 4.
IC curve decay trend.
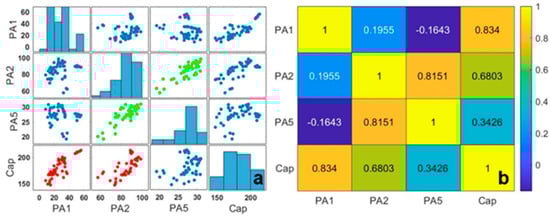
Figure 5.
Correlation scatter diagram (a) and correlation thermodynamic diagram (b).
Since the battery IC features have a linear correlation with the battery capacity and a limited sample size, the binary linear regression models are very well suited to capacity estimation, and the univariate linear regression is for comparison. Normally, a linear model has the following form:
where X is the input variable for the predictor, and is called the coefficient. If n > 1, the regression is called the multivariate linear regression model. Each is a vector of feature. The common parameter estimation method is the least square method; through this method, we can estimate the parameter from the train set through the follow equation:
In this paper, we avoid the multicollinearity problem by applying a feature filter method. So, we can get the coefficient by Equation (3). The model is trained based on forty batteries’ retirement interface capacity test data, and the other eight cells are for model validation. The capacity characteristic decision surface of the binary regression model is shown in Figure 6.
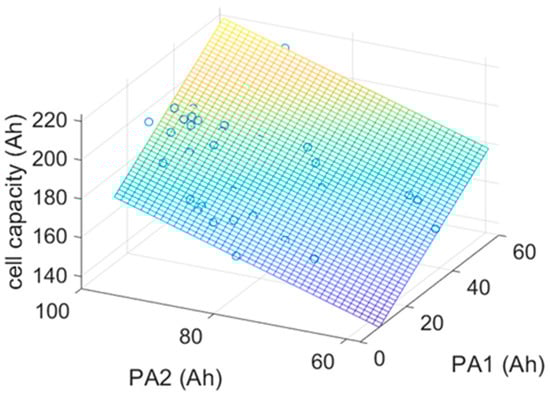
Figure 6.
Capacity characteristic decision surface.
4. Capacity Estimation Method Based on Partial Battery Curve
4.1. Curve-Matching-Based Method
The loss of lithium inventory and the loss of active materials will not affect the full-cell voltage curve in the full life cycle of the cell. Even the retired battery can still maintain the shape invariance of the full-cell voltage curve [14]. Based on this assumption, we can compare the voltage curve difference between the aging battery and the new battery by the curve-matching method. The Dynamic Time Warping Algorithm (DTW) is often used in audio processing. The algorithm obtains the best matching relationship between two sequences and the corresponding warping path through the idea of dynamic programming [15]. Two signals with equivalent features arranged in the same order can appear very different due to differences in the durations of their sections. DTW distorts these durations so that the corresponding features appear at the same location on a common time axis, thus highlighting the similarities between the signals.
The general steps of the DTW algorithm can be explain as follows:
Consider the two 1-dimensional signals,
is the distance between the sample of X and the sample of Y. For the one-dim series, the is the absolute value of the difference of two points. The algorithm, firstly to distance, stretches X and Y onto a common set of instants such that a global signal-to-signal distance measure is smallest. Initially, the function arranges all possible values of into a lattice of the form. Then, distance looks for a path through the lattice—parameterized by two sequences of the same length such that is the minimum and the distance paths start at and end at must follows the principles below:
- Vertical moves: (m,n) → (m + 1, n);
- Horizontal moves: (m,n) → (m, n + 1);
- Diagonal moves: (m,n) → (m + 1, n + 1).
This structure ensures that any acceptable path aligns the complete signals, does not skip samples and does not repeat signal features. Additionally, a desirable path runs close to the diagonal line extended between and .
The battery-curve-matching example is shown in Figure 7. The reference sequence is a longer battery charge curve and the object sequence is a shorter one. Additionally, the DTW algorithm can find the best match between the reference and object through the translation, rotation and scale of the shorter sequence. Then, the warping path is obtained and the cell capacity scaling coefficient can be calculated form the slope of it as Figure 8 shows.
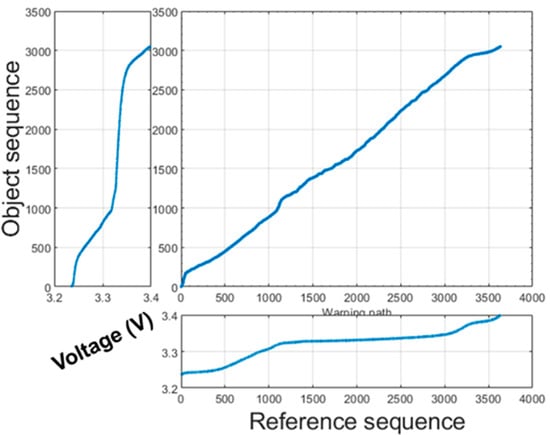
Figure 7.
The curve-matching example.
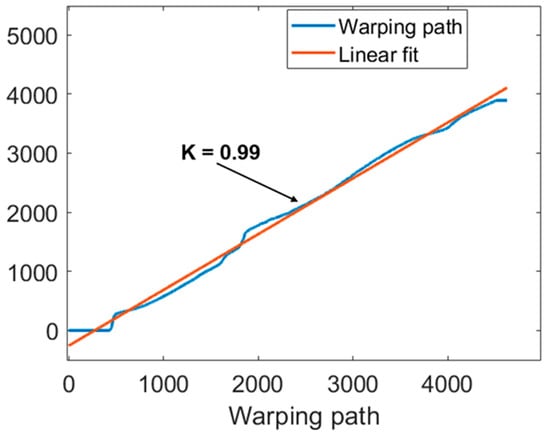
Figure 8.
The warping path and the slope of linear fitting.
With this method, the scale coefficient of the voltage curve can be obtained by comparing two battery charging or discharging curves, and then the capacity shrinkage coefficient of the battery (platform area) can be obtained, which can help achieve the estimation of battery capacity. In order to obtain the expansion coefficient of the platform area, a simple linear fitting was used to obtain the slope corresponding to the warping path, which is shown in Figure 7. This slope is approximately the platform area expansion coefficient of the target battery relative to the reference battery, and the capacity of the target battery can be obtained by the following formula:
In this formula, is the target battery capacity estimation, is the reference battery capacity, and is the slope of the warping path.
4.2. Battery Decay Mechanism-Based Method
DuBarry et al. [16] proposed an LIB health state estimation method based on the half-battery curve, which is based on the fact that the full-battery curve of the battery can be obtained by the superposition of positive and negative half-battery curves. This method could realize the simulation of the battery charging curve under different aging modes by analyzing the changes of positive and negative half-battery curves. Based on this method, the causes and performance of battery degradation can be further subdivided, and the basic mode of it can be inferred according to the change of battery IC curve. According to the degradation trend of this batch of batteries and the conclusion obtained from the analysis in Reference [17], the degradation of batteries can be explained as follows:
For the LFP battery, the main reason for the initial decline of the battery is the lithium-ion loss. The effect of negative electrode material loss on the battery can be ignored, as the battery has an excess of negative electrodes. In this stage, the decline of the cell can be represented as the fast decline of peak ① When the peak ① declines to a certain extent, the negative electrode material decline will have a significant influence on battery capacity. The contraction of the negative half-cell curve will affect all voltage platforms, especially the proportional contraction of the ⑤-② platform. At this time, the decline of the battery will be accelerated to a certain extent, and the dominant factor of the decline will be the combination of the loss of negative electrode material and the loss of a lithium ion.
Based on the analysis above, the degradation of a battery can be simply characterized by two parts. The first part is the capacity change of the high platform of the battery, and the other is the capacity change of the ⑤-② platform dominated by the negative electrodes of the battery. Therefore, all the capacity changes of the negative dominant platform can be quantitatively obtained only by the change proportion of peak ②. This conclusion can be proved by the green mark in Figure 5. Figure 5 shows that there is a strong linear relationship between PA ⑤ and PA ②. Figure 9 compares the ratio of the PA ② area of the battery and the capacity of the negative platform area, proving the positive proportional relationship between them. Thus, the capacity change of the anode leading platform can be evaluated by the area change of the main peak. According to this, the capacity estimation method proposed in this paper can be expressed as follows:
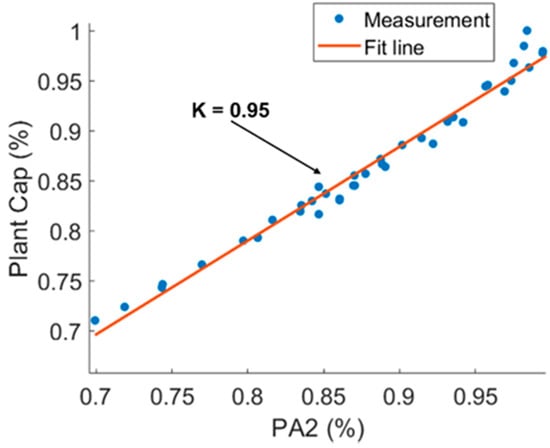
Figure 9.
The relation between change of PA ② and the change of PA ⑤-② (Plant Cap).
In Equation (7), is the IC peak area corresponding to the negative leading platform, is the area corresponding to PA ①, and is the area corresponding to the high polarization section. can be further expressed as:
In Equation (8), is the PA ② of the cell that is to be estimated, is the PA ② of the reference battery, and is the area corresponding to the leading platform of the negative electrode of the reference battery.
It is necessary to estimate the complete PA ① according to the incomplete peak area data, as the PA ① of the battery to be estimated may be incomplete. In this paper, we estimate the complete peak area by using the ratio of the incomplete part area to the part of the reference battery corresponding to the same voltage interval (peak area) based on the approximate invariance of battery peak width and the similarity principle. The step can be represented as follows:
In Equation (9), is PA ① for the battery to be estimated, is the measured part of PA ①, is the part of PA ① corresponding to the reference battery, and is the full PA ① of the reference battery.
To analyze the proportion of each part capacity, this paper plots the IC curve of a retired battery, as shown in Figure 10. This part of the high part capacity (, blue) occupies a small part of the battery capacity and changes a little, which can be considered a fixed value. With this method, after obtaining the complete charge (discharge) curve of a reference battery in the module, the capacity of the remaining cell and the cell after cycle aging can be estimated.
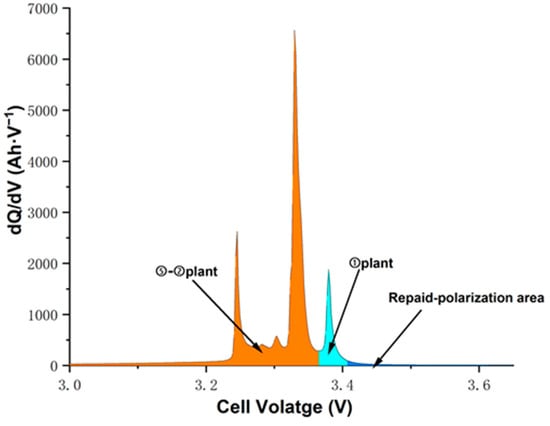
Figure 10.
IC curve of retired LiFePO4 battery.
5. Results and Discussion
In order to verify the effectiveness of the proposed methods, another set of battery pack data outside the training set is taken as the verification set. In this paper, there are two battery verification sets: the first is the interface capacity set of the model and the other is the aged battery pack capacity data set. The cell capacity data set is shown in Table 1. To ensure data consistency, we use the same validation data to verify the accuracy and efficiency of different methods.

Table 1.
The cell capacity of verification set.
For the data-driven method, we extract the PA ① and PA ② features from module capacity test data, and the cell capacity test results are for error analysis. The battery capacity estimated results, and the estimate errors are shown in Figure 11. It can be found that the binary regression model has a better estimation effect compared to the single-element regression model. The result shows that the maximum relative error of the binary regression model is 5%, and the average error is within 1.5% while the single-element regression model error is 6.8%. This is because the retired battery often has different ageing characteristics. In this paper, the single-element regression model only focuses on PA ①, which represents the LLI of the battery and ignores the impact of the loss of active material. For the data set after 1000 cycles, the estimated results and the estimate error are shown in Figure 12. The estimation error is larger than the result before the aged data, and the average error is 3.66%. This is because PA ⑤ and PA ③–④ in the IC curve also show a significant decline with the deepening of battery ageing, and the binary regression model does not consider this impact.
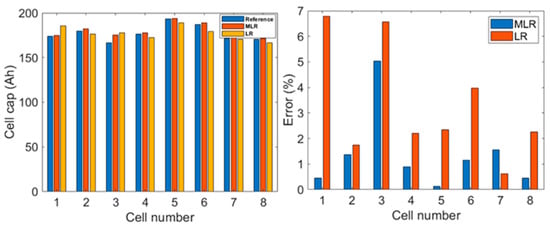
Figure 11.
Estimation results and estimation error with data-driven method (interface data).
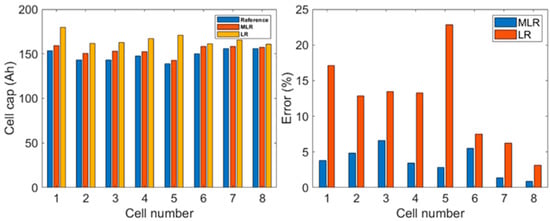
Figure 12.
Estimation results and estimation error with data-driven method (aged data).
In a word, the binary regression model can quickly evaluate the retired capacity in different aging states without relying on the complete battery curve data, but the method needs data to train the model, so it is difficult to apply when there is not enough initial battery training data.
For the curve-matching-based method, we select the #5 cell in the battery pack as the reference battery, and the reference charge curve is extracted. Because the cell charge curve is incomplete, we extract the common cell voltage range, which is about 3.25 to 3.4 V. Then, the platform area expansion coefficient is obtained. The estimated results and the relative error based on interface data are shown in Figure 13. The estimation results show that the method has a general fitness for the battery capacity estimation in this module. The average error is within 2.5%. However, the maximum relative error is up to 11%. In order to find the error source, we get the warping path (Figure 14) and the IC curve (Figure 15).
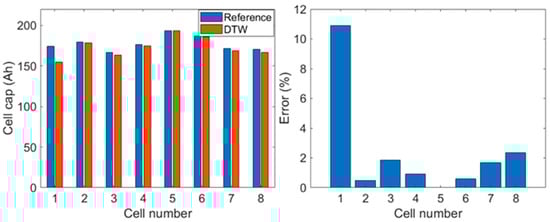
Figure 13.
Estimation results and estimation error with curve-matching method (interface data).
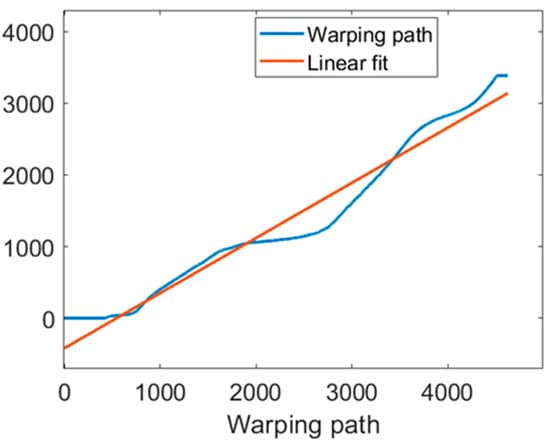
Figure 14.
Curve-matching relation between 1# and 5#.
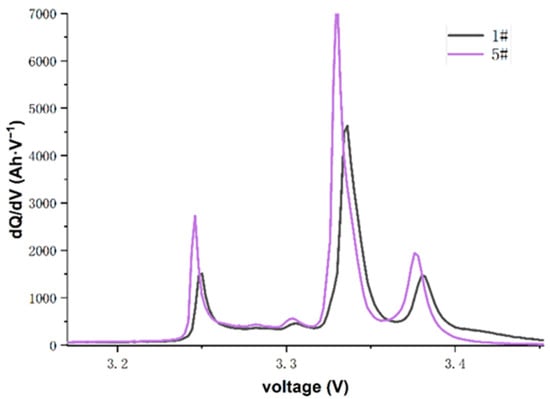
Figure 15.
The IC difference between 1# and 5#.
We find that the warping path is more winding and the IC curve is partly mismatched.
It says that the battery curve deformation is obvious. Furthermore, the IC peak position moves to the high-voltage side and the repaid-polarization area is much bigger than the other cell. These two factors are the main error sources because we regard the repaid-polarization area as an approximately invariant value. The estimated results and the relative error based on aged data are shown in Figure 16. The estimation error is also larger than the result before the aged data. The average error is 4.19%. This result indicates that the inconsistency of battery curve shape is more and more obvious with the degradation of retired batteries. The difference based on aging characteristics tended to be wider.
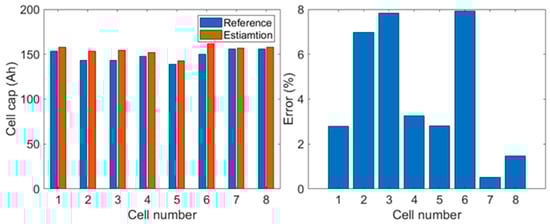
Figure 16.
Estimation results and estimation error with curve-matching method (aged data).
For the decay mechanism-based method, the #5 cell in the battery pack as the reference battery and , and is obtained from the cell capacity test. The estimated results and the relative error based on the interface data are shown in Figure 17. The maximum relative error is within 5%, and the average error is within 2%. For the aged batteries, the maximum relative error is 6.7%, and the average error is within 3.2% (Figure 18). The reason for the larger error of estimation of 5# (after 1000 cycles) is that the high part capacity of the battery is increasing significantly.
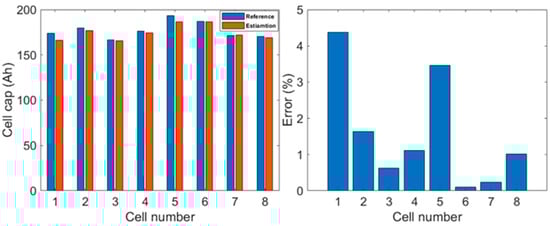
Figure 17.
Estimation results and estimation error with mechanism-based method (interface data).
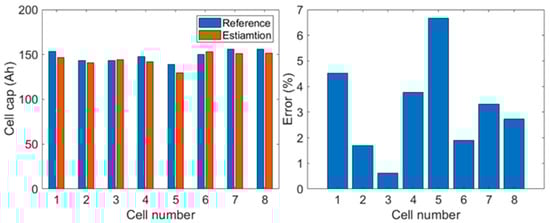
Figure 18.
Estimation results and estimation error with mechanism-based method (aged data).
To compare the performance of three different battery capacity estimation methods, this paper gets an error statistics table for three methods, as shown in Table 2. It can be found that the method of multivariate linear regression has the minimum average error and then the degradation-mechanism-based method. The performance is approximately the same between MLR and the degradation-mechanism-based method from the facet of average error. The accuracy of the method of one-dimensional regression is the worst, and the results of the curve similarity method are also relatively general.
Table 2.
Error statistics table for three methods.
From the aspect of possibility and practicability, the multiple regression method is a data-driven method, which needs a model pre training. Therefore, it may be difficult to implement under some historical data missing conditions. The other methods do not rely on historical data. As long as the complete charge and discharge data of a battery are obtained, the single battery in series can be quickly evaluated. However, the battery platform area curve that needs to be matched must be complete. In actual situations, it is also difficult to obtain a complete charging section due to the differences in battery consistency and operating conditions. At the same time, the mechanism-based method does not require a large amount of historical data. It also does not require complete charging data of the aged battery. To sum up, the degradation-mechanism-based method has the advantages of small calculation amount, low data dependence and strong applicability, so it is very suitable for the capacity estimation of retired batteries. Future work will focus on battery pack capacity estimation and the regularity of consistency changes based on the capacity estimation methods and battery pack cycle data.
6. Conclusions
This work focuses on the estimation of the capacity of retired LFP batteries. Six LFP retired battery modules were selected to conduct a performance test, and two of them were selected to conduct a cycle life test under peak shaving operating conditions. Based on the test data, we propose three different methods to estimate the battery capacity. The first method is the IC-feature-based data-driven method and the other is based on the partial battery curve, which does not rely on historical data. After validation and discussion, the main conclusions can be summarized as follows:
- When historical data are available, the data-driven method based on battery capacity features is still a good choice for retired battery capacity estimation, but attention should be paid to feature selecting in the modeling process to make the method suitable for batteries with deep aging degree.
- When there is little or no historical data, the method based on curve matching proposed in this paper can realize the rapid estimation of battery capacity. However, the estimation accuracy of battery algorithms with a large aging difference may be reduced to a certain extent.
- Finally, the capacity estimation method based on the charging voltage segment mentioned in this paper can estimate most of the capacity by extracting voltage segment information. This method has stronger applicability than the DTW algorithm. So, the mechanism-based method can be used to estimate the capacity under some energy storage conditions.
Author Contributions
Conceptualization, L.M. and J.W.; methodology, L.M.; software, L.M.; validation, J.W.; investigation, J.C.; resources, C.Z. and K.W.; data curation, L.M.; writing—original draft preparation, L.M.; writing—review and editing, J.W. All authors have read and agreed to the published version of the manuscript.
Funding
This research was funded by the Fundamental Research Funds for the Central Universities: 2020JBZD012.
Data Availability Statement
The raw/processed data required to reproduce these findings cannot be shared at this time as the data also forms part of an ongoing study.
Conflicts of Interest
The authors declare no conflict of interest.
Nomenclature
| LFP | LiFePO4 |
| DVA | Differential voltage analysis |
| DTW | Dynamic Time Warping |
| EVs | Electric Vehicles |
| SOH | State of Health |
| LIBs | Lithium-ion battery |
| ICA | Incremental capacity analysis |
| ESSs | energy storage systems |
References
- Lai, X.; Huang, Y.; Deng, C.; Gu, H.; Han, X.; Zheng, Y.; Ouyang, M. Sorting, regrouping, and echelon utilization of the large-scale retired lithium batteries: A critical review. Renew. Sustain. Energy Rev. 2021, 146, 111162. [Google Scholar] [CrossRef]
- Lai, X.; Huang, Y.; Gu, H.; Deng, C.; Han, X.; Feng, X.; Zheng, Y. Turning waste into wealth: A systematic review on echelon utilization and material recycling of retired lithium-ion batteries. Energy Storage Mater. 2021, 40, 96–123. [Google Scholar] [CrossRef]
- Waag, W.; Kbitz, S.; Sauer, D.U. Experimental investigation of the lithium-ion battery impedance characteristic at various conditions and aging states and its influence on the application. Appl. Energy 2013, 102, 885–897. [Google Scholar] [CrossRef]
- Chang, C.; Wang, Q.; Jiang, J.; Wu, T. Lithium-ion battery state of health estimation using the incremental capacity and wavelet neural networks with genetic algorithm. J. Energy Storage 2021, 38, 102570. [Google Scholar] [CrossRef]
- Zou, C.; Manzie, C.; Nešić, D.; Kallapur, A.G. Multi-time-scale observer design for state-of-charge and state-of-health of a lithium-ion battery. J. Power Sources 2016, 335, 121–130. [Google Scholar] [CrossRef]
- Wei, J.; Dong, G.; Chen, Z. Remaining useful life prediction and state of health diagnosis for lithium-ion batteries using particle filter and support vector regression. IEEE Trans. Ind. Electron. 2017, 65, 5634–5643. [Google Scholar] [CrossRef]
- Hua, Y.; Cordoba-Arenas, A.; Warner, N.; Rizzoni, G. A multi time-scale state-of-charge and state-of-health estimation framework using nonlinear predictive filter for lithium-ion battery pack with passive balance control. J. Power Sour. 2015, 280, 293–312. [Google Scholar] [CrossRef]
- Jiang, Y.; Jiang, J.; Zhang, C.; Zhang, W.; Gao, Y.; Li, N. State of health estimation of second-life LiFePO4 batteries for energy storage applications. J. Clean. Prod. 2018, 205, 754–762. [Google Scholar] [CrossRef]
- Barre, A.; Riu, D. A Real-time Data-driven Method for Battery Health Prognostics in Electric Vehicle Use. PHM Soc. Eur. Conf. 2014, 2. [Google Scholar] [CrossRef]
- Deng, Z.; Hu, X.; Lin, X.; Che, Y.; Xu, L.; Guo, W. Data-driven state of charge estimation for lithium-ion battery packs based on Gaussian process regression. Energy 2020, 205, 118000. [Google Scholar] [CrossRef]
- Bonfitto, A.; Ezemobi, E.; Amati, N.; Feraco, S.; Tonoli, A.; Hegde, S. State of Health Estimation of Lithium Batteries for Automotive Applications with Artificial Neural Networks. In Proceedings of the 2019 AEIT International Conference of Electrical and Electronic Technologies for Automotive (AEIT AUTOMOTIVE), Turin, Italy, 2–4 July 2019. [Google Scholar]
- Cao, M.; Zhang, T.; Wang, Y.; Zhang, S.; Liu, Y. A Deep Learning Method with Ensemble Learning for Capacity Estimation of Lithium-ion Battery. In Proceedings of the 2020 Global Reliability and Prognostics and Health Management (PHM-Shanghai), Shanghai, China, 16–18 October 2020. [Google Scholar]
- Han, X. Study on Li-Ion Battery Mechanism Model and State Estimation for Electric Vehicles. Ph.D. Thesis, Tsinghua University, Beijing, China, 2014. (In Chinese). [Google Scholar]
- Liu, Y.; Zhang, C.; Jiang, J.; Jiang, Y.; Zhang, L.; Zhang, W. Capacity Estimation of Serial Lithium-ion Battery Pack Using Dynamic Time Warping Algorithm. IEEE Access 2019, 7, 174687–174698. [Google Scholar] [CrossRef]
- Keogh, E.; Ratanamahatana, C.A. Exact Indexing of Dynamic Time Warping. Knowl. Inf. Syst. 2002, 7, 358–386. [Google Scholar] [CrossRef]
- Dubarry, M.; Truchot, C.; Liaw, B.Y. Synthesize battery degradation modes via a diagnostic and prognostic model. J. Power Sources 2012, 219, 204–216. [Google Scholar] [CrossRef]
- Dubarry, M.; Truchot, C.; Liaw, B.Y. Cell degradation in commercial LiFePO4 cells with high-power and high-energy designs. J. Power Sources 2014, 258, 408–419. [Google Scholar] [CrossRef]
Publisher’s Note: MDPI stays neutral with regard to jurisdictional claims in published maps and institutional affiliations. |
© 2021 by the authors. Licensee MDPI, Basel, Switzerland. This article is an open access article distributed under the terms and conditions of the Creative Commons Attribution (CC BY) license (https://creativecommons.org/licenses/by/4.0/).