
Thermal Performance of Lithium Titanate Oxide Anode Based Battery Module under High Discharge Rates

 ,
,
Abstract
:1. Introduction
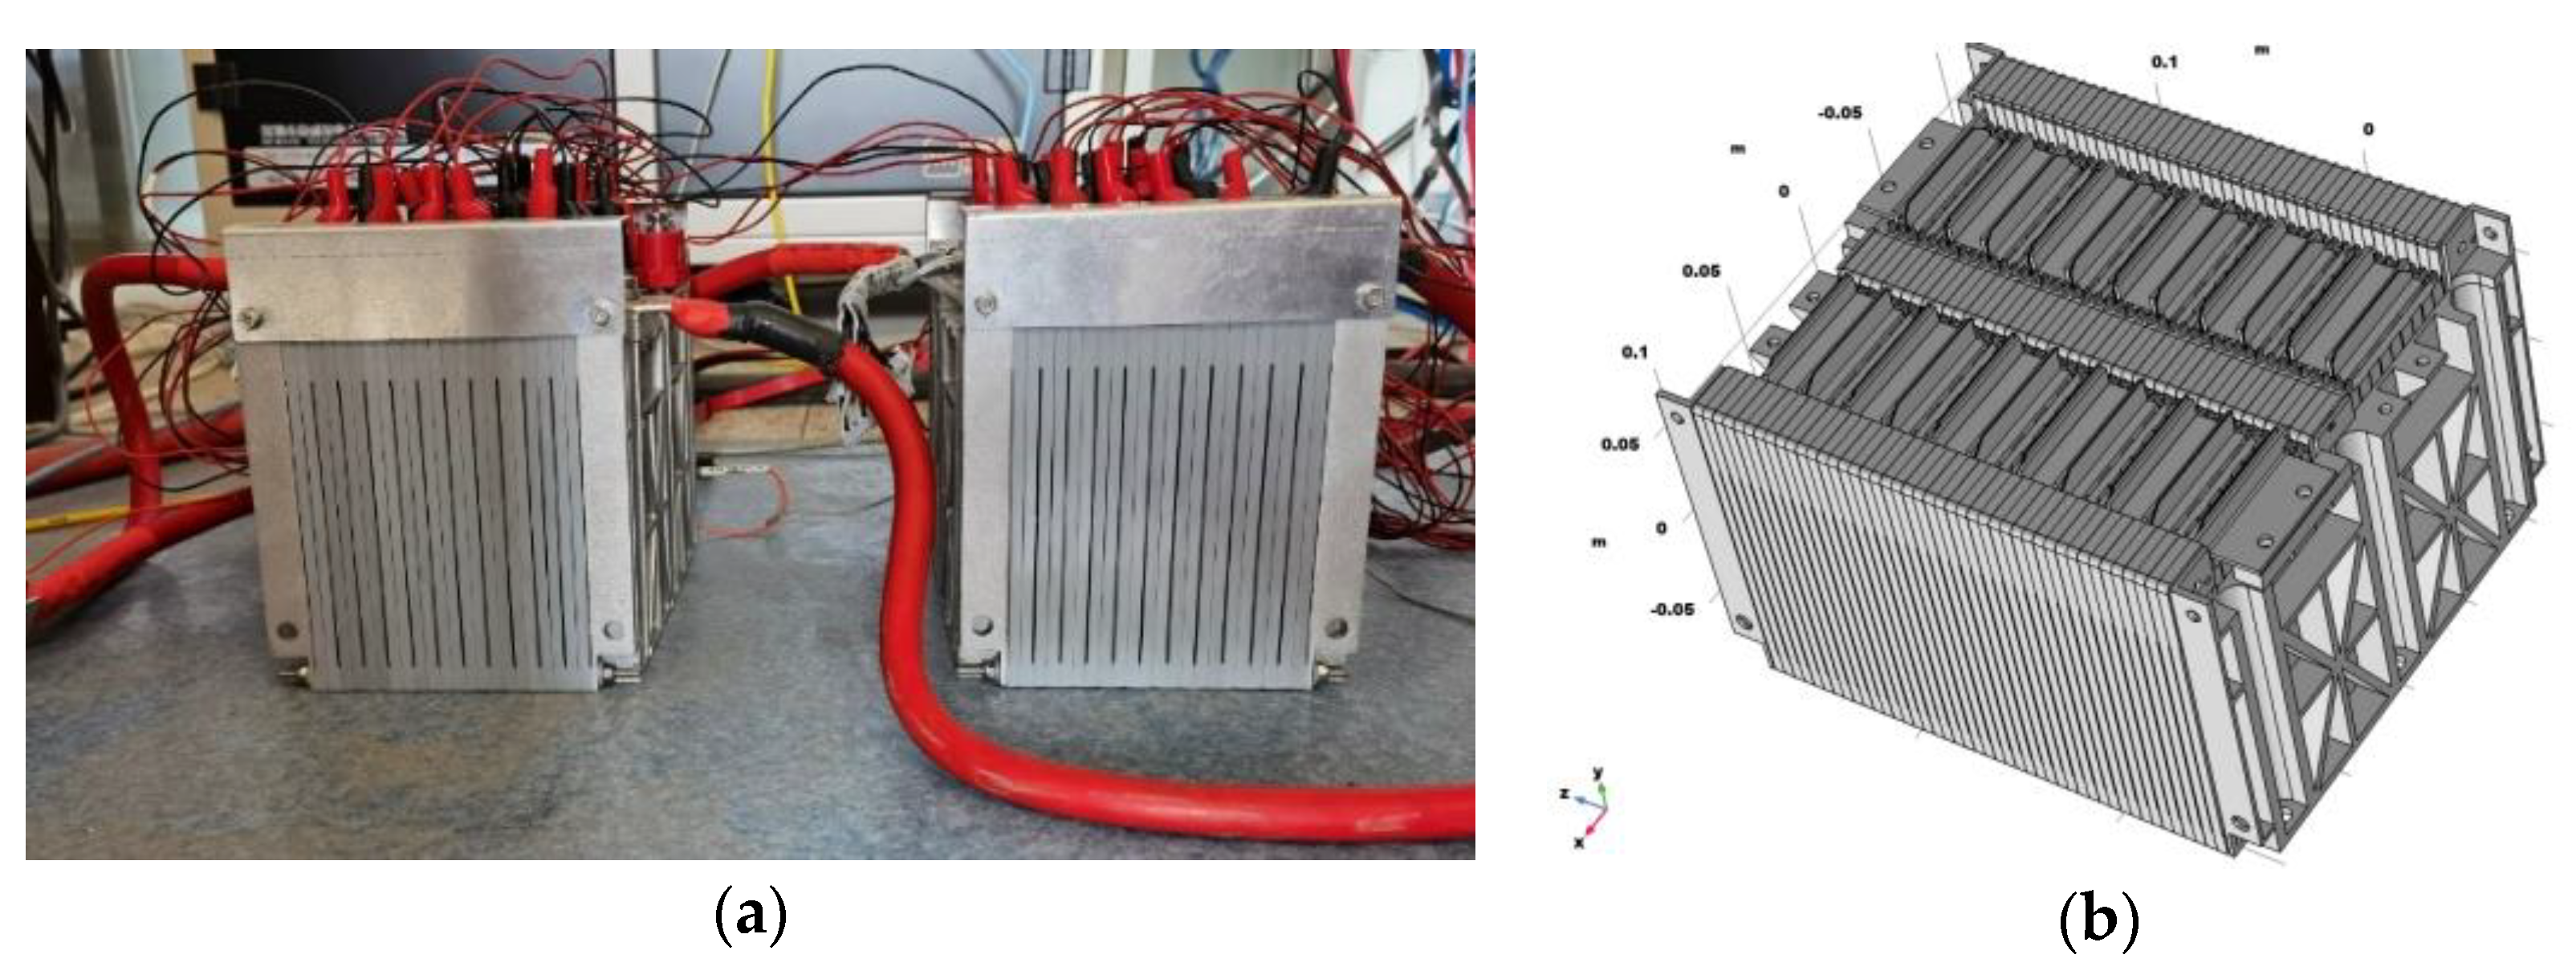
2. Testing Object
3. Test Results
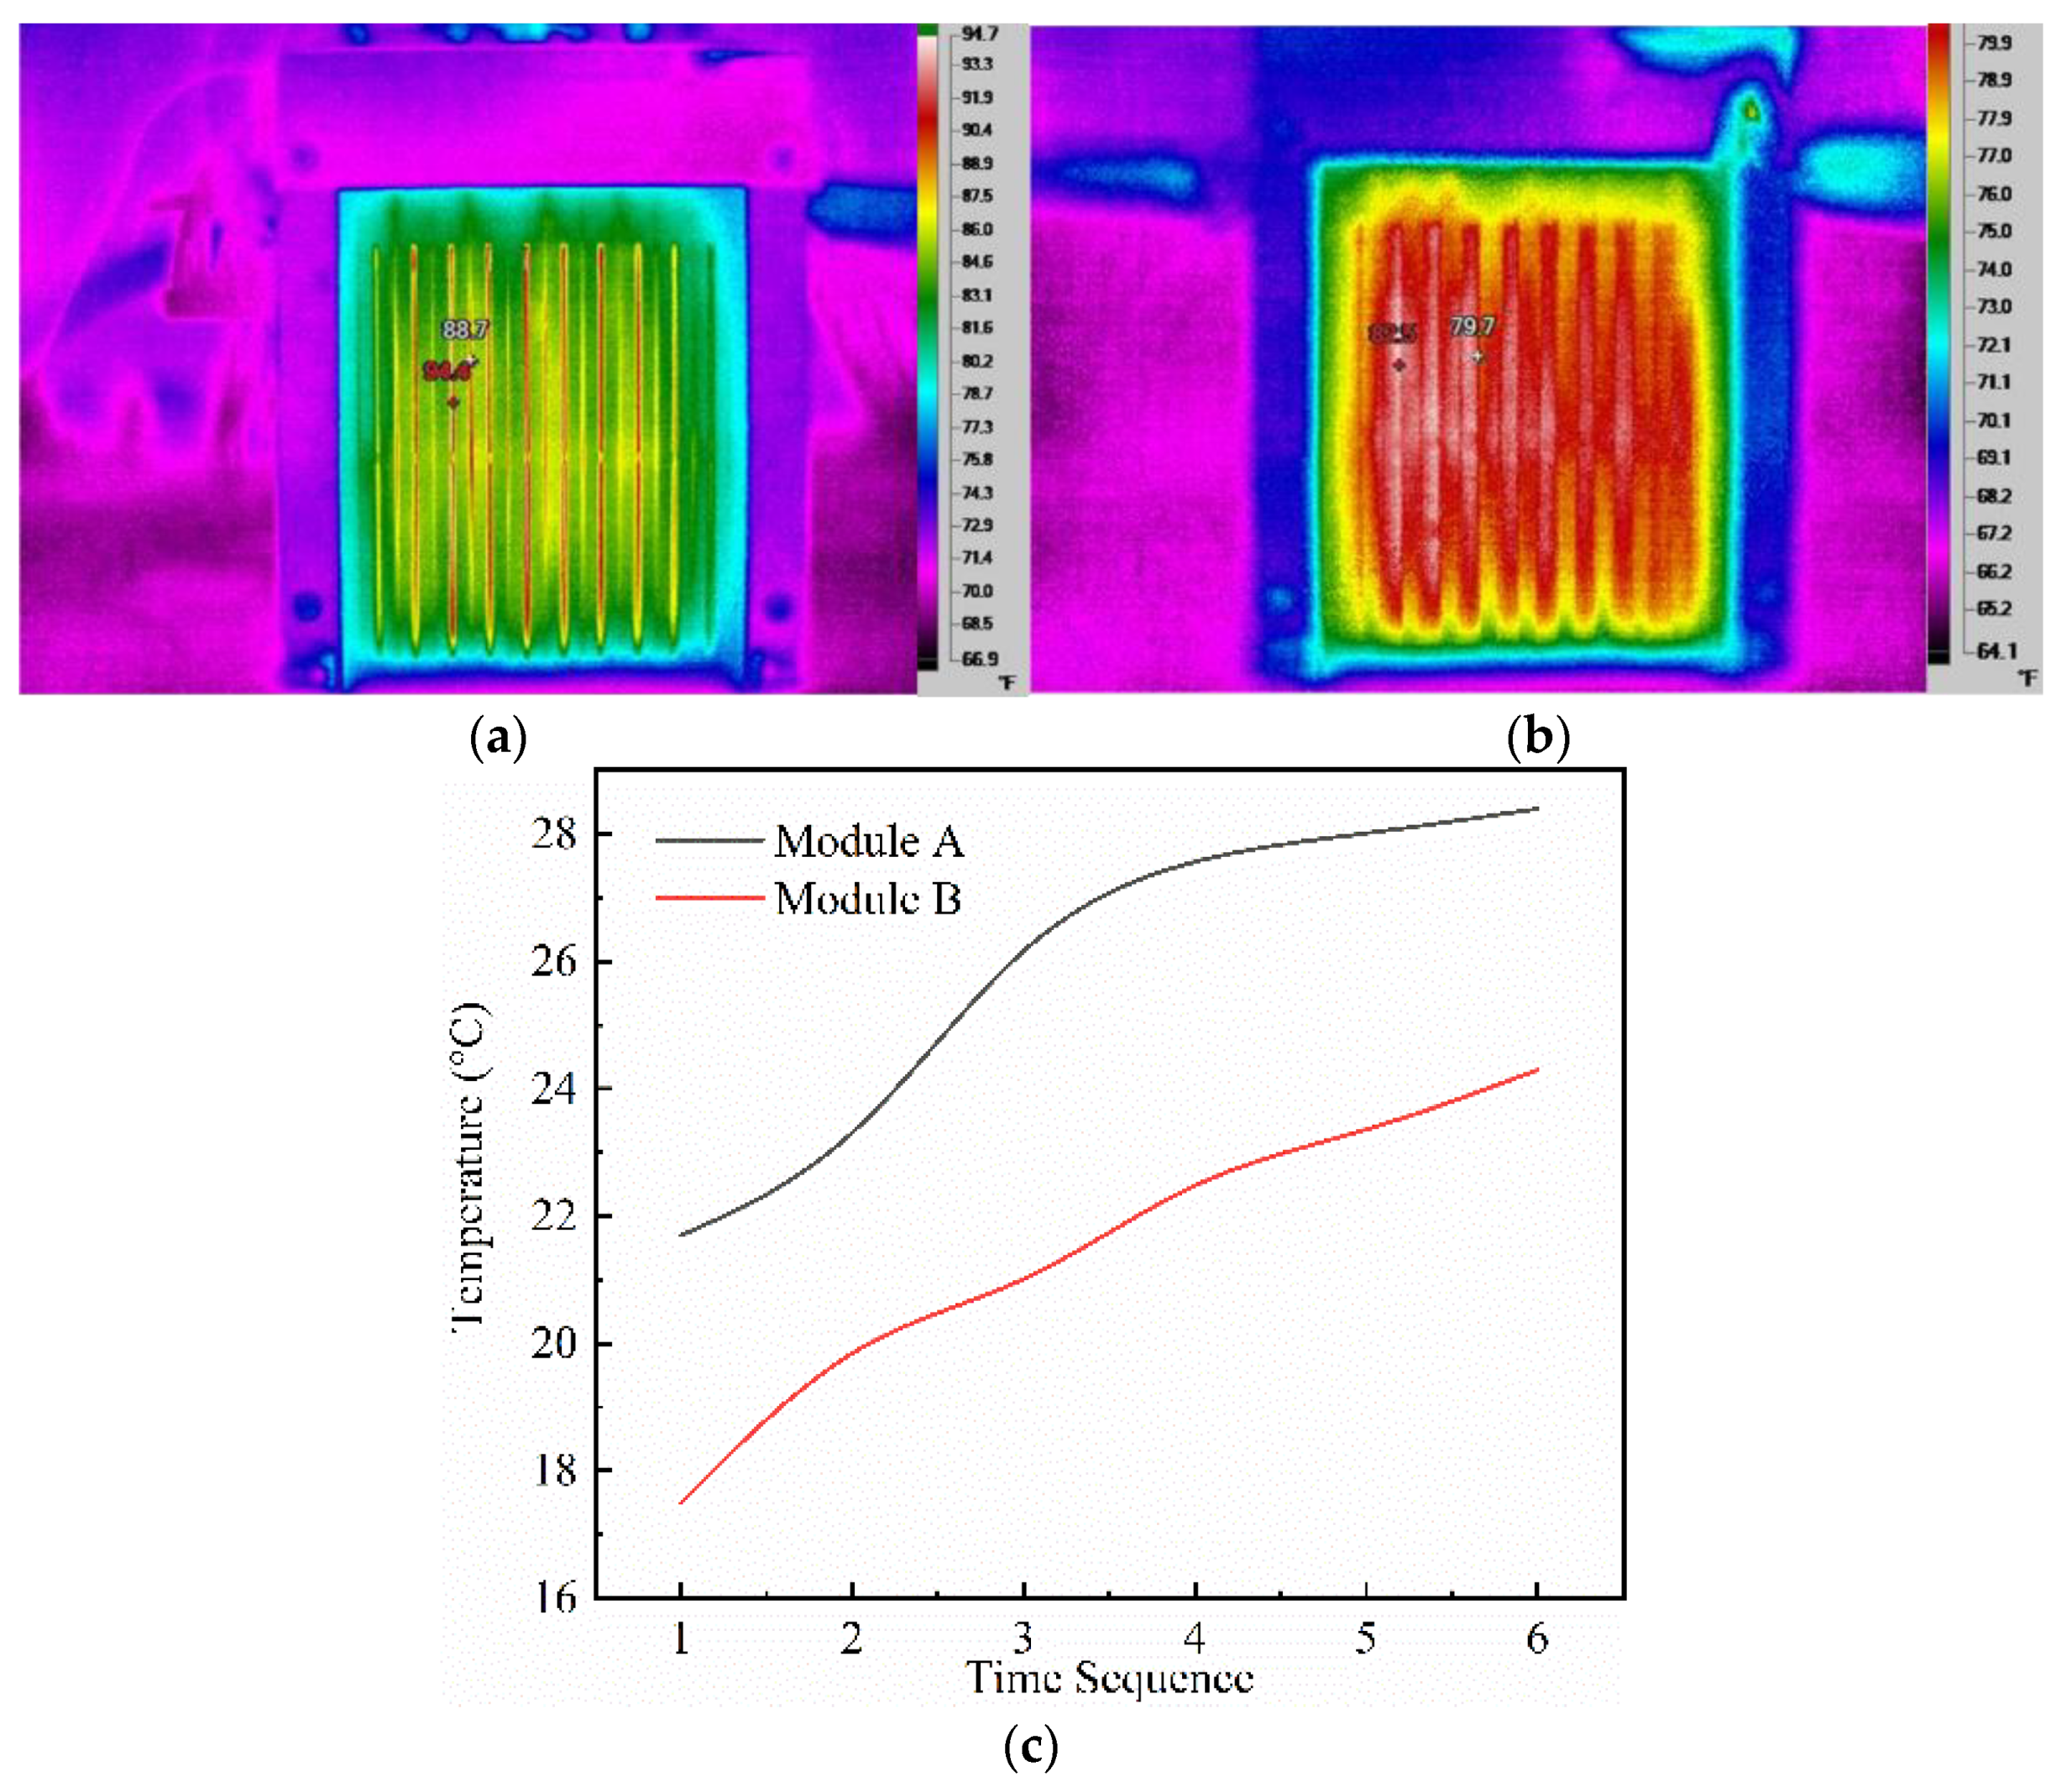
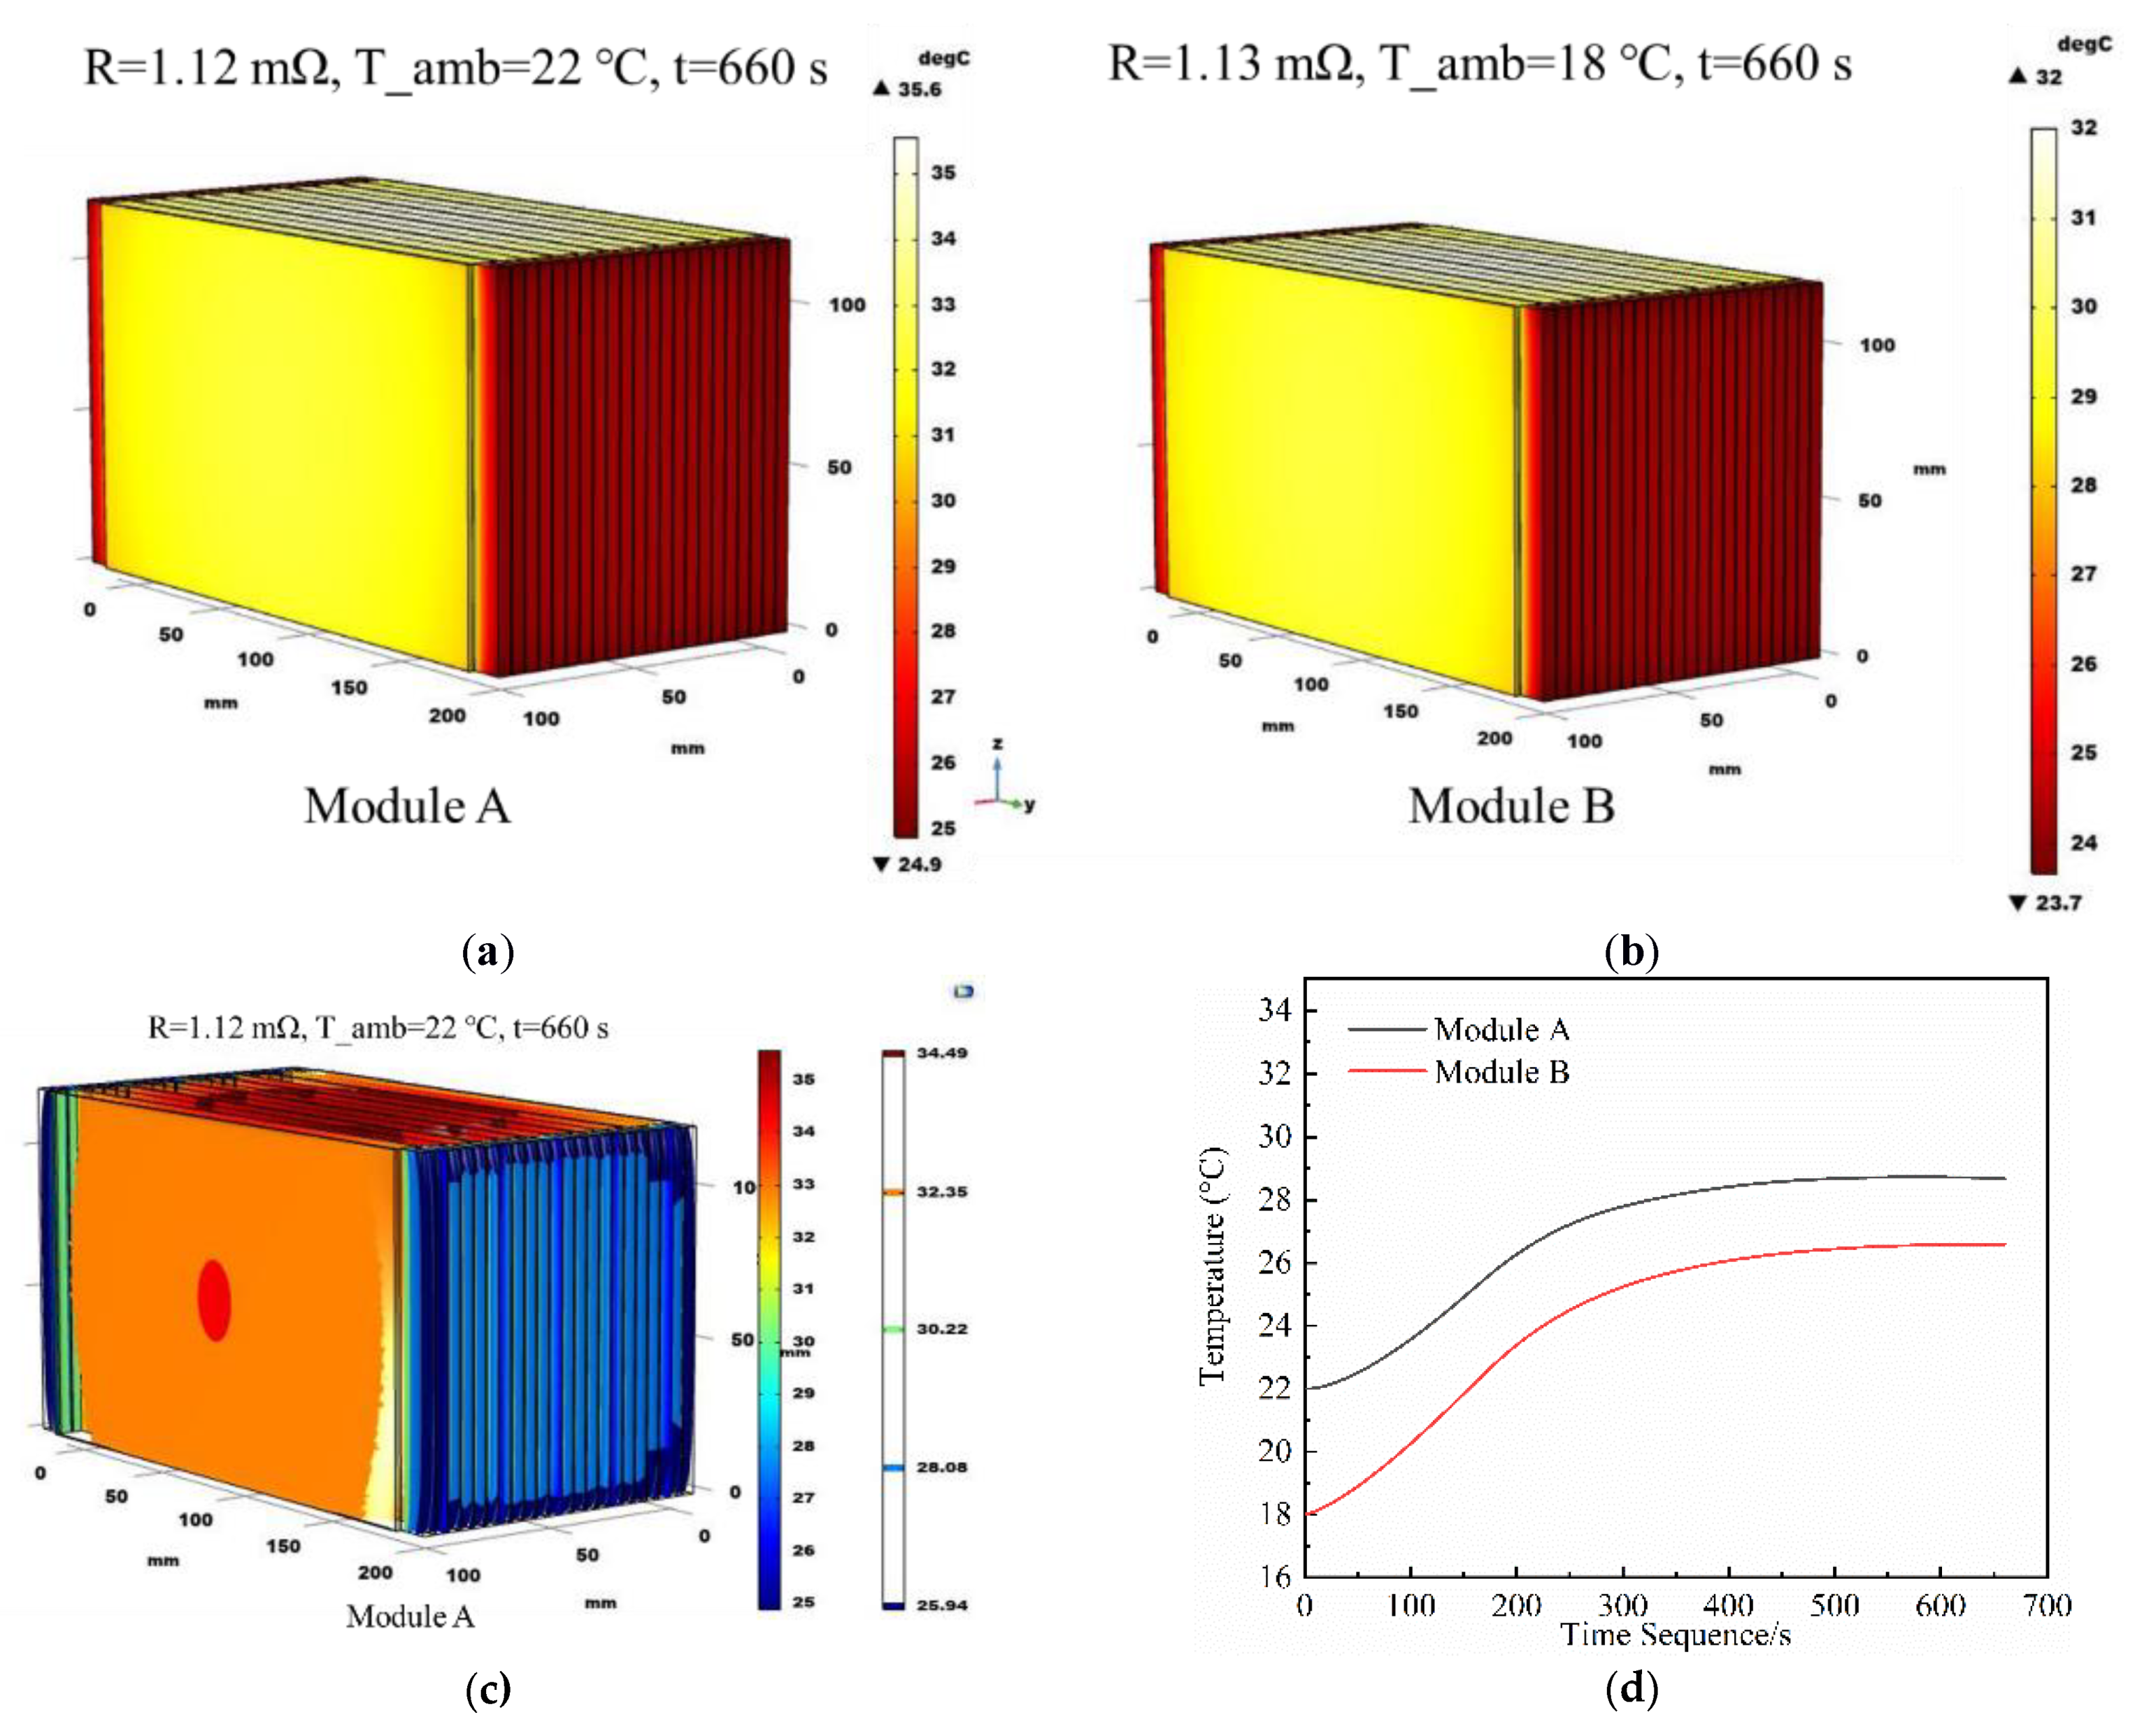
3.1. Test Results of Modules in Series
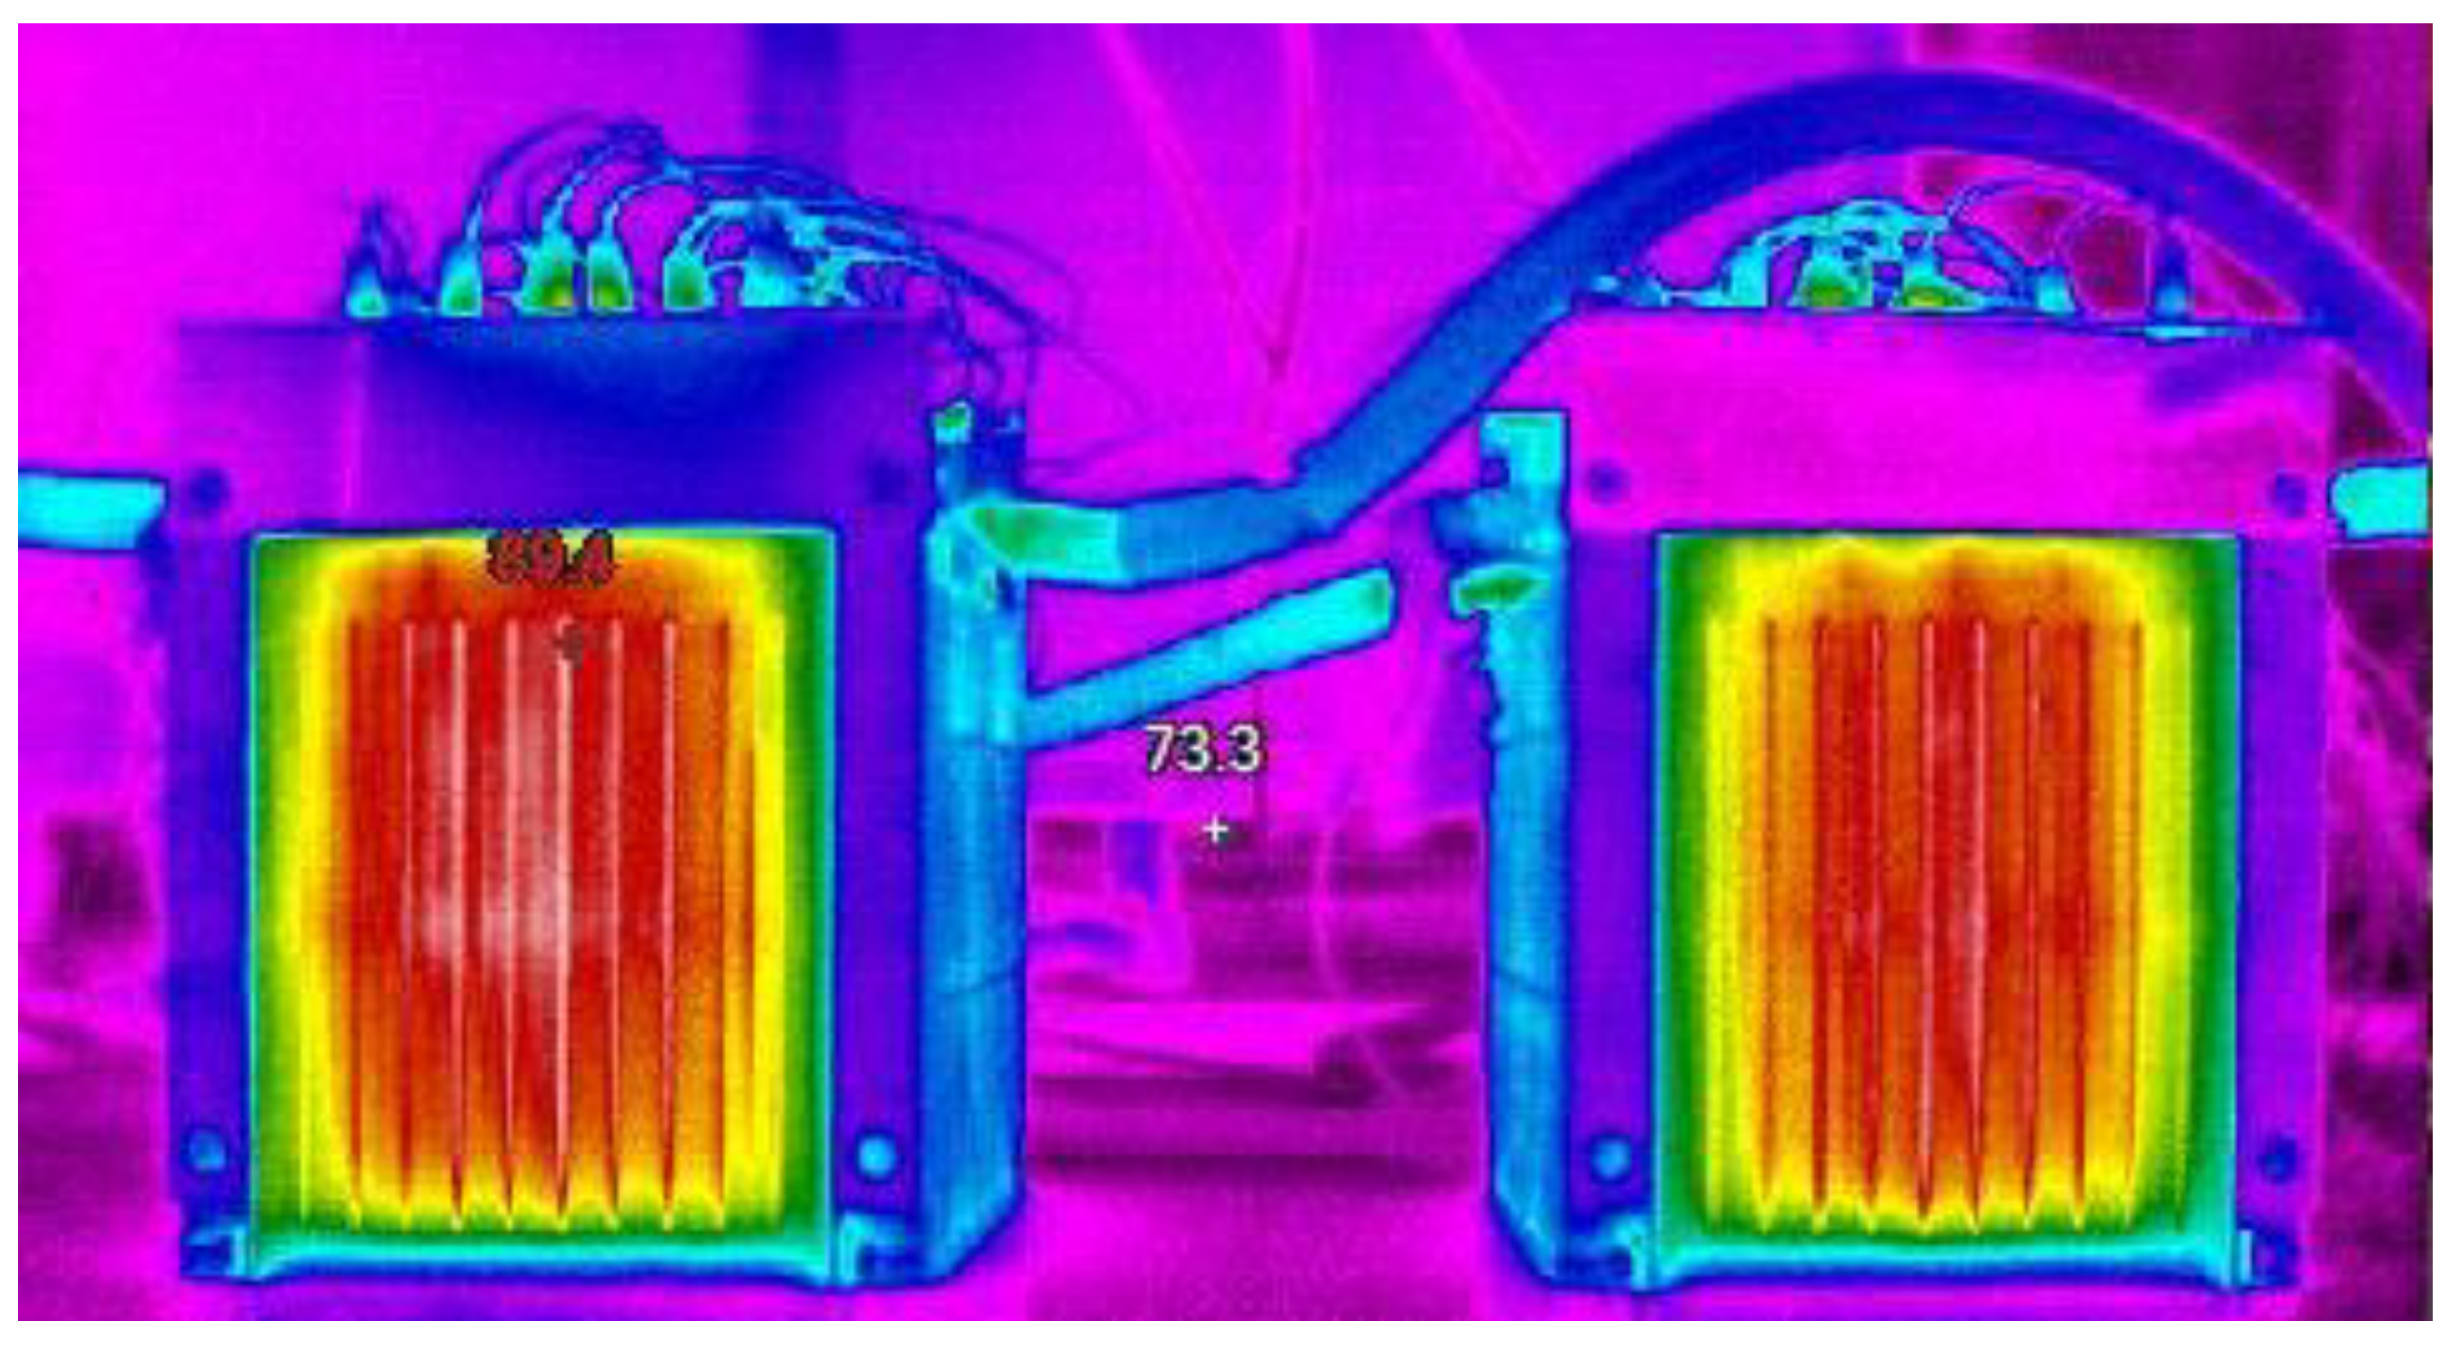
3.2. Test Results of Modules in Parallel
4. Discussion
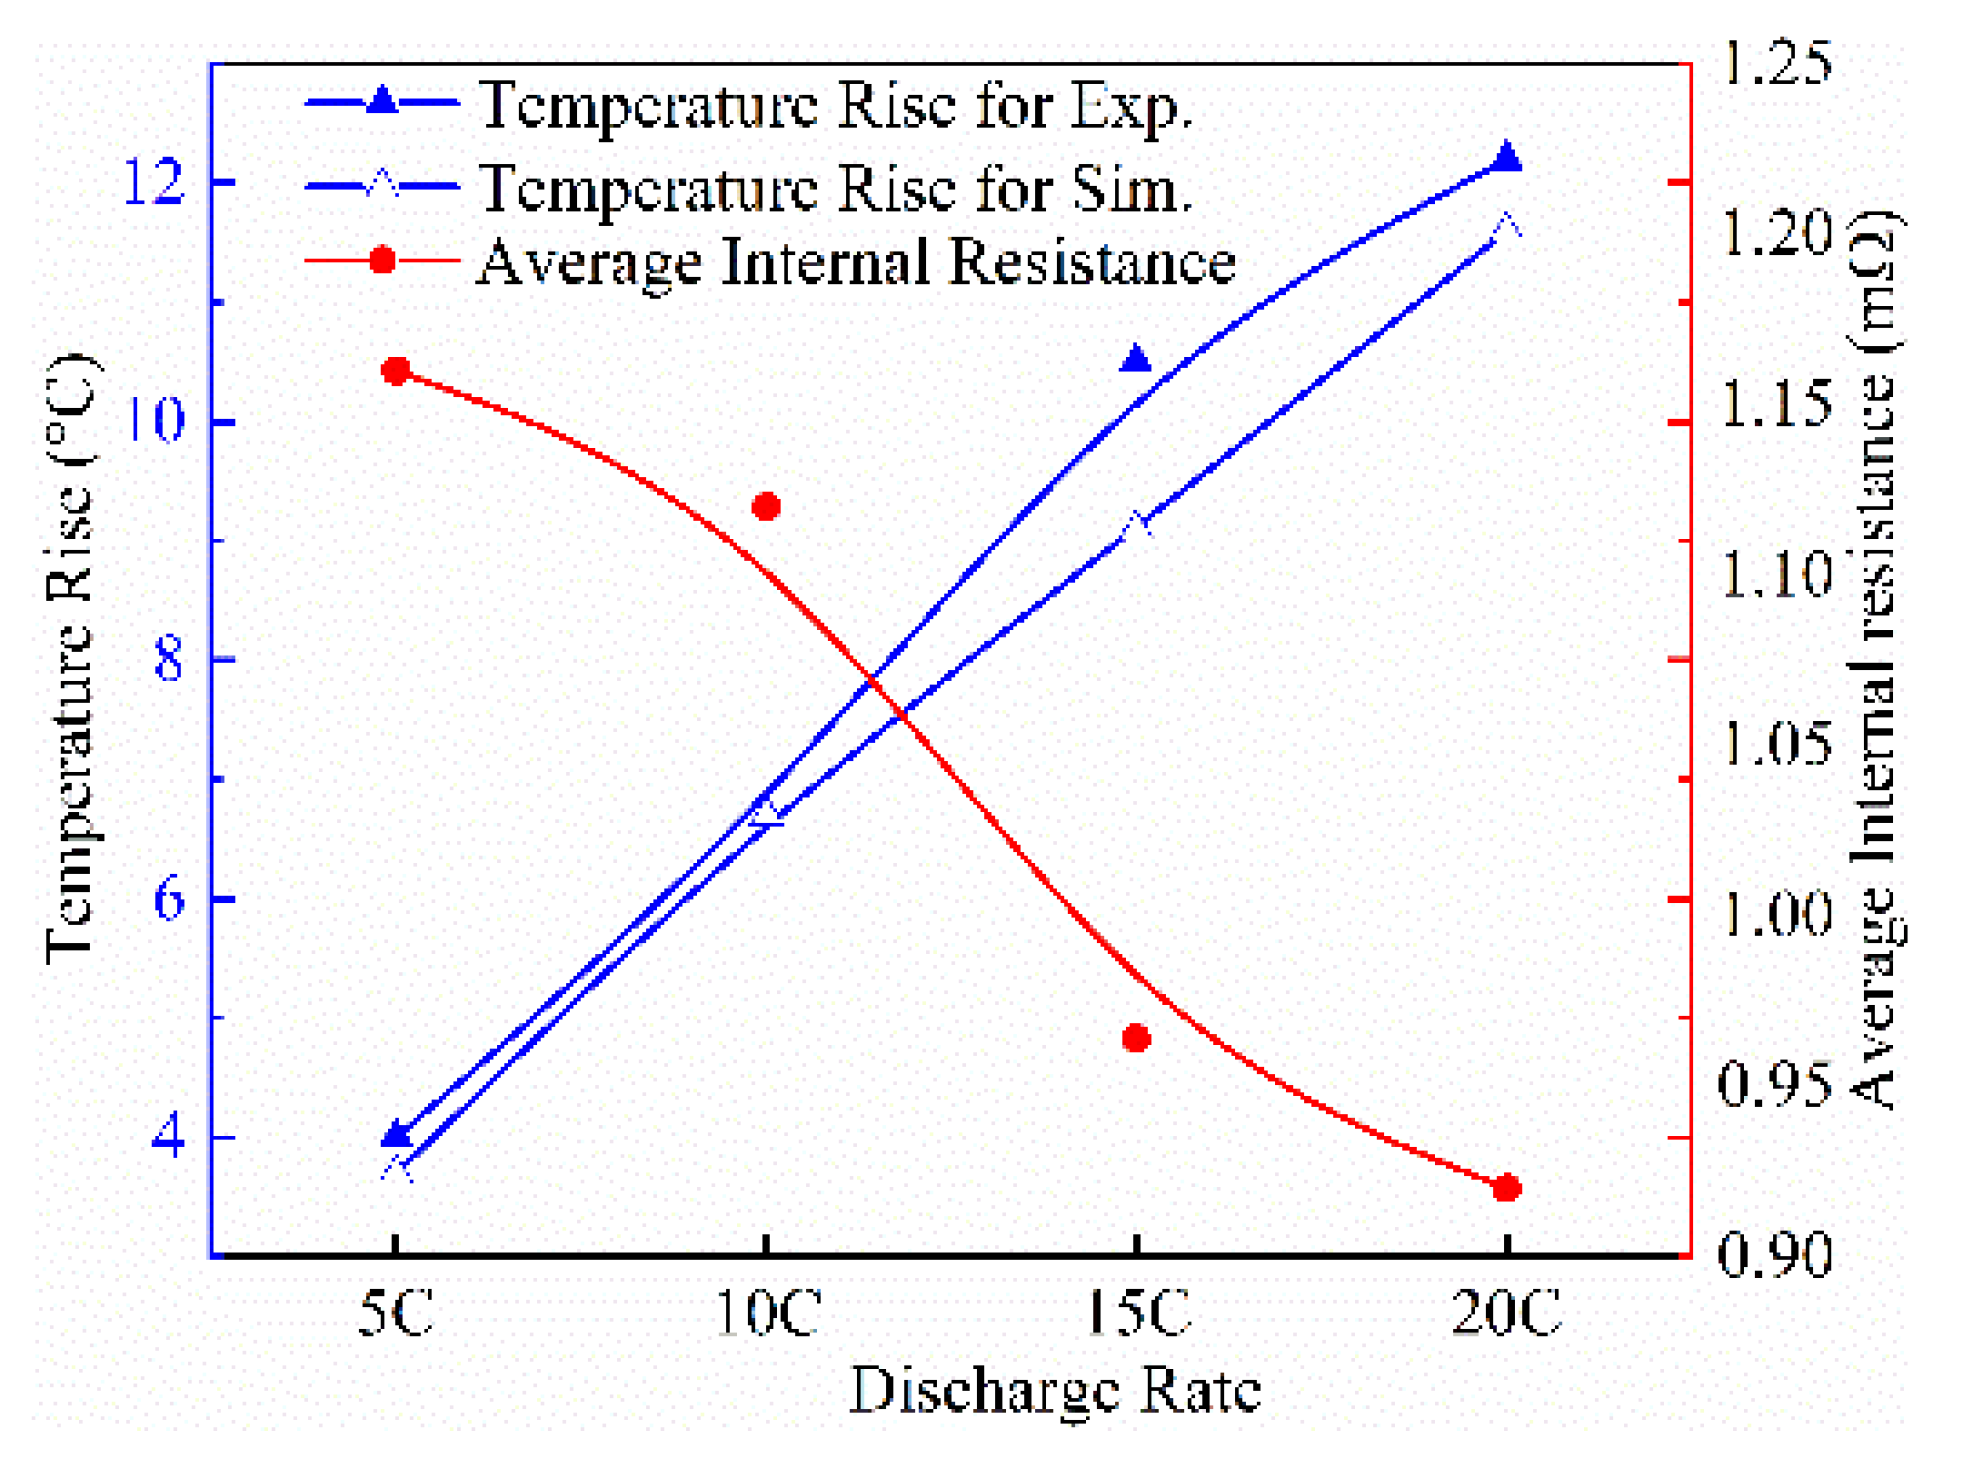
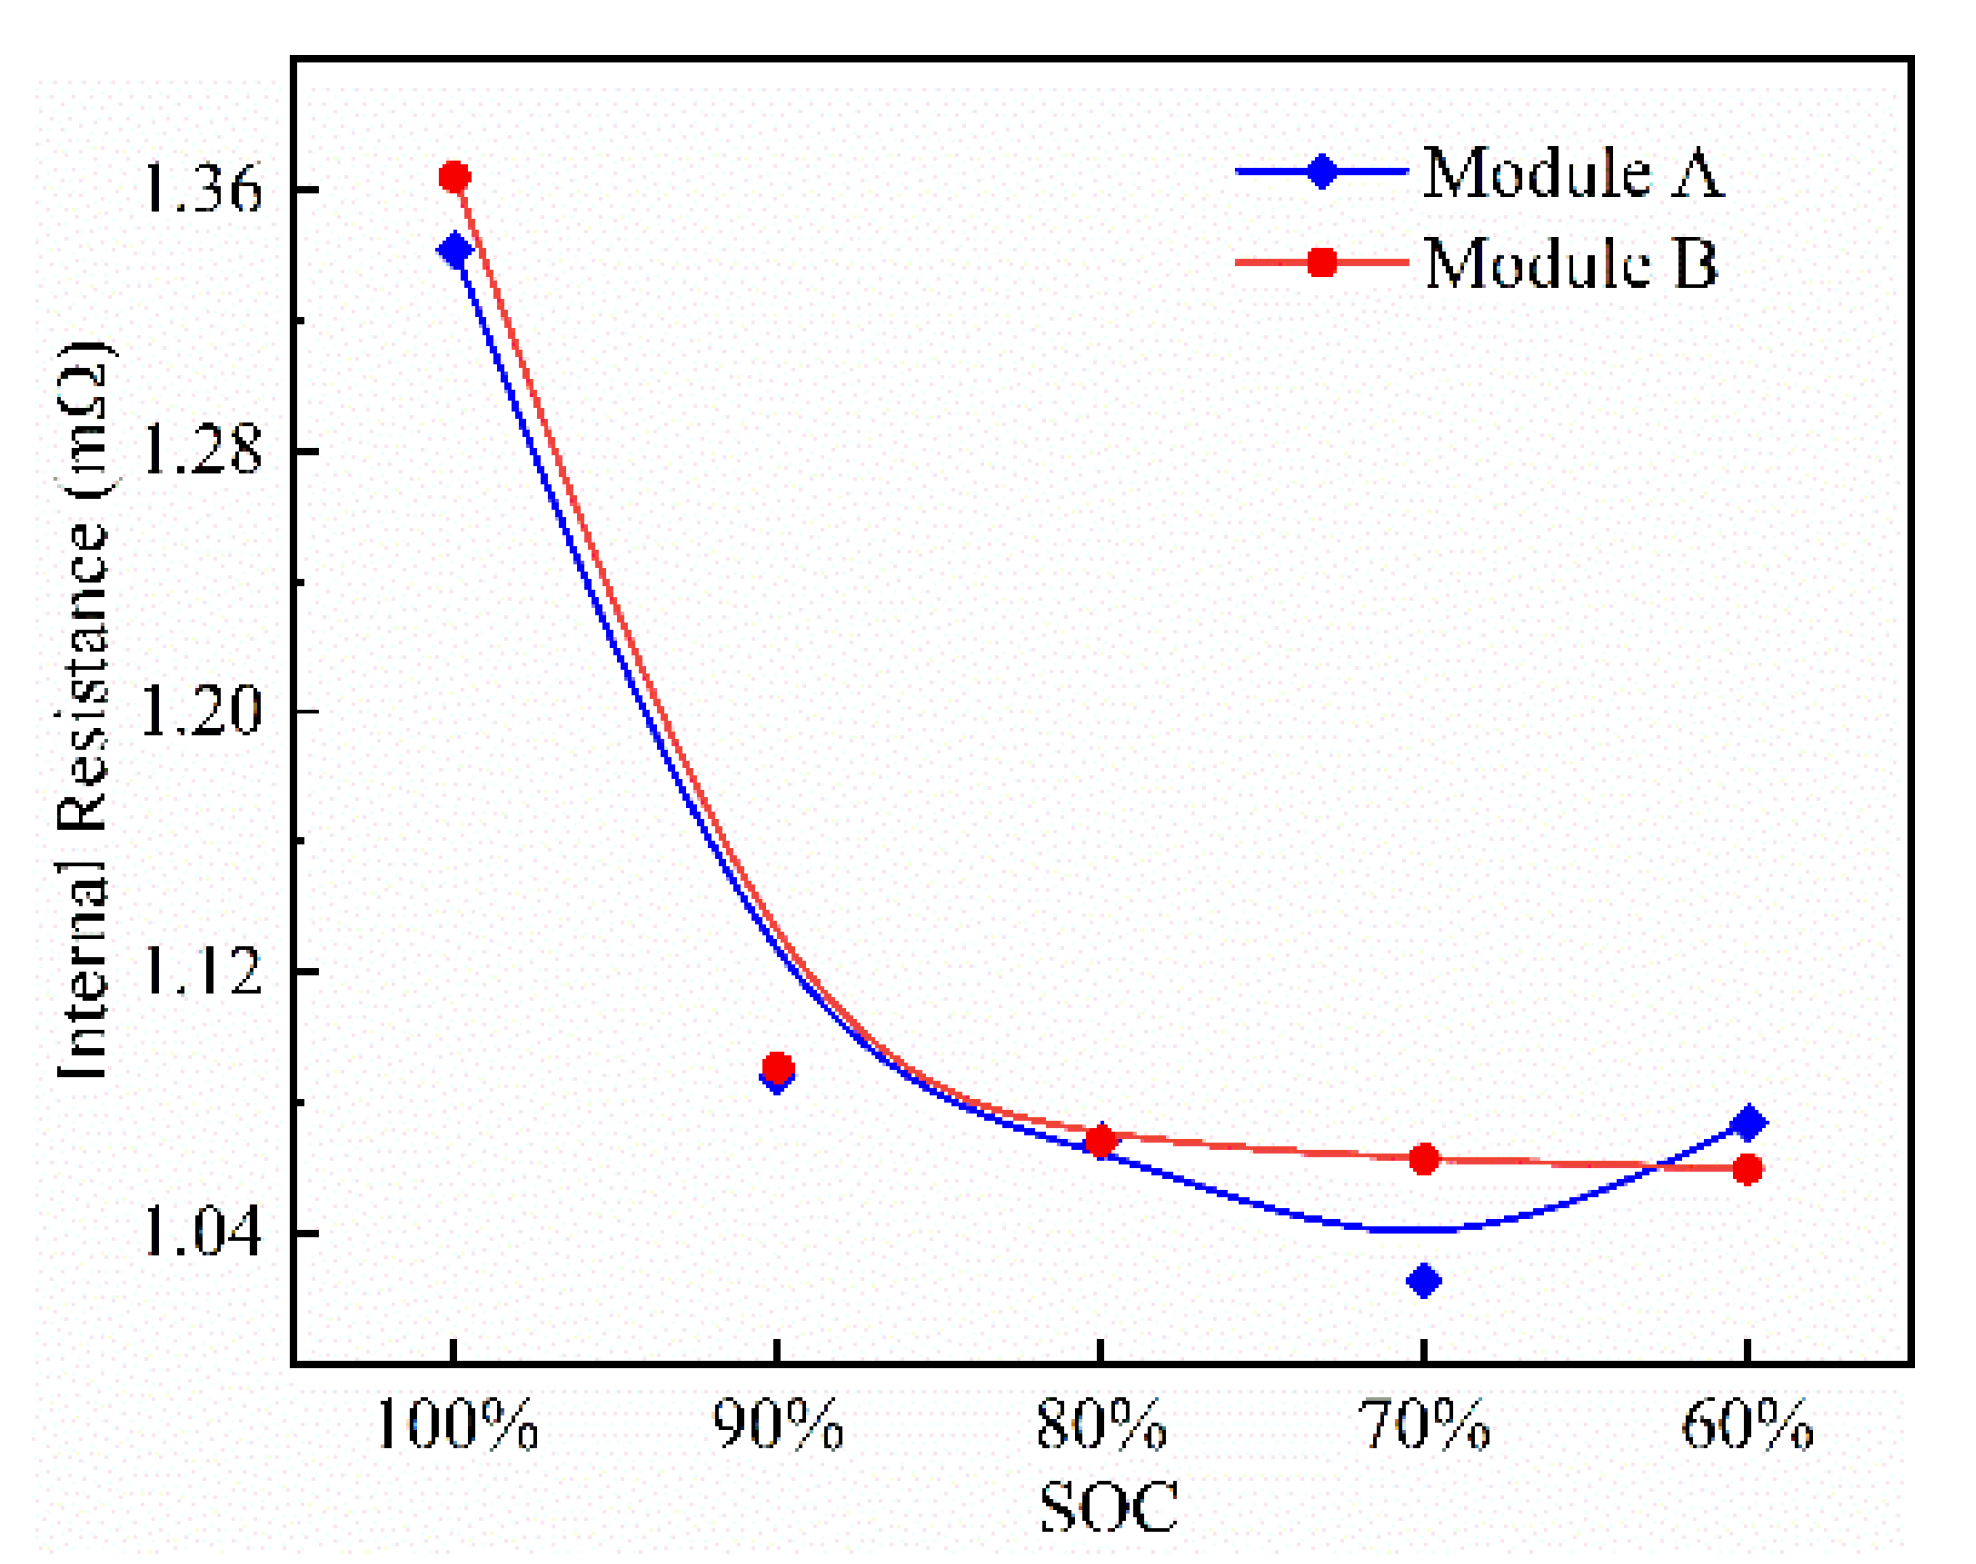
4.1. Influence of Internal Resistance on Battery Thermal Characteristics
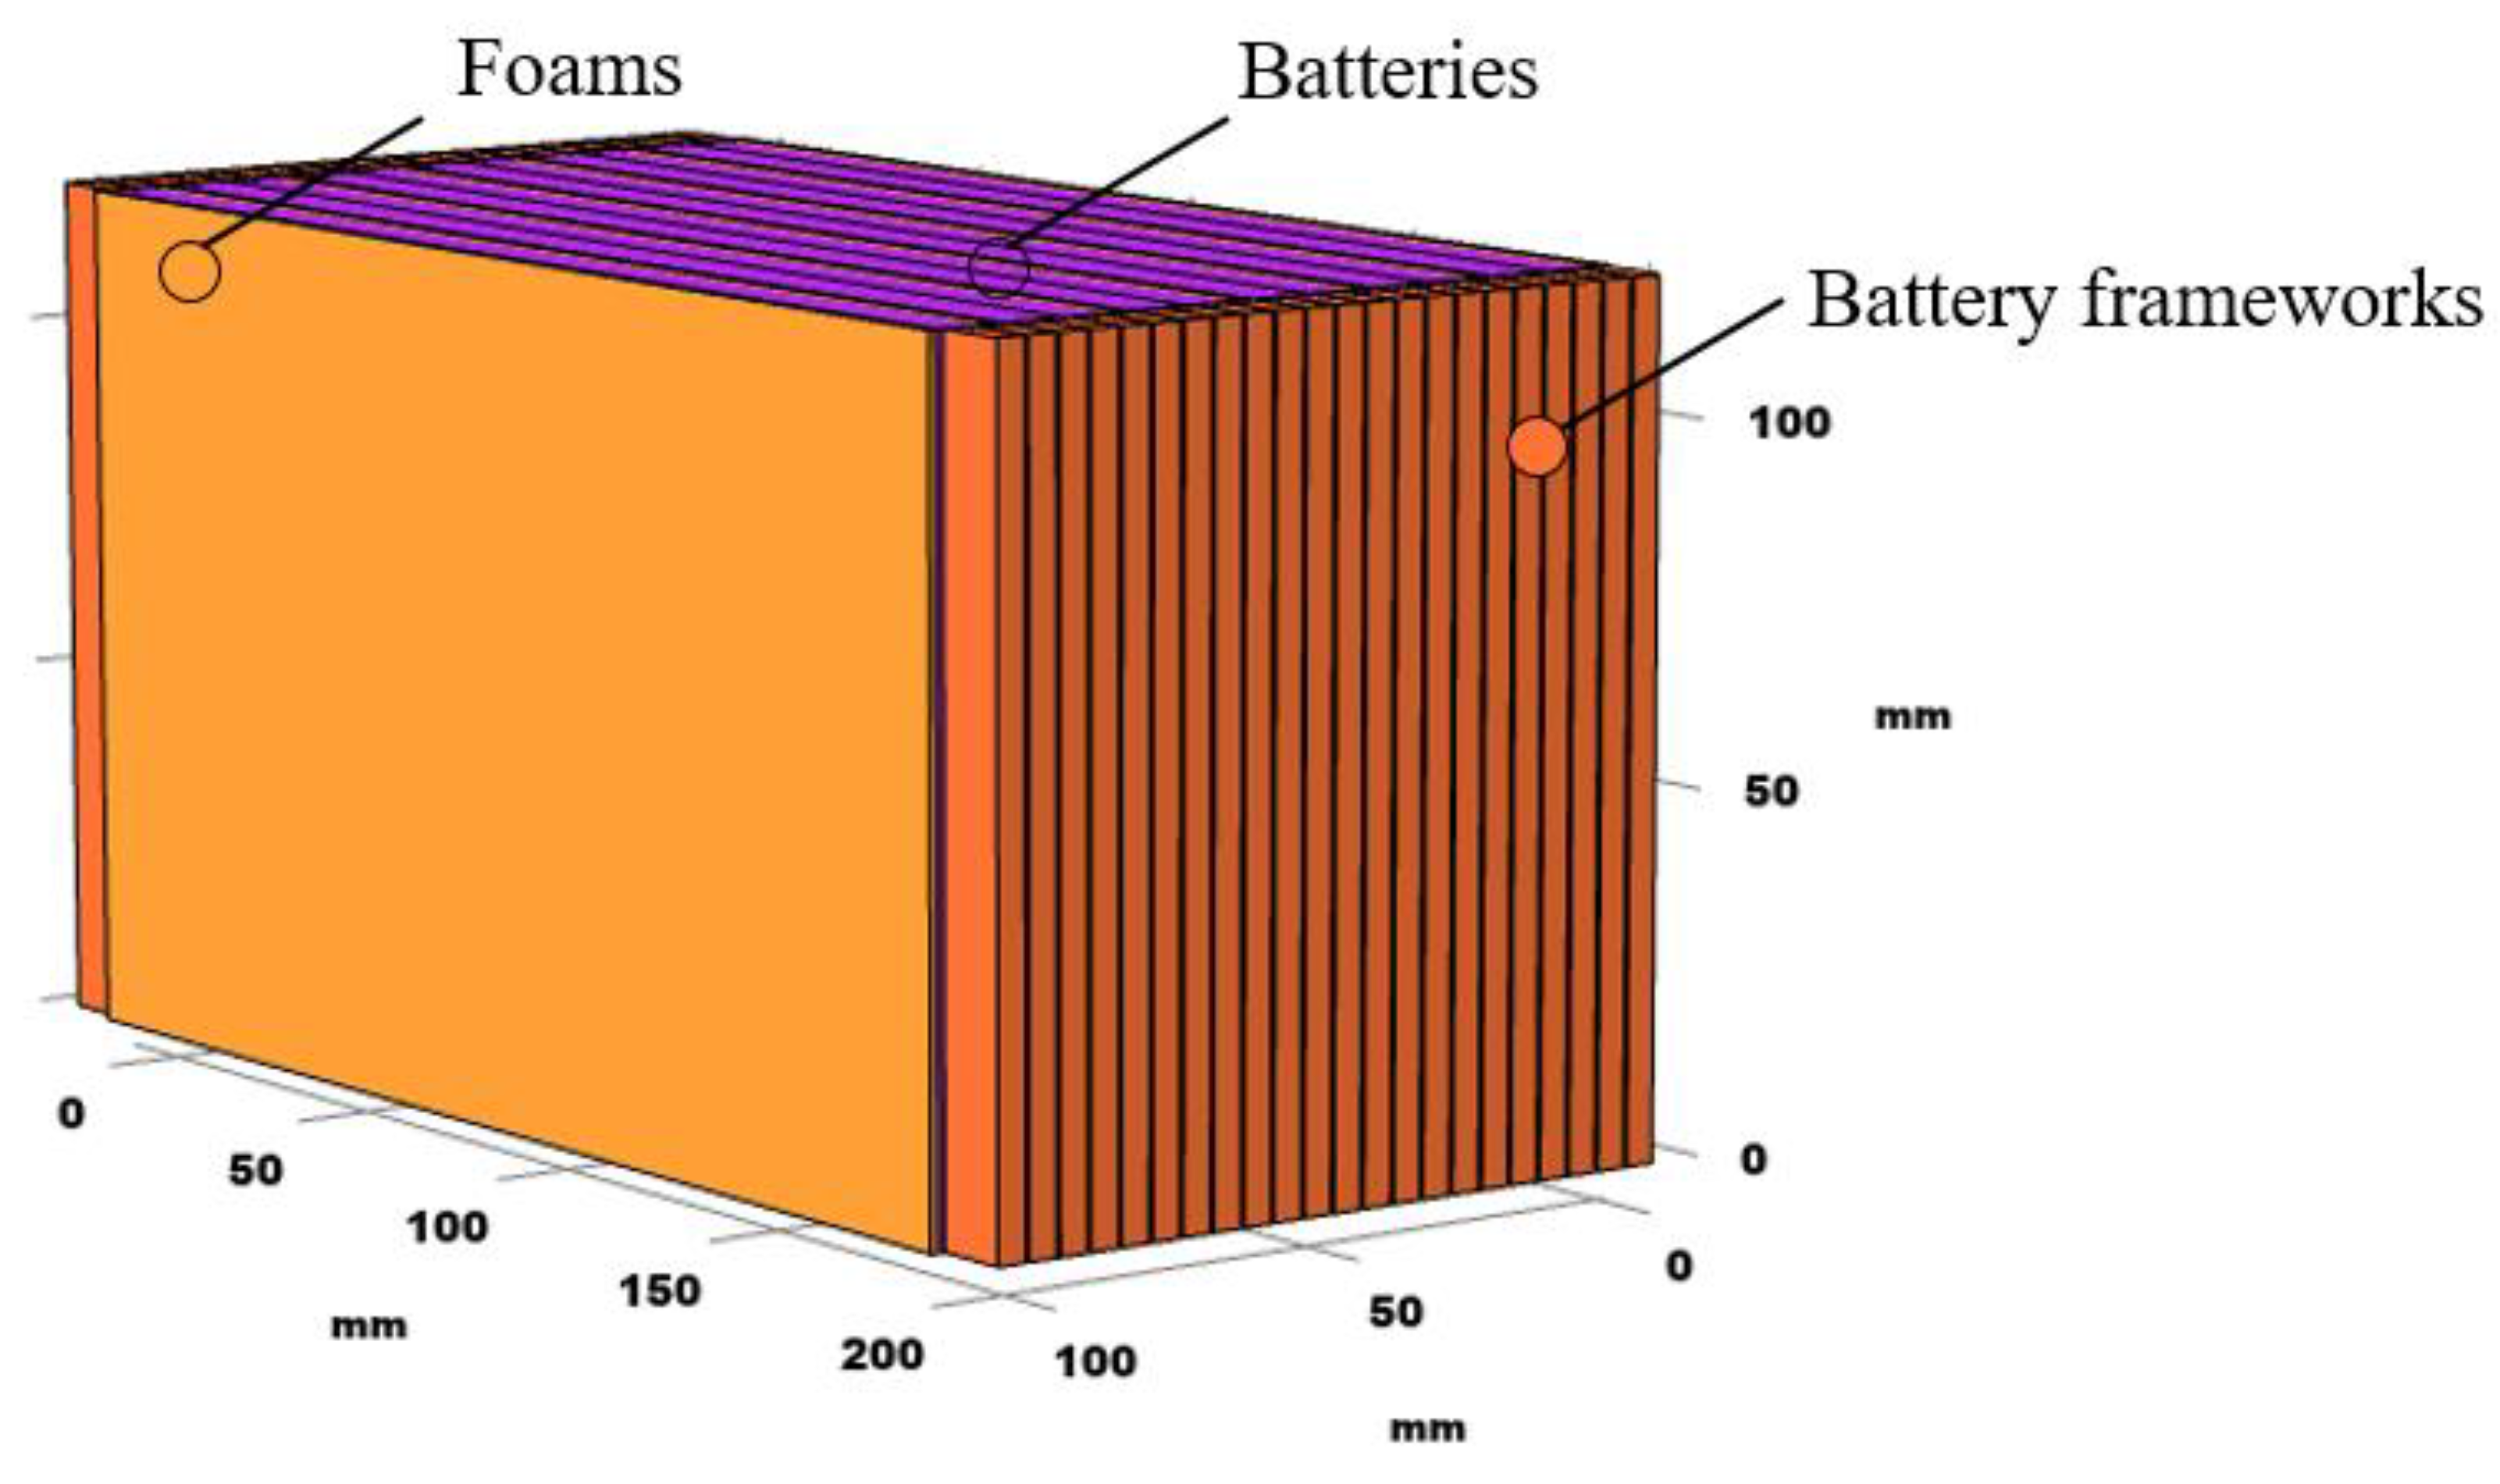
4.2. Simulation
5. Conclusions and Outlook
Author Contributions
Funding
Conflicts of Interest
References
- Mauger, A.; Armand, M.; Julien, C.M. Challenges and issues facing lithium metal for solid-state rechargeable batteries. J. Power Sources 2017, 353, 333–342. [Google Scholar] [CrossRef] [Green Version]
- Chacko, S.; Chung, Y.M. Thermal modeling of Li-ion polymer battery for electric vehicle drive cycles. J. Power Sources 2012, 213, 296–303. [Google Scholar] [CrossRef]
- Shah, K.; Vishwakarma, V.; Jain, A. Measurement of multiscale thermal transport phenomena in li-ion cells: A review. J. Electrochem. Energy Convers. Storage 2016, 13, 030801. [Google Scholar] [CrossRef] [Green Version]
- Yang, A.; Wang, Y.; Yang, F.F. A comprehensive investigation of lithium-ion battery degradation performance at different discharge rates. J. Power Sources 2019, 443, 227108. [Google Scholar] [CrossRef]
- Feng, X.N.; He, X.M.; Ouyang, M.G. A coupled electrochemical-thermal failure model for predicting the thermal runaway behavior of lithium-ion batteries. J. Electrochem. Soc. 2018, 165, A3748–A3765. [Google Scholar] [CrossRef]
- Qi, W.B.; Ben, L.B.; Yu, H.L. Improving the electrochemical cycling performance of anode materials via facile in situ surface deposition of a solid electrolyte layer. J. Power Sources 2019, 424, 150–157. [Google Scholar] [CrossRef]
- Wu, W.X.; Wang, S.F.; Wu, W. A critical review of battery thermal performance and liquid based battery thermal management. Energy Convers. Manag. 2019, 182, 262–281. [Google Scholar] [CrossRef]
- Florian, H.; Jonas, T.; Sabine, W. Experimental investigation of the thermal and cycling behavior of a lithium titanate-based lithium-ion pouch cell. J. Energy Storage 2018, 17, 109–117. [Google Scholar]
- Wu, B.; Yufit, V.; Marinescu, M. Coupled thermal-electrochemical modelling of uneven heat generation in lithium-ion battery packs. J. Power Sources 2013, 243, 544–554. [Google Scholar] [CrossRef]
- Rumpf, K.; Naumann, M.; Jossen, A. Experimental investigation of parametric cell-to-cell variation and correlation based on 1100 commercial lithium-ion cells. J. Energy Storage 2017, 14, 224–243. [Google Scholar] [CrossRef]
- Peng, X.; Ma, C.; Garg, A. Thermal performance investigation of an air-cooled lithium-ion battery pack considering the inconsistency of battery cells. Appl. Therm. Eng. 2019, 153, 596–603. [Google Scholar] [CrossRef]
- Smith, K.; Wang, C.Y. Power and thermal characterization of a lithium-ion battery pack for hybrid-electric vehi-cles. J. Power Sources 2006, 160, 662–673. [Google Scholar] [CrossRef]
- Xun, J.Z.; Liu, R.; Jiao, K. Numerical and analytical modeling of lithium ion battery thermal behaviors with different cooling designs. J. Power Sources 2013, 233, 47–61. [Google Scholar] [CrossRef]
- Voicu, I.; Rizk, R.; Louahlia, H. Experimental and numerical study of supercapacitors module with air cooling. Appl. Therm. Eng. 2019, 159, 113903. [Google Scholar] [CrossRef]
- Chen, K.; Wu, W.D.; Yuan, F. Cooling efficiency improvement of air-cooled battery thermal management system through designing the flow pattern. Appl. Therm. Eng. 2019, 167, 781–790. [Google Scholar] [CrossRef]
- Chen, J.Y.; Yu, L.Y.; Wang, G.Z. Analysis of optimization of wind cooling system in power battery. Chin. J. Power Sources 2019, 043, 84–87. [Google Scholar]
- Hosseinzadeh, E.; Marco, J.; Jennings, P. Combined electrical and electrochemical-thermal model of parallel connected large format pouch cells. J. Energy Storage 2019, 22, 194–207. [Google Scholar] [CrossRef]
- Liu, H.W.; Li, J.J.; Xie, X.Y. Application of accelerating rate calorimeter in the lithium-ion battery thermal test. J. Integr. Technol. 2015, 1, 51–59. [Google Scholar]
- Philipp, S.; Ehsan, K.; Thomas, N. Adaptive modeling in the frequency and time domain of high-power lithium titanate oxide cells in battery management systems. J. Energy Storage 2020, 32, 101966. [Google Scholar]
- Anup, B.; Kotub, U.W.; Widanage, D. A study of the influence of measurement timescale on internal resistance characterisation methodologies for lithium-ion cells. Sci. Rep. 2018, 8, 21. [Google Scholar]
- Krishnan, S.; Hariharan, V.; Senthil, K. A nonlinear equivalent circuit model for lithium ion cells. J. Power Sources 2013, 222, 210–217. [Google Scholar]
- Yoana, F.P.; Cecilio, B.; David, A. Determination of suitable parameters for battery analysis by Electrochemical Impedance Spectroscopy. Measurement 2017, 106, 1–11. [Google Scholar]
- Yasir, M.G.; Li, H.; Zheng, J.P. Applicationn of physical electric circuit modeling to characterize Li-ion battery electrochemical processes. J. Power Sources 2014, 270, 113–120. [Google Scholar]
- Yasir, A.; Tomi, L.; Juha, K. Heat generation in high power prismatic Li-ion battery cell with LiMnNiCoO2 cathode material. Int. J. Energy Res. 2014, 38, 1424–1437. [Google Scholar]
- Liu, Z.H.; Wang, C.; Guo, X.M. Thermal characteristics of ultra-high power density lithium-ion battery. J. Power Sources 2021, 506, 230205. [Google Scholar] [CrossRef]


| Density/(kg/m3) | Thermal Conductivity/(W/(m·K)) | Specific Heat/(J/(kg·K)) | |
|---|---|---|---|
| batteries | 2193 | 2.5, 14.5, 14.5 | 1142 |
| foams | 50 | 0.12 | 2050 |
| frameworks | 962 | 0.42 | 2300 |
Publisher’s Note: MDPI stays neutral with regard to jurisdictional claims in published maps and institutional affiliations. |
© 2021 by the authors. Licensee MDPI, Basel, Switzerland. This article is an open access article distributed under the terms and conditions of the Creative Commons Attribution (CC BY) license (https://creativecommons.org/licenses/by/4.0/).
Share and Cite
Liu, Z.; Gao, Y.; Chen, H.; Wang, C.; Sun, Y.; Yan, P. Thermal Performance of Lithium Titanate Oxide Anode Based Battery Module under High Discharge Rates. World Electr. Veh. J. 2021, 12, 158. https://doi.org/10.3390/wevj12030158
Liu Z, Gao Y, Chen H, Wang C, Sun Y, Yan P. Thermal Performance of Lithium Titanate Oxide Anode Based Battery Module under High Discharge Rates. World Electric Vehicle Journal. 2021; 12(3):158. https://doi.org/10.3390/wevj12030158
Chicago/Turabian StyleLiu, Zehui, Yinghui Gao, Hongtao Chen, Chu Wang, Yaohong Sun, and Ping Yan. 2021. "Thermal Performance of Lithium Titanate Oxide Anode Based Battery Module under High Discharge Rates" World Electric Vehicle Journal 12, no. 3: 158. https://doi.org/10.3390/wevj12030158
APA StyleLiu, Z., Gao, Y., Chen, H., Wang, C., Sun, Y., & Yan, P. (2021). Thermal Performance of Lithium Titanate Oxide Anode Based Battery Module under High Discharge Rates. World Electric Vehicle Journal, 12(3), 158. https://doi.org/10.3390/wevj12030158