Article

State of Health Estimation of Lithium-Ion Batteries Based on Electrochemical Impedance Spectroscopy and Backpropagation Neural Network

Battery Innovation Center, MOBI Research Group, Vrije Universiteit Brussel, Pleinlaan 2, 1050 Brussels, Belgium
*
Author to whom correspondence should be addressed.
World Electr. Veh. J. 2021, 12(3), 156; https://doi.org/10.3390/wevj12030156
Submission received: 17 August 2021 / Revised: 8 September 2021 / Accepted: 14 September 2021 / Published: 15 September 2021

Abstract

:
The global electric vehicle (EV) is expanding enormously, foreseeing a 17.4% increase in compound annual growth rate (CAGR) by the end of 2027. The lithium-ion battery is considered as the most widely used battery technology in EV. The accurate and reliable diagnostic and prognostic of battery state guarantees the safe operation of EV and is crucial for durable electric vehicles. Research focusing on lithium-ion battery life degradation has grown more important in recent years. In this study, a model built for state of health (SoH) estimation for the LTO anode-based lithium-ion battery is presented. First, electrochemical impedance spectroscopy (EIS) is used to study the deterioration in battery performance, measurements such as charge transfer resistance and ohmic resistance are analyzed for different operational conditions and selected as key characteristic parameters for the model. Then, the model based on a backpropagation neural network (BPNN) along with the characteristic parameters is trained and validated with a real-life driving profile. The model shows a relatively accurate estimation of SoH with a mean-squared-error (MSE) of 0.002.

1. Introduction

Lithium-ion batteries were largely developed in the 1970s–1980s but finally commercialized in 1991 by Sony and recently, growing with a promising rate [1]. It is the most widely used battery technology in our day-to-day life with applications ranging from small consumer electronics to electric vehicles and even up to small- and large-scale stationary applications due to its high-power capability, long calendar and cycle lifetime, high efficiency, and intrinsic safety [2]. As part of the transition to a low-carbon future by 2050, Belgium has developed policies to both steer away from internal combustion engine cars and intend to finish the full transformation toward EVs [3]. As a result, higher requirements were made especially to the battery management systems (BMSs); one of the crucial features for BMSs are the SoH estimation. An accurate estimation of the SoH of batteries is considered a fundamental contribution to a safe and lifetime optimized operation in hybrid and electrical vehicles [4]. At the moment, many SoH estimation and monitoring methods are studied and proposed in the literature. Among all the methodologies, they can be divided into two main categories: experimental techniques and adaptive models.

1.1. Experimental Techniques

Experimental techniques depend on keeping track of the degradation data and the use of the previous knowledge of the operating performance of the battery to perform a SoH estimation. Generally, these techniques have low computational effort and are possible to be implemented in the BMSs. However, they suffer from low accuracy and are not suited for in situ estimation [5]. Among the same category, they can be divided into two sub-sections: direct measurements and model, based on measurements. Direct measurement is a straightforward method, it makes use of direct measurements such as internal resistance or impedance to estimate battery SoH. First, for the method using internal resistance, the basis is that battery capacity loss and internal resistance are inversely proportional to each other, when the capacity of the battery degrades, internal resistance increases [6]. In the work of [7], the resistance is measured using Ohm’s law by applying current pulses. For the method measuring the impedance of the battery, the SoH is evaluated based on the estimation of the actual value of the impedance. Empirical evidence shows that impedance increase along with the degradation of battery and different battery dynamics exhibit influences in different frequency ranges of EIS measurement [5]. In the work of [8], equivalent circuit models were developed, and SoC and SoH were successfully determined using impedance values. However, the estimation is constrained into a single operational condition. Model-based on measurement such as the work of [4], the author uses the support vector machine (SVM) to find certain relations between the load collectives, which combines load condition with the cycling profile and capacity. As a result, this study proves SVM can be used to accurately estimate the SoH and, even more, the model manages to take different stress factors such as temperature and SoC into consideration. The generalization of the model is better than the work of [8]. However, the model indeed requires an abundant amount of data and the manipulation of load collectives for the input of SVM is sophisticated.

1.2. Adaptive Models

Adaptive methods pay more attention to the calculation of the parameters, which are sensitive to the degradation in a battery. The acquisition of such parameters must be consistent throughout the lifetime of the battery. This kind of methodology gives the possibility of conducting a limited number of tests and simulations which means that they can be adapted to many types of batteries. What’s more, they have high accuracy and are possible for in situ estimation. But these techniques require high computational effort and are difficult for BMS implementation [5]. The Kalman filter, extended Kalman filter, and least square are well-known adaptive methods for SoH estimation. In the work of [9], recurrent neural network (RNN), as one of the artificial neural networks, is used to estimate the SoH of a high-power-density Li-ion battery. Within the same work, EIS is also used to capture resistance as the input of RNN. However, the stress factors of the model are constrained to SoC and temperature, other factors like charging and discharging rates are neglected. In this study, a new hybrid methodology is proposed where measurements of EIS, such as charge transfer resistance and ohmic resistance, are extracted and combined with different stress factors to train a model based on BPNN. Backpropagation is a method to train the neural network based on previous errors. It fine-tunes the weights and thus, after several iterations, the model becomes more reliable. It is a suitable method for battery data training, thus, adopted in this work.
First, the background about the degradation of Li-ion batteries will be introduced. Then, Section 2 will use the measurement of EIS to analyze the aging mechanisms. Then, in Section 3, the data set is reconstructed to serve as the input of the model. The model is built and well trained, the validation results are shown and discussed. In the end, Section 4 will discuss the conclusions and some future developments of the model.

2. Data Acquisition and Analysis from EIS Measurement

2.1. Battery Degradation

The gradual aging of the battery begins immediately when they are assembled. The performance of Li-ion batteries deteriorates with usage and time, typically the capacity loss and power fade. The gradual aging again can be classified into the following groups.
  • Internal: Battery Design
During the manufacturing phase, the best performance of the battery can be achieved by selecting the appropriate types and quality of the material, designing the best battery system. These are all controllable factors.
  • External: Operational Condition
Externally, there are calendar aging and cyclic aging of the battery. First, when the battery is assembled, even if it is not used, calendar aging always exists and its aging is affected by temperature, SoC, and time [10,11]. Whereas for cyclic aging, first, temperature plays an important role in the sense that when the battery is cycled at a low temperature, the increase of internal resistance is much higher than the normal condition [12]. Then cycling current rates and cycling depth are also vital to aging [13]. For example, imagine a battery of EV when the driver’s driving mode is highly aggressive, meaning that he accelerates and decelerates the EV a lot, and he always exploits the battery until it reaches zero capacity. Indeed, in this way, the battery will age much faster. Last but not the least, cycle number is also an evident factor, as the more cycles the battery goes through, the older it will get. Sometimes, irregular pressure results in swelling of the battery cell and, as a result, pressure cannot be neglected either.

2.1.1. Aging Mechanisms

The aging mechanisms of lithium-ion batteries are complex and dependent on operational conditions. As mentioned in the previous paragraph, the degradation exhibits capacity fade or power loss; these performance fades can be treated as a result of several chemical processes and their interactions. There are many comprehensive reviews of reaction mechanisms related to performance fading and relevant modeling [14]. Considering their complexity, only the general idea will be introduced here. The degradation modes can be commonly categorized into three groups [10,15].
  • Loss of lithium ions: Li-ions that are blocked and unable to be intercalated between electrodes;
  • Loss of active material: reduced density of lithium storage sites or reduced electrode area and material;
  • Increase of impedance: reduction in cell power and further capacity fade by increased voltage drops due to increased impedance which prevents the battery from being fully discharged.

2.1.2. Degradation Indicators

When the battery fails to meet a certain requirement (power or energy) of its application, this point of the state of the battery is defined as the end of life (EoL). In order to ensure the safe operation of the application in spite of aging, it is highly important to develop reliable diagnostic and prognostic tools for battery health. State of health estimation is beneficial to track the actual performance of batteries during operation. Then the health indicator SoH is defined as the ability of a battery to store energy relative to its initial or ideal conditions. Since the battery degradation results in capacity fade or power loss, the mathematical expression is based on either of them [16].
SoH = Actual   capacity Initial   capacity × 100 %
or
SoH = Actual   resistance Initial   resistance × 100 %
When it comes to the application of EV, the energy or capacity of the battery matters more, the Equation (1) is often used to compute SoH. When the value of SoH is 100%, it means that the battery is new, whereas when the value reaches 80%, the battery is considered not usable for an EV, and it should be replaced. Similarly, when the impedance is doubled, meaning the impedance growth is 100%, the battery is also considered dead.
In this work, not only Equation (1) is used to compute the value of SoH, but also Equation (2) is used to check the EoL condition of tested batteries since the EIS and hybrid pulse power characterization (HPPC) is regularly performed to check the impedance and power results.

2.2. Data Acquisition

The lithium titanite (LTO) battery cells with a nominal capacity of 23 Ah are investigated in this study. The tested cells are in prismatic shape as shown in Figure 1. LTO anode-based batteries are well-known for their excellent properties of a long cycle life, safety, and capability of fast charging.
With the help of climate chambers in the Battery Innovation Center (BIC) of MOBI, the aging characterization is performed under different operational conditions. In total, 29 batteries with different aging protocols (charge rate, discharge rate, depth of discharge (DoD), cycling temperature, middle SoC) are tested. Before putting all the cells into the aging cycle, BoL characterization is performed to determine the initial condition of the batteries. When each period of 100 full equivalent cycles (FEC) passes, a check-up is performed to keep track of the battery state, during which the battery capacity is measured. EIS is also conducted every 1100 FEC to get the impedance spectrum. If the SoH of the tested battery is below 80%, it will be considered dead and EoL characterization will be conducted; otherwise, the aging cycle continues. The flowchart of the aging test is given in Figure 2. What was not mentioned above is the HPPC test. It is used to find the dynamic power capability over the device’s usable charge and voltage range (reachable voltage after discharge and maximum voltage after charge). The test profile of HPPC consists of charge and discharge pulses [17]. For this study, the data from the HPPC test will not be analyzed. The EIS measurements are conducted at room temperature 25 °C and at SoC intervals of 20%, 50%, 80%. The frequency range is set between 10 kHz and 5 mHz.
EIS is a powerful technique for studying every part of the battery: the electrodes, the separator, and the electrolyte. It is a non-destructive method which means it doesn’t require dismantling the battery cell. A reduced equivalent electrochemical model is applied to fit the electrochemical impedance spectrum of the battery (50% SoC and room temperature) in order to correctly extract the impedance values. The applied equivalent circuit model is shown in Figure 3. The resistor R1 is implemented to model the ionic conductivity of the electrolyte phase as well as the electronic conductivity of the solid phase material [18]. The value of R1 will be the needed ohmic resistance or solvent resistance. The inductance L1 represents the stray inductance caused by the current collector and leads. The paralleled RC branch represents the semicircle in Nyquist impedance where the constant phase element (CPE) Q2 models the double layer capacitor, by tuning the parameters of CPE, a compressed semi-circle can be modeled. The R2 simply represents charge transfer resistance.

2.3. Impedance Results

In this section, the impedance results (R0 and Rct) will be analyzed under different stress factors. The cycling profile for each cell consists of DoD, middle SoC, temperature, charge rate, and discharge rate. Therefore, all the stress factors above will be considered and their effect on the battery aging will be analyzed through the observation of the extracted R0 and Rct from curve fitting of 50% SoC.

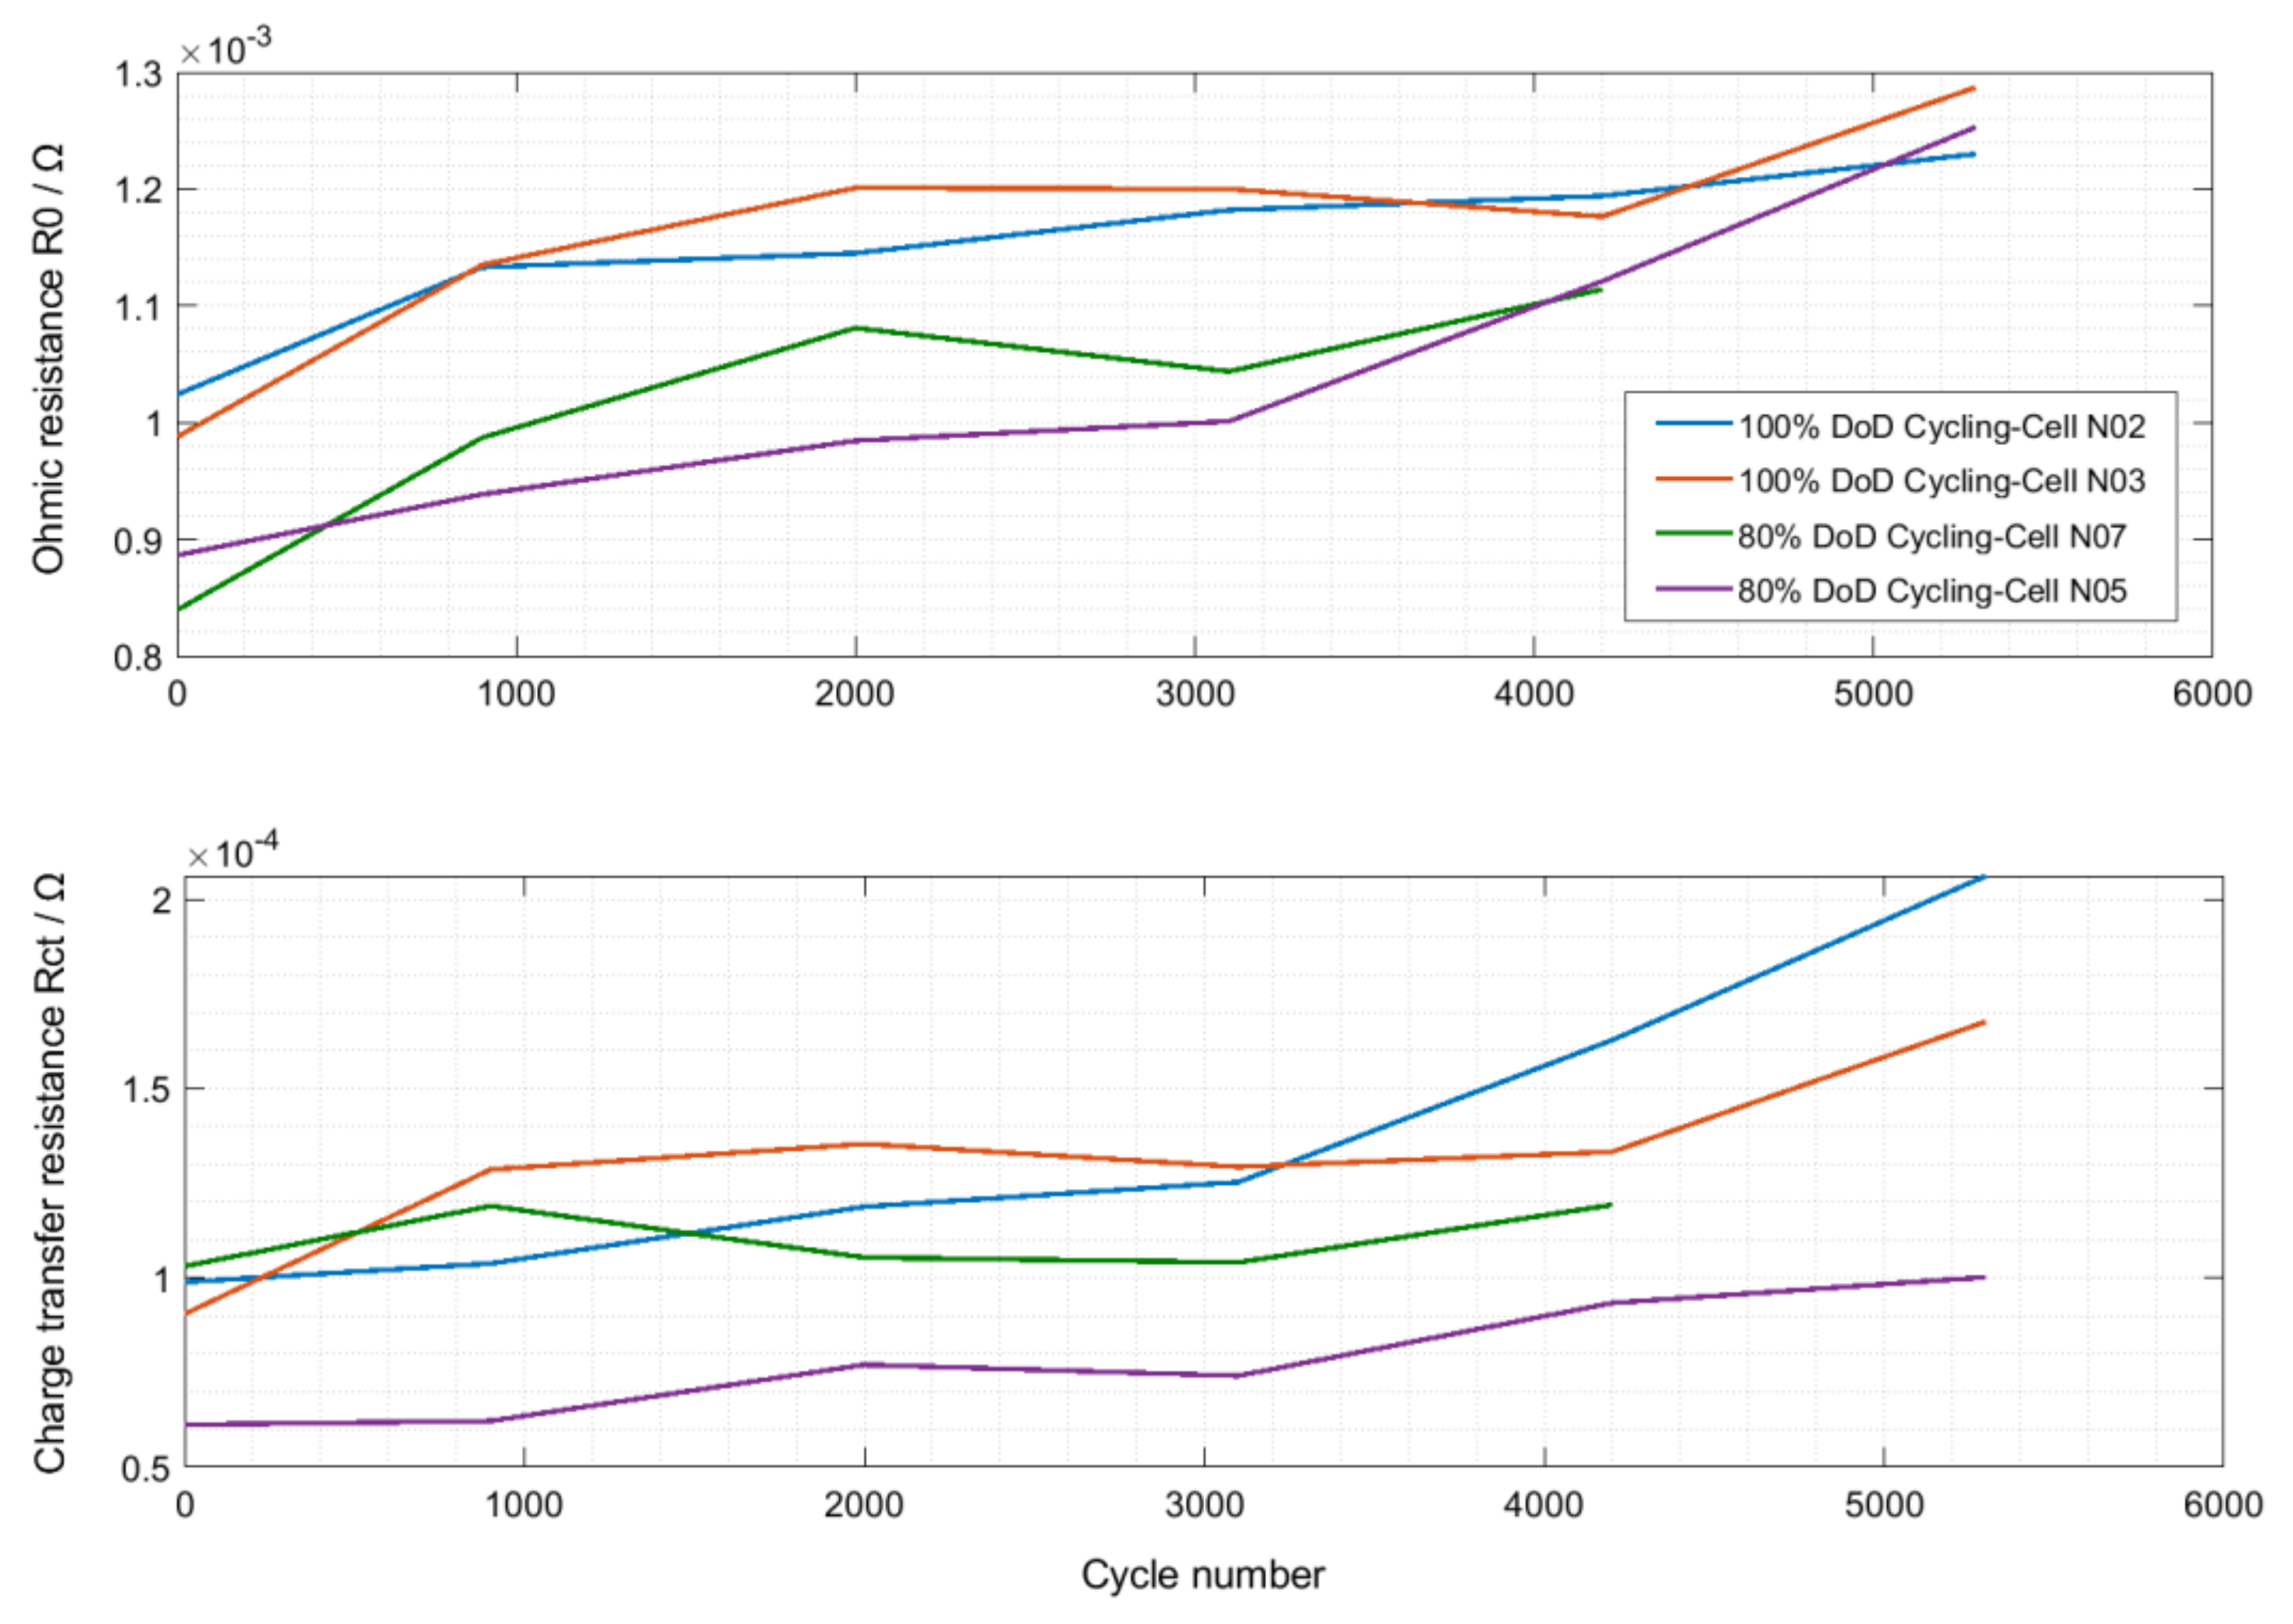
2.3.1. Stress Factor: Depth of Discharge

The DoD is one of the stress factors for the degradation of the battery. Four sets of cells with 100% and 80% DoD are plotted in Figure 4, the rest of the stress factors are considered identical with 50% SoC, 45 °C, and 2C charge/discharge rate. First of all, as the cells age, an obvious increasing trend for both R0 and Rct can be observed. Then, Figure 4 also shows that higher DoD generally results in higher R0 and Rct; however, the increasing rate seems to not be affected by different DoD. The increasing trend and higher value of R0 and Rct for cells cycled at 100% DoD can be explained by how, through the deeper cycling of the cells, the anode potential increases highly and results in the anodic dissolution of the copper current collector and formation of Cu2+ ions [15].

2.3.2. Stress Factor: Middle State of Charge

The R0 and Rct of three cells with different middle SoC and DoD are plotted in Figure 5a. One of them is cycled between 60% SoC and 100% SoC, the others are discharged deeper with the SoC interval of 10% and 90%. To begin with, R0 and Rct are not showing the same increasing trend as in the previous case. For R0, there are no particular relations for different cycling conditions, however, sometimes the value is dropping while the battery ages. For Rct, more clear trends are spotted, cells under shallow discharge show a faster increasing pattern. However, Figure 5b is also plotted, it shows SoH trends concerning cycle number. Expected and reasonable trends are observed that cells cycled at shallow discharge rates age slower. The strange values of R0 and Rct prove that accurate estimation of SoH will not be achieved if the model only considers a limited amount of characteristic input like R0. Due to the complex electrochemical reactions within the battery, the expected trend of certain impedance is not always observed. What’s more, when curve fitting is performed to extract impedance value, whether it is an acceptable fitting is fully determined by the person. That may lead to inconsistent quality of curve fitting and a strange value of impedance. Considering the impedance of the battery has a small order of magnitude, noise due to the sensitive measurement, electrical connection, and different components of the setup also influences the accuracy of the impedance value.

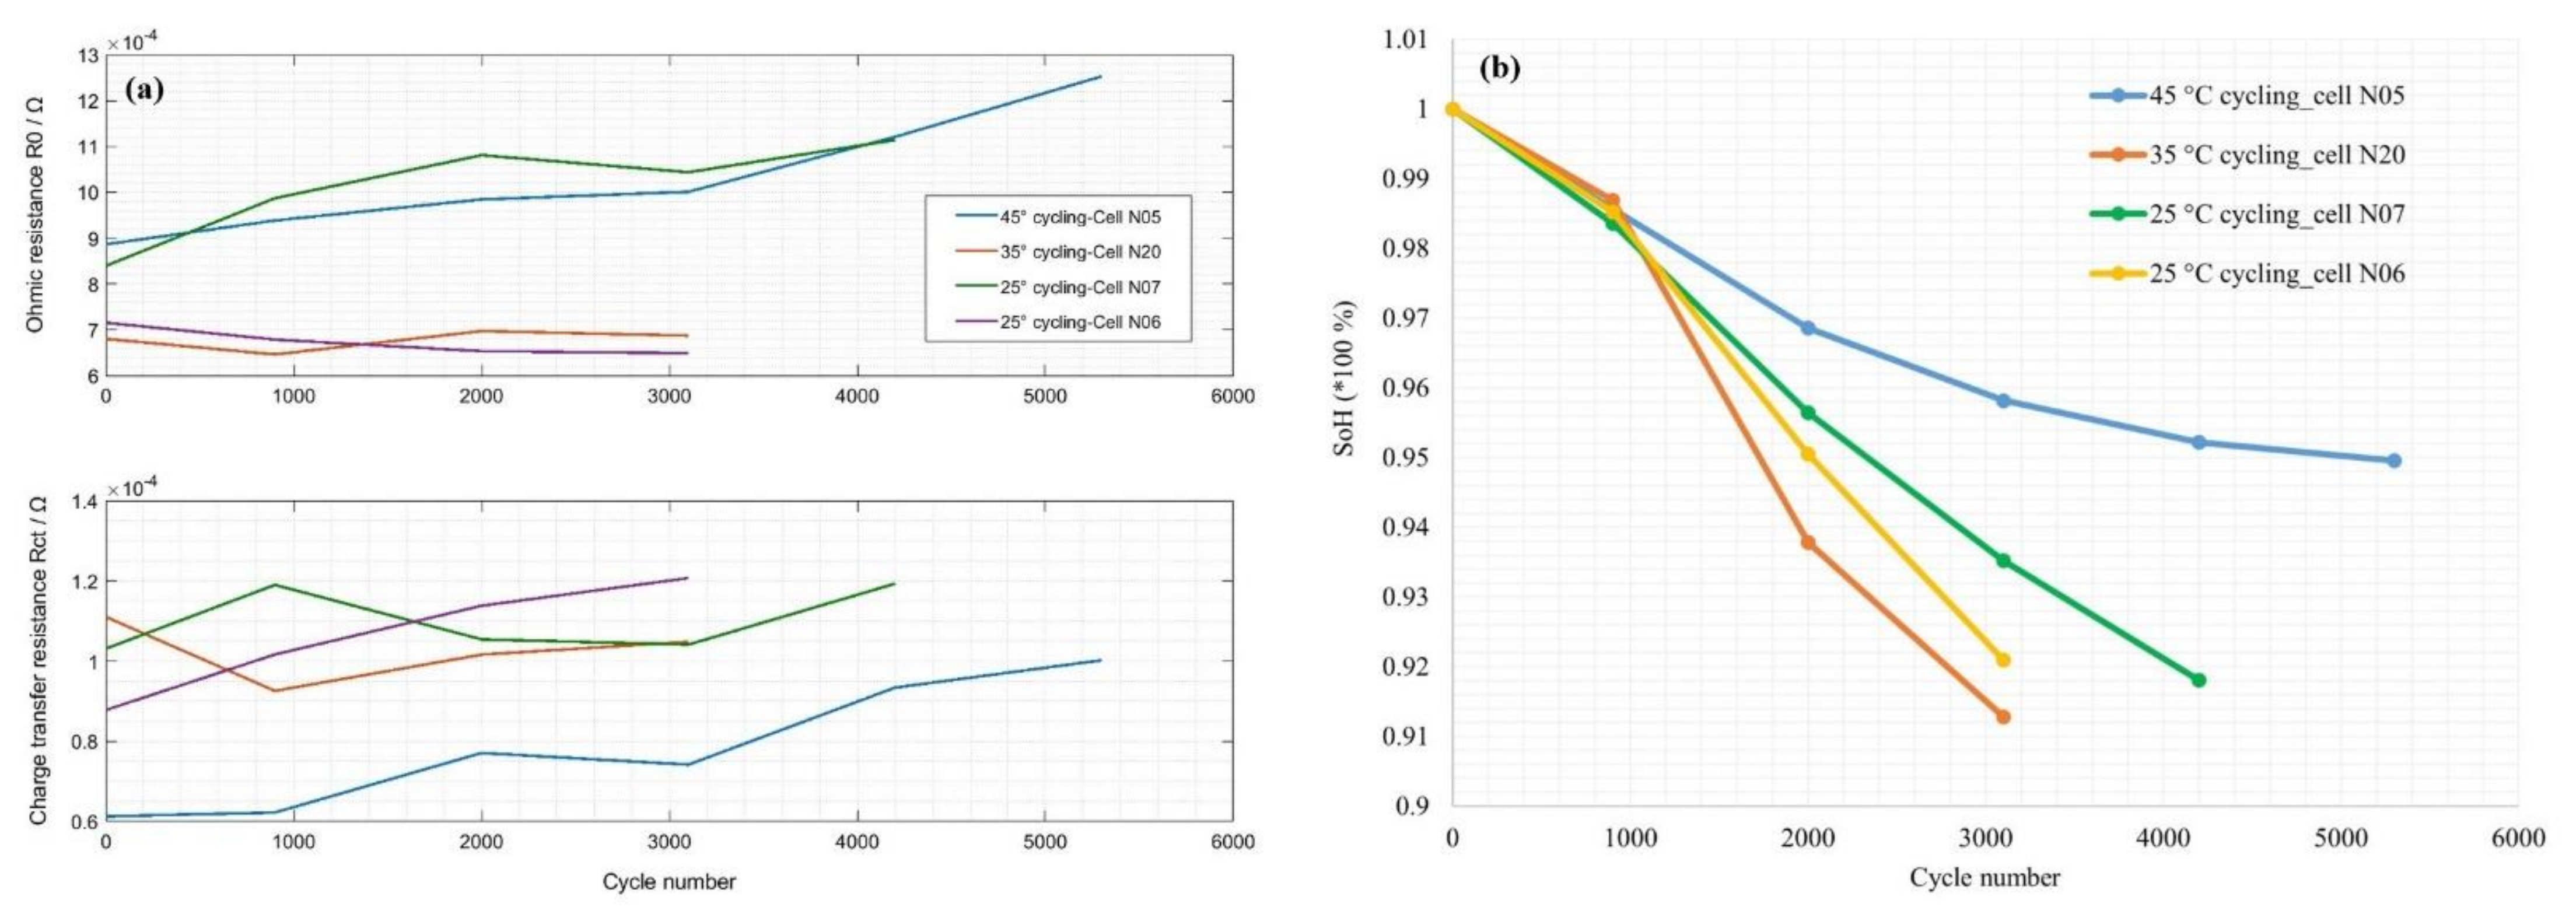
2.3.3. Stress Factor: Temperature

Wide operating temperature range is one of the excellent advantages of LTO anode-based battery, as is proven by Figure 6a,b. The increasing rate of each cell is relatively small even though their initial values at BoL are different. Generally, impedance curves for cells cycled at 35 °C and 25 °C are almost flat; for cells cycled at 45 °C, it is steeper. Figure 6b shows that cells cycled at 45 °C age slower that exhibits a good performance at high temperature. In general, at the temperature range of 25 °C to 45 °C, the SoH of each cell is still higher than 93% after 3100 cycle numbers showcasing the long cycle life of the batteries. Furthermore, considering the strong performance of the cells cycled at 45 °C, later when selecting input for SoH estimation model, the temperature should be included.

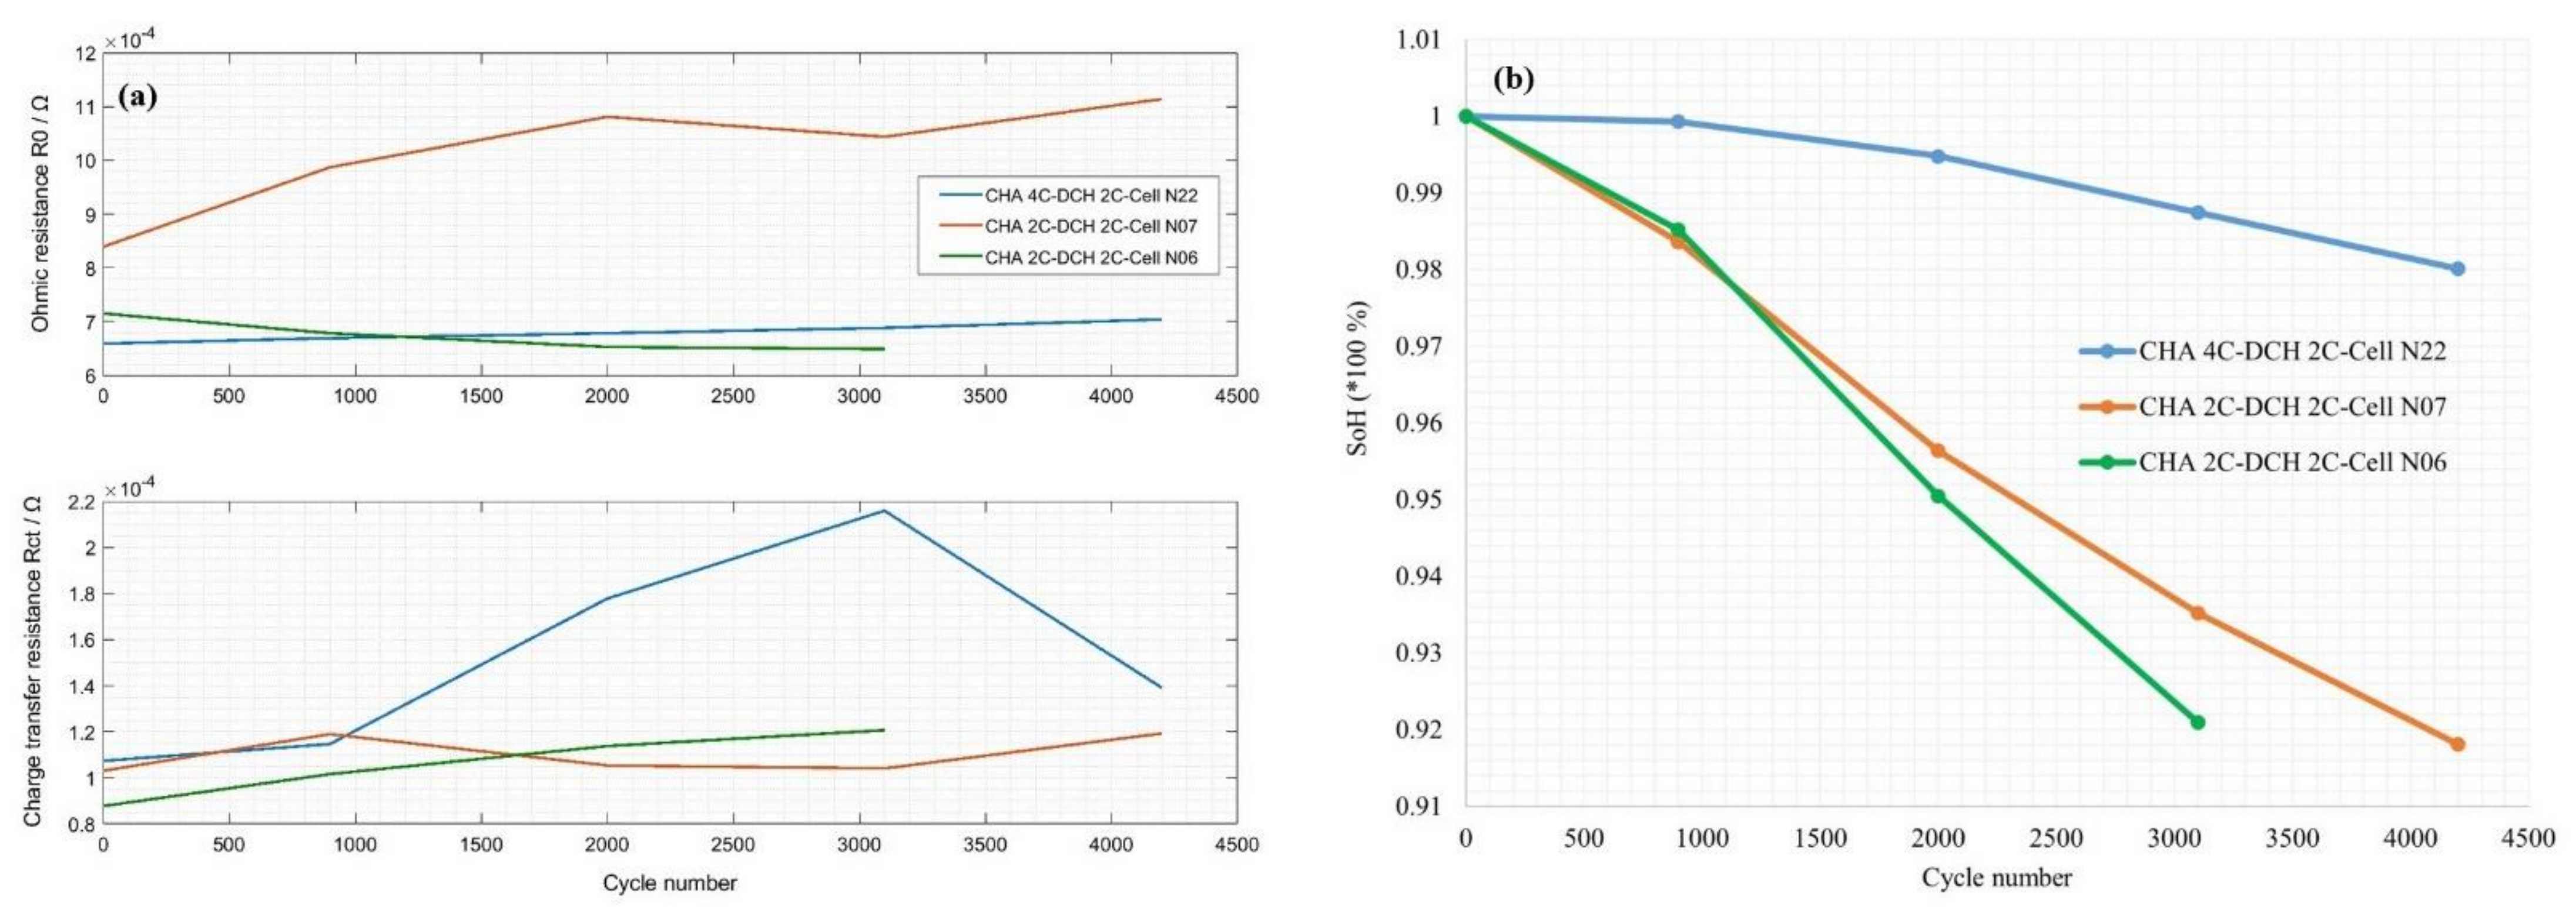
2.3.4. Stress Factor: Charge Rate

Another appealing property of the LTO anode-based battery is fast charging. As a result, this will be analyzed by plotting cells cycled at different charge rates in Figure 7a,b. Again, the influences of charge rate on impedance are not straightforward. For R0, the curve is flat even when the charge rate is 4C. For Rct, the cell with 4C charge rate seems increasingly faster. However, the impedance spectrum is missing at the 3300-cycle number and, as a result, an interpolation is performed to obtain the missing information in the data set, which may lead to some of the incoherency. Figure 7b shows that the slope of the decreasing line of SoH for cell charged at 4C rate is even smaller, the phenomenon may result from the different initial conditions or the temperature fluctuations when the capacity is checked. After all, the fast charge property is validated and will not result in faster SoH degradation.
Last but not least, before the chapter of model development of SoH estimation, for randomly picked cells, the impedance evolution for SoH is plotted in Figure 8. At first glance, the expected increase of impedance as the batteries become old is indeed discovered. Furthermore, for cells cycled at different operational conditions, the evolution trend is different, which leads to the possibility of using these two impedance values to estimate the SoH.

3. Model Development

Considering battery capacity is the most fundamental feature for EV operation, during the aging test, Equation (1) is used to determine the value of SoH. During the real-time operation, it is difficult to measure the current capacity immediately. As a result, in order to successfully estimate the SoH, a data-driven-based model combined with EIS measurements mentioned in Introduction 1 is applied to find the correlations between battery capacity and impedance (charge transfer resistance Rct and ohmic resistance R0). Due to the complex battery chemistries in design and manufacturing along with the different environmental and operational conditions, the difficulties in accurately considering all the dependencies on battery aging and covering all aspects of stress factors are high. Furthermore, when the reduced equivalent circuit is applied to fit the impedance results, it also introduces non-linearity and the varying dependence of the model parameters on SoC, DoD, temperature, current rate, etc. However, BPNN is considered to be a perfect alternative that is qualified for forecasting nonlinear dynamics and complex behaviors. The following model is based on BPNN to find the correlations between battery capacity fade and the increasing trend of R0 and Rct.

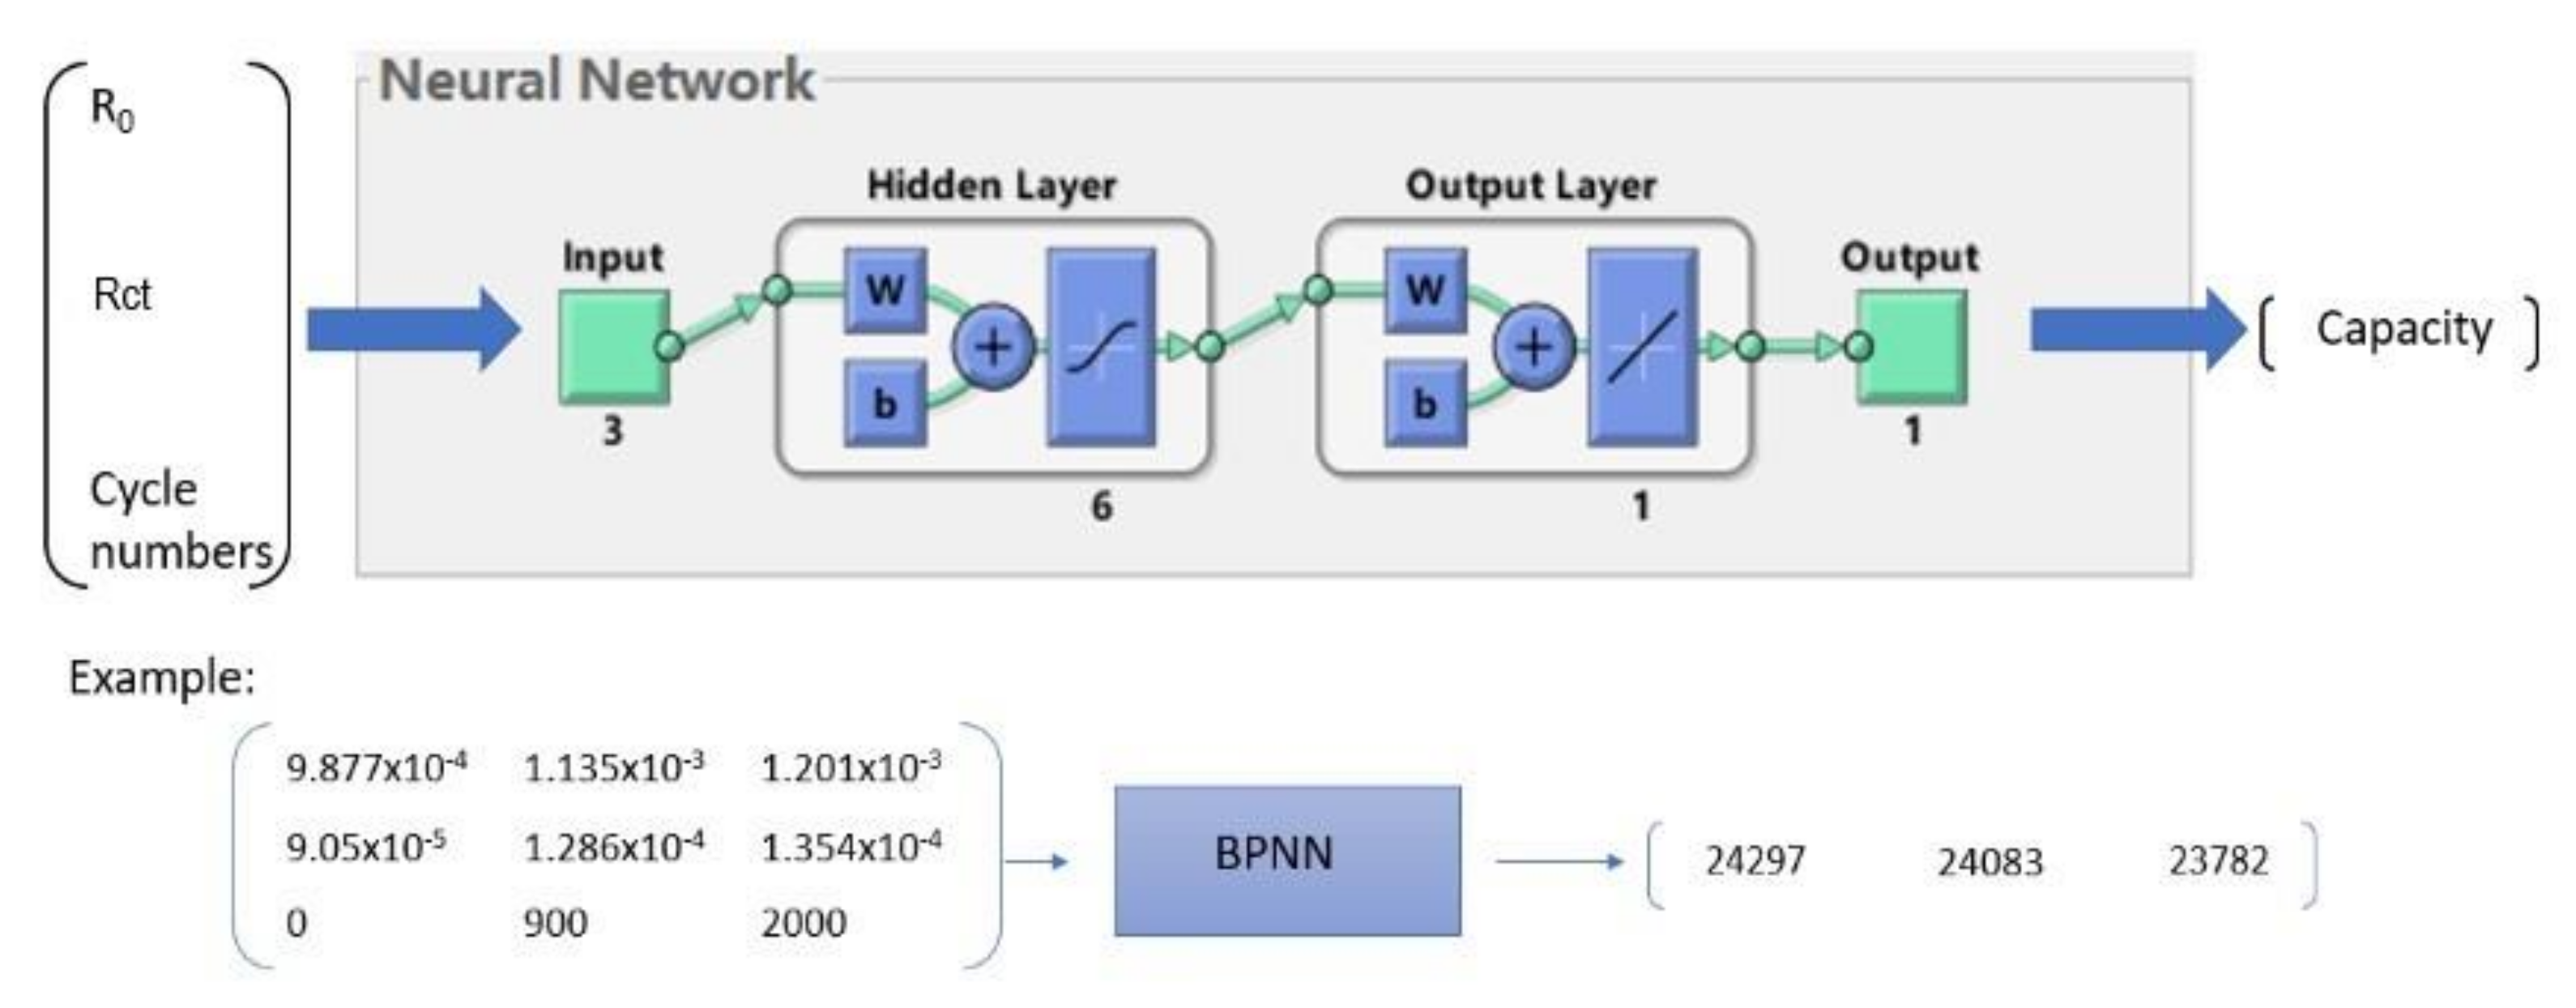
3.1. Back-Propagation Neural Network (BPNN)

The back-propagation neural network belongs to the category of artificial neural networks. The advantage of BPNN is its simple structure and the ability of non-linear mapping which provides the possibility of finding relationships between inputs and outputs with the desired accuracy. Moreover, there are only a few parameters to be tuned besides the selected activation function and training algorithm. Last but not least, it is a commonly used method that works well for different situations.
The general structure of BPNN is depicted in Figure 9. It consists of three layers: an input layer, a hidden layer (could be multiple layers), and an output layer. The model first needs to be trained with a certain dataset which consists of the input value and targeted output value. The overall training steps are shown below.
  • Initialization
The number of neurons (n, l, m) for the input layer, hidden layer, and output layer are decided based on the dimension of the input and output vector. The weights (wij, wjk) between layers are initialized along with the threshold a, b between the hidden layer and output layer. The activation function is also specified in advance.
  • Calculation of output between layers
Every hidden and output neuron first multiplies each input by its weight, then a summary of the product is passed through a nonlinear transfer function to calculate a result.
  • Calculation of error and update of weights and threshold
As mentioned before, the training is through modification of the weights of the neurons based on the calculated error between targeted output and actual output. For BPNN, it typically employs the gradient descent method combined with the backpropagation algorithm on the sum of squares of the errors. Repetitive training is conducted the same way for each epoch which stands for one complete update of weights until the error (usually the mean square error (MSE)) meets the user preset value. Different training functions and learning algorithms for updating weights and thresholds exist but they will not be discussed here. More details can be found in [19]. The error is calculated using Equation (3) [20], supposing the true output is zi, the throughput of the network is yi.
ei = ziyi, i = 1, 2, L.., m
The update of weights is given below [20].
w i j = w i j + η H j ( 1   H j ) x ( i )   k = 1 m w i j e k ,   i = 1 ,   2 ,   K ,   n ,   j = 1 ,   2 ,   K . . ,   l w j k = w j k + η H jek ,   j = 1 ,   2 ,   K . . ,   l ,   k = 1 ,   2 ,   K ,   m
The threshold value for each node must fulfill the below equations [20]:
a j = a j + ƞ H j ( )   k = 1 m w i j e k ,   j = 1 ,   2 ,   k . . ,   l b k = b k + e k , k = 1 ,   2 ,   k . . ,   m
If the model is well trained, then whenever a new set of input is loaded into the model, the estimated output will be computed.

3.2. Training Input

As mentioned in the previous chapter, both R0 and Rct exhibit an increasing trend as the battery ages. Among all 29 tested cells, 2 of them are under dynamic cycling (operating temperature 25 °C and 35 °C), these two cells are used to validate the developed model. The rest of the cells are used to collect training data. Then, for the consideration of different stress factors to improve model generalization and robustness, the following solution is proposed. First, from the perspective of middle SoC, DoD, and charge/discharge rates, the operational condition for real cells is not constant, for example, the using pattern of the battery in EV is fully dependent on the driver. The training data set is constructed in a way that the chosen cells are cycled under different middle SoC, DoD, and charge/discharge rates as much as possible, so the diversity of different stress factors, except temperature, is covered. Whereas, for the temperature, the influence of this factor is covered by training a separate model for each temperature interval. For example, there will be a model which is trained using cells cycled at 25 °C to estimate the SoH of cells whose operational temperature is around 25 °C. Many simulations based on different training data set and model parameters are performed in order to improve the accuracy of the model. The following model parameters are considered to be the most suitable ones.

3.2.1. Optimized Model for Cell No. 24 (Cycling Temperature: 25 °C)

  • Transfer function: the S-shaped sigmoid function (Equation (6)) where a is set to be 1.
    f x = 1 1 + e a x
  • Training algorithm: Levenberg–Marquardt algorithm.
  • Number of hidden layer neurons: 8.

3.2.2. Optimized Model for Cell No. 32 (Cycling Temperature: 35 °C)

The parameters for the model of 35 °C are the same as before except the optimal number of hidden layers is changed due to the new composition of the training data set.
  • Number of hidden layer neurons: 6
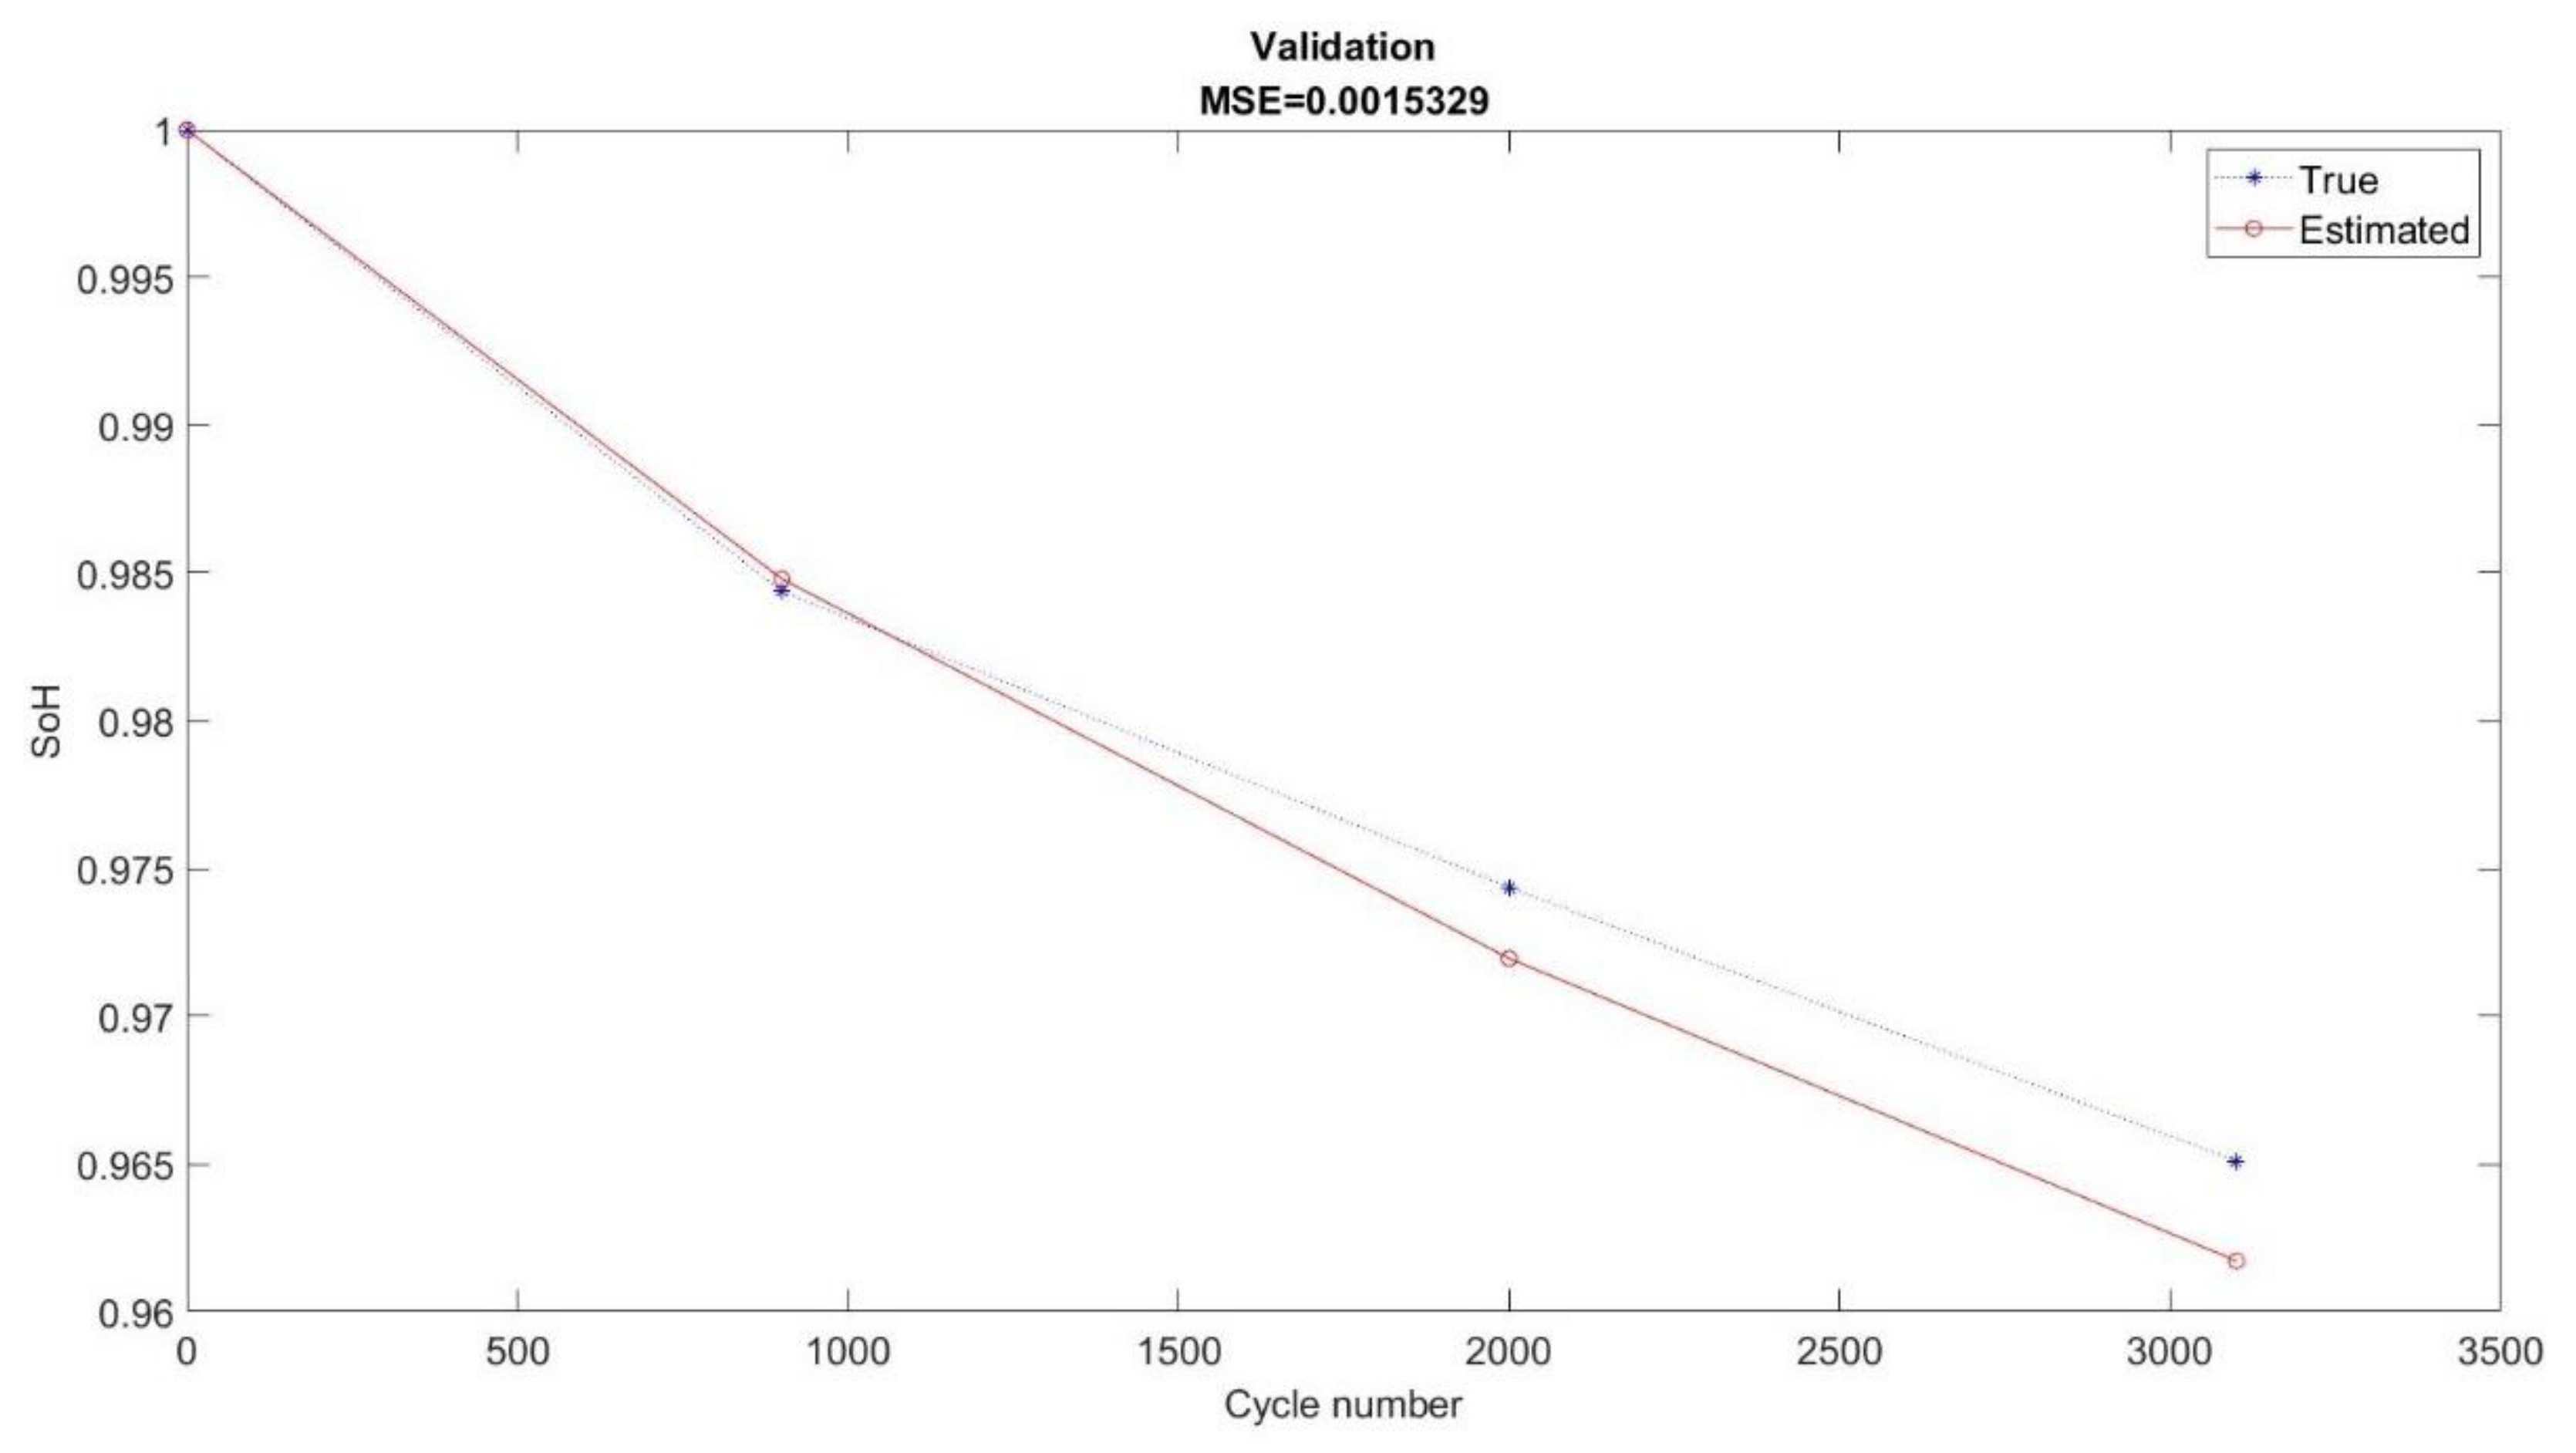
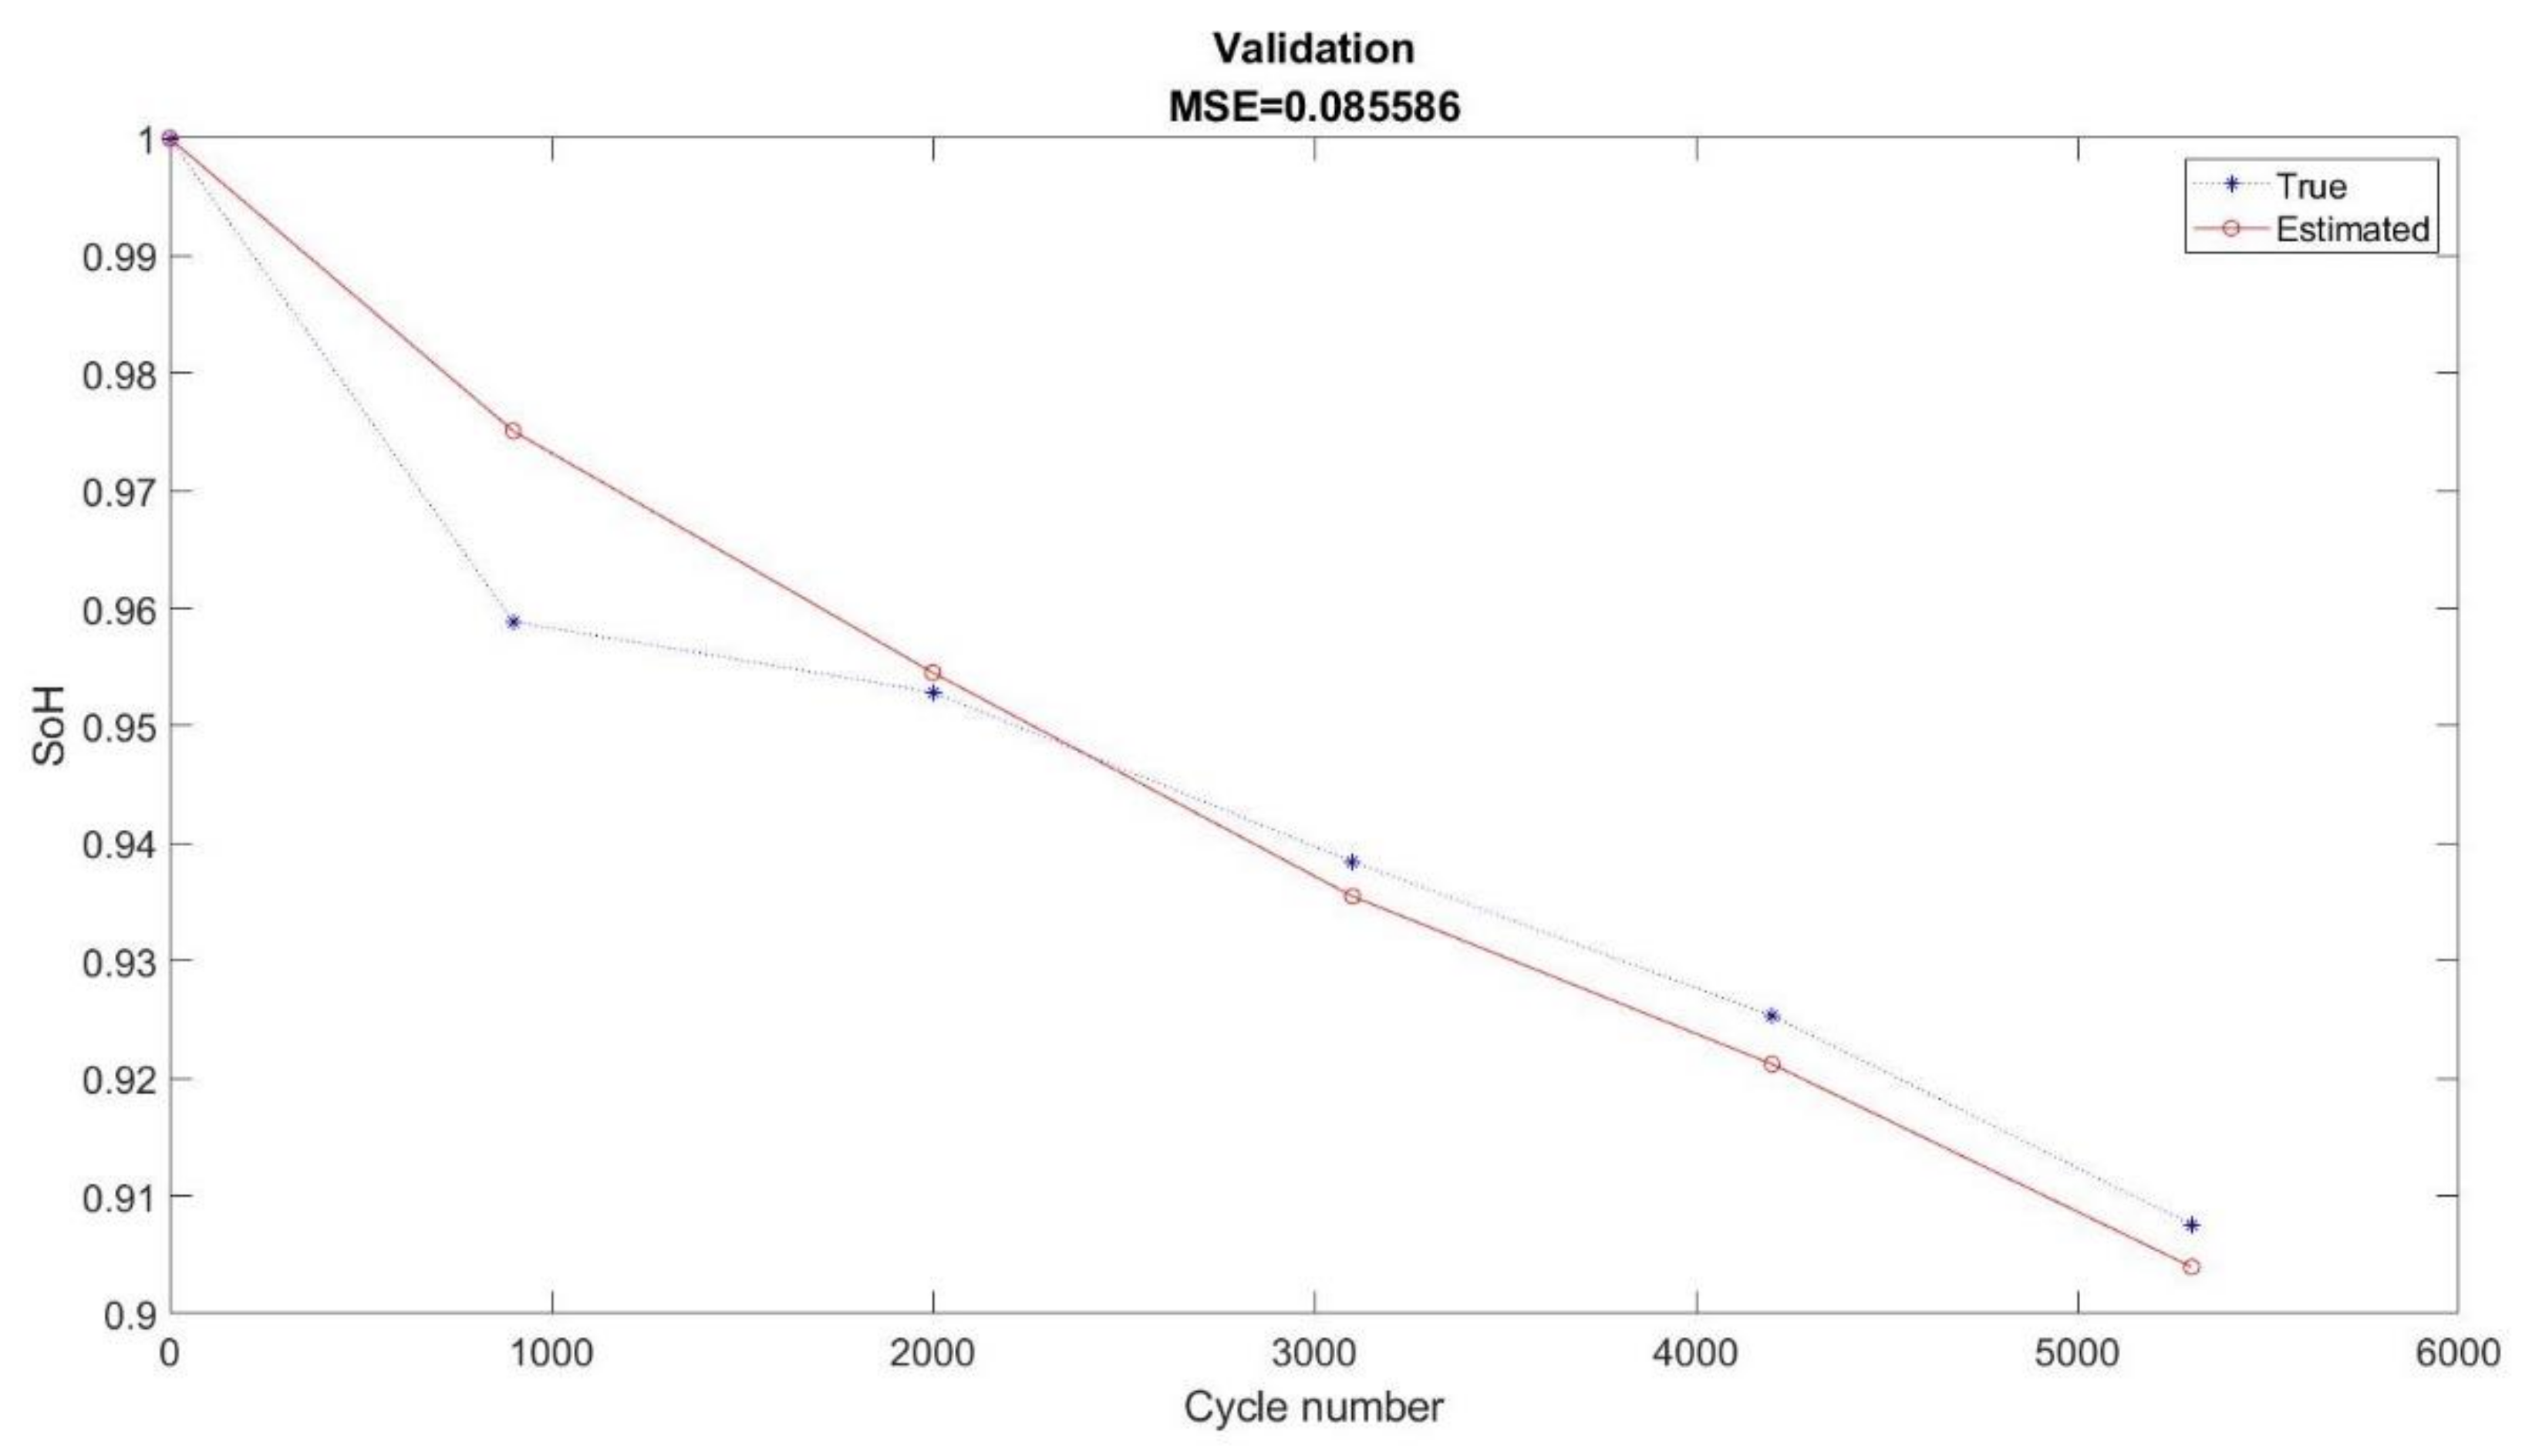
A general structure of the BPNN along with the input and output vector are shown in Figure 9.

3.3. Validation

When the model is finished with the training procedure, cells No. 24 and No. 32 are used to validate the accuracy of the model. The results are plotted in Figure 10 and Figure 11 along with the mean-squared-error (MSE) depicted in the upper part of the curve. The MSE is calculated using Equation (7), where k is the time indices represent the cycle numbers.
M S E = 1 n . i = 1 n ( Y e s t i m a t e k Y r e a l k ] 2
From Figure 10 and Figure 11, it can be seen that the value of mean square error (MSE) for both validation cells is relatively small which reveals that the model is able to estimate the SoH accurately while the battery ages. For the case of cell No. 32, the model manages to keep accurate track of the decreasing trend in SoH, the maximum error is even smaller than 0.3%. However, for the case of No. 24, there is a sudden drop in SoH at the early stage (1000 cycle numbers) of the battery which the model fails to catch. An error of 1.5% can be noticed around cycle number of 1000 but the accuracy is regained after 2000 cycle numbers. The reason behind the sudden drop in SoH at an early stage is yet unknown; however, it can be inferred that the influence of such a phenomenon on two impedances that the model takes as input are small. If more input can be discovered, for example, Cdl (which stands for electrical double layer capacitance) can be input because the capacitance tends to increase with respect to the degradation process of battery [20,21], the model is believed to be more accurate.

3.4. Discussion and Limitation

Fast convergence and high accuracy are discovered during the implementation of the networks. Generally, only 5 to 10 epochs (iterations) are needed for the training algorithms to reach the expected minimum error. The MSE of the validation groups is small but due to the fact that the cells under dynamic cycling are still being tested, the model is validated only up to 3100 cycle numbers for cell No. 32 and 5300 cycle numbers for cell No. 24. The SoH of these two validation cells is still higher than 90%. As a result, the validation can only verify the accuracy of this model when it comes to the early state of the battery. However, for this early stage, the model is able to estimate the SoH with high accuracy. Furthermore, the model shows good generalization properties. Even though specified models are trained separately for validation cells No. 24 and No. 32, the model suitable for No. 24 also generates an acceptable estimation for No. 32 with the MSE of 0.172. Compared with the work of [18], where only the Rct and converted Rct are used, this model estimates the SoH with higher accuracy. The implementation of the BPNN and construction of the training data set is rather simple compared with the work of [4], where a special technique is applied to combine the input value with load collectives in order to enable the model to consider different stress factors. In this work, the superiority of the model includes an extended investigation of a commercial LTO cell, impedance characterization, and parameter extraction during the long-term cycling, model training with R0 and Rct, and finally, validating with dynamically cycled cells. This wide range of studies is rarely found in the literature altogether. Hence, the model accuracy provides a very accurate SoH estimation until 5000 cycles (for cell No. 24) that proofs the robustness comparatively.

4. Conclusions

In this study, a combination of EIS measurement and BPNN methodology is applied to build an accurate model for the SoH estimation of LTO anode-based lithium-ion batteries. The model is proven to be capable of estimating SoH with high accuracy for cells at its early stages, taking into consideration the different aging stress factors, such as temperature, depth of discharge, and charge/discharge rate. In the future, more aging tests including more different operating conditions can be designed and conducted, more data can be extracted using EIS measurement to guarantee the back-propagation neural network have enough training data set. Besides that, considering the long timeline of the aging tests, an accelerated aging profile can be designed to obtain more data within a shorter time period. The obtained training dataset can be trained with other advanced algorithms, such as the deep neural network, etc., to compare model performances. Furthermore, this model can be combined with the embedded sensor mentioned in the Spartacus project [22], where EIS can be performed when a battery is in use. Using real-life and real-time data to train and adapt the model, higher accuracy of the estimation will be achieved [23].

Author Contributions

Conceptualization, M.S.H.; Methodology, M.S.H., and T.K.; Software, S.Z.; Validation, S.Z., and M.S.H.; Formal analysis, M.S.H.; Investigation, M.S.H.; Data curation, S.Z.; Writing—original draft preparation, S.Z., and M.S.H.; Writing—review and Editing, M.S.H., T.K., and J.V.M.; Supervision, M.B. All authors have read and agreed to the published version of the manuscript.

Funding

The authors would like to thank the Horizon2020 project GHOST (grant number 770019) for providing the fund and battery cells that are studied in this work.

Acknowledgments

This research was developed under the framework of the GHOST project that has received funding from the European Union’s Horizon 2020 research and innovation program under grant agreement No 770019.
Wevj 12 00156 i001

Conflicts of Interest

The authors declare no conflict of interest.

References

  1. Electric Vehicle Market Research Report. Available online: https://www.fortunebusinessinsights.com/industry-reports/electric-vehicle-market-101678 (accessed on 26 March 2021).
  2. Scrosati, B.; Garche, J. Lithium batteries: Status, prospects and future. J. Power Sources 2010, 195, 2419–2430. [Google Scholar] [CrossRef]
  3. Cornet d’Elzius, M.; Duerinck, J.; Laes, E.; Lodewijks, P.; Meynaerts, E.; Pestiaux, J.; Renders, N.; Vermeulen, P. Scenarios for a Low-Carbon Belgium by 2050; Climact: Louvain-la-Neuve, Belgium; Vito: Mol, Belgium, 2013. [Google Scholar] [CrossRef]
  4. Nuhic, A.; Terzimehic, T.; Soczka-Guth, T.; Buchholz, M.; Dietmayer, K. Health diagnosis and remaining useful life prognostics of lithium-ion batteries using data-driven methods. J. Power Sources 2013, 239, 680–688. [Google Scholar] [CrossRef]
  5. Berecibar, M.; Gandiaga, I.; Villarreal, I.; Omar, N.; Van Mierlo, J.; van den Bossche, P. Critical review of state of health estimation methods of Li-ion batteries for real applications. Renew. Sustain. Energy Rev. 2016, 56, 572–587. [Google Scholar] [CrossRef]
  6. Venugopal, P.T.V. State-of-Health Estimation of Li-ion Batteries in Electric Vehicle Using IndRNN under Variable Load Condition. Energies 2019, 12, 4338. [Google Scholar] [CrossRef] [Green Version]
  7. Haifeng, D.; Xuezhe, W.; Zechang, S. A new SOH prediction concept for the power lithium-ion battery used on HEVs. In Proceedings of the 2009 IEEE Vehicle Power and Propulsion Conference, Dearborn, MI, USA, 7–10 September 2009; pp. 1649–1653. [Google Scholar]
  8. Mingant, R.; Bernard, J.; Moynot, V.S.; Delaille, A.; Mailley, S.; Hognon, J.-L.; Huet, F. EIS Measurements for Determining the SoC and SoH of Li-Ion Batteries. ECS Trans. 2010, 33, 41–53. [Google Scholar] [CrossRef]
  9. Eddahech, A.; Briat, O.; Bertrand, N.; Delétage, J.-Y.; Vinassa, J.-M. Behavior and state-of-health monitoring of Li-ion batteries using impedance spectroscopy and recurrent neural networks. Int. J. Electr. Power Energy Syst. 2012, 42, 487–494. [Google Scholar] [CrossRef]
  10. Groot, J. State-of-Health Estimation of Li-Ion Batteries: Cycle Life Test Methods 2012; Chalmers Tekniska Hogskola: Gothenburg, Sweden, 2012. [Google Scholar]
  11. de Hoog, J.; Timmermans, J.-M.; Ioan-Stroe, D.; Swierczynski, M.; Jaguemont, J.; Goutam, S.; Omar, N.; Van Mierlo, J.; Van Den Bossche, P. Combined cycling and calendar capacity fade modeling of a Nickel-Manganese-Cobalt Oxide Cell with real-life profile validation. Appl. Energy 2017, 200, 47–61. [Google Scholar] [CrossRef]
  12. Omar, N.; Monem, M.A.; Firouz, Y.; Salminen, J.; Smekens, J.; Hegazy, O.; Gaulous, H.; Mulder, G.; Van Den Bossche, P.; Coosemans, T.; et al. Lithium iron phosphate based battery—Assessment of the aging parameters and development of cycle life model. Appl. Energy 2014, 113, 1575–1585. [Google Scholar] [CrossRef]
  13. Sarasketa-Zabala, E.; Gandiaga, I.; Laserna, E.M.; Rodriguez-Martinez, L.; Villarreal, I. Cycle ageing analysis of a LiFePO4/graphite cell with dynamic model validations: Towards realistic lifetime predictions. J. Power Sources 2015, 275, 573–587. [Google Scholar] [CrossRef]
  14. Arora, P.; White, R.E.; Doyle, M. Capacity Fade Mechanisms and Side Reactions in Lithium-Ion Batteries. J. Electrochem. Soc. 1998, 145, 3647–3667. [Google Scholar] [CrossRef] [Green Version]
  15. Li, Y.; Liu, K.; Foley, A.; Zülke, A.; Berecibar, M.; Nanini-Maury, E.; Van Mierlo, J.; Hoster, H.E. Data-driven health estimation and lifetime prediction of lithium-ion batteries: A review. Renew. Sustain. Energy Rev. 2019, 113, 109254. [Google Scholar] [CrossRef]
  16. Liu, D.; Pang, J.; Zhou, J.; Peng, Y.; Pecht, M. Prognostics for state of health estimation of lithium-ion batteries based on combination Gaussian process functional regression. Microelectron. Reliab. 2013, 53, 832–839. [Google Scholar] [CrossRef]
  17. Omar, N.; Van Mierlo, J.; Verbrugge, B.; Bossche, P.V.D. Power and life enhancement of battery-electrical double layer capacitor for hybrid electric and charge-depleting plug-in vehicle applications. Electrochim. Acta 2010, 55, 7524–7531. [Google Scholar] [CrossRef]
  18. Wang, X.; Wei, X.; Dai, H. Estimation of state of health of lithium-ion batteries based on charge transfer resistance considering different temperature and state of charge. J. Energy Storage 2019, 21, 618–631. [Google Scholar] [CrossRef]
  19. Hornik, K. Approximation capabilities of multilayer feedforward networks. Neural Netw. 1991, 4, 251–257. [Google Scholar] [CrossRef]
  20. Liu, H. Research on Estimation of State of Health of Li-Ion Battery Based on Wavelength Spectrum and Time Domain Measurement. Master’s Thesis, Harbin Institute of Technology, Shenzhen, China, 2018. [Google Scholar]
  21. Ovejas, V.J.; Cuadras, A. Impedance Characterization of an LCO-NMC/Graphite Cell: Ohmic Conduction, SEI Transport and Charge-Transfer Phenomenon. Batteries 2018, 4, 43. [Google Scholar] [CrossRef] [Green Version]
  22. SPARTACUS Project-Battery 2030. Available online: https://battery2030.eu/research/research-projects/spartacus/ (accessed on 26 March 2021).
  23. Hosen, S.; Youssef, R.; Kalogiannis, T.; Van Mierlo, J.; Berecibar, M. Battery cycle life study through relaxation and forecasting the lifetime via machine learning. J. Energy Storage 2021, 40, 102726. [Google Scholar] [CrossRef]
Figure 1. Studied LTO battery.
Wevj 12 00156 g001
Figure 2. Flowchart of the aging test.
Wevj 12 00156 g002
Figure 3. Equivalent electrochemical model.
Wevj 12 00156 g003
Figure 4. Impedance evolution for cells cycled at different DoD.
Wevj 12 00156 g004
Figure 5. Cell degradation cycled at different DoD and middle SoC; (a) impedance evolution, (b) capacity fade.
Wevj 12 00156 g005
Figure 6. Cell degradation cycled at different temperatures; (a) impedance evolution, (b) capacity fade.
Wevj 12 00156 g006
Figure 7. Cell degradation cycled at different charge rates; (a) impedance evolution, (b) capacity fade.
Wevj 12 00156 g007
Figure 8. Impedance evolution with respect to SoH.
Wevj 12 00156 g008
Figure 9. Structure of the backpropagation neural network.
Wevj 12 00156 g009
Figure 10. Validation for SoH estimation; of cell No. 24.
Wevj 12 00156 g010
Figure 11. Validation for SoH estimation of cell No. 32.
Wevj 12 00156 g011
Publisher’s Note: MDPI stays neutral with regard to jurisdictional claims in published maps and institutional affiliations.

