1. Introduction
The development of the automobile industry has provided convenience to people, although it has also had adverse effects, such as environmental pollution and greenhouse effects, on the world. Effective solutions are urgently required to alleviate this problem. In [
1,
2,
3,
4], the authors proposed four energy management strategies to achieve the optimal allocation of required power to reduce consumption. In [
5], an optimization method is proposed for energy management strategies based on the principle of the minimum value. In [
6], hybrid energy storage systems are used to effectively solve the above problems, showing that the need for related theories and technological breakthroughs is becoming urgent. This paper comprehensively summarizes the key issues regarding the control and management of hybrid energy storage systems from multiple perspectives. In [
7], a permanent magnet synchronous motor (PMSM) is used to simulate the traction components of electric vehicles, a new type of fuzzy logic energy management strategy is proposed for a battery–supercapacitor hybrid energy storage system, and its feasibility is verified through experiments. In addition, formulating an optimal control method to optimize vehicle behavior can also effectively solve this problem.
In recent years, intelligent control methods based on neural networks and fuzzy control have also been applied to vehicle energy management technologies, as they are better than the typical rule-based control method. For the method described in [
8], when the fuel consumption rates or emissions are used as the design indicators, the data can be trained on different driving conditions to predict vehicle behavior in the neural network models. In [
9], a neural network is used to predict the road conditions and the degree of traffic congestion online and for vehicle energy management. In [
10], an effective energy management system for HESS in hybrid electric vehicles is developed based on the concept of a neural network using a closed method. In [
11], a neural network is used to manage the energy flow between the energy storage and load in pure electric vehicles and hybrid vehicles. The input of the neural network controller is the output voltage and input current of the converter, while the output signal is controlled by the neural network based on the compared sampling frequency and the adjusting waveform. The fuzzy controller is also used in the vehicle management strategies. In [
12], the fuzzy controller is designed to distribute the power between the motor and the engine and to optimize the efficiency of the driving system based on the command, the battery SOC and the motor speed. In [
13], the energy flow of a single-axis parallel hybrid vehicle is analyzed using the fuzzy control method. The first input value of the controller is the difference between the required torque and the target torque, which is then negotiated with the required torque, while the second input is the battery SOC. The controller will output the torque control coefficient to distribute the torque between the engine and the motor in real time. Similarly, the fuzzy control is applied to the management of HESS and a fuzzy logic controller is used to distribute the power between the driving system and the energy storage system in [
14,
15]. In [
16], Hu proposes a rule-based adaptive controller based on fuzzy rules by analyzing HESS dynamic programming allocation. Xu and Wang combine supercapacitors with batteries and adopt a parallel interleaving method in a DC/DC converter using the fuzzy control strategy [
17], after which the power system greatly improves the overall performance of HESS. In [
18,
19], Zhou designs a logic threshold control strategy for the HESS of pure electric vehicles. The results show that this control strategy can avoid the large-current impacts and improve the service life of the battery and the driving range of the vehicle. With the deepening of the research, the team applies fuzzy control to the energy management of HESS. In [
20], the results prove that fuzzy control can improve vehicle performance. Compared with traditional methods, fuzzy control can obtain better results; however, fuzzy control mainly relies on expert experience, while the rule formulation and membership function both have an impact on the accuracy of the controller.
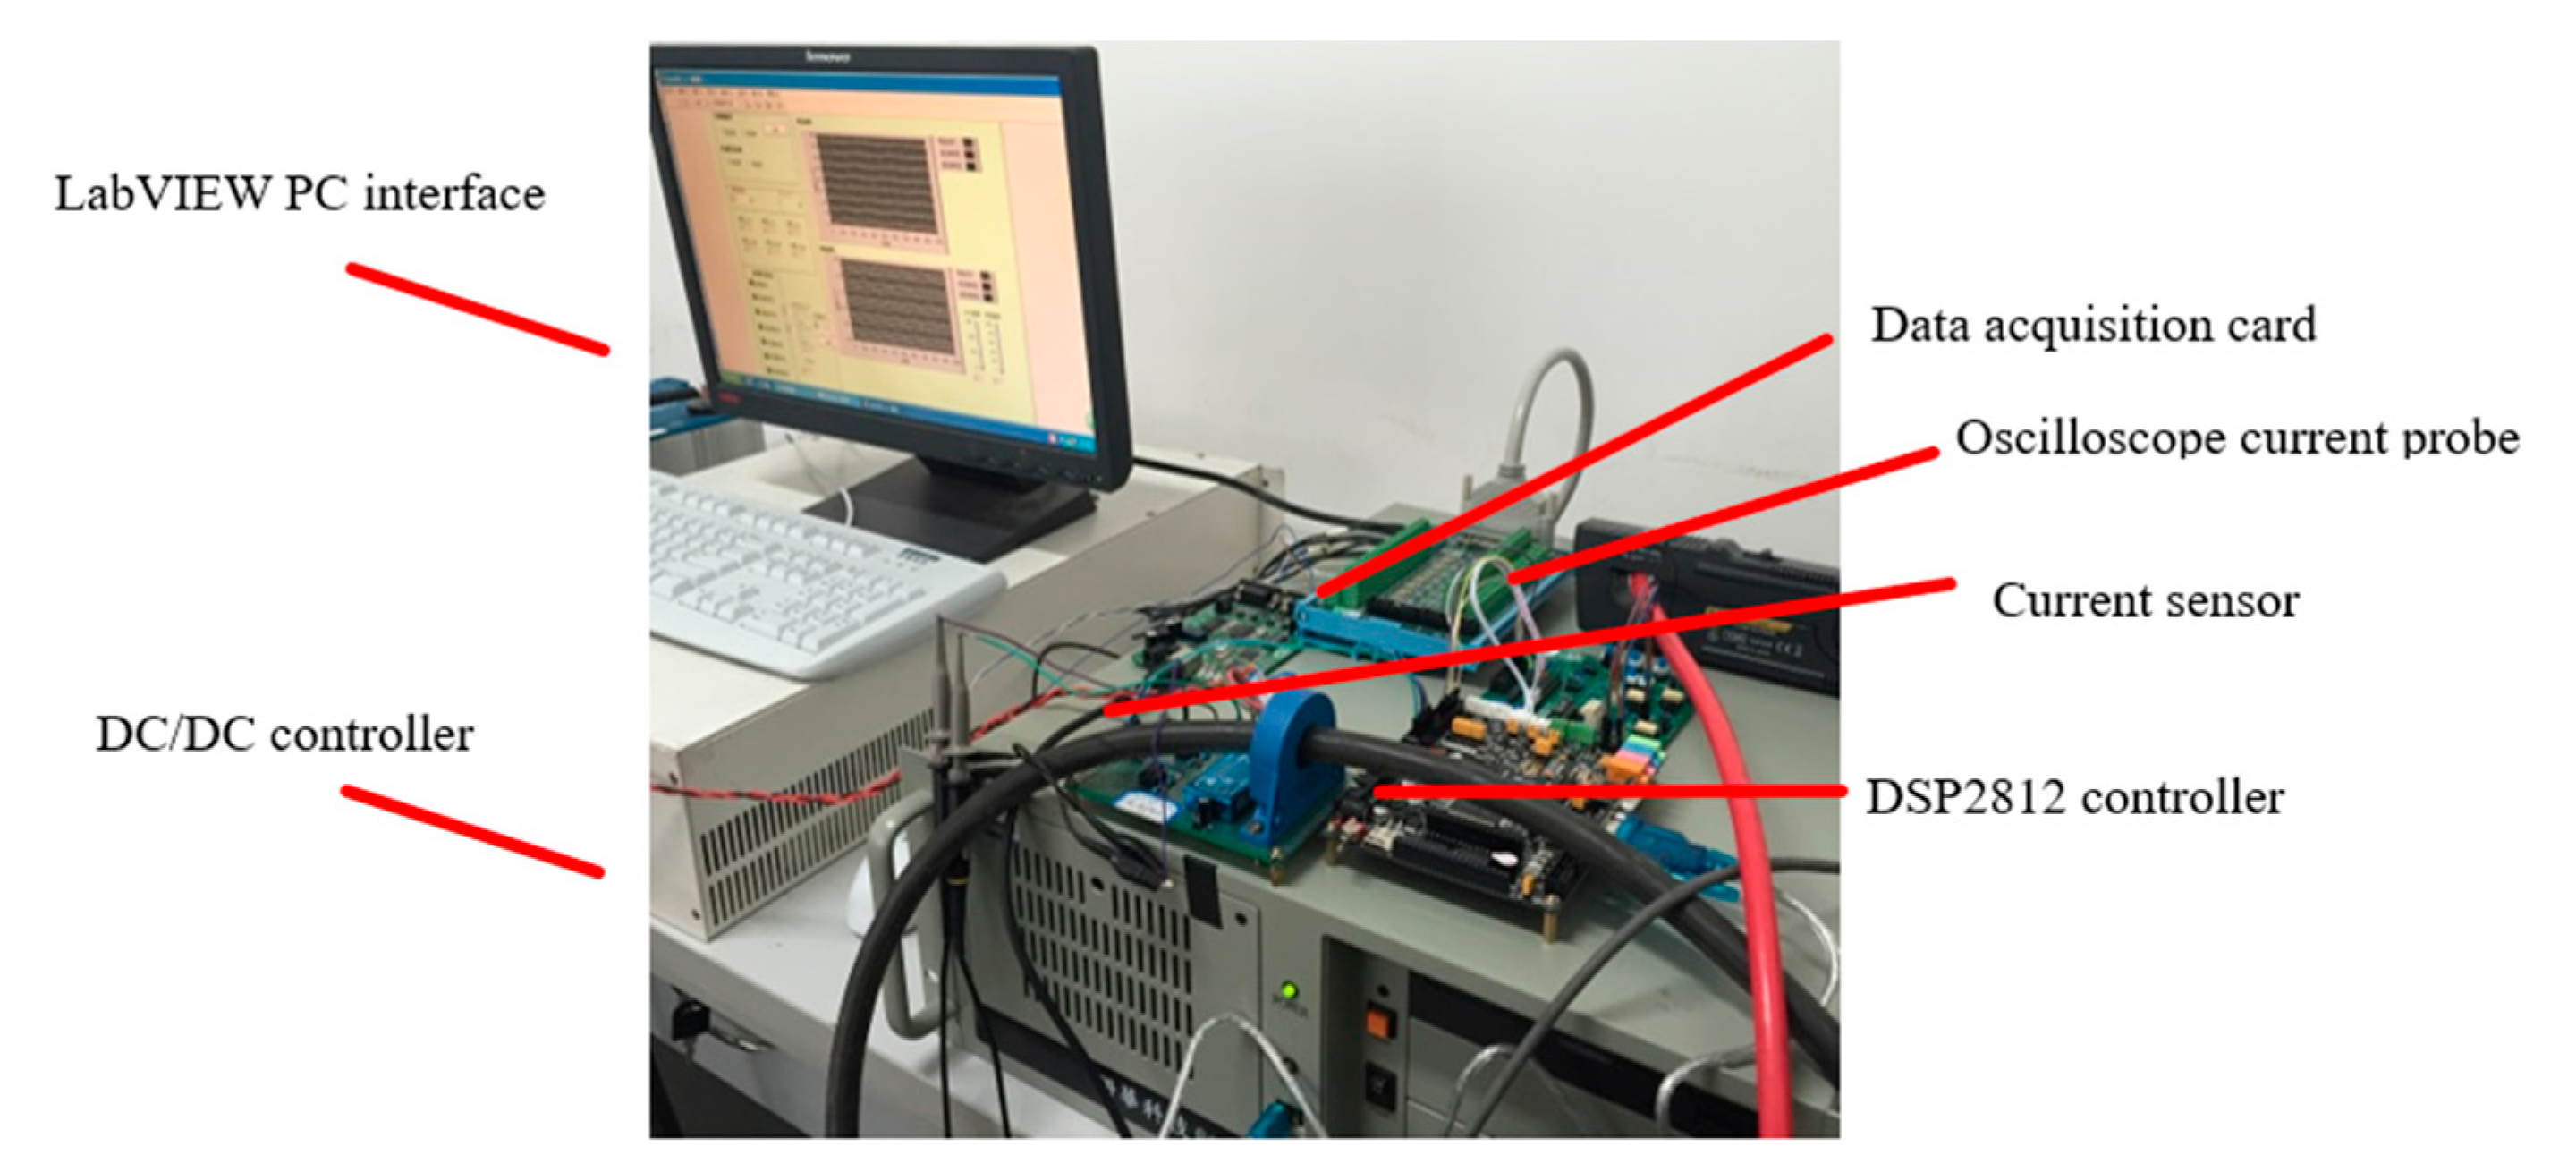
At present, HESS is attracting increasing attention, and certain success has been achieved in reducing the power consumption and prolonging the service life of batteries. In this paper, we propose a fuzzy control strategy for HESS. A pure electric city bus produced by CENS Energy Tech Co., Ltd. with an HESS was tested, and the drive and energy storage systems were modeled. To optimize vehicle performance, a semi-physical experimental system was designed, and a LabVIEW centralized monitoring control and management system was connected by controller area network communication.
2. Establishment of the Vehicle Model
The basic parameters of the target model for Cens Bus are shown in
Table 1. According to the experimental conditions, the lithium battery is a Sainz CBP2450lithium–iron phosphate battery, with a nominal voltage of 25.6 V, mass specific power of 1000 W/kg, mass specific energy of 215.49 W∙h/kg, nominal capacity of 50 A∙h and weight of 19 kg. The single-supercapacitor module uses the BMOD0165 battery produced by MAXWELL in the United States, with a rated voltage of 48 V, peak voltage of 51 V, nominal capacity of 165 F, maximum peak current of 1900 A and nominal weight of 13.5 kg. The rated voltage of the motor is 300 V, the rated power is 120 kW and the rated speed is 1860 r/min.
2.1. Vehicle Dynamics Mode
The calculation of the dynamic index is the key to the matching of motor parameters, and it is also an essential step in the initial stage of research and development. It establishes the vehicle dynamics model and obtains the power provided by each energy storage during the control strategy. When an electric vehicle is running, the power battery provides the energy required to overcome various resistances; the electrical energy is converted into the driving force to drive the wheels through the mechanical shaft; and the rotational force output by the motor to the wheels interacts with the frictional force on the ground to produce the traction force, which makes the bus move forward.
The output power of the motor is shown in Formula (1):
In the formula, T is the motor output torque, and the unit is n.m; n is the motor speed, and the unit is r/min; and P is the motor output power, and the unit is kW.
When driving an electric vehicle, the connection between the vehicle and the air produces resistance to the vehicle, and its magnitude is proportional to the square of the speed. The air resistance,
Fw, is shown in Formula (2):
In the formula, ρ is the air density, and the unit is kg/m3. Cd is the coefficient of air resistance. A is the windward area of the vehicle, and the unit is m2. is the vehicle’s speed, and the unit is km/h.
The vehicle needs to overcome the effect of additional ramp resistance when it climbs a slope. The greater the slope of the ramp, the better the resistance the vehicle will receive. The calculation method of slope resistance
Fi when climbing is shown in Formula (3):
In the formula, m is the total weight of the bus, g is the acceleration due to gravity, and α is the road slope angle.
When the vehicle is traveling on the road, the frictional resistance of the ground against the wheels can make the vehicle move forward. The friction resistance is related to the rolling friction coefficient between the vehicle and the ground. The formula of rolling friction resistance,
Ff, is shown in (4):
In the formula, C is the coefficient of rolling friction, α is the road slope angle, and f is the rolling resistance coefficient.
When a bus is accelerating, it needs to overcome the inertial force generated by its gravity, and its value is related to the rate of speed change.
The acceleration inertia force
Fj is calculated as shown in Formula (5), where
δ is the conversion factor of rotating mass.
The driving force is
Ft, and the equation of motion can obtain from Newton’s second law:
Therefore, the energy Δ
E required for the vehicle to travel at speed
0 to speed
1 can be obtained from the following:
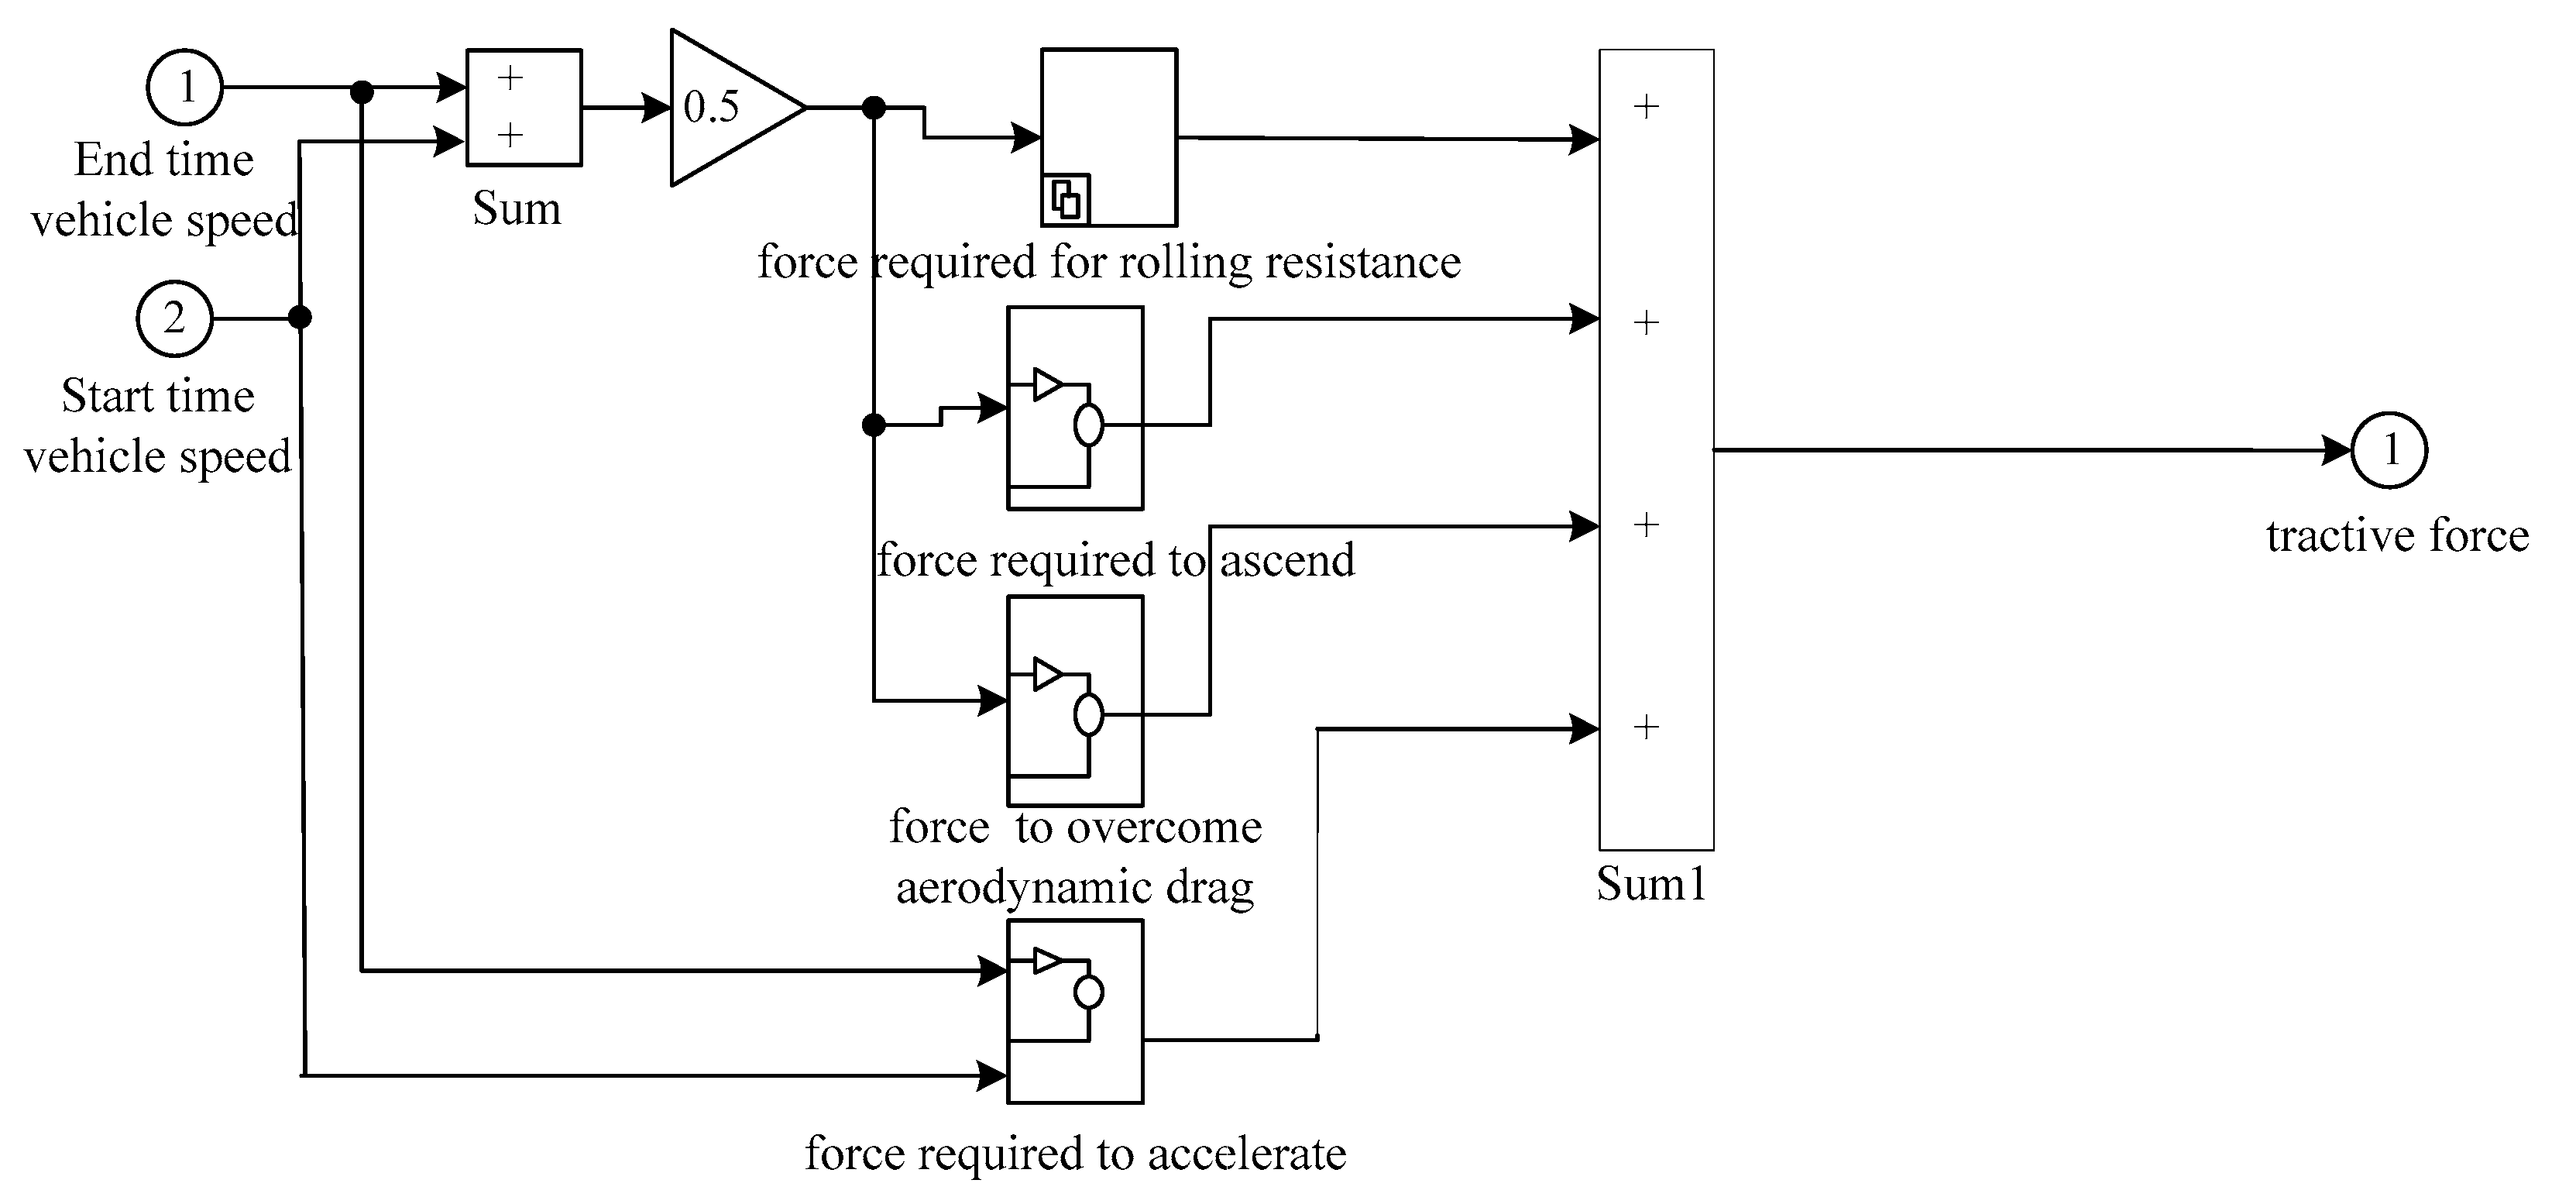
The theoretical calculation model of vehicle driving resistance is shown in
Figure 1. Considering the calculation method of speed in CRUISE, the average value of adjacent sampling points is selected when calculating the speed inside the model. It supposes that the speeds of adjacent sampling points are
end and
sta, and the average speed is
ave. The speed conversion model is shown in
Figure 2.
Therefore, the resultant force has the following formula:
In the velocity calculation model:
For the speed conversion model created under braking, the idea is the same, and the current speed should also be required in extreme situations, such as sideslip.
2.2. Power Calculation and Distribution Model for HESS
The topology of HESS chooses a semi-active topological structure in which the super-capacitor is connected in series with bi-directional DC-DC and then connected in parallel with lithium batteries. In the case of parameter matching to meet the requirements of the working conditions, the reverse direction starts from the required power output by each energy storage element; since the energy storage components on electric buses have a relatively large mass and consume more power and energy, the power consumption caused by their mass is introduced into the model construction; combining the modular modeling idea, it calculates the fuel economy, emission, power, gearbox ratio, braking performance, etc., of the vehicle according to the structural layout of the experimental prototype.
Table 2 shows the connection between the models in CRUISE.
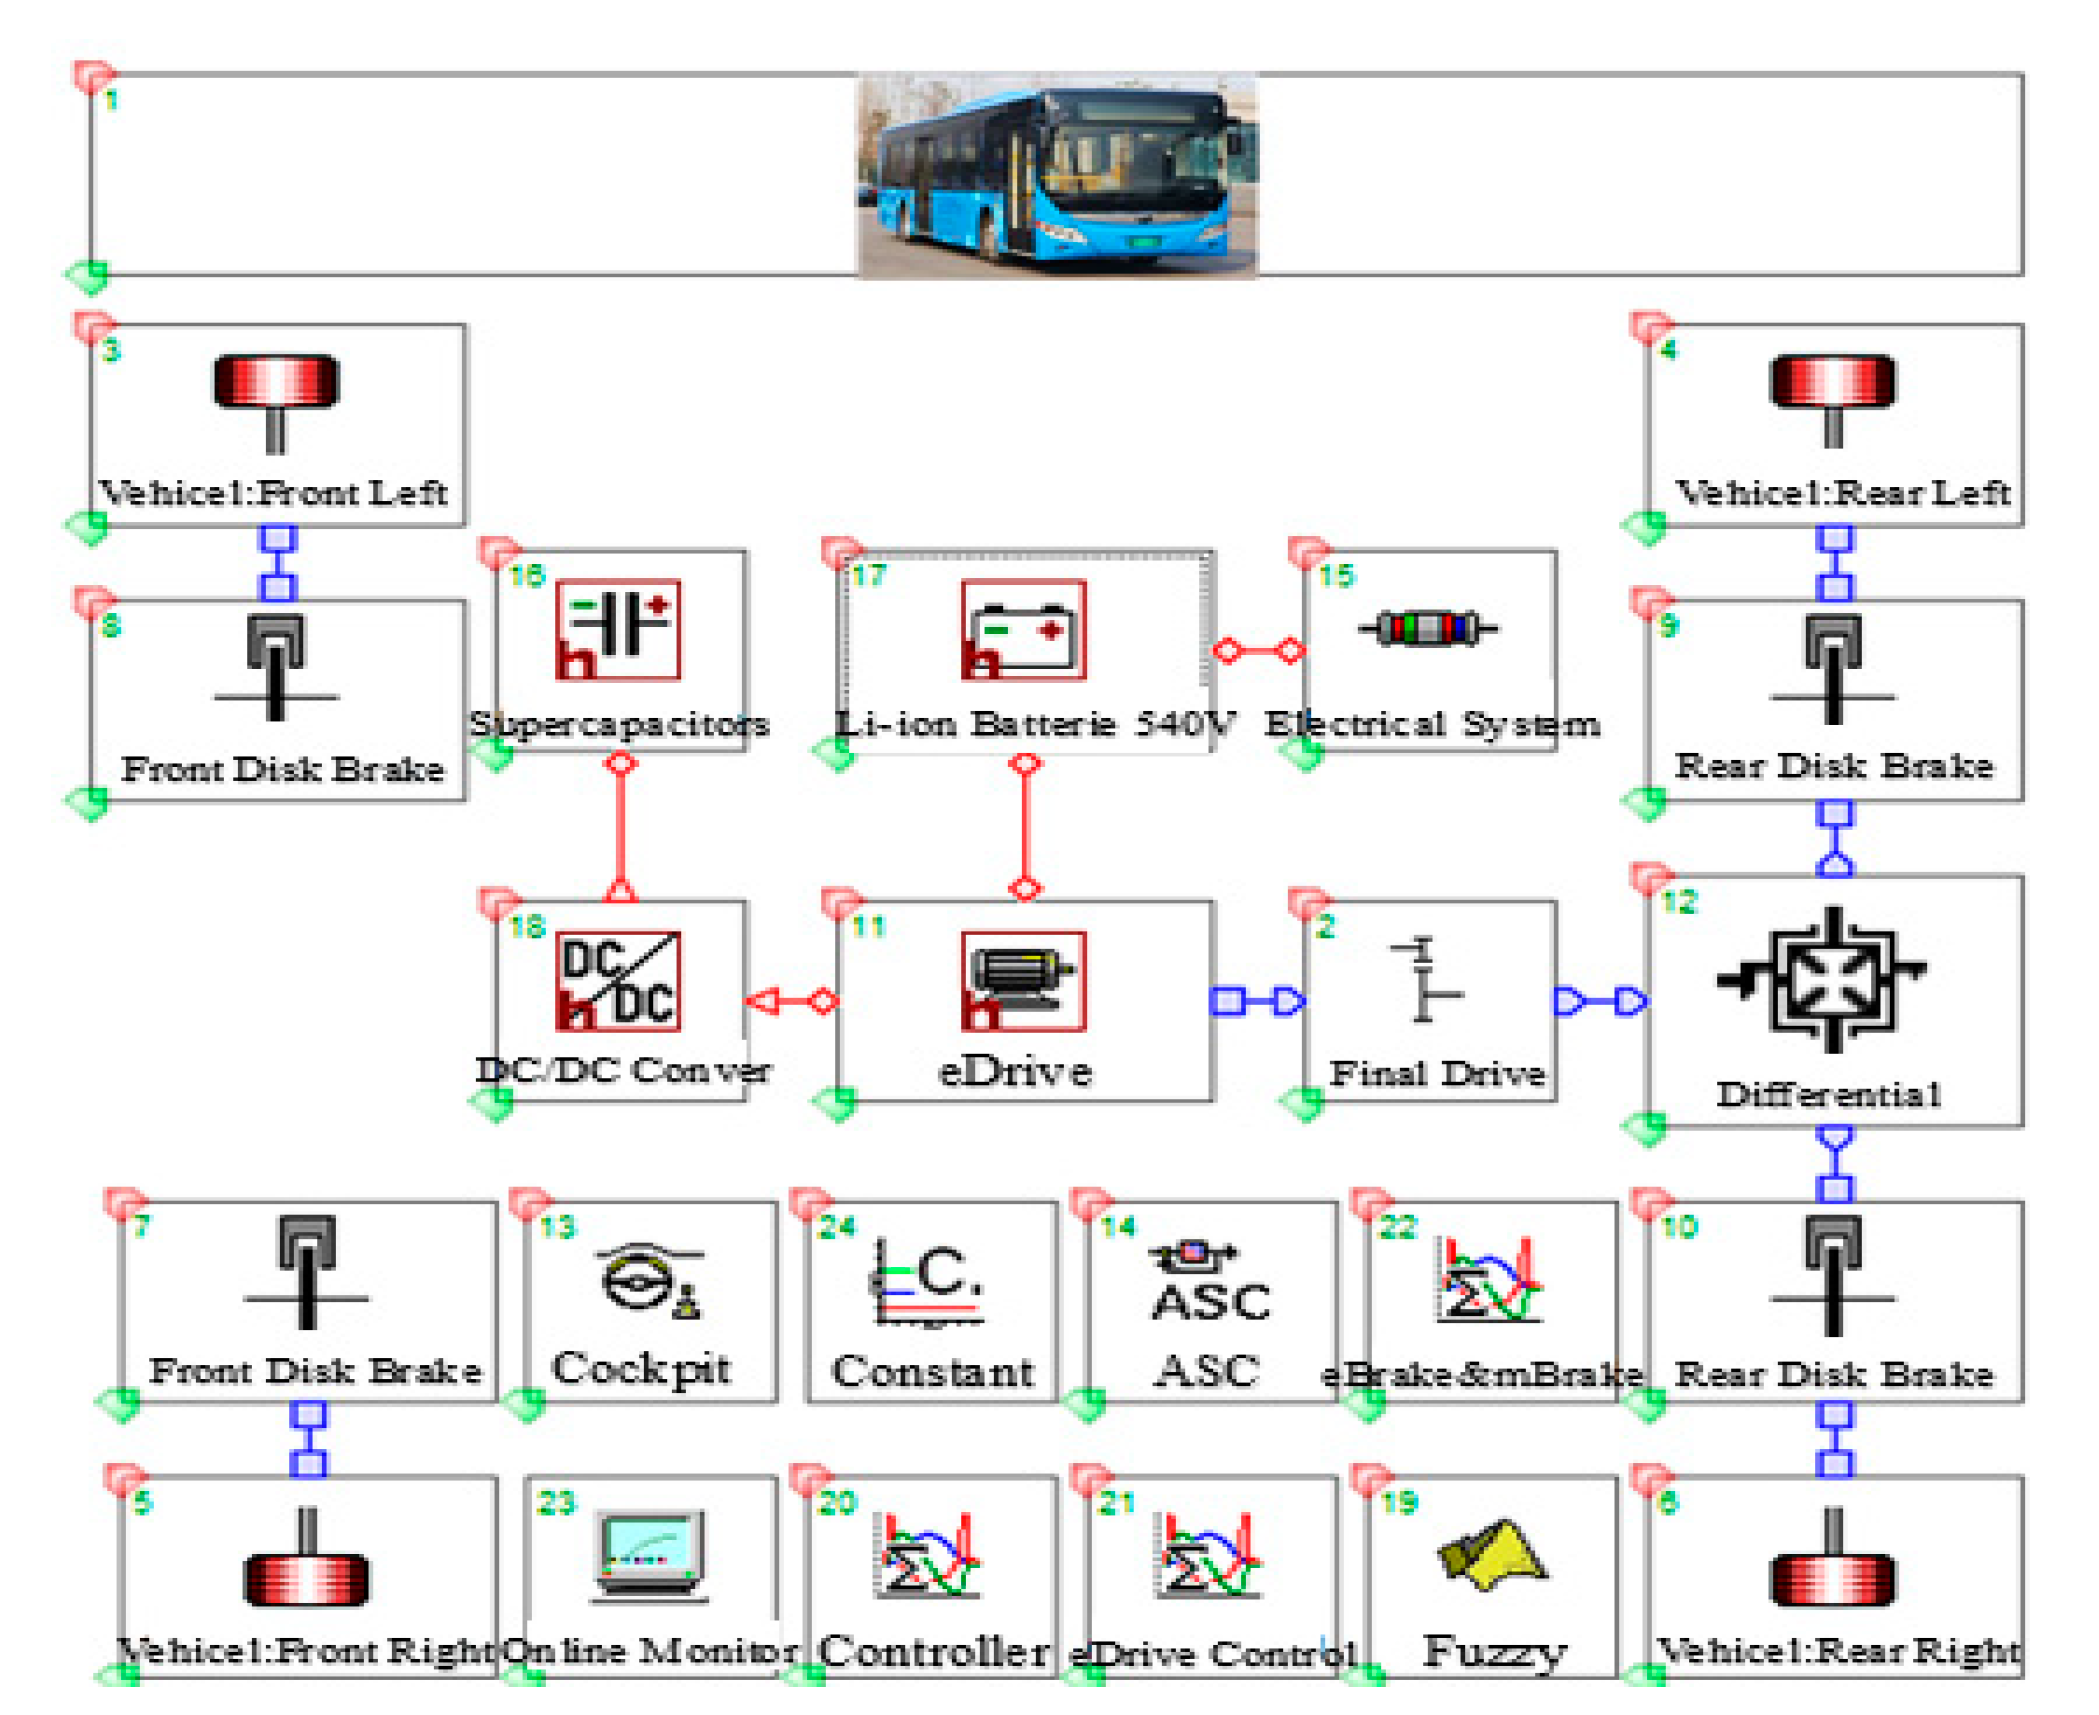
According to the link mode of the mechanical, electrical and data bus between the various components of the pure electric city bus, the joint simulation model of the pure electric city bus of the compound energy storage system can be established. This thesis takes the Sainz pure electric bus as the prototype, builds the primary component model in MATLAB, and realizes the co-simulation through a variable link. The HESS model uses MATLAB 2014 a and CRUISE (60-day trial version) to work together. MATLAB DLL is used in the communication between MATLAB and CRUISE, and it needs to create a dynamic link library to generate DLL files after building the model in Simulink, which is faster than the MATLAB API simulation speed.
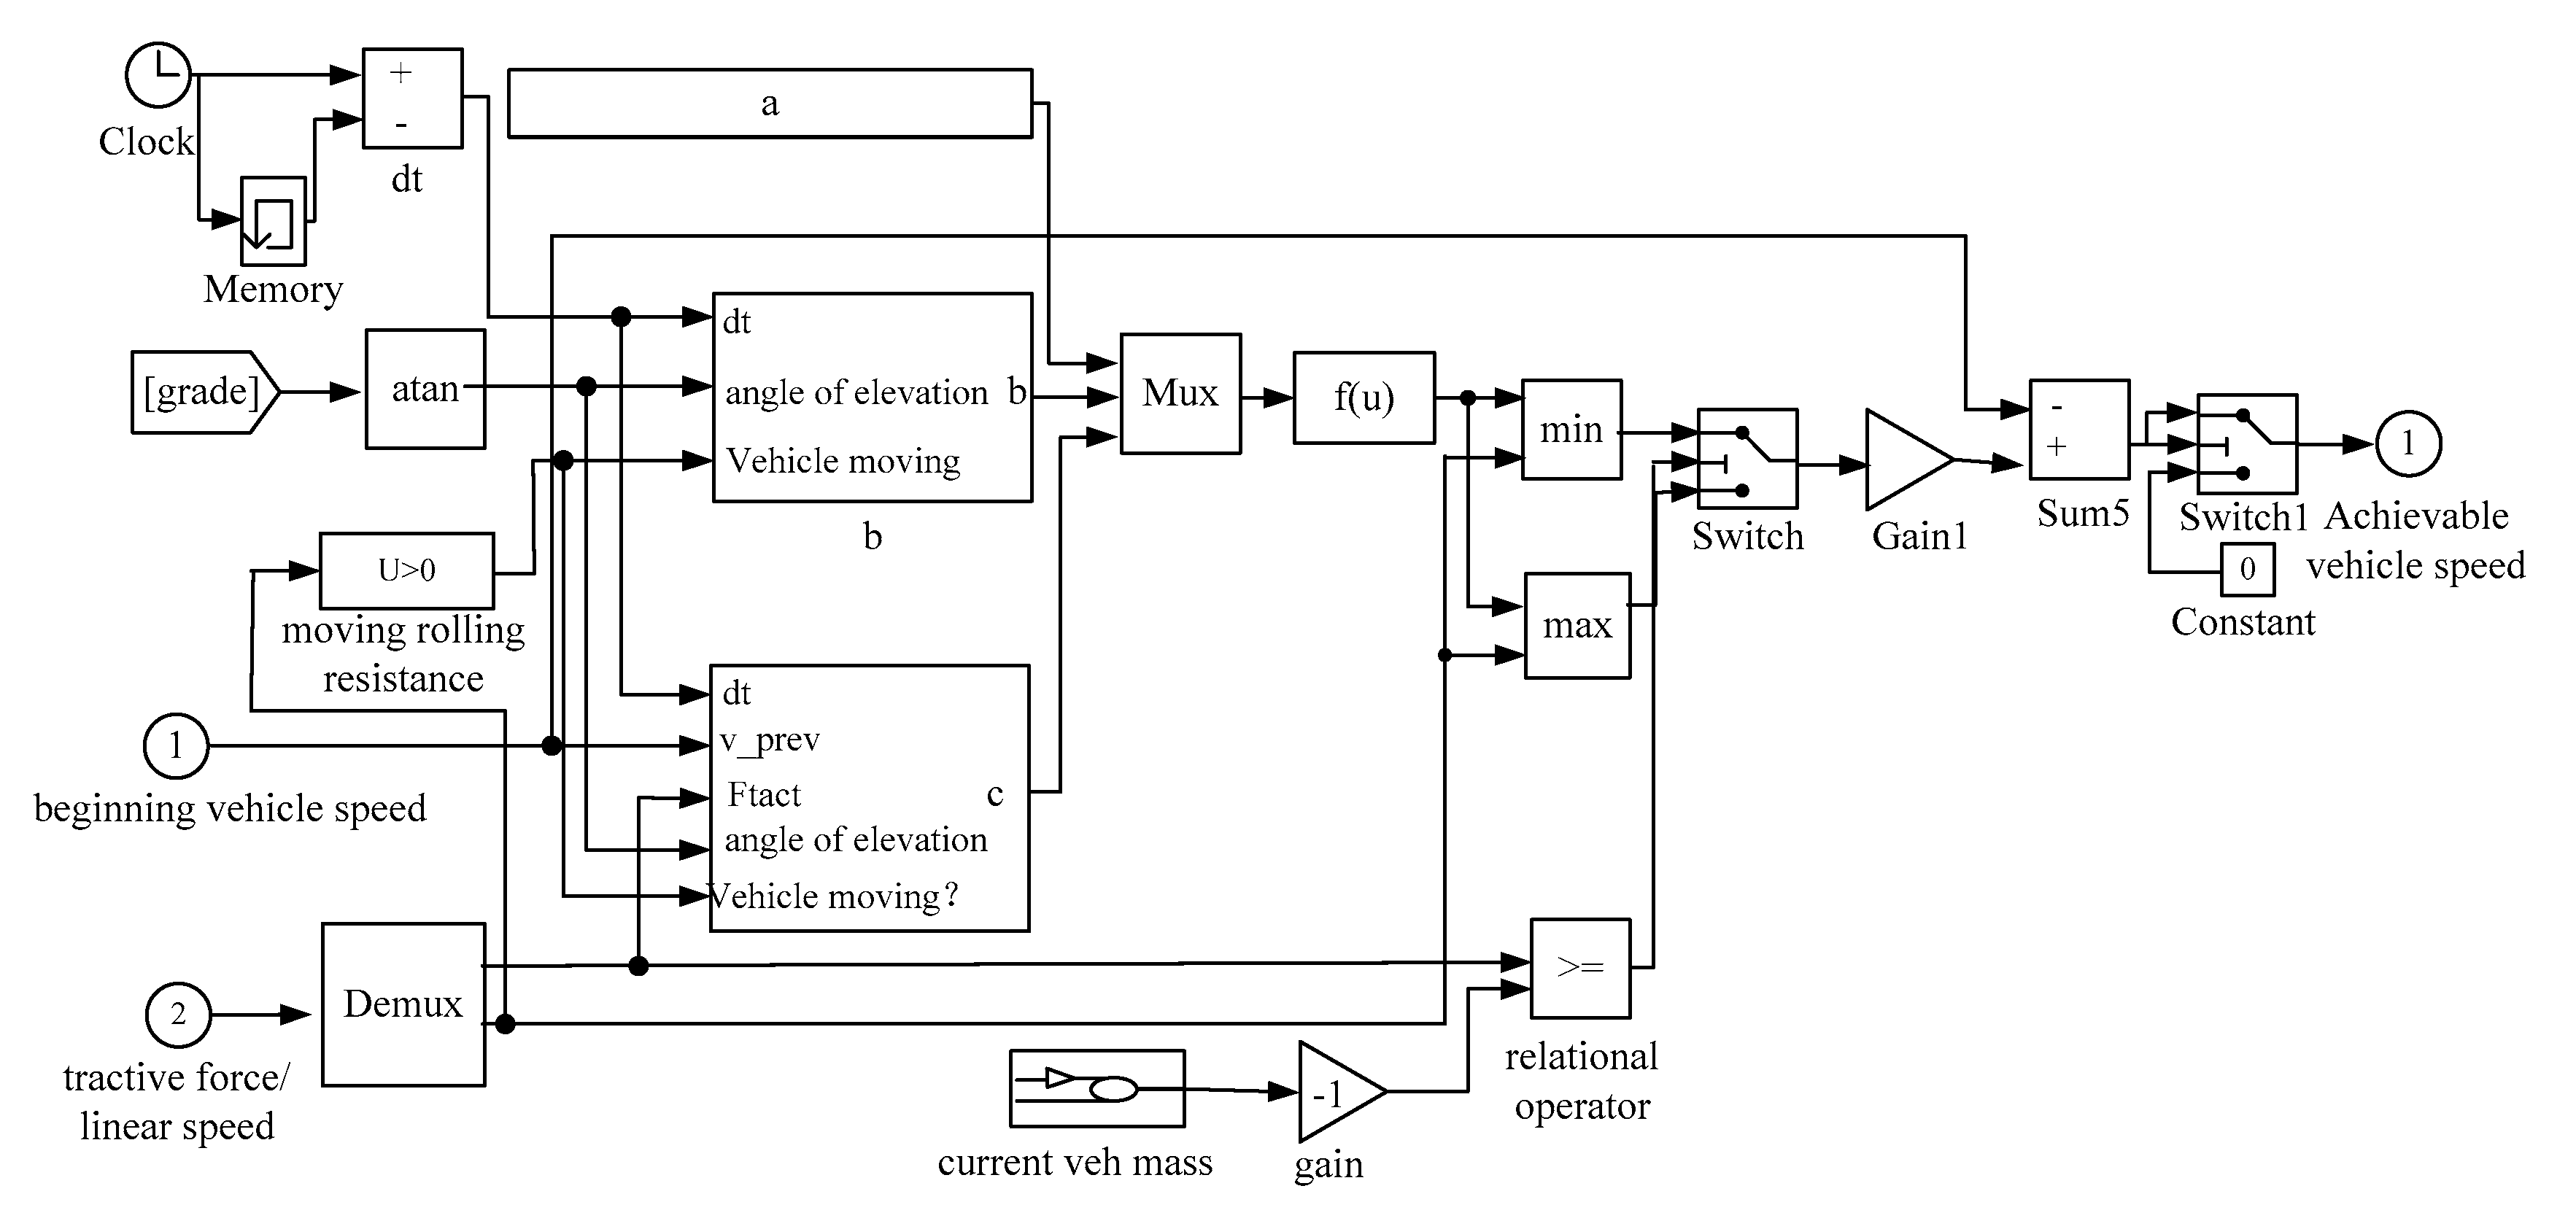
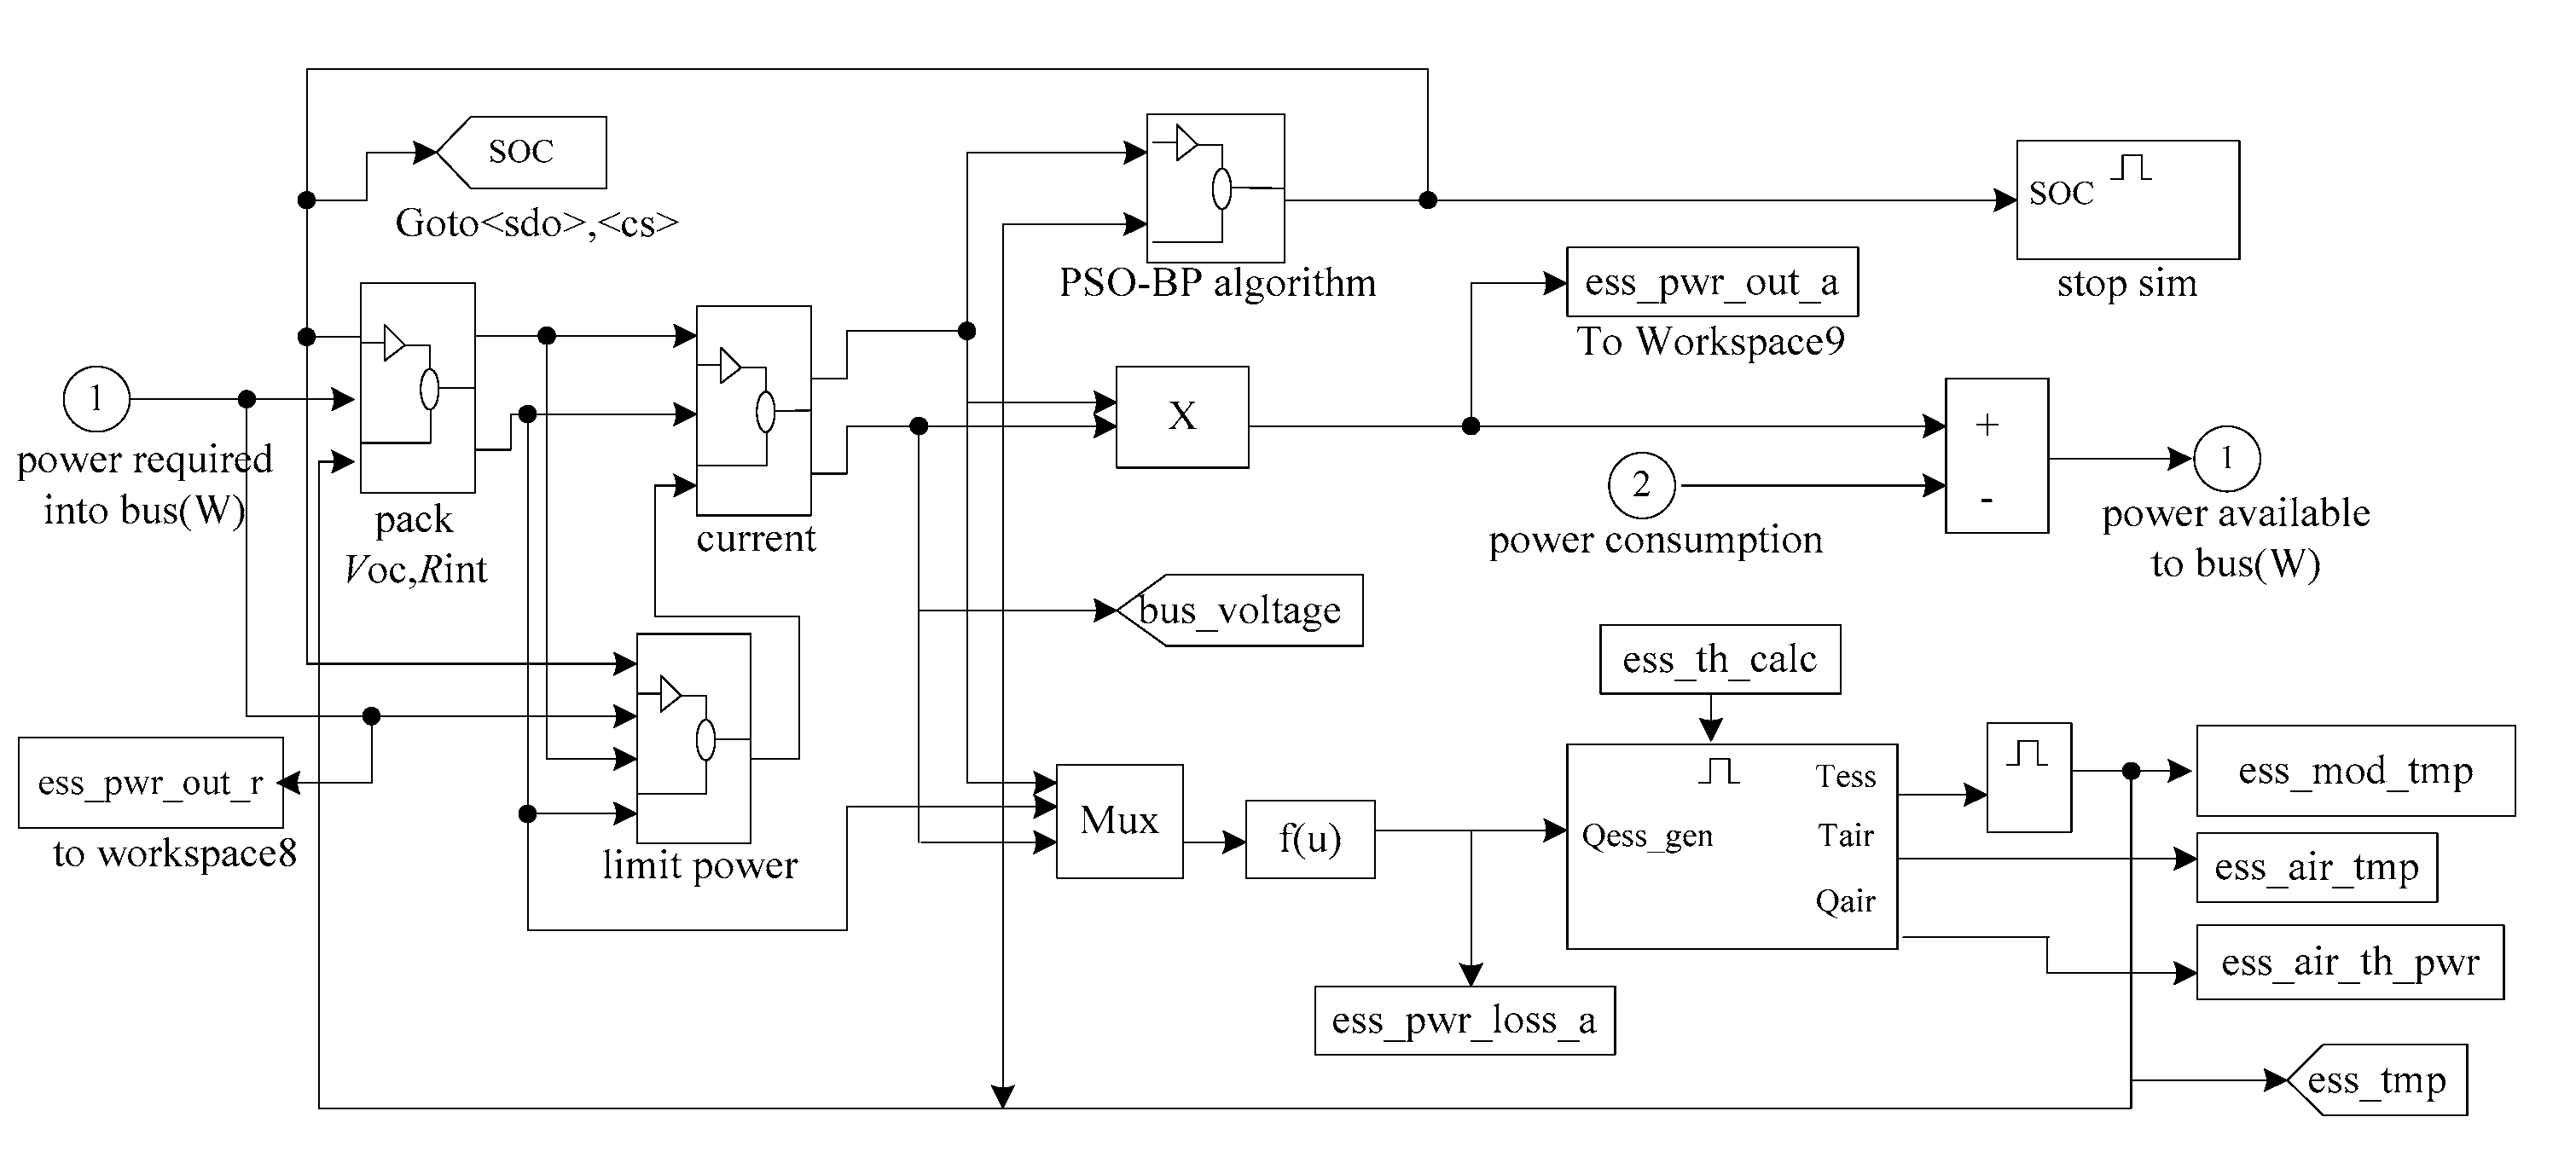
Adding the constructed HESS model to the CRUISE module component library can quickly realize the complex energy simulation of various topologies. The DC/DC converter model in CRUISE can learn the unidirectional flow of current from the high-voltage side to the low-voltage side or from the low-voltage side to the high-voltage side by switching the SWITCH signal. In
Figure 3, the HESS power decoupling distribution process is shown. According to the speed model and the resistance model, the total demand power can be obtained. The outputs of the super-capacitor and the battery are obtained from the control method of Mallat continuation Hal wavelet power decoupling power.
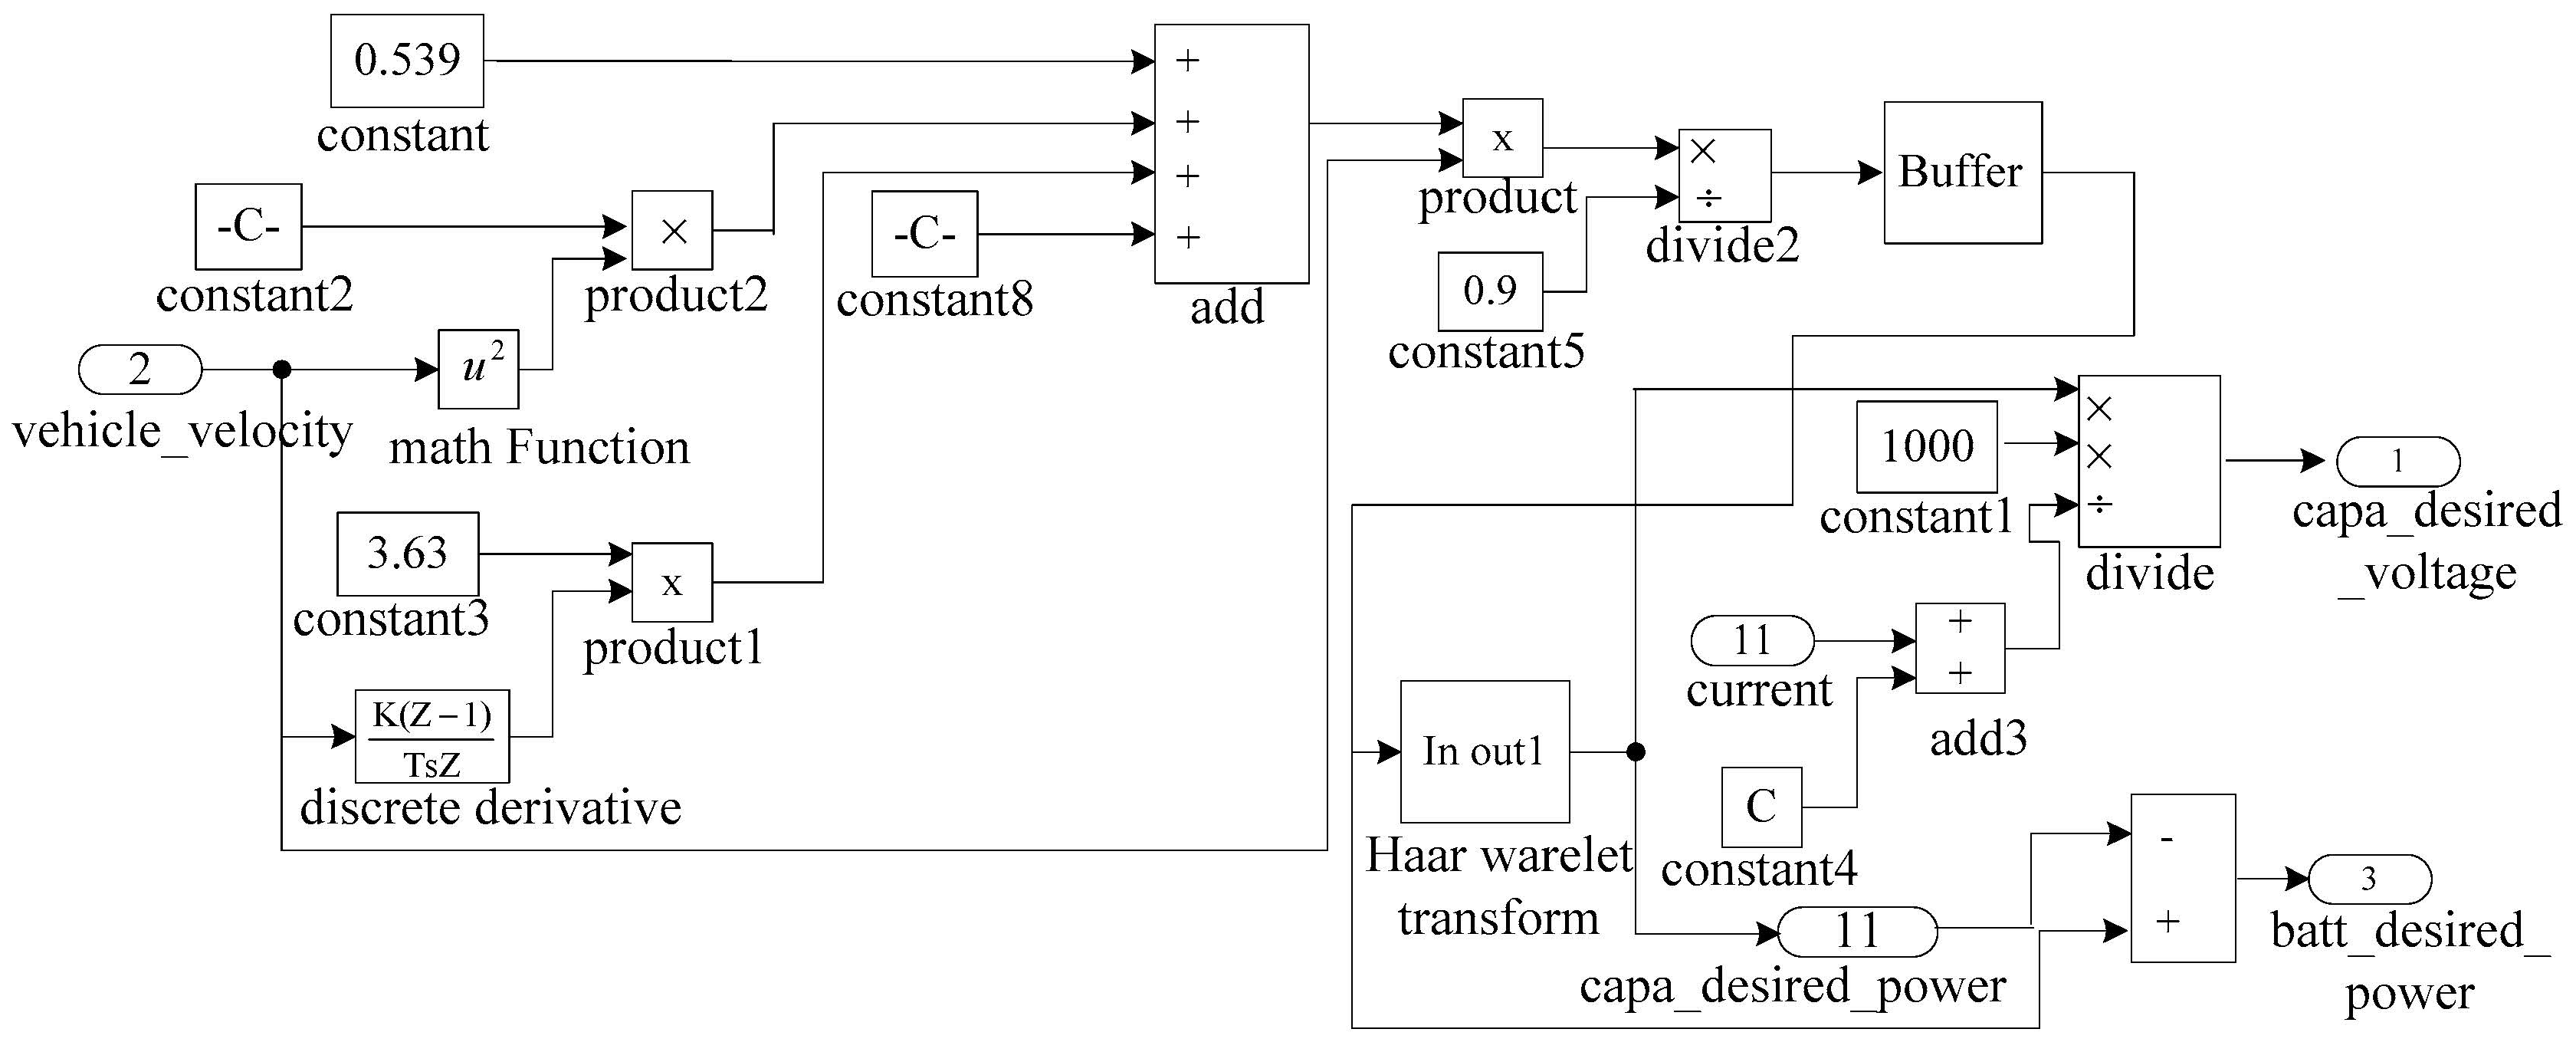
Figure 4 shows the power calculation model of energy storage. In the case of bi-directional DC/DC current control, the terminal voltage value can be obtained, and the dual-energy sources jointly overcome the power consumption caused by rolling friction resistance, climbing resistance and acceleration resistance during the traveling process.
The construction of the vehicle model was carried out under the environment of CRUISE-MATLAB. For the construction of the dynamic model, first, the power demand of the vehicle during driving was calculated. Then, the acceleration, maximum speed and maximum grade of the vehicle were calculated to match the energy storage capacity; that is to say, the dynamic model was created from the reverse perspective, as it takes the required power as the input signal. This study constructed a dual closed-loop human–machine dynamics coupling model of a pure electric bus, in which the vehicle dynamics system is a time-varying system, and the control method is an outer loop control; the vehicle dynamics system issues a command to the electric drive system according to demand, and the drive motor meets the torque and rotating speed requirements of the electric bus and transmits energy with the energy storage system; it belongs to the inner loop control, and the two together form a dual closed-loop control [
21,
22]. In CRUISE, the internal electrical and mechanical parts of the composite energy storage system are, and the vehicle dynamics model was built. This provides a good foundation for subsequent co-simulation and strategy research.
The vehicle model establishment relationship diagram is shown in
Figure 5.
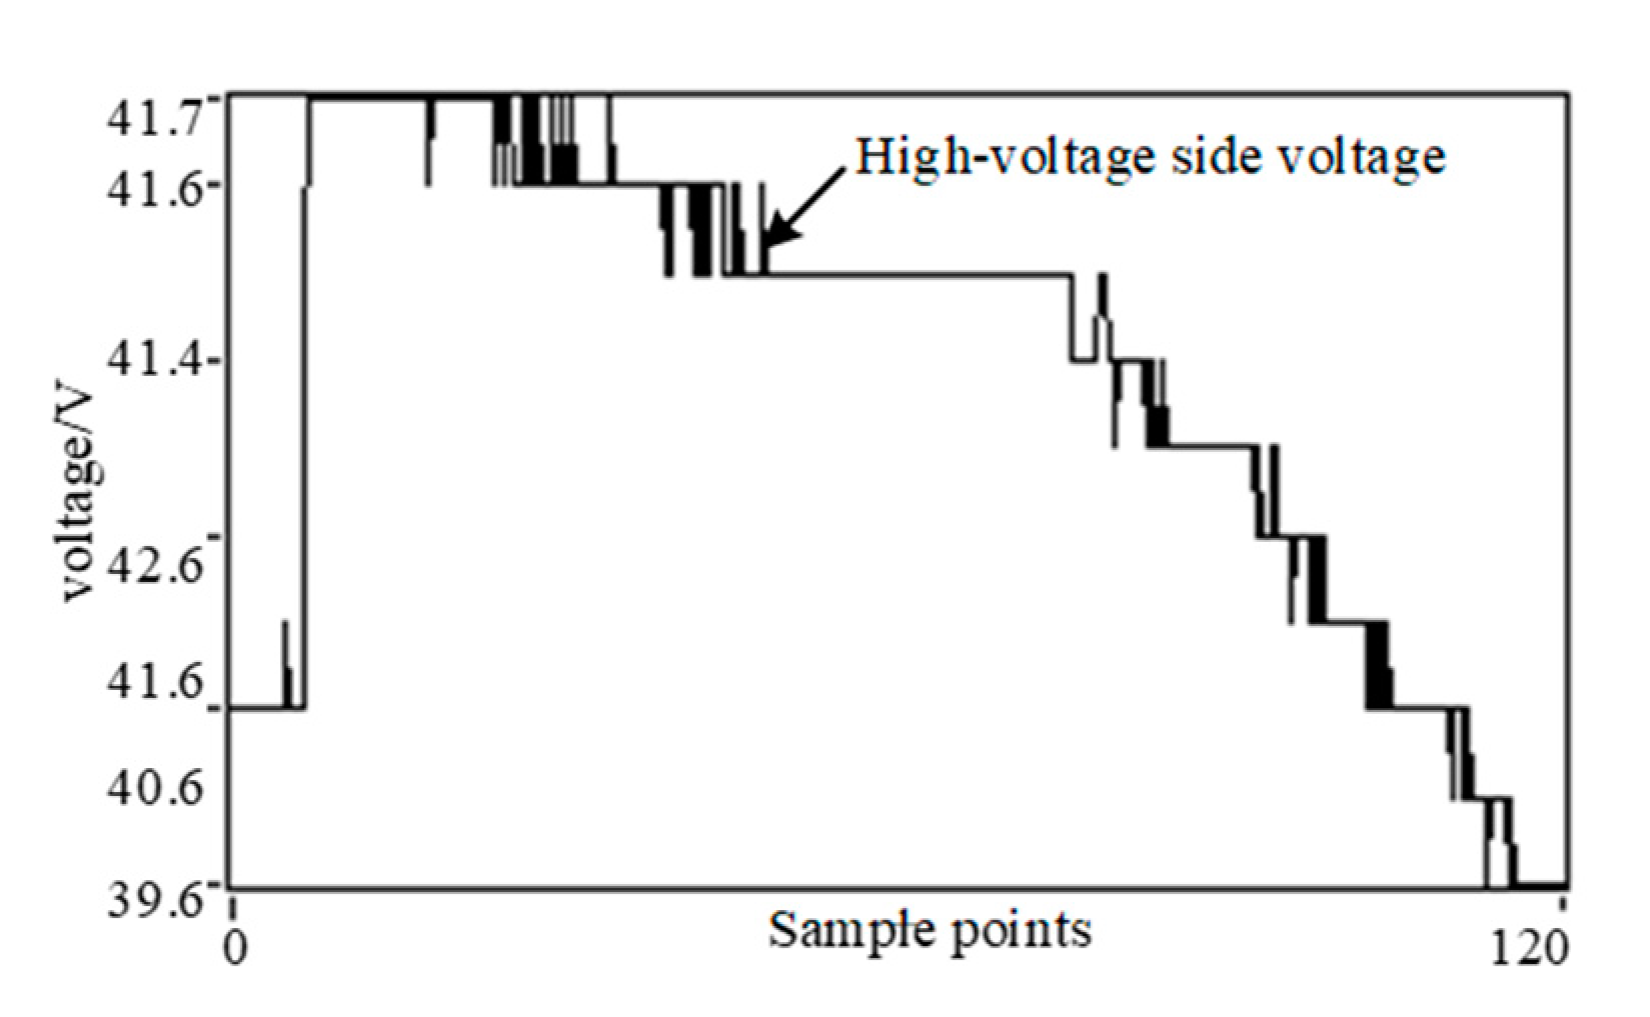
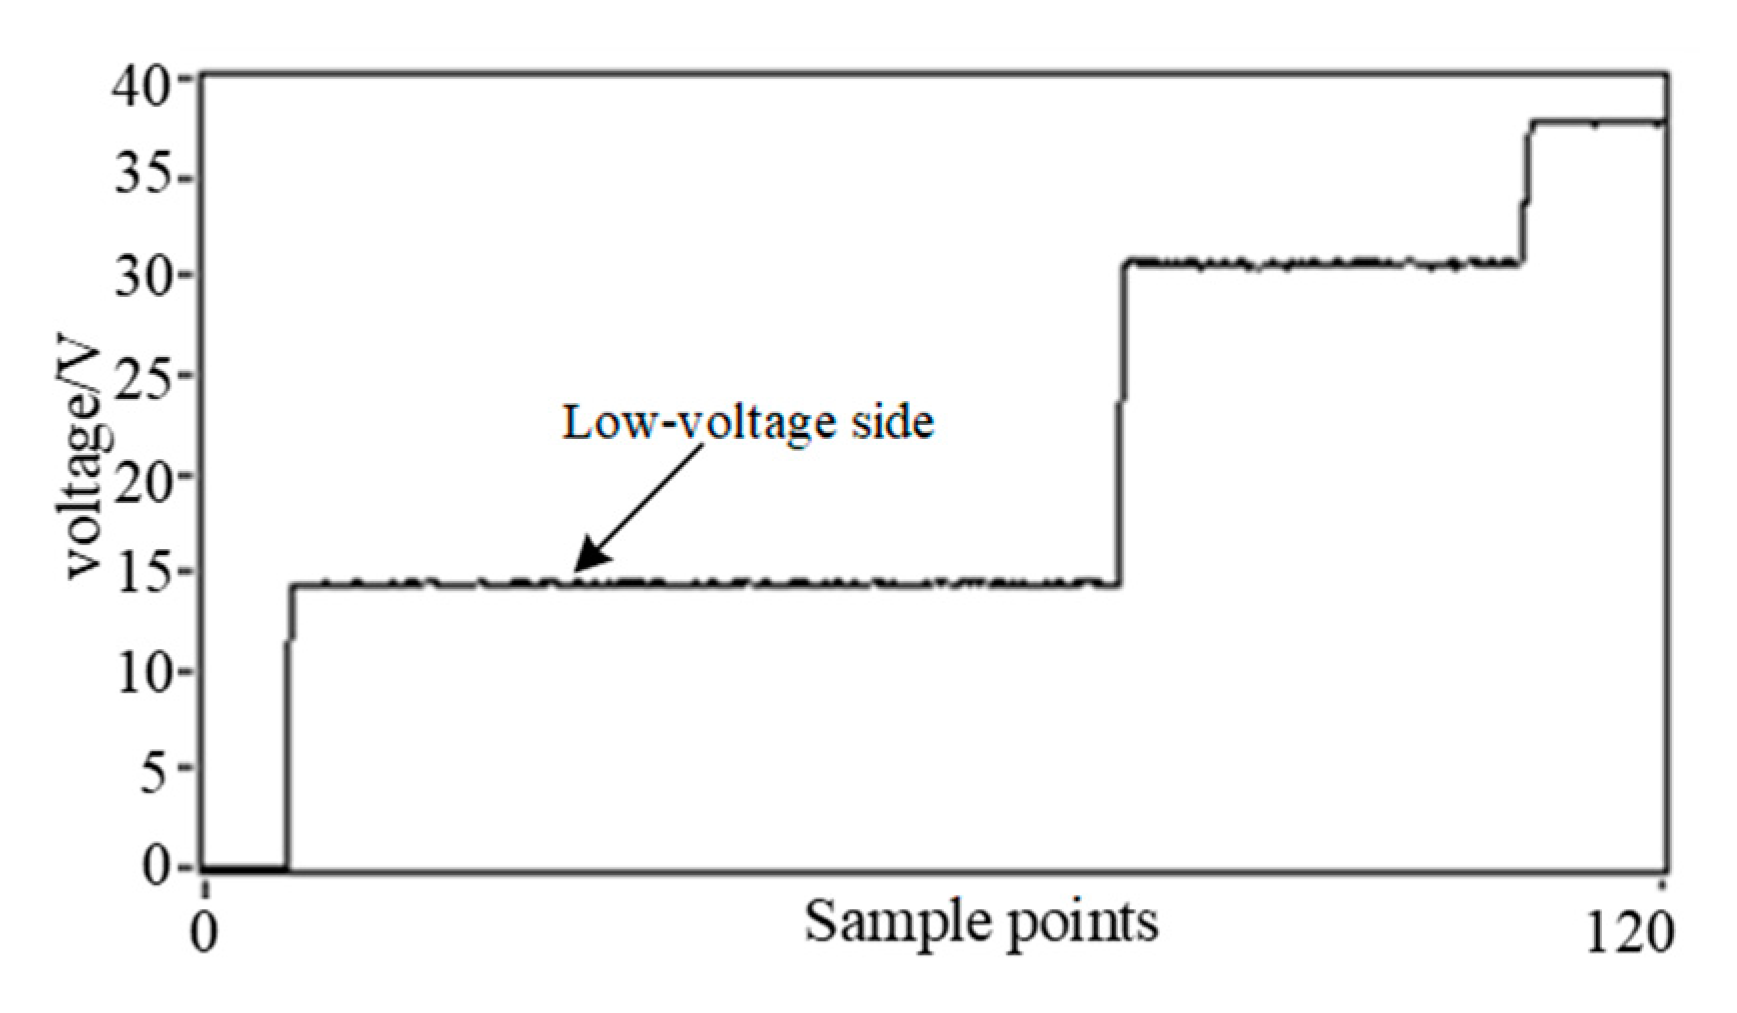
Compared with other models, the electric passenger bus has a larger mass, and the matched energy storage components are connected in series and parallel through the modules. Whilst driving, the whole vehicle needs to overcome the climbing resistance, acceleration resistance and rolling resistance caused by its mass, and the resulting power loss is very large; the self-consumption model was introduced into the construction of the HESS model. The input current signal of the created model was compared with the voltage signal obtained through the simulation and experiment. The results show that the error is within 2%, which also proves the correctness of the simulation model.
3. Design of Fuzzy Controller
To meet the driving demand, the design needs to reasonably allocate the power output ratio of the super-capacitor and the lithium battery, and the power of the super-capacitor and the lithium battery should satisfy the relationship shown in Formula (16).
KSC is the super-capacitor power distribution factor, which represents the ratio of the super-capacitor power,
PSC, to the pure electric bus demand power,
Preq, and its expression is shown in Formula (17).
Therefore, the output of the hybrid energy storage system is mainly related to the required power, Preq; super-capacitor power, PSC; and lithium battery power, Pbat, of pure electric buses, and the power of super-capacitors and lithium batteries is closely related to their state of charge. Therefore, the input of the fuzzy controller is set to the state of charge, SSOC, of the super-capacitor; the state of charge, BSOC, of the lithium battery; and the required power, Preq, of the pure electric bus, and the output of the fuzzy controller is set to the power distribution factor KSC of the super-capacitor. When the pure electric passenger bus is in the state of starting, accelerating, climbing or driving at a constant speed, the fuzzy controller distributes the output of the super-capacitor and the lithium battery; when the pure electric passenger bus is in the deceleration or braking state, the super-capacitor is the primary energy storage device for energy recovery, and the recovery method is the same as that of the logic threshold control strategy. When a pure electric bus is running normally, if the super-capacitor terminal voltage is lower than its standard working voltage, the lithium battery can adequately charge the super-capacitor when its output power is low.
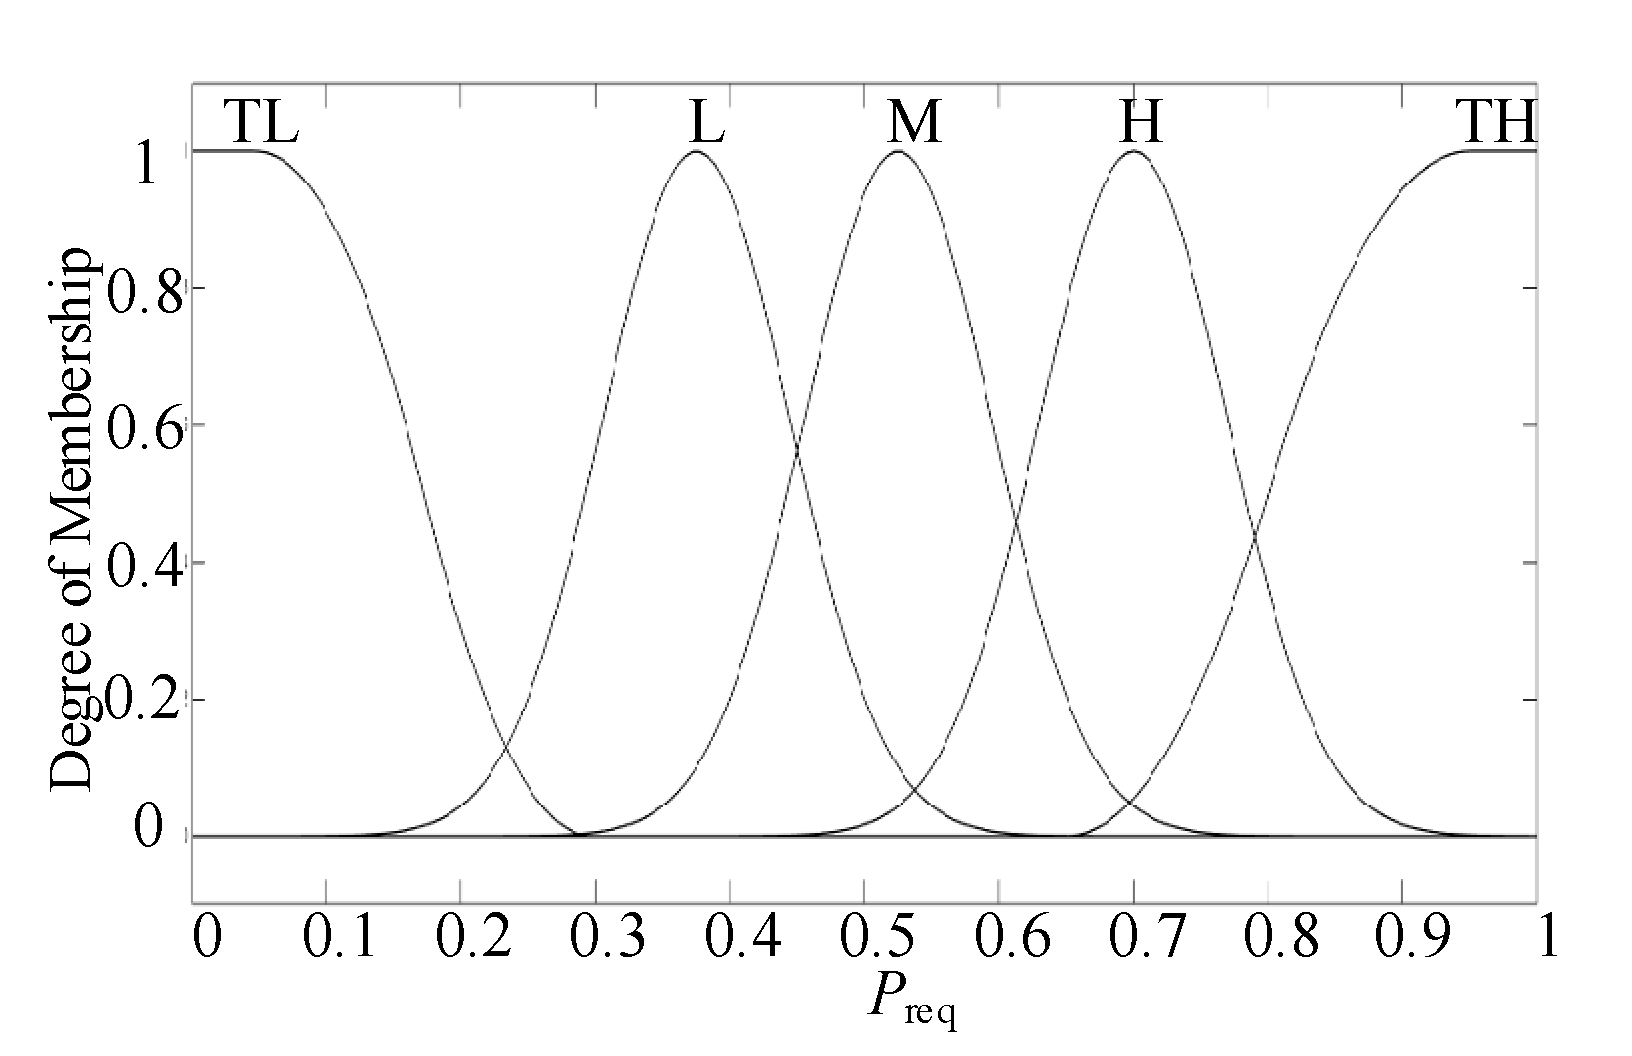
When the motor is in the driving state, the demand power,
Preq, of the pure electric passenger bus is greater than zero. The domain of the membership function of the pure electric bus demand power,
Preq, in the interval was set [01], and the interval was divided into five subsets:
Preq = {TL, L, M, H, TH}; the membership function of the demand power of a pure electric bus is shown in
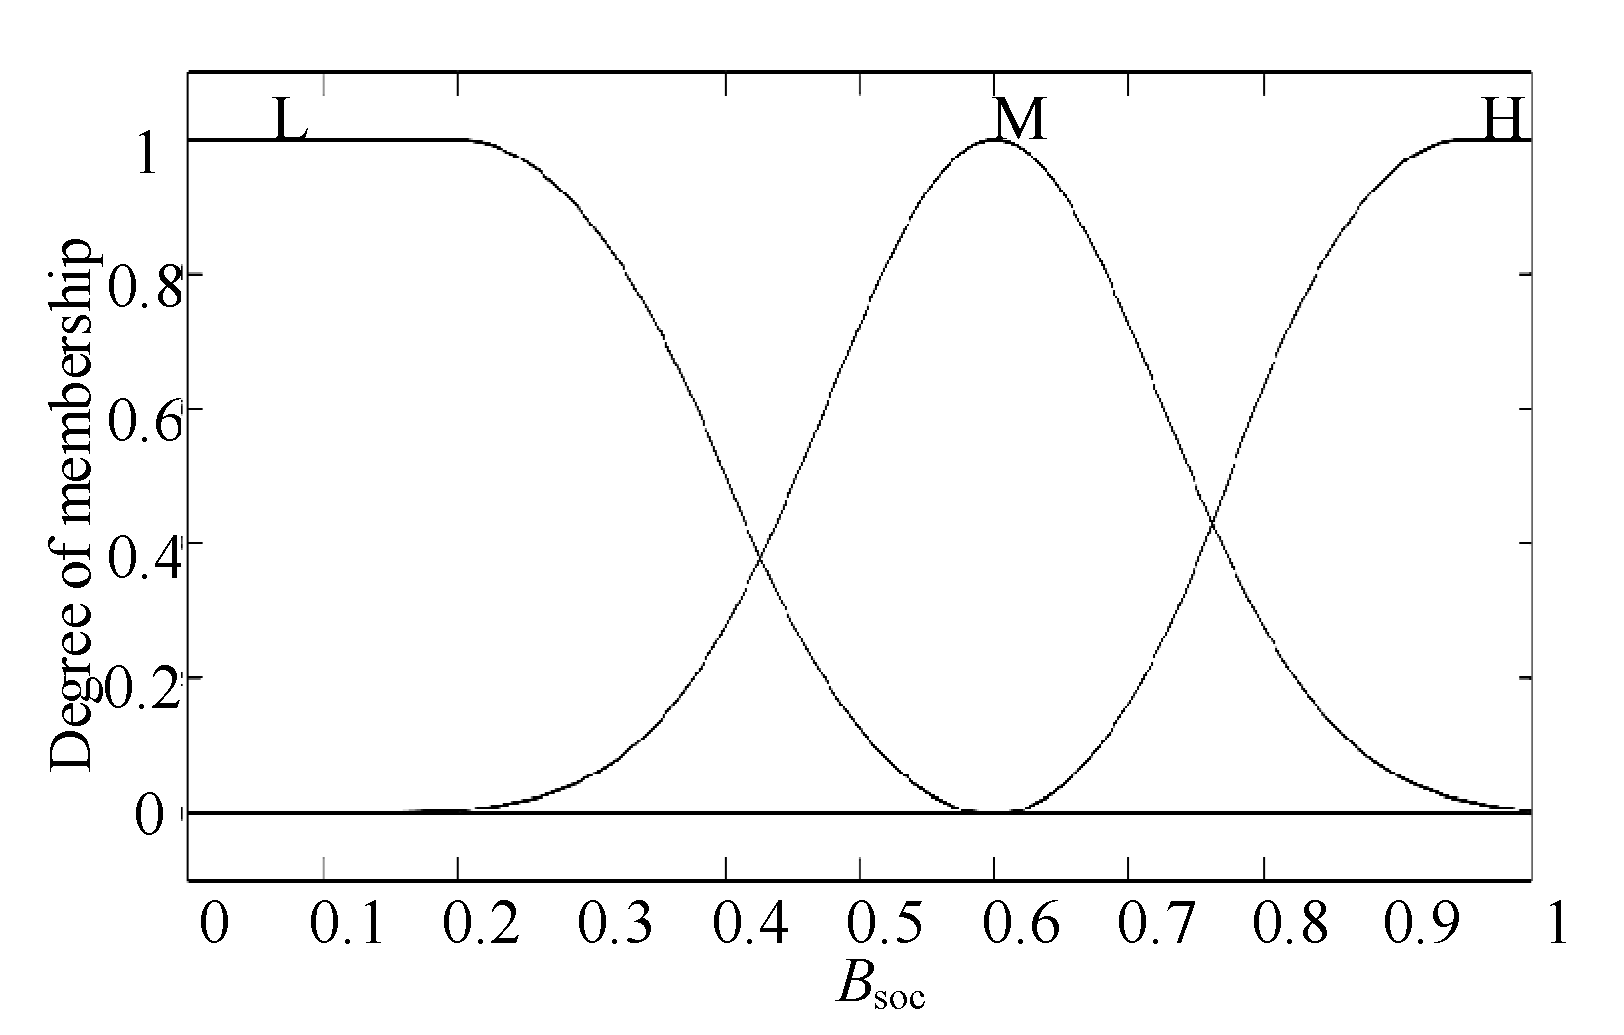
Figure 6. The membership function domain of the lithium battery power,
Pbat, in the interval was set [01], and the interval was divided into three subsets:
BSOC = {L, M, H}; the membership function of lithium battery power is shown in
Figure 7.
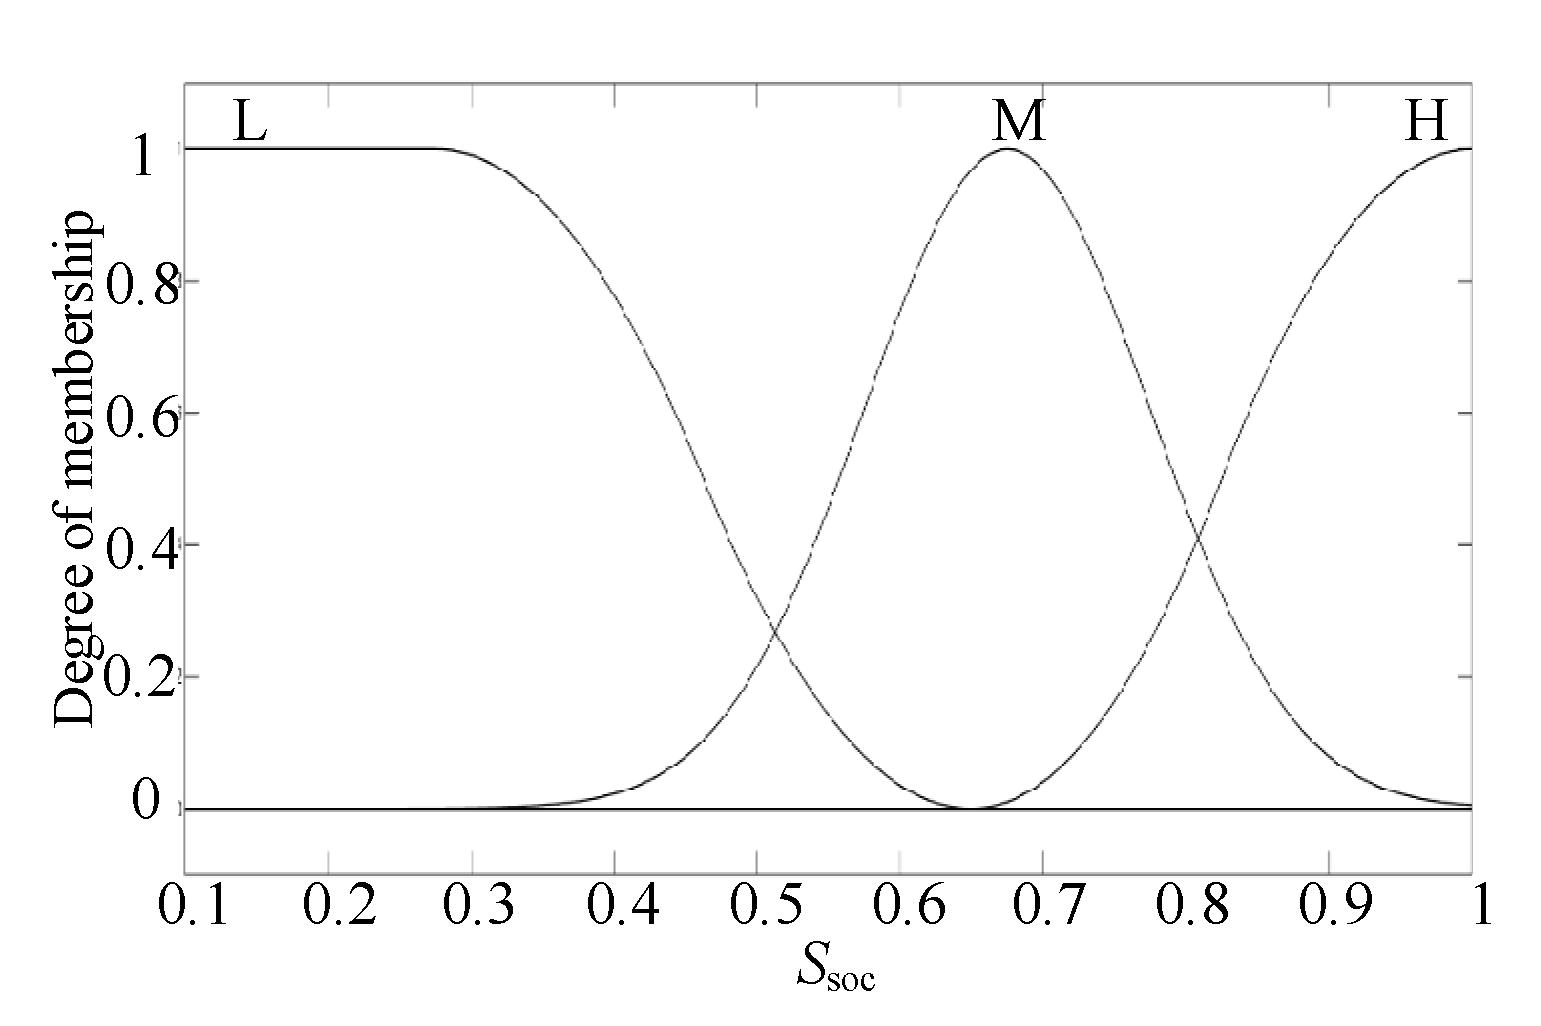
The membership function domain of the super-capacitor’s state of charge,
SSOC, in the interval was set (0.1,1), and the interval was divided into three subsets:
SSOC = {L, M, H}; the membership function of the
SSOC of the super-capacitor state of charge is shown in
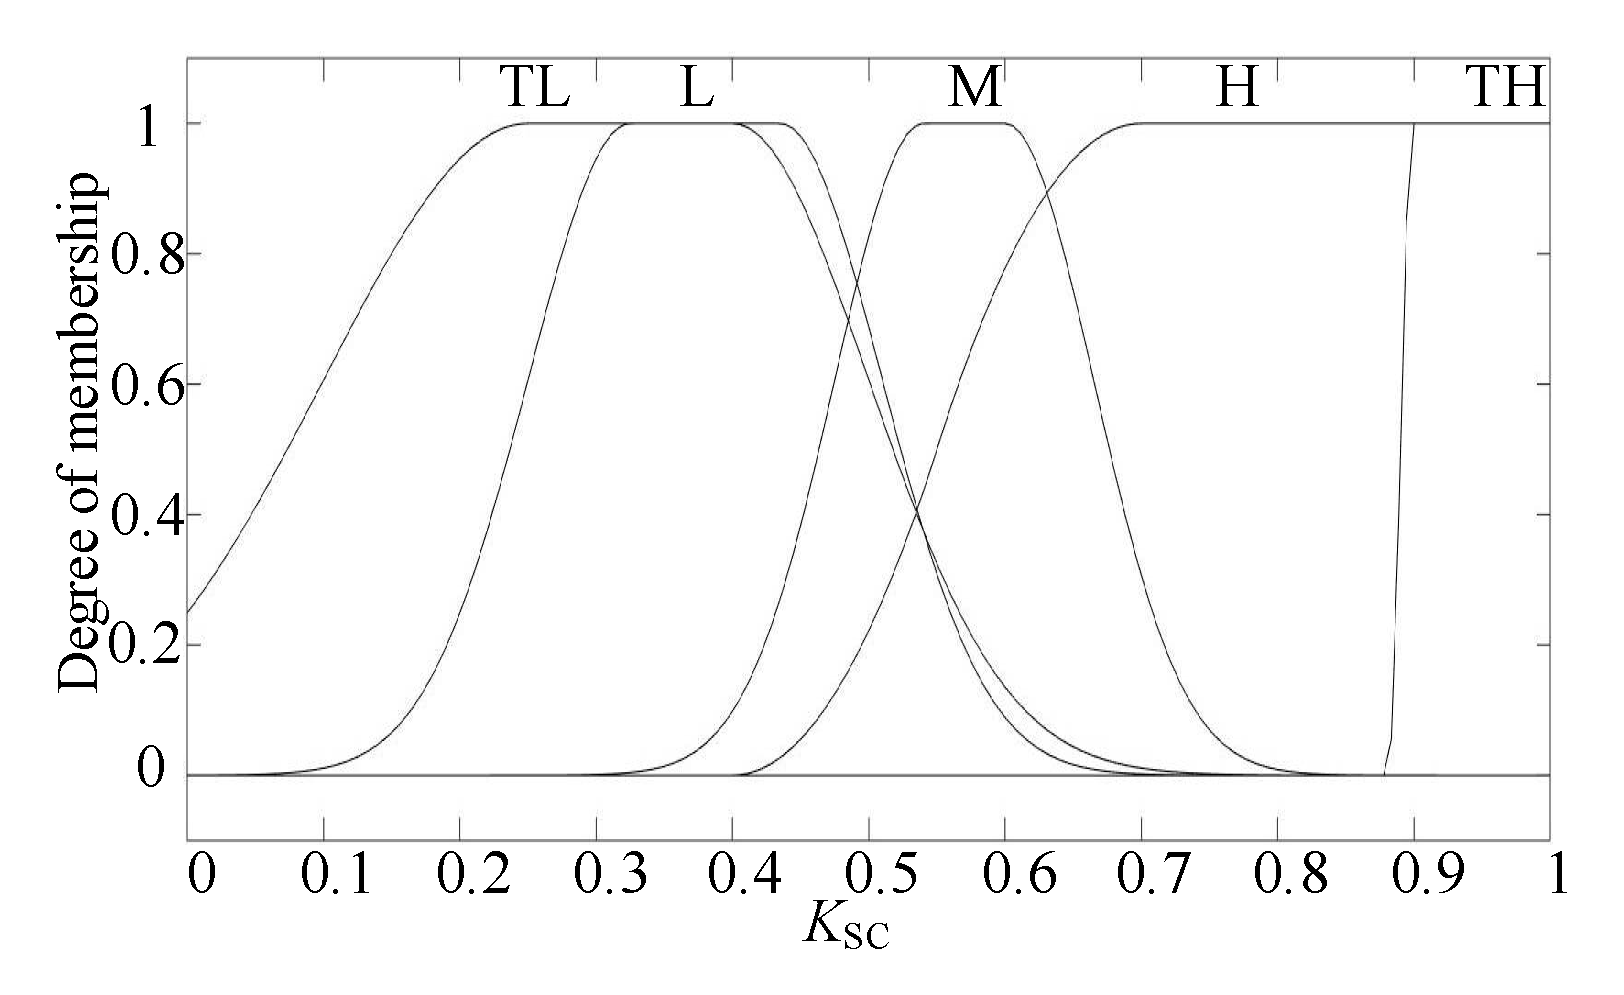
Figure 8. The membership function domain of the supercapacitor’s power distribution factor,
KSC, in the interval was set (0.1,1), and the interval was divided into five subsets:
KSC = {TL, L, M, H, TH}; the membership function of the super-capacitor power distribution factor is shown in
Figure 9.
Based on the four membership functions formulated above, forty-five fuzzy control rules were designed; the specific rules are shown in
Table 3,
Table 4 and
Table 5.
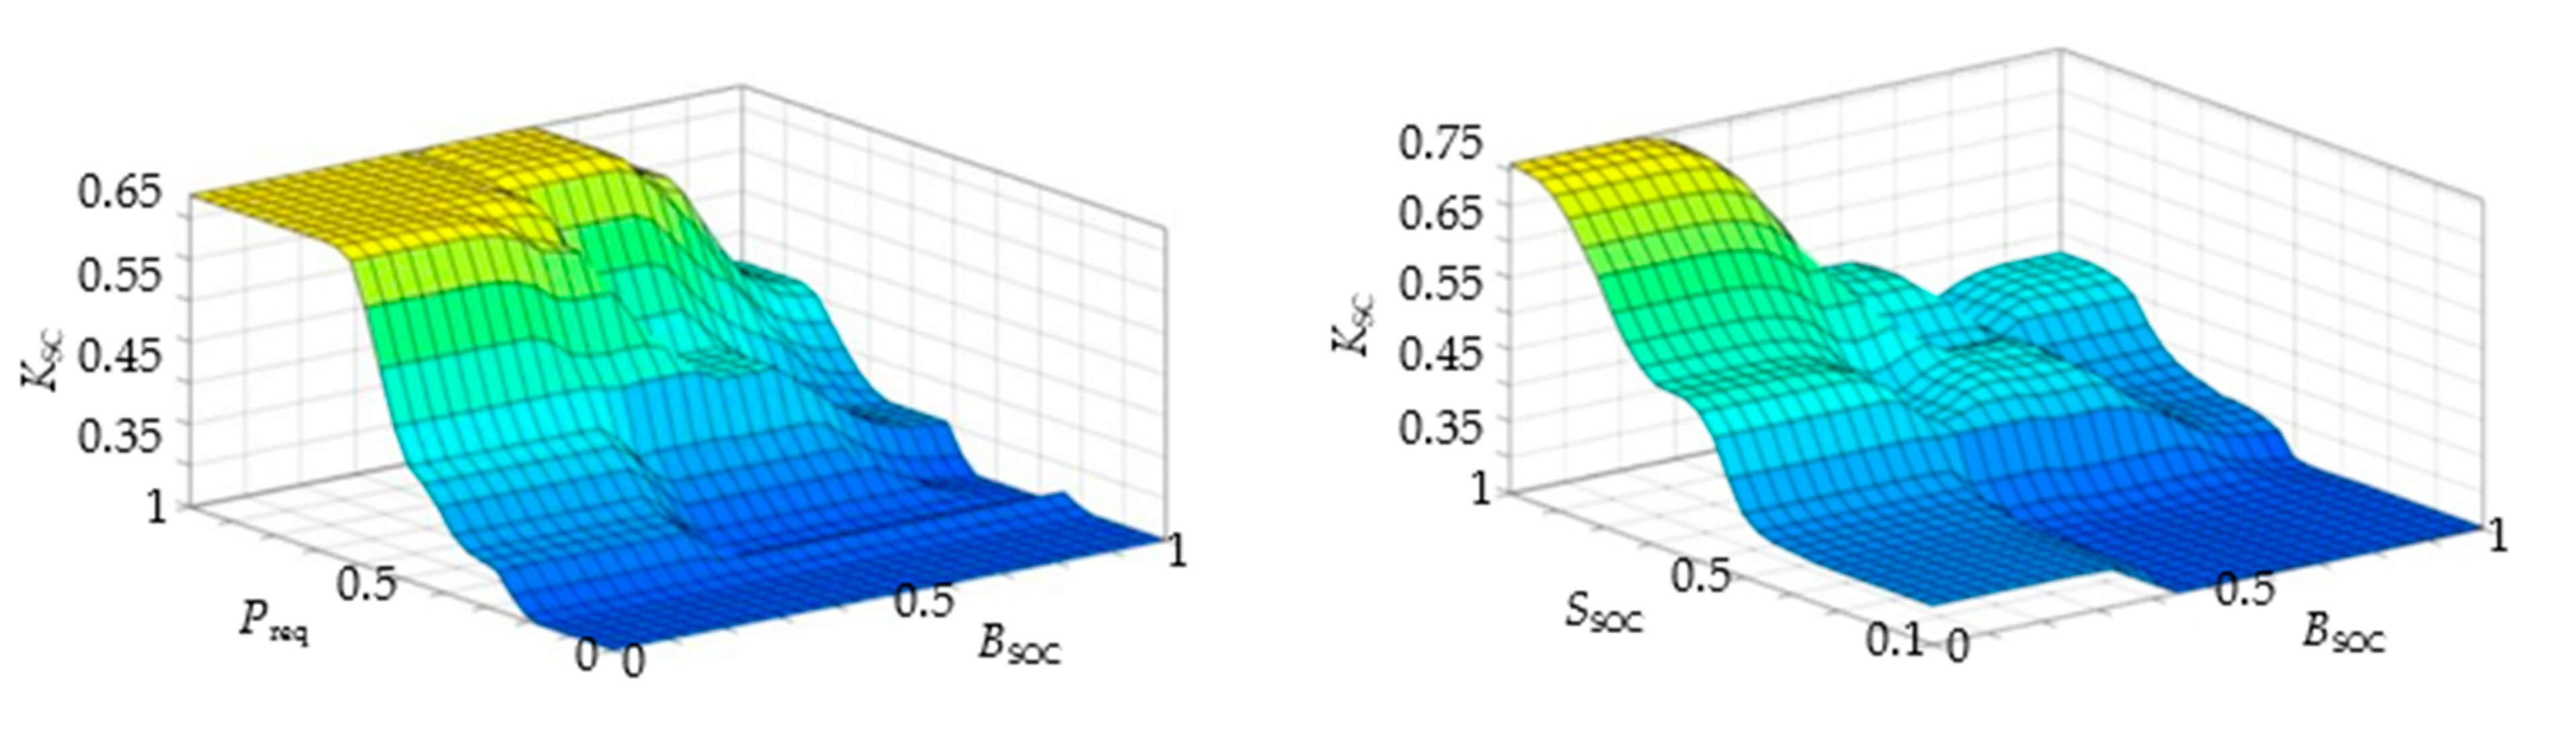
According to the four membership functions designed above and forty-five fuzzy control rules, the state of charge,
SSOC, of the super-capacitor; the state of charge,
BSOC, of the lithium battery; and the relationship between the required power,
Preq, of a pure electric bus and the power distribution factor,
KSC, of the super-capacitor can be obtained; the input–output relationship surface obtained in MATLAB is shown in
Figure 10.
When converting the fuzzy output into the precise output, the center of gravity method, the weighted average method, the maximum membership method or the membership limit element average method can generally be used; this paper used the weighted average method, and the calculation formula is shown in Formula (18).
where U is the fuzzy output set;
μU (
xi) is the membership function;
x0 is the result after defuzzification.
4. Simulation Results Analysis
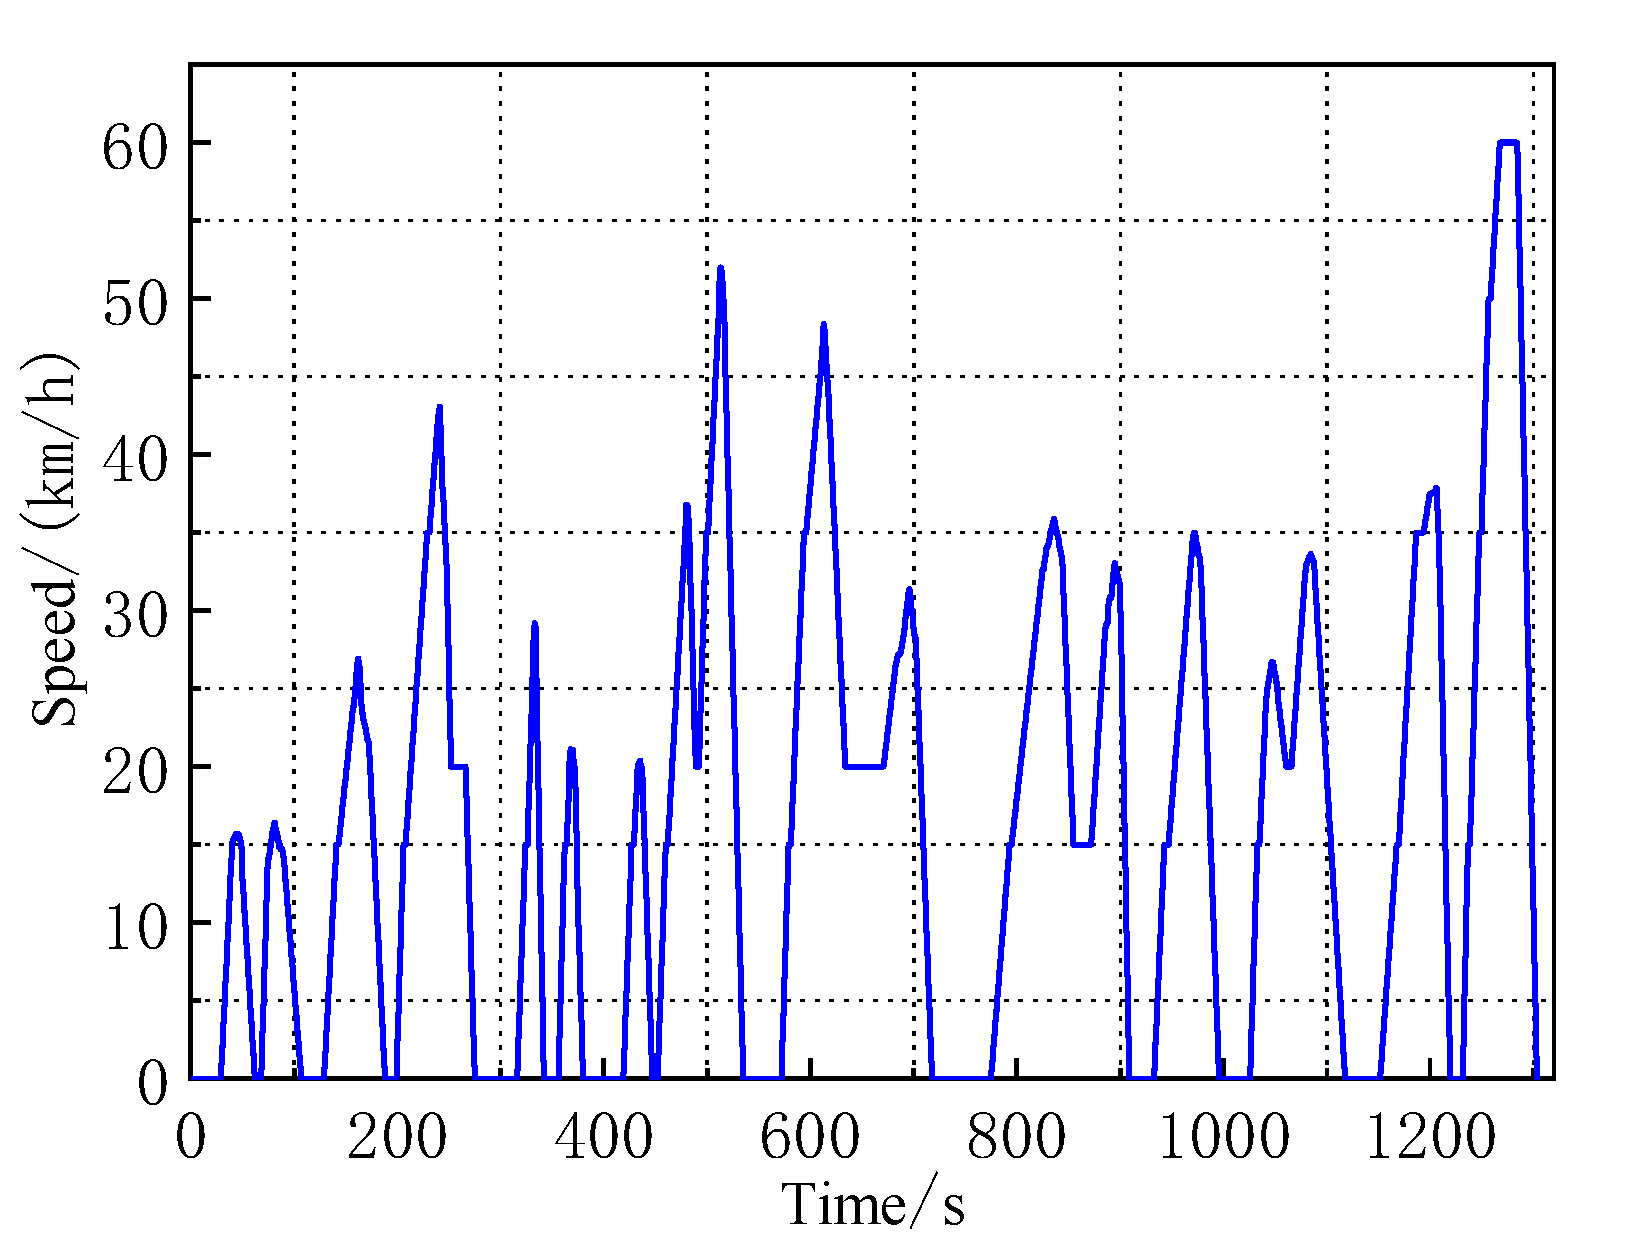
The proposed control method was applied to the experimental prototype under the China city road cycle. The simulation experiment results of the HESS pure electric bus and the pure electric bus were analyzed and compared with a single lithium battery as the energy storage. The corresponding relationship between the working condition time and speed of China city road cycle is shown in
Figure 11. The detailed driving condition information includes the total driving time of 1306 s, the average speed of 16.1 km/h, the maximum speed of 60 km/h, the average driving speed of 16.27 km/h, the total mileage of 5.84 km, the average acceleration of 0.3 m/s
2, the maximum acceleration of 0.91 m/s
2, the maximum deceleration of −1.04 m/s
2, the average deceleration of −0.42 m/s
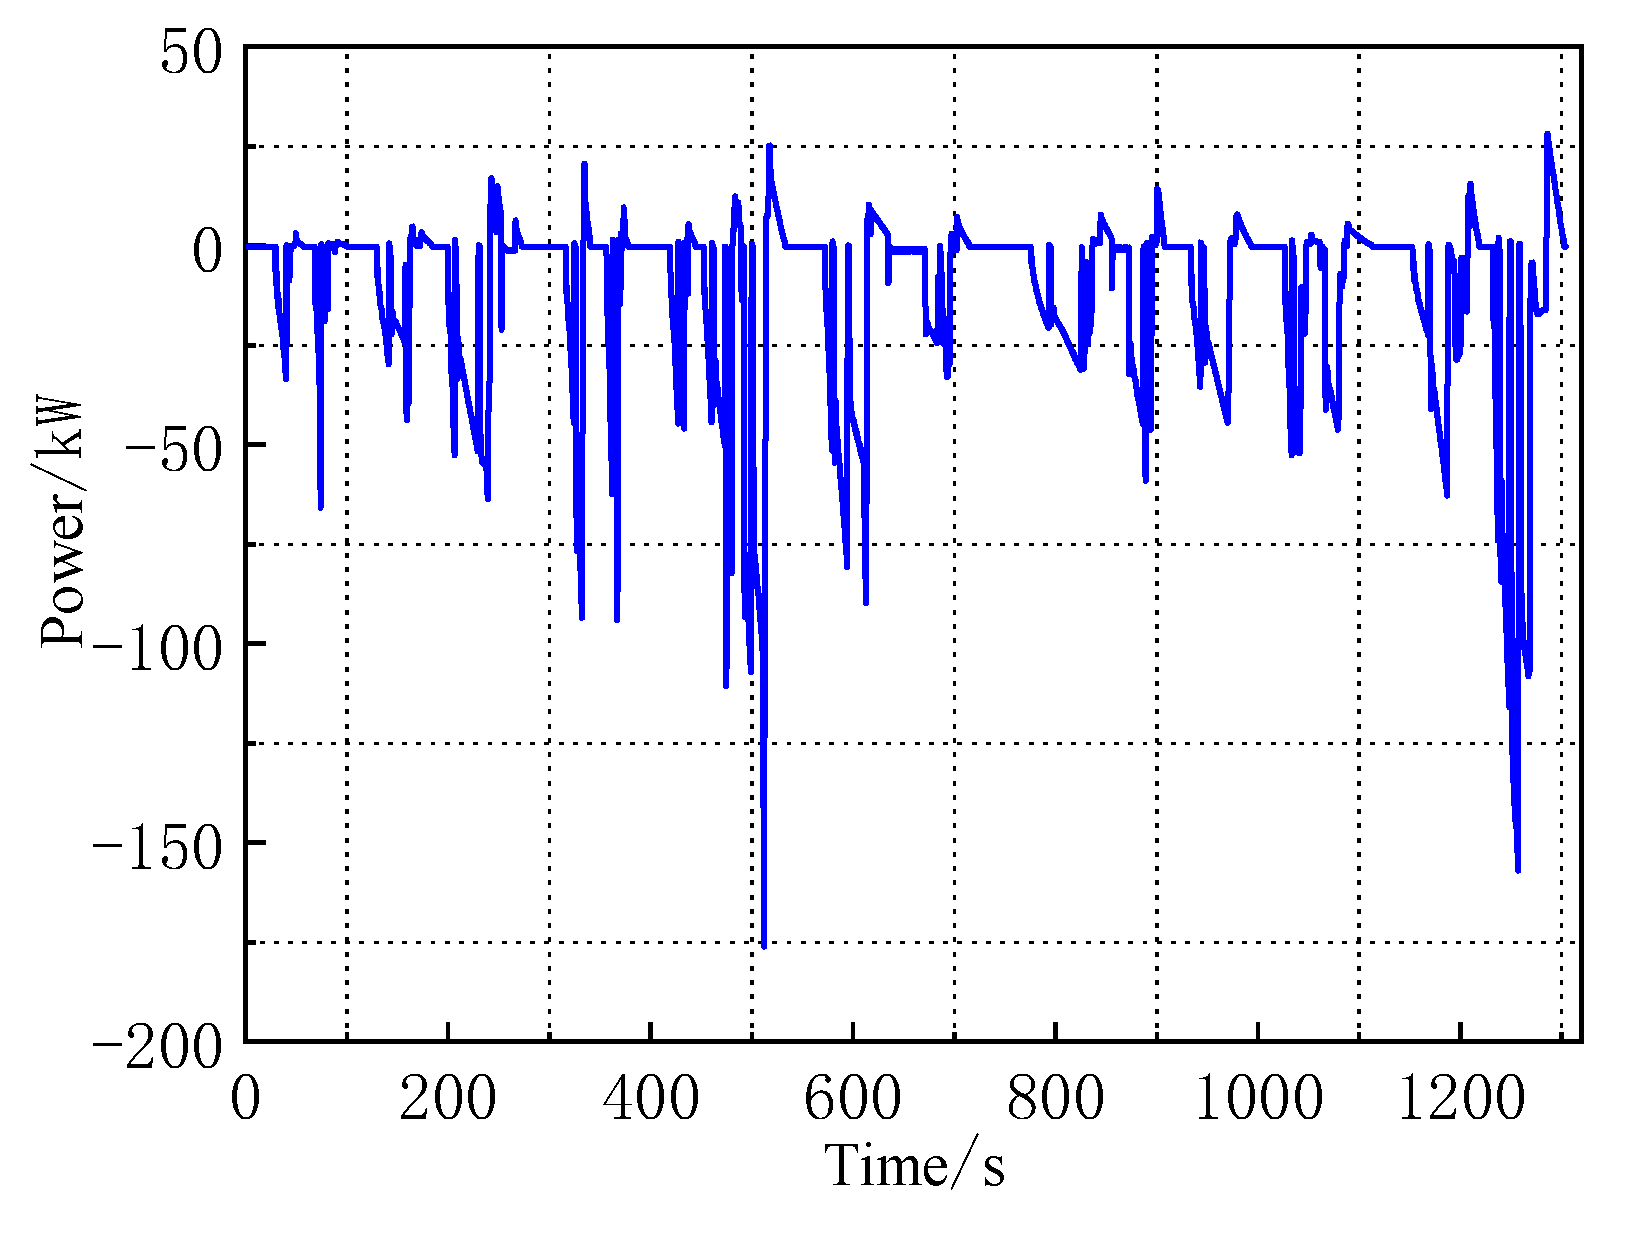
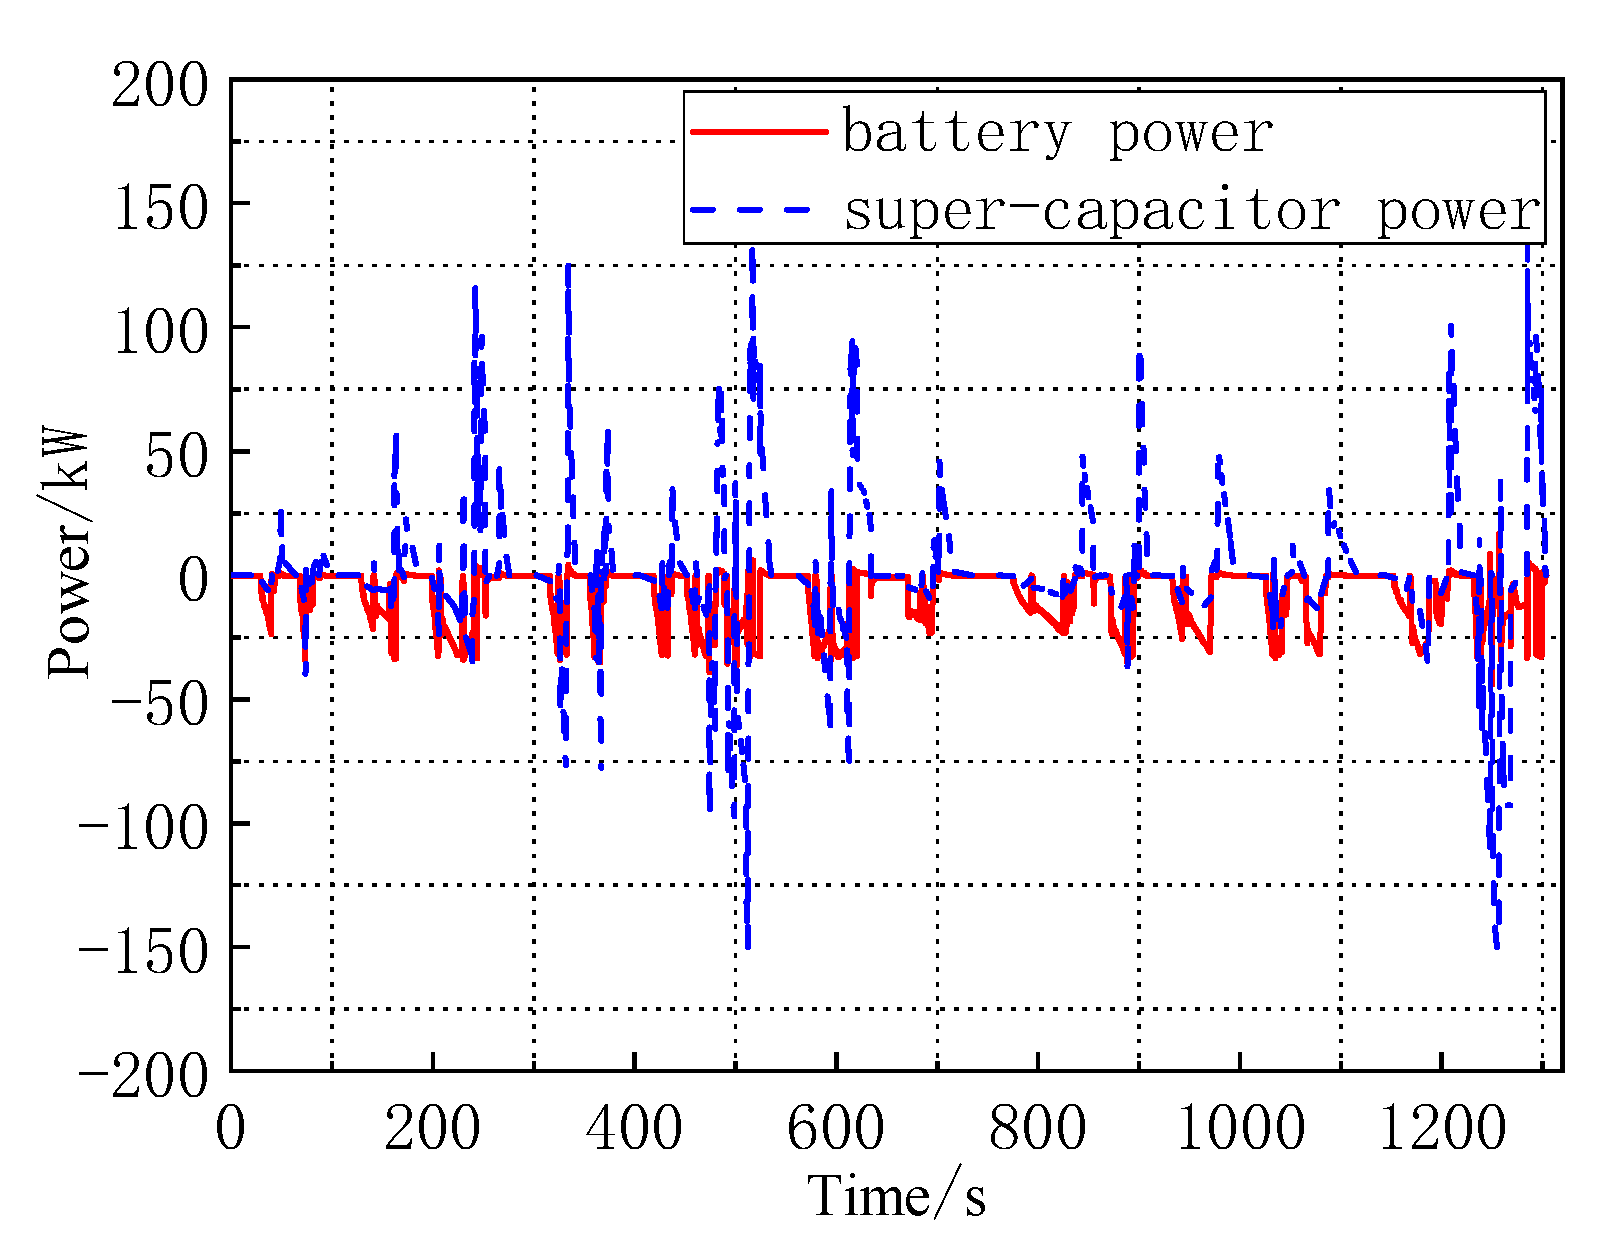
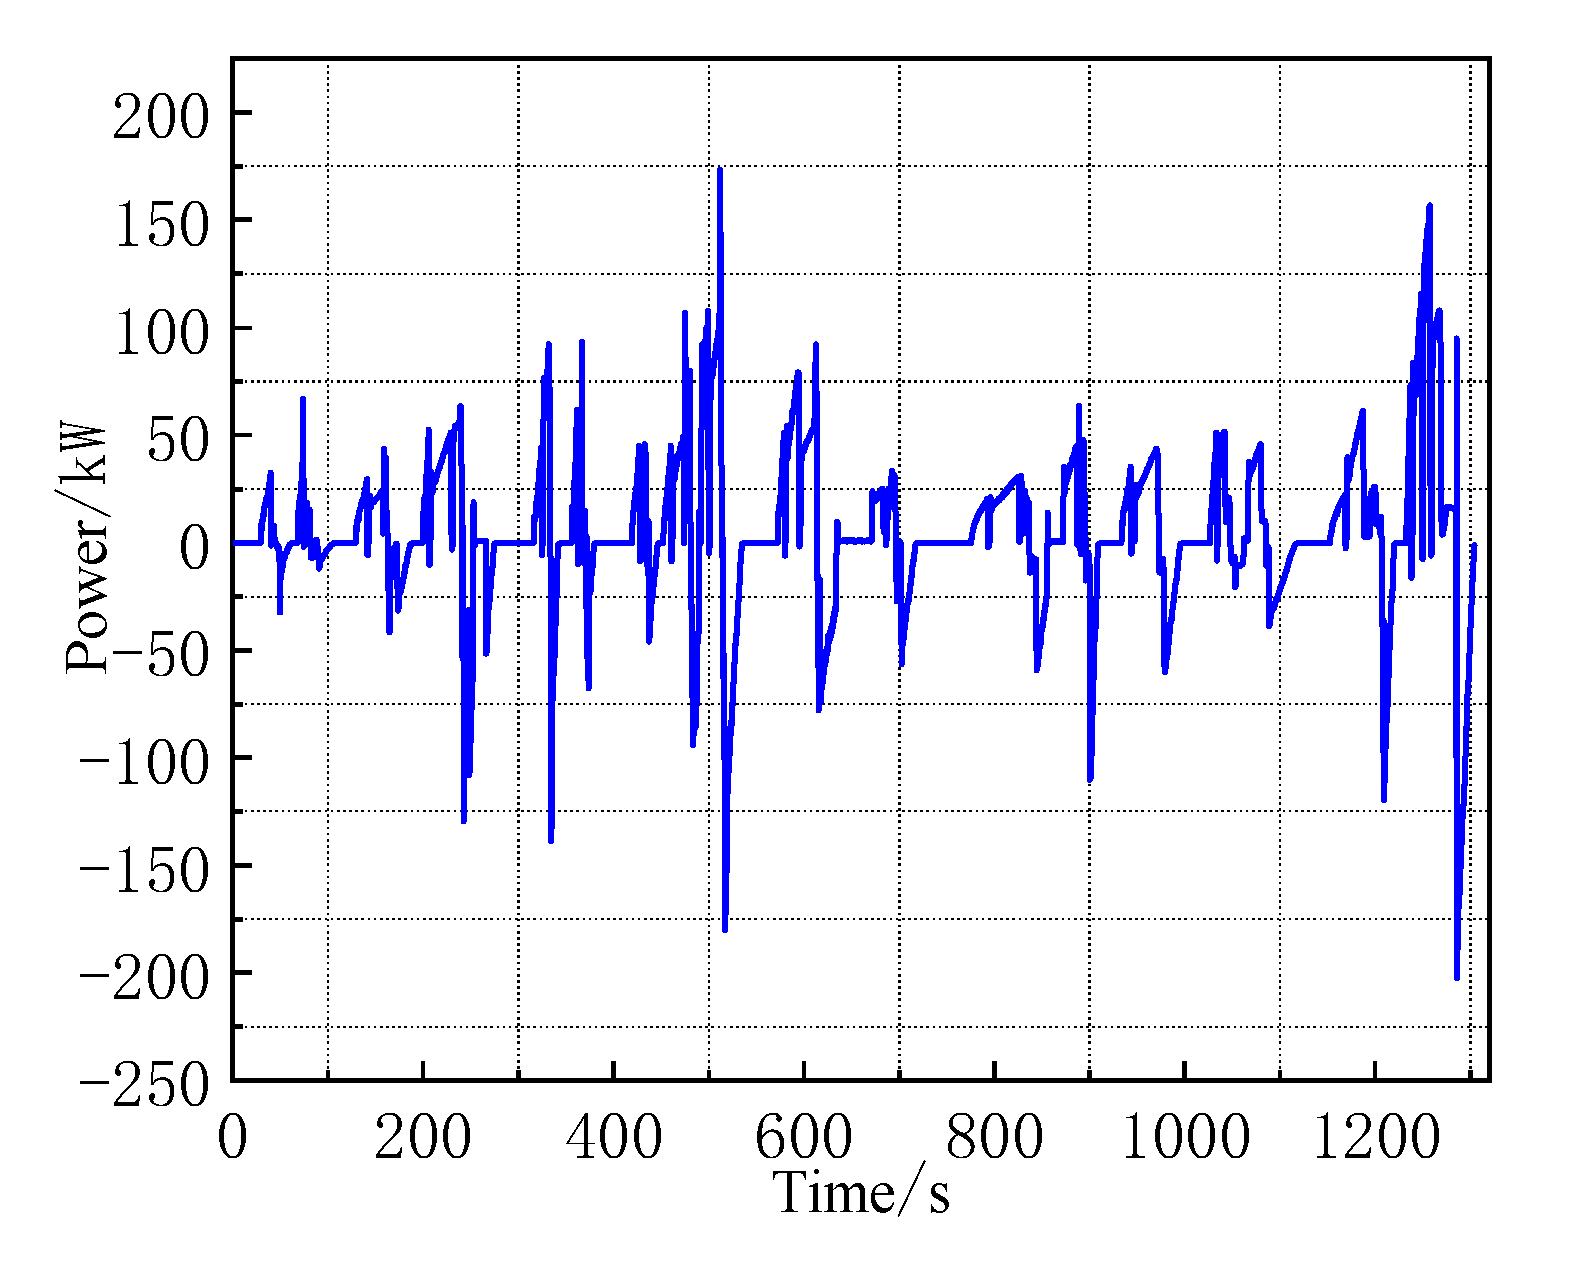
2, the idling time of 366 s, the number of starts and stops of 13 times and the required energy of 7.26 kW·h. The corresponding demand power under the China city road cycle is shown in
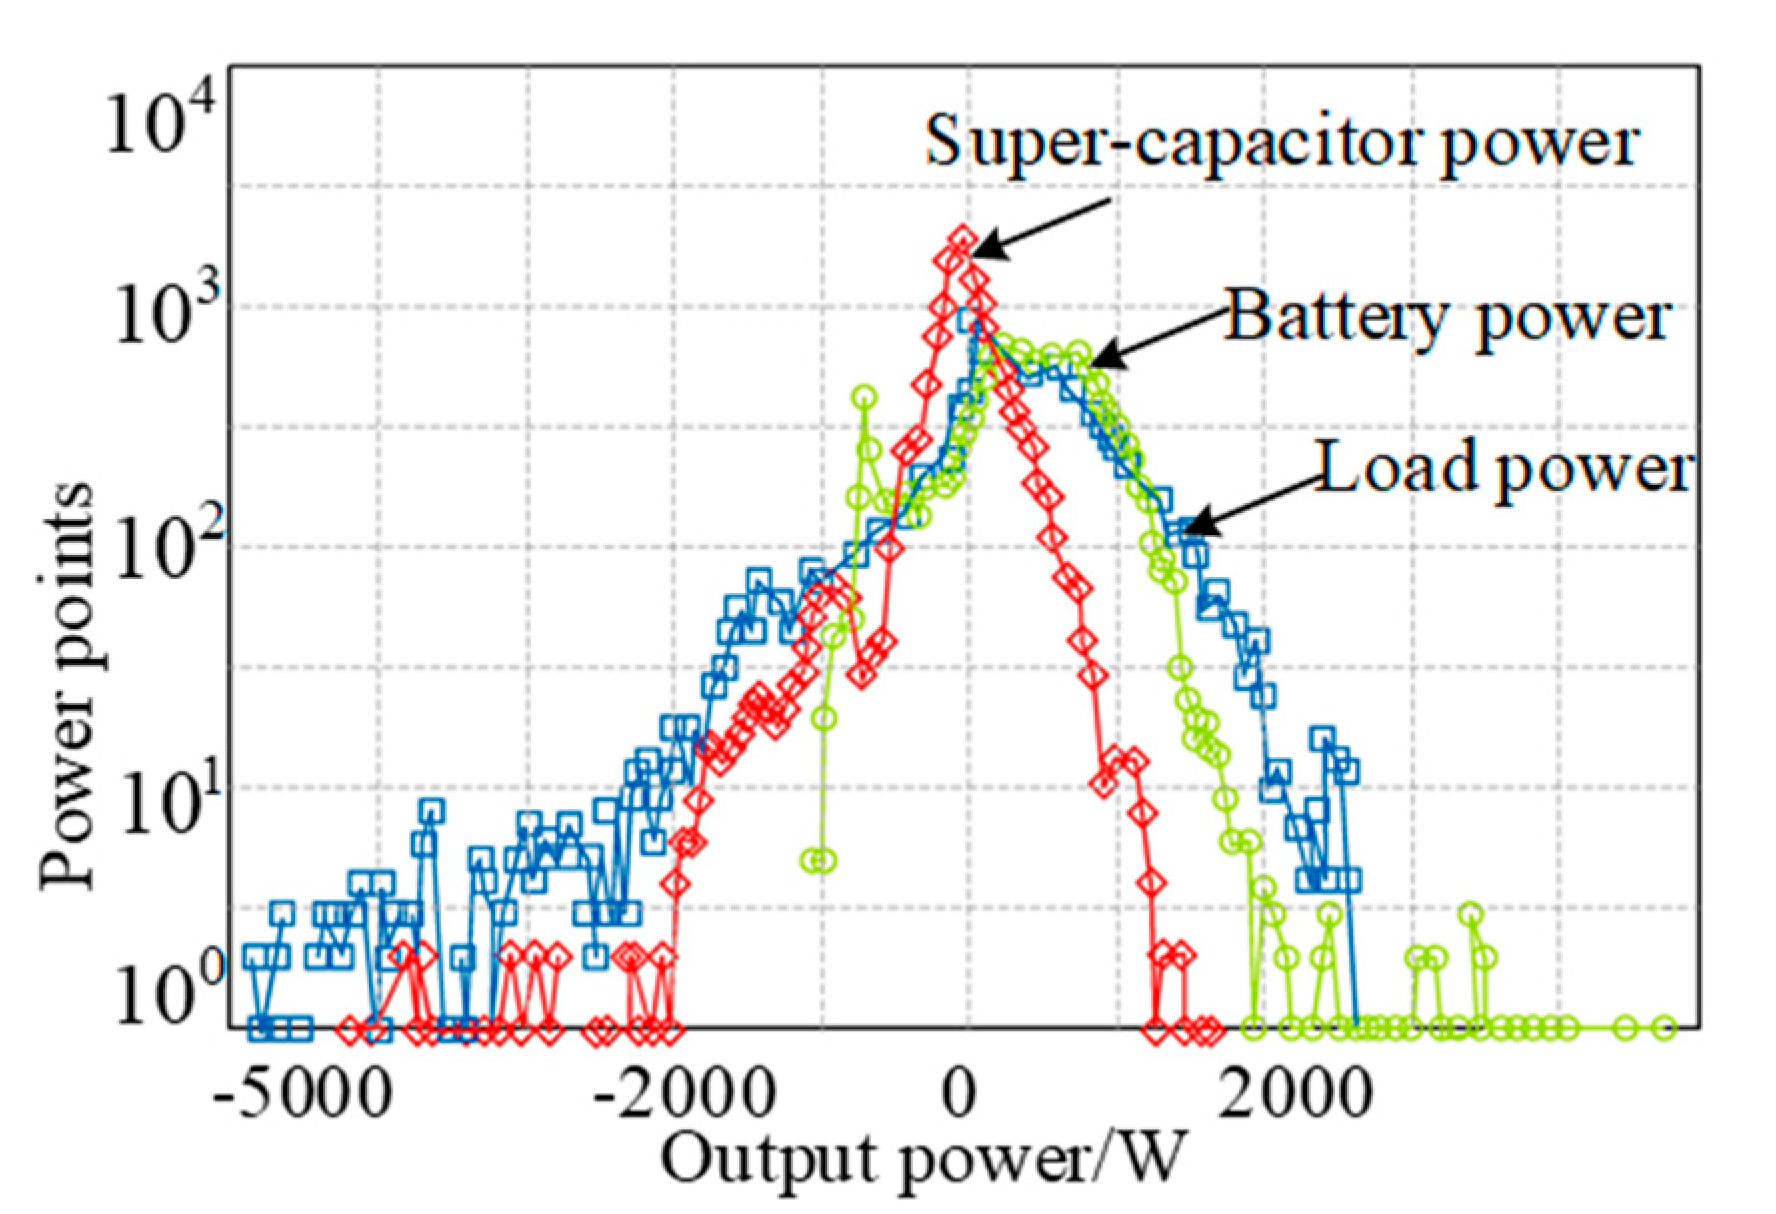
Figure 12. It can be seen from the figure that there are more power spikes, the maximum power is 165.312 kW, the minimum is −153.85 kW and the maximum change in power is 319.162. kW; the power changes significantly at the start and stop moments. Under a single experimental road condition, the power emitted and absorbed by the super-capacitor was 32.85 and 33.08 kW, respectively, and the power emitted and absorbed by the battery was 30.86 and 16.97 kW, respectively. In the process of energy recovery, the super-capacitor recovered more power and absorbed more energy.
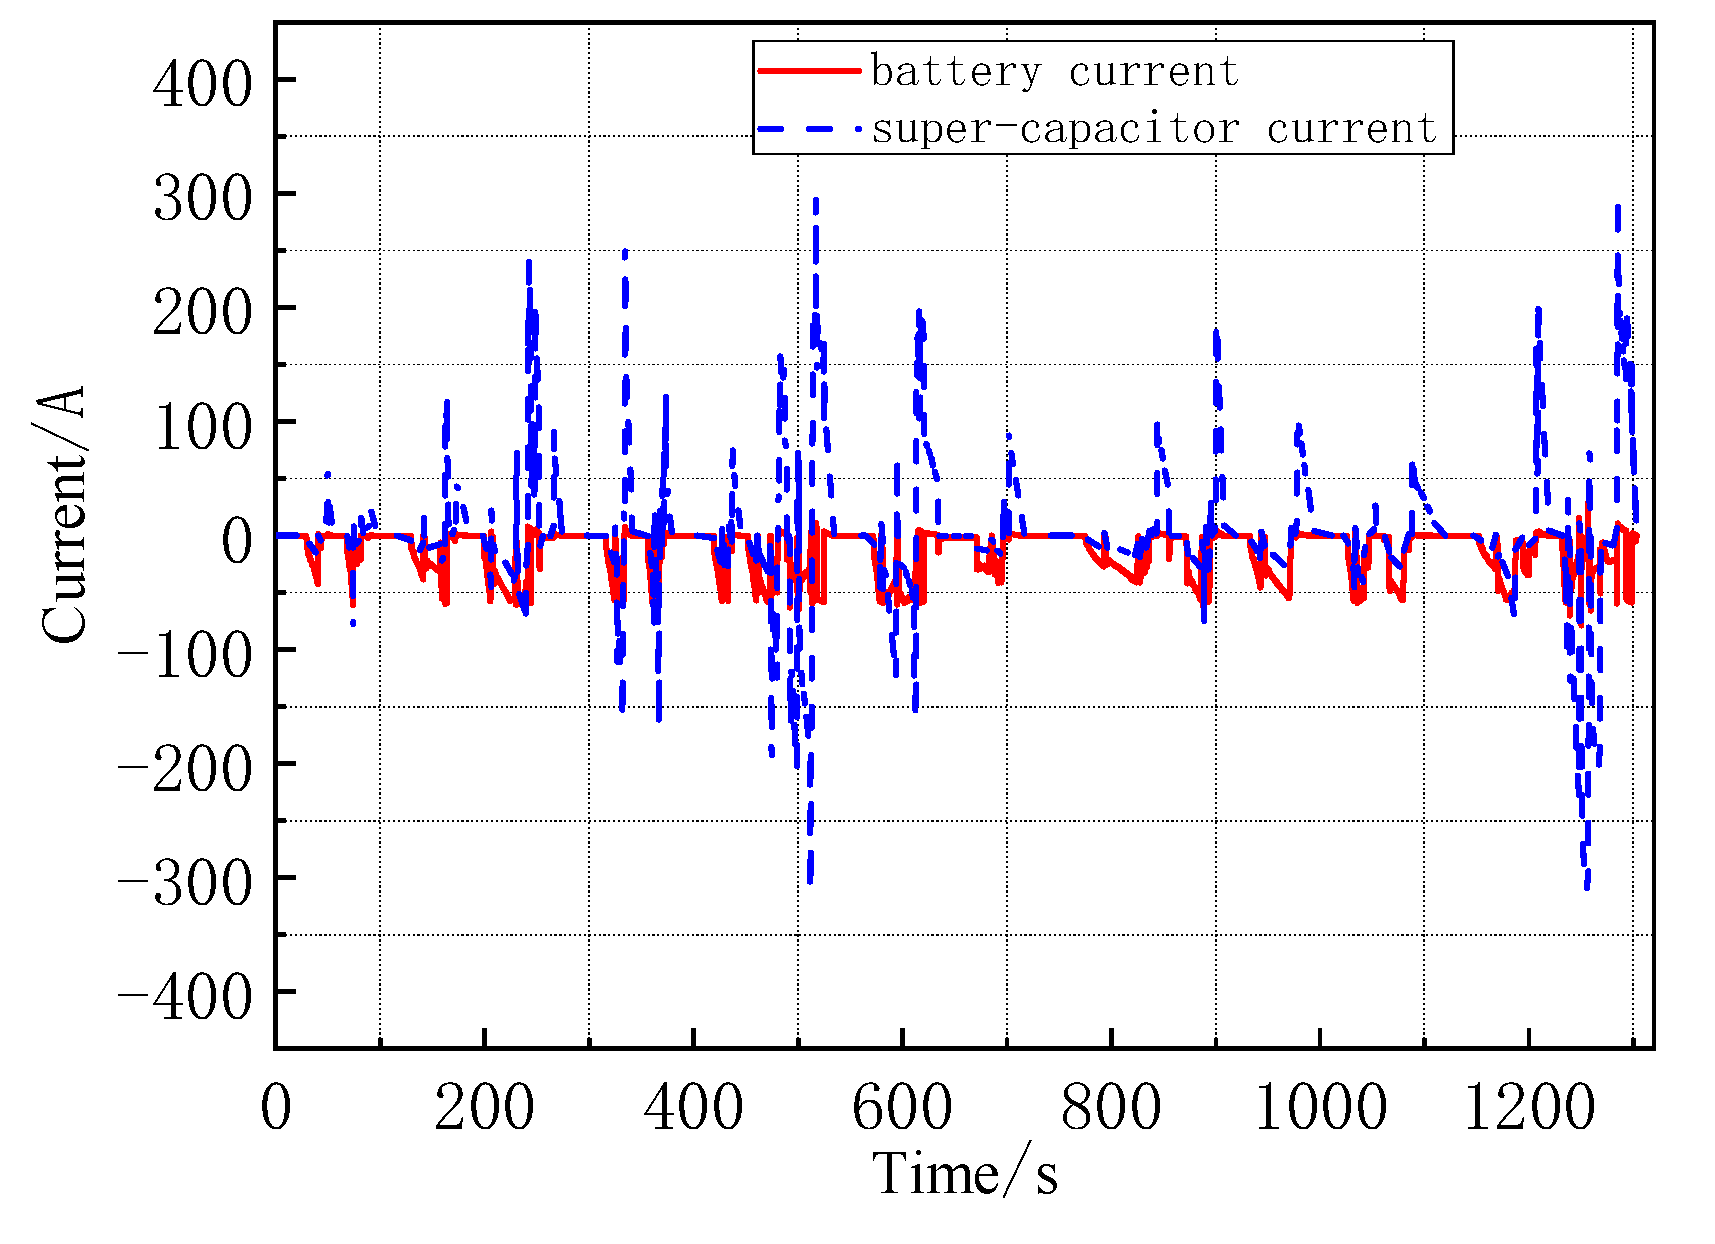
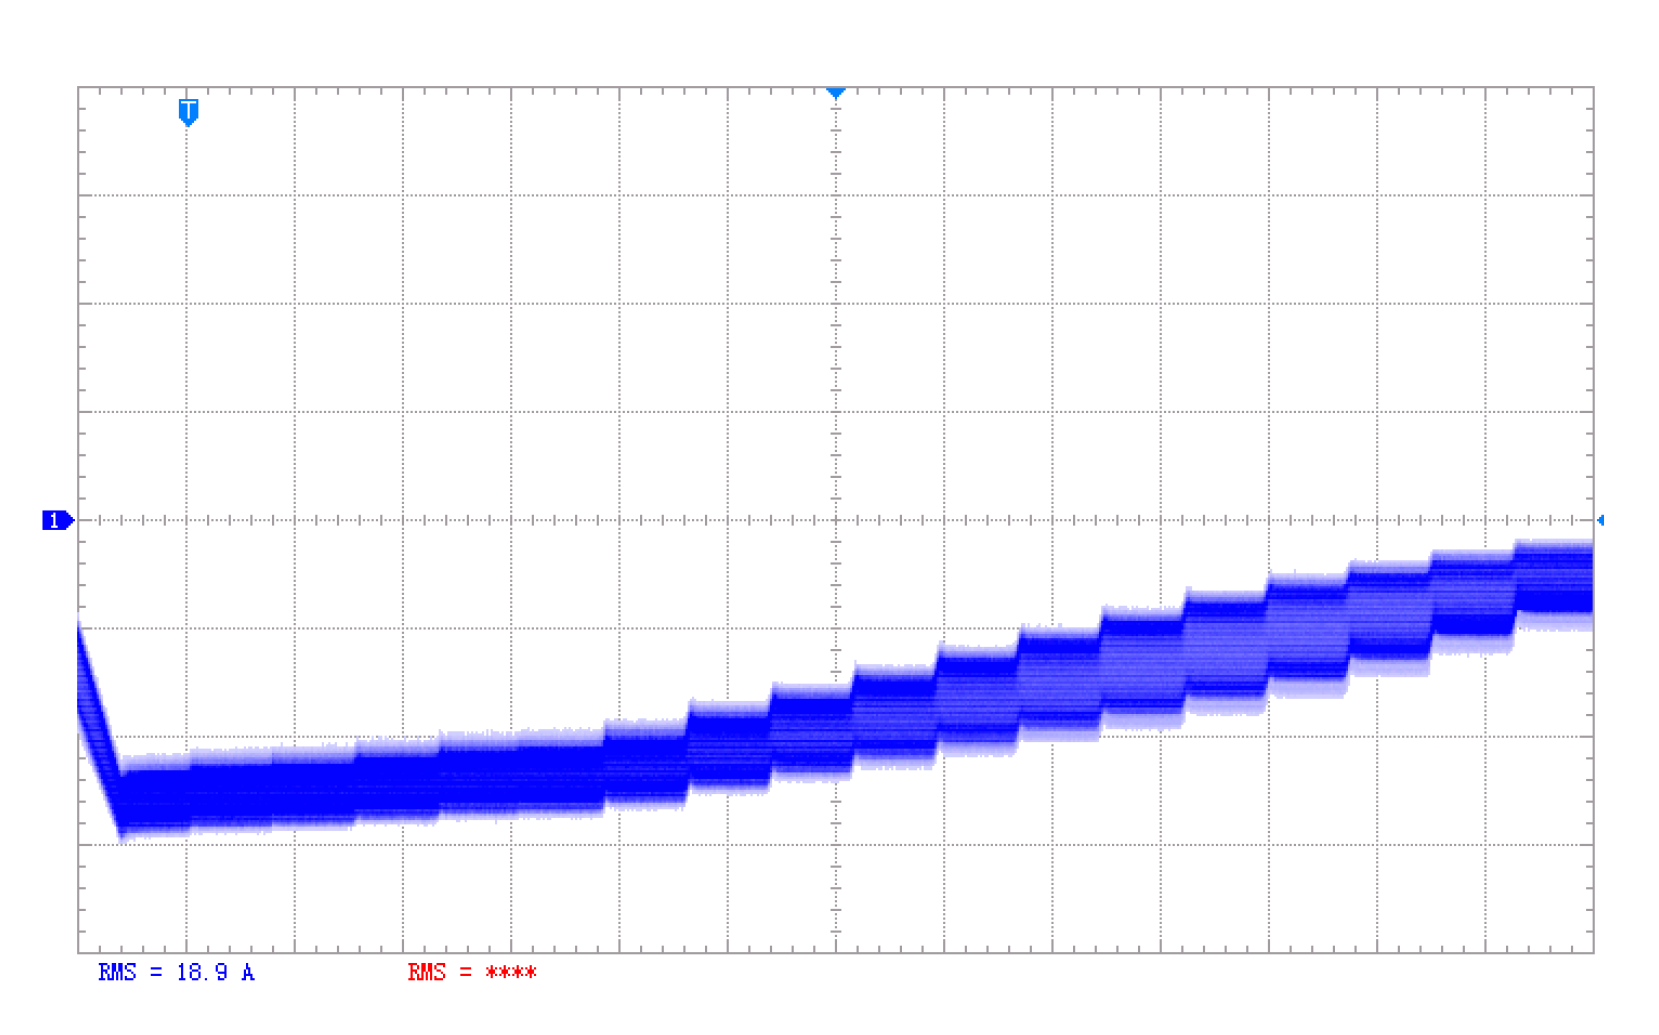
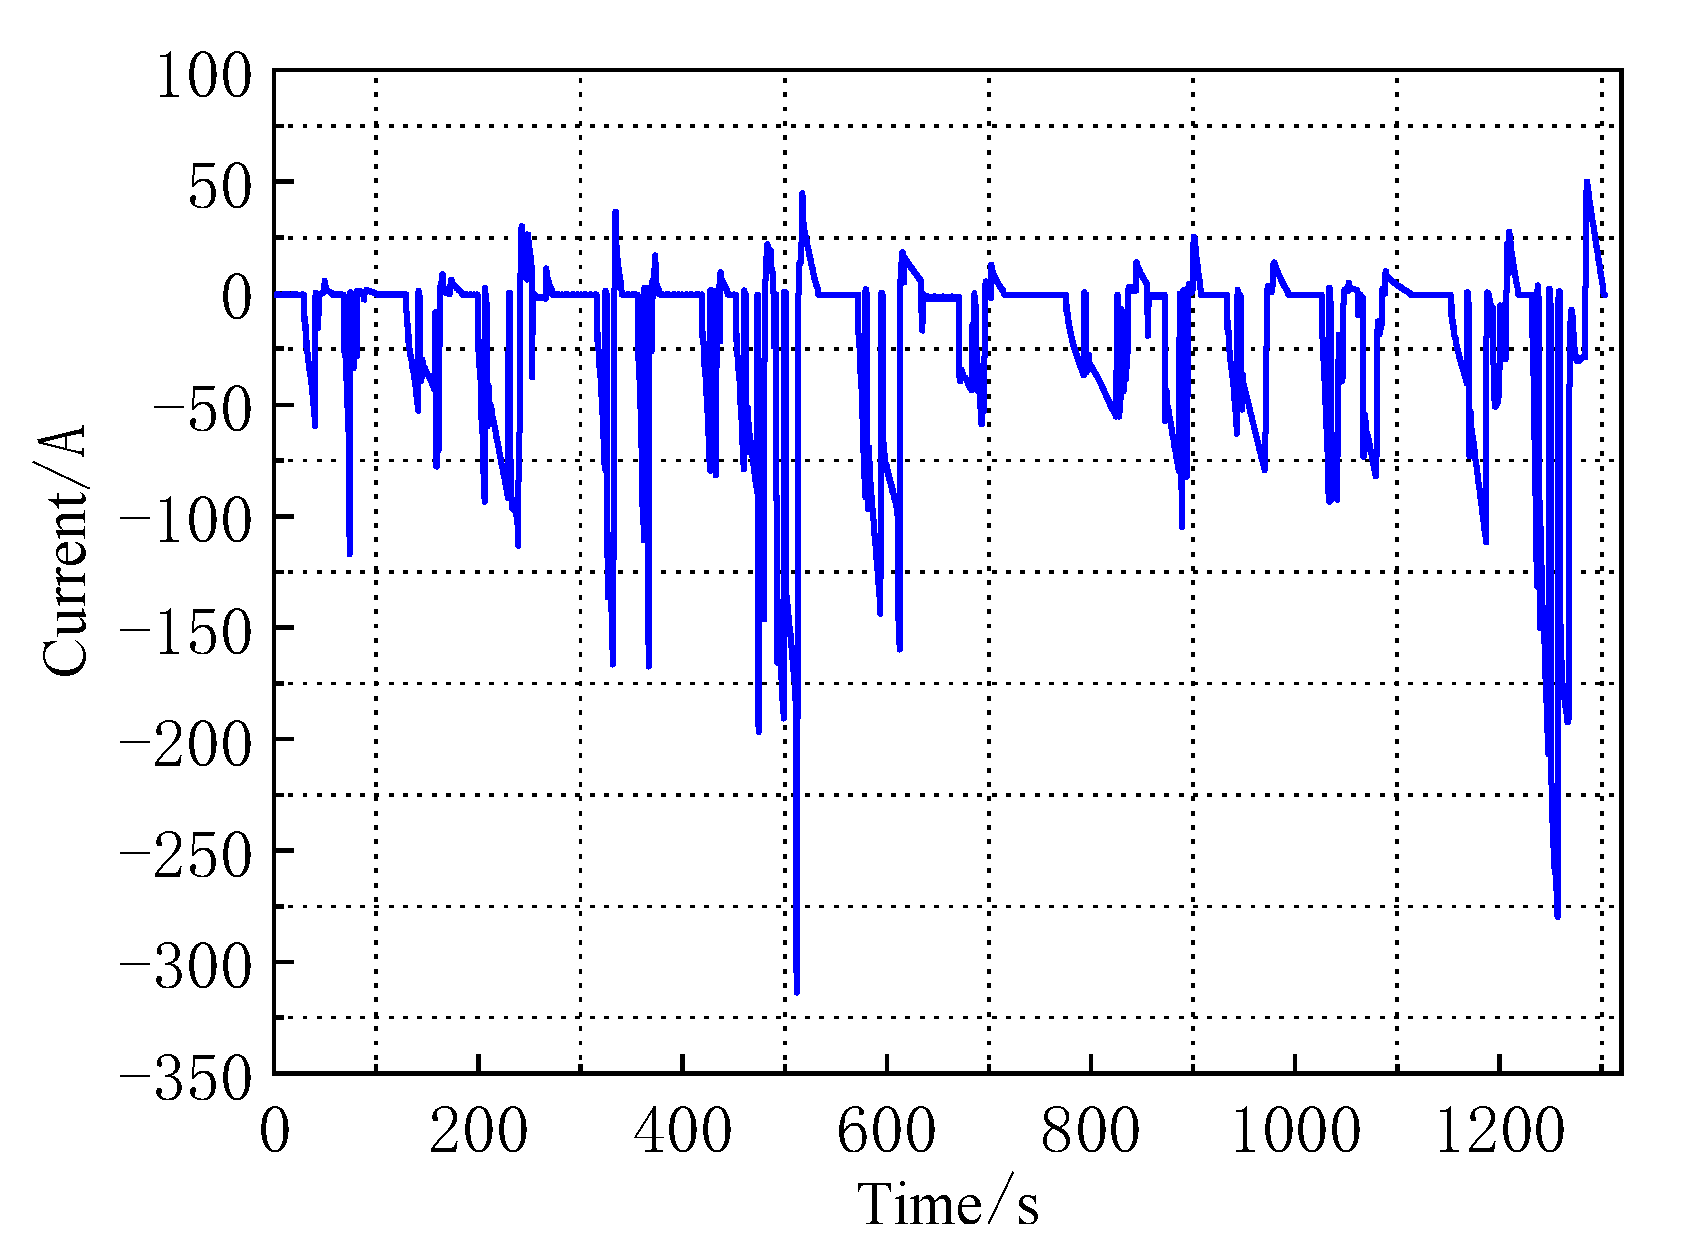
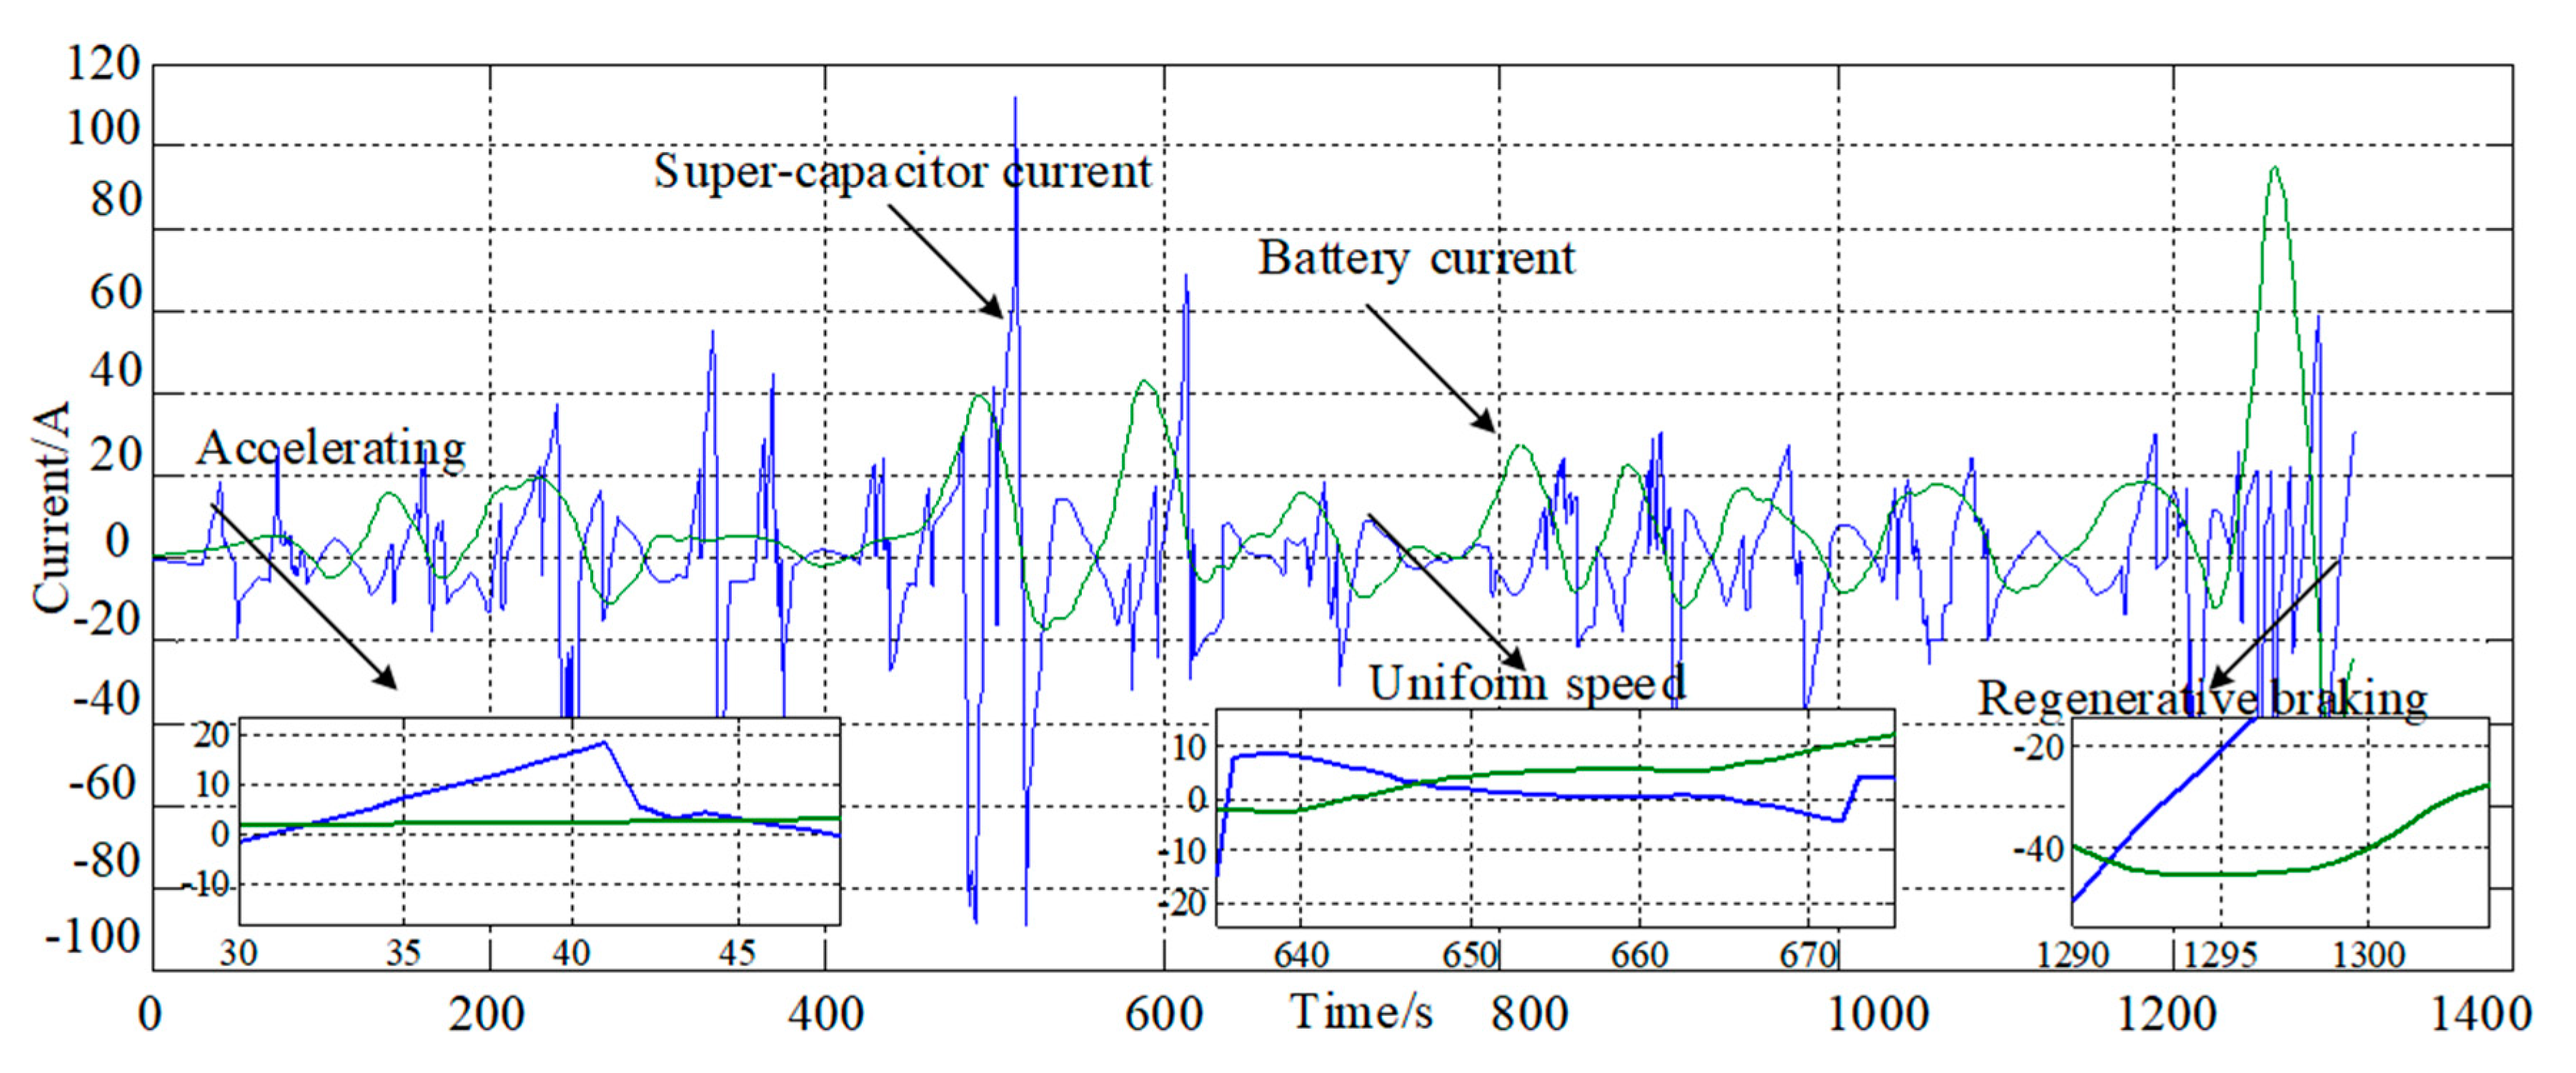
When the lithium battery was powered alone, the maximum current of the lithium battery was 313.73 A, the maximum power was 176.10 kW and the output of the lithium battery was too high; when it used the fuzzy control strategy, the maximum current of the lithium battery was 62.29 A and the maximum power was 35.06 kW; the output current and power of the battery reduced drastically. The power demand of the pure electric bus exceeded the maximum power of the bi-directional DC/DC converter during the driving process; the remaining power could only be provided by the lithium battery to meet the driving demand, and the maximum power of the lithium battery was generated at this time, as shown in
Figure 13,
Figure 14,
Figure 15 and
Figure 16.
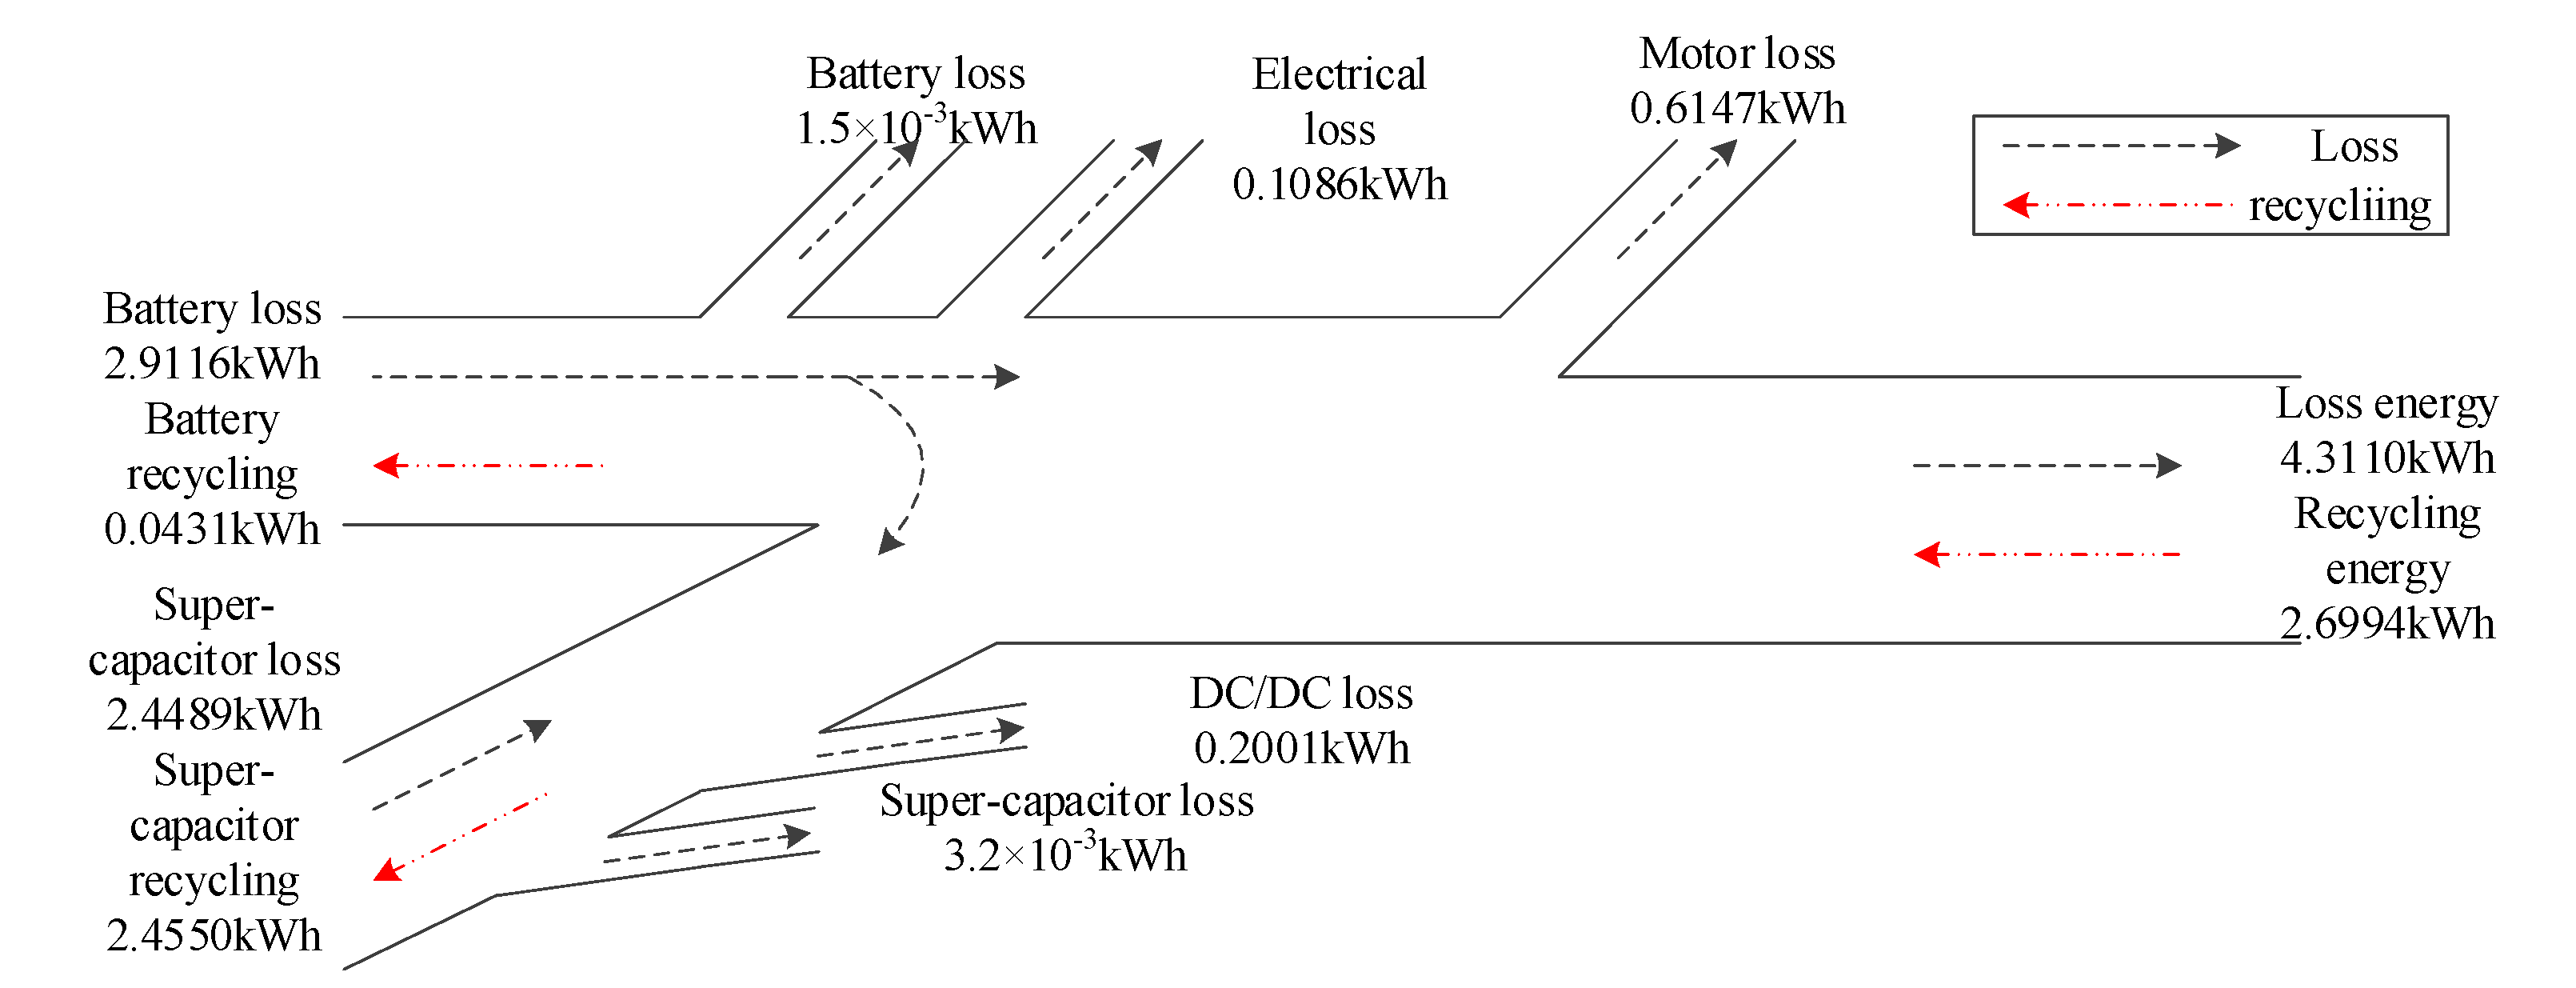
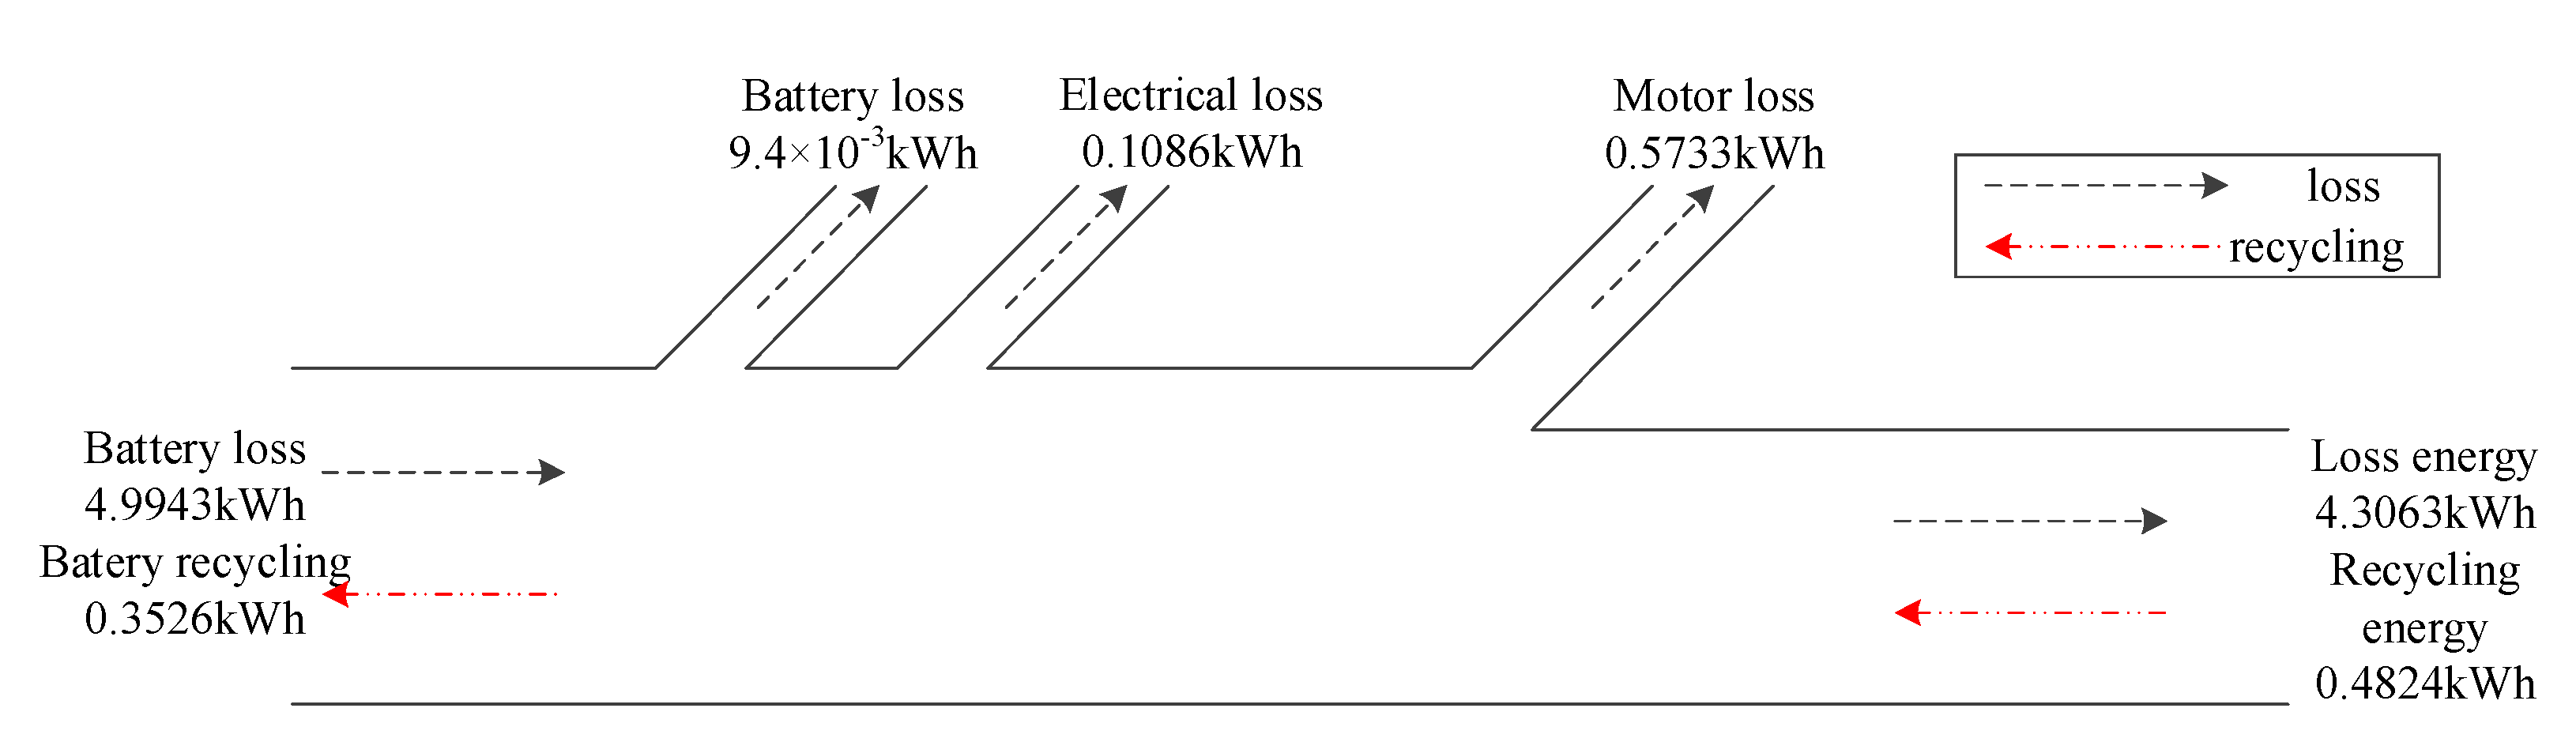
From the perspective of energy flow, we analyze the simulation results. From
Figure 17 and
Figure 18, it can be seen that when the lithium battery alone provided energy for the motor, the lithium battery consumed 4.64 kWh and the reclaimed braking energy was 0.48 kWh; when adopting fuzzy control at the same time, the composite energy storage system consumed 2.86 kWh of energy and recovered 2.70 kWh of braking energy.


