Article

Two-Stage Multi-Period Coordinated Load Restoration Strategy for Distribution Network Based on Intelligent Route Recommendation of Electric Vehicles

1
National Active Distribution Network Technology Research Center, Beijing Jiaotong University, Beijing 100044, China
2
State Grid Tianjin Electric Power Company Economic and Technology Research Institute, Tianjin 276000, China
*
Author to whom correspondence should be addressed.
World Electr. Veh. J. 2021, 12(3), 121; https://doi.org/10.3390/wevj12030121
Submission received: 23 July 2021 / Revised: 10 August 2021 / Accepted: 12 August 2021 / Published: 14 August 2021

Abstract

:
To cope with the frequent blackouts in recent years and improve the resilience of the distribution network, a two-stage multi-period coordinated load restoration strategy for the distribution network based on intelligent route recommendation of electric vehicles (EVs) is proposed. The first stage of the model aims at maximizing the weighted power supply time of load, minimizing the total network loss, optimizing the output of each power supply source at each time period, and determining the optimal charging station assignment scheme for schedulable EVs. The second stage is based on the optimal charging station assignment scheme for EV determined in the first stage, with the shortest total time for all EVs to reach the designated charging stations as the objective and determining the optimal travel route of each EV. The model dispatches the idle EVs during blackout as a flexible power supply resource, realizing the multi-period coordination output of multiple sources and recommending the routes for EVs to reach the designated charging stations to optimize the restoration effect of critical loads. The methods of piecewise linearization, second-order conic relaxation (SOCR) and the Dijkstra algorithm are applied to ensure the feasibility and accuracy of the model. Finally, by comparing the proposed strategy with two different single-stage strategies, the effect of these three strategies on the critical load’s restoration and the operation status of the distribution network is further analyzed, which verifies the effectiveness and superiority of the proposed strategy.

1. Introduction

The power system is the most complicated man-made system in the world, so failures and blackouts are inevitable. In recent years, there have been frequent blackouts [1] in the power system due to extreme weather such as typhoons and freezing, or extreme events such as hacker attacks and man-made sabotages [2]. Once a blackout accidentally occurs, it will pose a huge threat to personal safety and property safety and cause incalculable losses [3]. Therefore, how to improve the ability of the power system to deal with blackouts, how to quickly restore critical loads and extend the power supply time of critical loads as much as possible, which could improve the resilience of the power system [4] and minimize the losses caused by the blackout, is a problem that many researchers are eager to solve.
With massive access to distributed power sources [5] and flexible loads such as electric vehicles (EVs) [6], the conventional distribution network has gradually become an active distribution network [7] with a certain degree of controllability [8] and brings more schemes for distribution network to restore critical loads during blackouts [9]. If a large number of idle and low utilization rate power sources are equipped to deal with unexpected accidents such as power failures, it will inevitably cause waste of resources and excessive costs. Therefore, the idle EVs could be used as a large number of flexible power generation resources for dispatch during the blackout. After the distribution network loses power supply from the main grid, some of its internal branches may also be broken due to faults. Through the action of the pre-installed switches, the distributed power supply and the load that needs to be restored can be connected in a radial island pattern [10]. Then the critical loads in the distribution network could be supplied by distributed power sources and EV charging stations. As an emerging environment-friendly transportation [11], EVs have energy-saving and low-emission potential [12,13] and are different from conventional vehicles, because they can feed power to the grid through Vehicle-to-Grid(V2G) technology and take advantage of their mobile energy storage characteristics. EVs can play a huge role in load restoration during a blackout [14].
At this stage, researchers have conducted a lot of research on how to improve the resilience of the power system and how to quickly restore the power supply of critical load. Paper [15] mainly considered the method of multi-stage distribution network topology reconstruction, but there was relatively little discussion on the scheduling of multi-source coordinated output, so this article takes the coordinated output scheduling of distributed energy source and EV charging stations into consideration. Simultaneously considering the reconfiguration of the distribution network and the division of islands, as well as the coordinated output of distributed power sources such as wind power, photovoltaics and gas turbines, and energy storage systems, a fault dynamic recovery model was established in paper [16]. Paper [17] took the dispatchable distributed energy resources, non-dispatchable distributed energy resources, demand response, on-load tap changers and shunt capacitors into consideration. Paper [18] considered the problem of load restoration in an active distribution network with multiple soft open points, and discussed the specific switch operations and the switching of soft open point control mode during the restoration process. Paper [19] considered the coupling of the power distribution network and the water distribution network, and then established a fault recovery optimization decision-making model. Paper [20] proposed the concept of scheduling coefficient and used it to measure the rationality of distributed energy resources scheduling in the process of load restoration. However, the effect of EV charging stations on load restoration was not considered in the above five papers. Therefore, this article mainly focuses on the role of EV charging stations on load restoration. Paper [21,22] considered the influence of the synergy of heat, cool, gas and other forms of energy on load restoration. Paper [23] considered the influence of cooling load and proposed the optimal islanding restoration planning method based on the EV discharging model. Paper [24] considered the synergy of distributed power sources, EV charging stations, and distributed energy storage. However, these four papers above did not fully consider the transportation attributes of EVs and did not couple the transportation network with the distribution network. On this basis, this article fully couples the transportation network and distribution network, recommends routes for EVs to designated charging stations, and makes the process of EVs participating in load restoration more complete.
EVs are usually brought up with not only their electrical characteristics, but also their traffic characteristics. In the process of dispatching the EVs to the charging stations for V2G discharging during a blackout, the factors of the transportation network need to be considered. After an extreme event occurs, huge losses may be avoided if the critical load could be restored even one minute earlier, so time is a very significant resource in such a situation. Intelligently recommending the optimal route for the EVs to the target charging stations can save a lot of time. Paper [25] proposed the idea of selecting the optimal route based on the constructed transportation network model and the Dijkstra algorithm, but did not mention the specific process. It only directly mentioned the EV charging and discharging capacity time-sequence diagram. In this paper, the Dijkstra algorithm is fully applied to realize the route recommendation of EV aggregation which could ensure the total time needed by the aggregation is the lowest. Paper [26] took into account the resilience of the distribution network and the convenience of daily charging for electric buses, and proposed a method for selecting the location of charging stations considering the transportation network. However, it did not take into account the specific dispatching problems during a blackout which is the focus point of this article. The starting nodes and the target nodes of EVs in paper [27] were fixed, and there was no prior decision on the optimal charging stations that each EV should go to, resulting in the geographic flexibility of the EVs cannot be taken full advantage of, in order to maximize the weighted power supply time of load. Therefore, this article makes up for this shortcoming. The optimal charging station assignment is performed for each EV with the optimal load restoration effect as an objective, and hence the destination node in the transportation network is determined, so as to realize the full use of the limited power supply resources.
The main contributions are as follows: (1) A two-stage multi-period coordinated load restoration strategy for distribution network based on intelligent route recommendation of EVs is proposed. In the first stage of the strategy, the objective is to maximize the weighted power supply time of load, making charging station assignment decisions for EVs that are willing to participate in load restoration services, and determining the output of distributed generators and charging stations in each period. In the second stage, the objective is to minimize the sum of the time required for all EVs to reach the charging station determined in the first stage. Considering the traffic congestion of each road section, the specific optimal travelling route for each EV is recommended. (2) The model is processed by multiple linearization, second-order conic relaxation (SOCR) and the Dijkstra algorithm to ensure the solvability and accuracy of the model. (3) The proposed strategy is compared with the strategy that does not allocate EVs to the charging stations reasonably, and the strategy that neither allocates EVs reasonably nor considers multi-period coordinated load restoration, respectively, to verify the effectiveness and superiority of the strategy proposed in this paper.

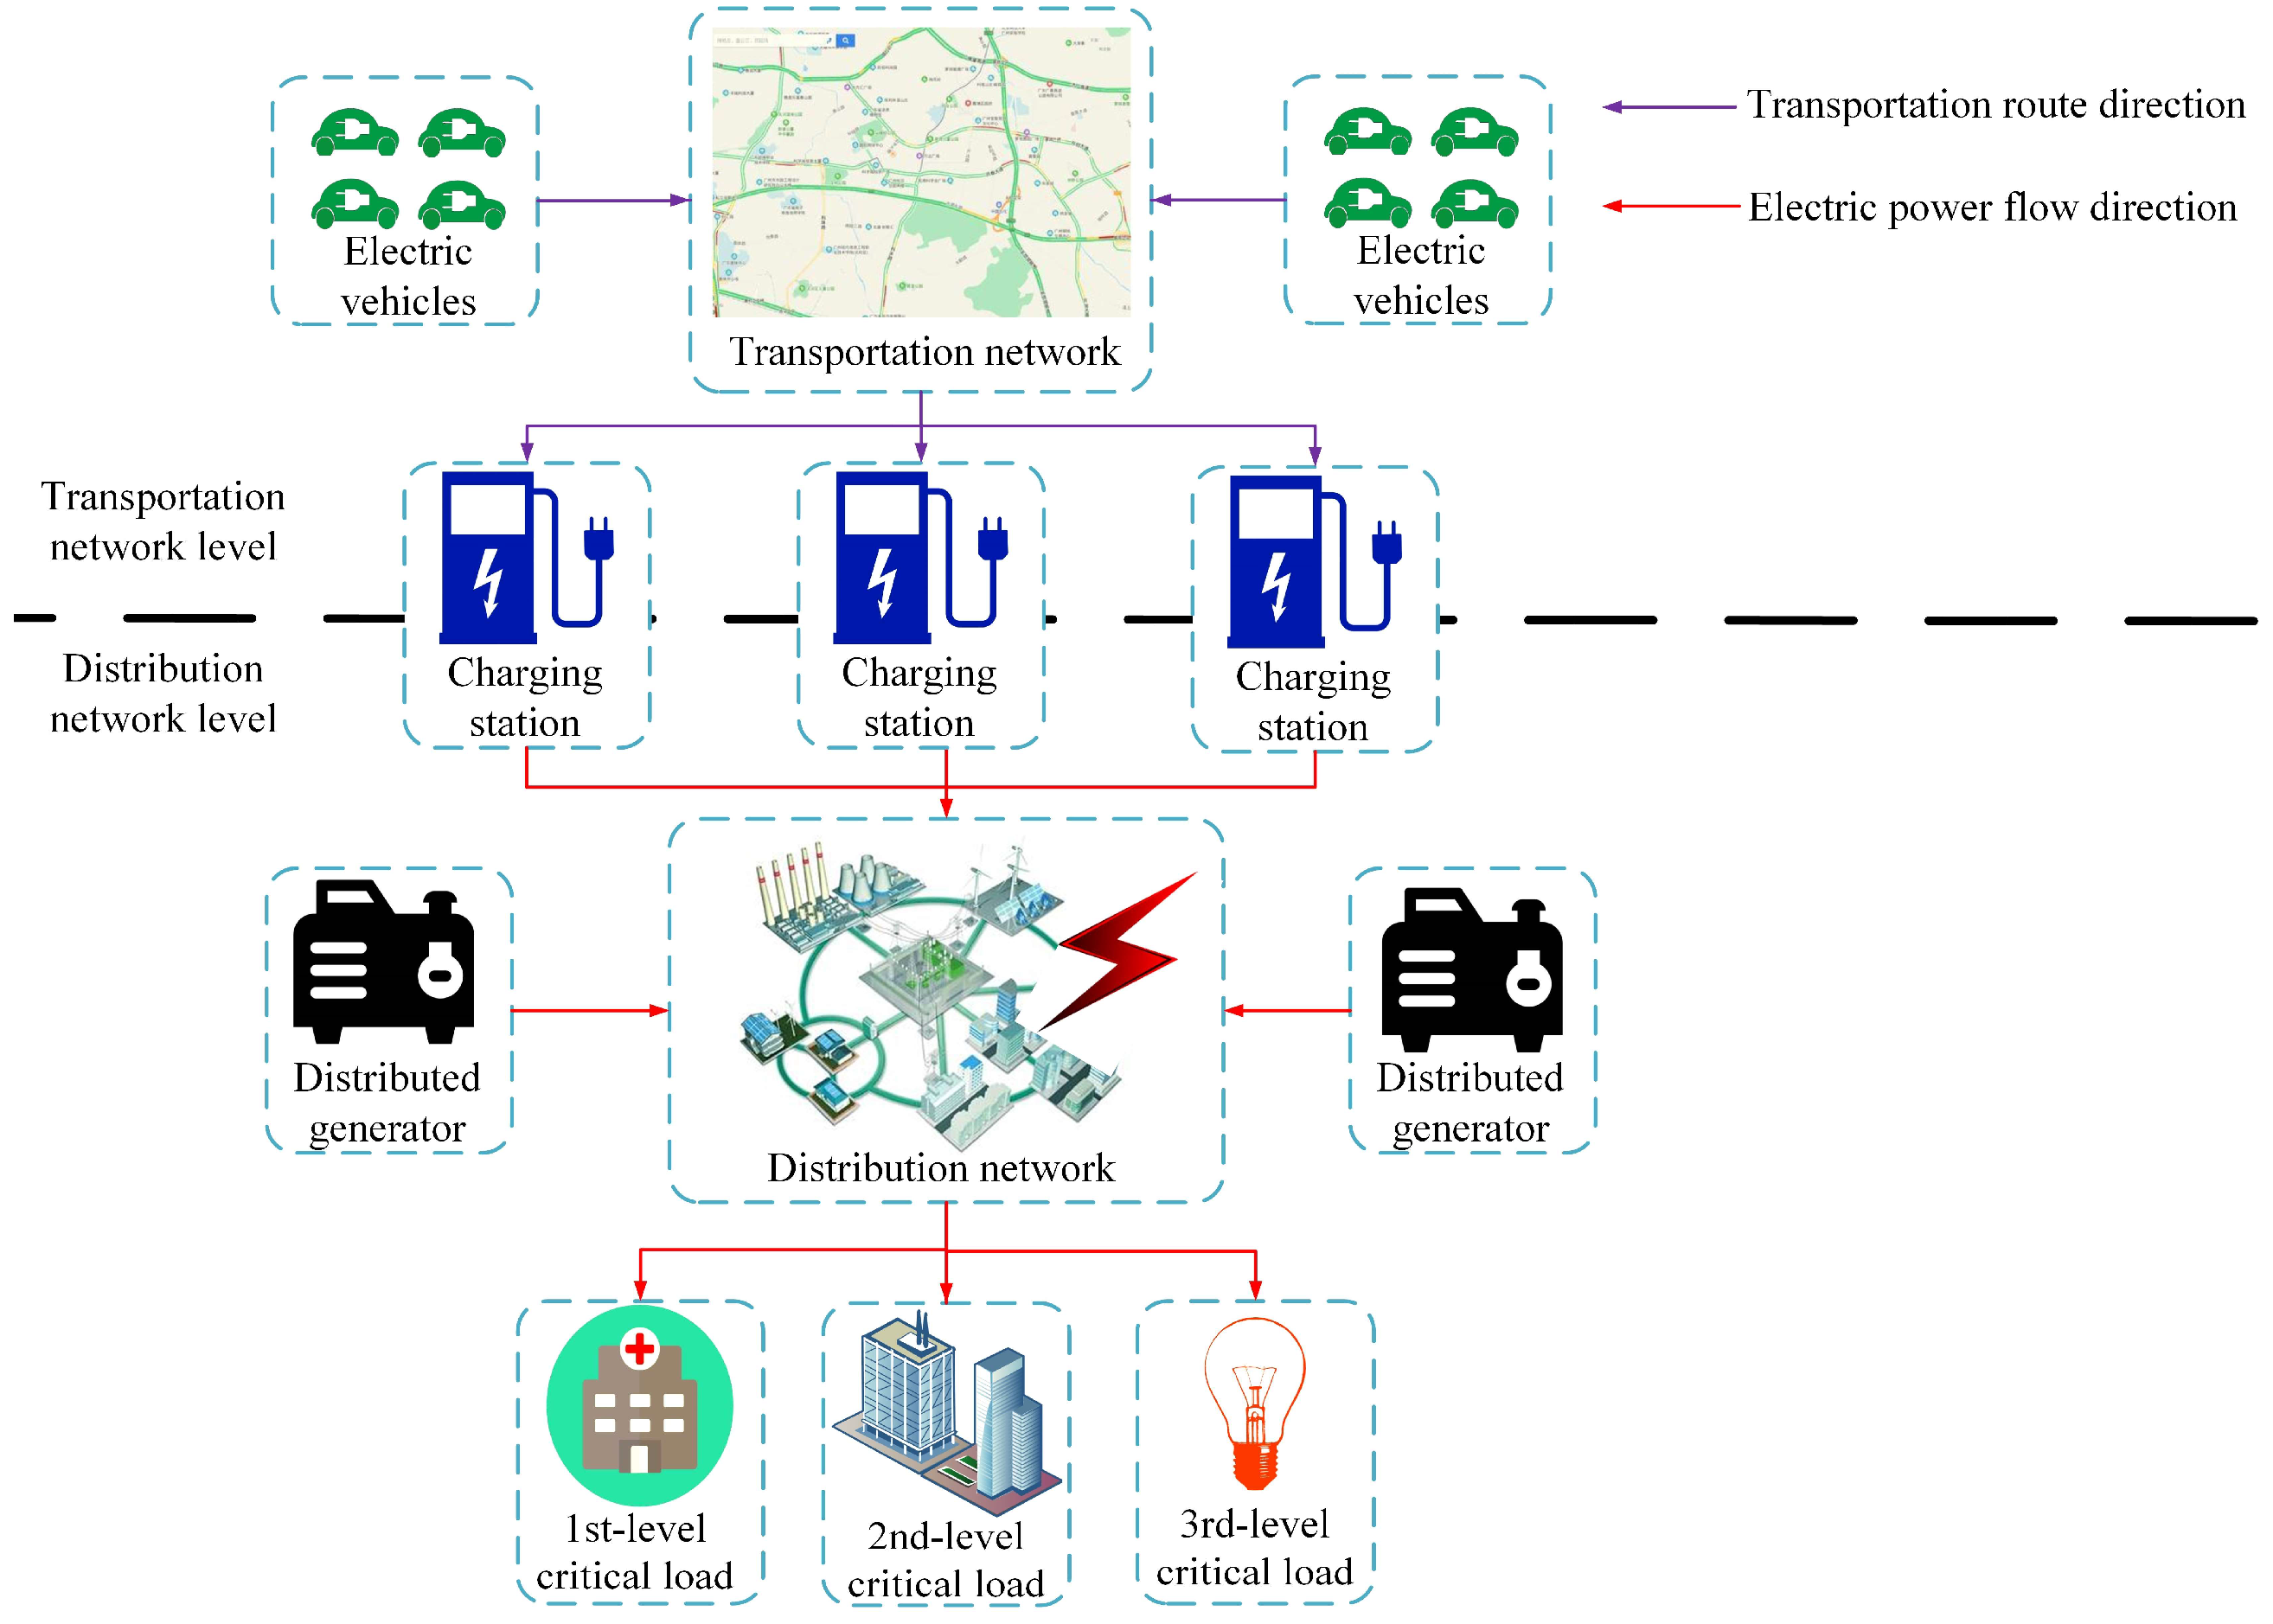
2. The Configuration

The configuration of the two-stage multi-period coordinated load restoration strategy for the distribution network based on intelligent route recommendation of EVs is shown in Figure 1. The configuration is divided into distribution network level and transportation network level. At the distribution network level, after a fault occurs, the distribution network is disconnected from the main grid. It is necessary to rely on the power supply capacity of the distributed generators in the distribution network and the EV charging stations with V2G technology to restore critical loads. To maximize the effect of load restoration, it is necessary to plan the use of the reserve energy of distributed generators. It is also necessary to make charging station assignment decisions for idle private EVs that are willing to participate in load restoration service or emergency power supply EVs to obtain the optimal power and energy configuration of charging stations. At the transportation network level, EVs depart from their respective nodes to their assigned charging stations. Taking into account the congestion of the transportation network and the travelling time of each road section, the time-shortest route is recommended for each EV, so that it can reach the charging station as soon as possible to participate in the load restoration service.

3. The Mathematical Modelling

This chapter introduces the mathematical modelling of the proposed strategy. The model established in this paper is a two-stage optimization model. The first stage is a multi-period coordinated load restoration model. The second stage is the intelligent recommendation model of the shortest duration route of EVs.

3.1. Multi-Period Coordinated Load Restoration Model

3.1.1. Objective Function

The objective function of the multi-period load restoration model consists of two parts. The main objective function is to maximize the weighted power supply time of load of the distribution network, and the secondary objective is to minimize the total network loss of the system. The two objective functions are shown as follows:
max f 1 = i L t T ω i Δ T γ i , t i L t T ω i Δ T 1 i , t
min f 2 = t T P l o s s , t
where L and T are the set of all load buses, and the set of all blackout time periods. ω i is the weight coefficient of the load i and γ i , t is the state of load i at time t which is a 0–1 variable. If γ i , t is 1, it means the load i is restored. If γ i , t is 0, it means the load i has not been restored yet. Δ T is each blackout time period. 1 i , t means the state of load i is 1 at time t. P l o s s , t is the total network loss at time t.
The above two objective functions are combined through the weight coefficient k to form an overall objective function. Since during the occurrence of a blackout, the restoration of the power supply of the critical load is the highest priority, and the total network loss of the system is not so important at the time, the weight coefficient should take a low value, where k is taken as 0.1 [24]. The overall objective function of the first stage model is as follows:
max f first = f 1 k f 2

3.1.2. Constraints

Before talking about the constraints of the multi-period coordinated load restoration model, it is necessary to introduce the branch flow model. Figure 2 is the single-line topology diagram of the branch flow model, and the specific parameters are detailed in [28]:
Vm and Vn are the voltage of the m-bus and the n-bus; Pmn and Qmn are the active power and reactive power at the m-bus side; zmn, rmn and xmn are the impedance, resistance and reactance of the branch mn; Imn is the current of the branch mn; Pin,m and Qin,m are the inject active power and reactive power of m-bus, respectively; Pin,n and Qin,n are the inject active power and reactive power of n-bus, respectively.
Then, the constraint conditions of the multi-period load restoration model mainly include the radial topology constraints of the distribution network, the operation constraints of the distribution network, the energy limit constraints of power supply sources, and the constraints of the switching number of load states.
  • The Radial Topology Constraints of the Distribution Network
After the fault occurs, some branches in the distribution network system are disconnected. Therefore, to restore as many critical loads as possible, it needs to rely on the switches in the distribution network to reconstruct the topology of the distribution network. At this time, it is necessary to ensure that the reconstructed distribution network maintains a radial topology. According to the graph theory, the radial topology constraints of the distribution network are as follows:
β i j + β j i = α i j       ( i , j ) E
j Ω ( i ) β i j = 1       i N 1
β 1 , j = 0       ( 1 , j ) E
where Ω ( i ) is the set of all buses adjacent to bus i. N1 is the set of all buses without bus 1 and E is the set of all branches. α i j is the connection state of branch(i,j) which is a 0–1 variable. α i j = 1 means the branch(i,j) is connected and α i j = 0 means the branch(i,j) is not connected. β i j and β j i are 0–1 variables which demonstrate the parent or child relationship between bus i and j. If bus i is the parent bus of bus j, β j i = 1 and β i j = 0 . If bus i is the child bus of bus j, β i j = 1 and β j i = 0 . If bus i and bus j are not connected, β i j = β j i = α i j = 0 .
Equation (4) describes the relationship between the parent-child bus variables and the connection states of branches. Equation (5) means every bus except the root bus has only a parent bus and the root bus of the distribution system in this paper is bus 1. Equation (6) means the root bus has no parent buses.
  • The Operation Constraints of the Distribution Network
The constraints of distribution network mathematical model based on branch flow model are shown below:
v i , t v j , t M ( 1 α i j , t ) + 2 ( r i j P i j , t + x i j Q i j , t ) ( r i j 2 + x i j 2 ) i i j , t       ( i , j ) E , t T
v i , t v j , t M ( 1 α i j , t ) + 2 ( r i j P i j , t + x i j Q i j , t ) ( r i j 2 + x i j 2 ) i i j , t           ( i , j ) E , t T
j : i j S i j , t = s i , t + h : h i ( S h i , t i h i , t z h i ) i N , t T
s i , t = s i , t g s i , t L γ i , t i N , t T
i i j , t v i , t = P i j , t 2 + Q i j , t 2 ( i , j ) E , t T
P l o s s , t = ( i , j ) E i i j , t r i j t T
where N is the set of all buses. vi,t is the square of the voltage magnitude of i-bus at time t. Pij,t and Qij,t are the active power and reactive power of branch(i,j) at time t. rij and xij are the resistance and reactance of branch(i,j). iij,t is the square of the current magnitude of the branch(i,j) at time t. Sij,t and si,t are the complex power of branch(i,j) and the injected complex power of bus i at time t, respectively. j:i j represents the set of all buses j which are downstream of bus i. zhi is the impedance of branch(h,i) and M is a large positive value. s i , t g and s i , t L are the complex power supplied by the power sources in bus i and the complex load demand of bus i, respectively, at time t.
Equations (7) and (8) describe the relationship between the square of voltage magnitude of two buses. Equation (9) guarantees the complex power balance of every bus. Equation (10) shows that the injected complex power of the bus equals to the power source output minus the load demand. Equation (11) is the transformation of the power definition equation and Equation (12) is the calculation formula of the network loss.
Since Equation (11) is a nonconvex and nonlinear constraint which is difficult to guarantee the global optimal solution, the SOCR method is introduced to transform the constraint into:
2 P i j , t 2 Q i j , t i i j , t v i , t 2 i i j , t + v i , t
The schematic diagram of SOCR is shown in Figure 3. Coriginal is the feasible region of the non-convex constraint before transformation, which is Equation (11). CSOC is the convex feasible region after relaxation, which is Equation (13). If the relaxation process is accurate, Equation (11) is equivalent to Equation (13). The specific proof process is shown in paper [29] and the error analysis of SOCR is shown in Section 4.1.
A feasible load restoration strategy needs to ensure that the system is in a safe and stable status during the restoration process. The safe operation constraints that need to be considered are as follows:
0 i i j , t ( I i j , max ) 2 α i j , t ( i , j ) E , t T
( V i , min ) 2 v i ( V i , max ) 2 i N , t T
M α i j , t ( 1 + j ) S i j , t M α i j , t ( 1 + j )       ( i , j ) E , t T
0 s i , t g P i , max g + j Q i , max g i G , t T
P cha max N u m i P i , t g P dis max N u m i i C S , t T
where Iij,max is the allowed maximum current of branch(i,j). Vi,max and Vi,min are the allowed maximum and minimum voltage of bus i. G and CS are the sets of buses, which have distributed generators and EV charging stations, respectively. P i , max g and Q i , max g are the maximum active power and maximum reactive power which could be supplied by the distributed generators in bus i, respectively. Pdismax and Pchamax are the maximum discharging and charging power of each EV. Numi is the number of EVs in the charging station in bus i.
Equations (14) and (15) guarantee that the branch currents and bus voltages are limited within the allowed range. Equation (16) describes that if branch(i,j) is not connected, the complex power of the branch is zero. Equations (17) and (18) show the upper limit and lower limit of the output of distributed generators and charging stations, respectively.
  • The Energy Limit Constraints of Power Supply Sources
t T P i , t g Δ T E i , total i G
t = 1 t P i , t g Δ T E car Δ S O C N u m i i C S , t T
where Ei,total is the total energy of the distributed generator in bus i. Ecar is the total battery capacity of each EV. Δ SOC is the interval length of state of charge (SOC), which could be used to restore the critical load and it is 0.6 (0.8–0.2) in this paper.
The distributed generators used to restore critical loads are mostly diesel generators or gas turbines with stable output, and their available energy is limited by reserved diesel or gas. Equation (19) guarantees the total output of distributed generators does not exceed the energy which could be supplied by the stored diesel oil or gas. After the EVs arrive at the charging stations and supply power to the distribution network, it is necessary to ensure that enough electric energy is reserved for the EVs to leave the charging stations and reach the destination. In the first stage of the model, assuming that the SOC of the EVs when reaching the charging stations is 0.8, Equation (20) ensures that the output of the charging stations during the blackout will not decrease the SOC of any EV to less than 0.2, to ensure the electric energy for the return travels of EVs.
  • The Constraints of the Switching Number of Load States
In order to ensure the users’ electric power consumption experience, this paper assumes that after the load of a certain bus is restored, it will not be cut off until the blackout is over.
t T 1 | γ i , t γ i , t 1 | 1 i L
where L is the set of the load buses and T1 is the set of time period except the first time period.

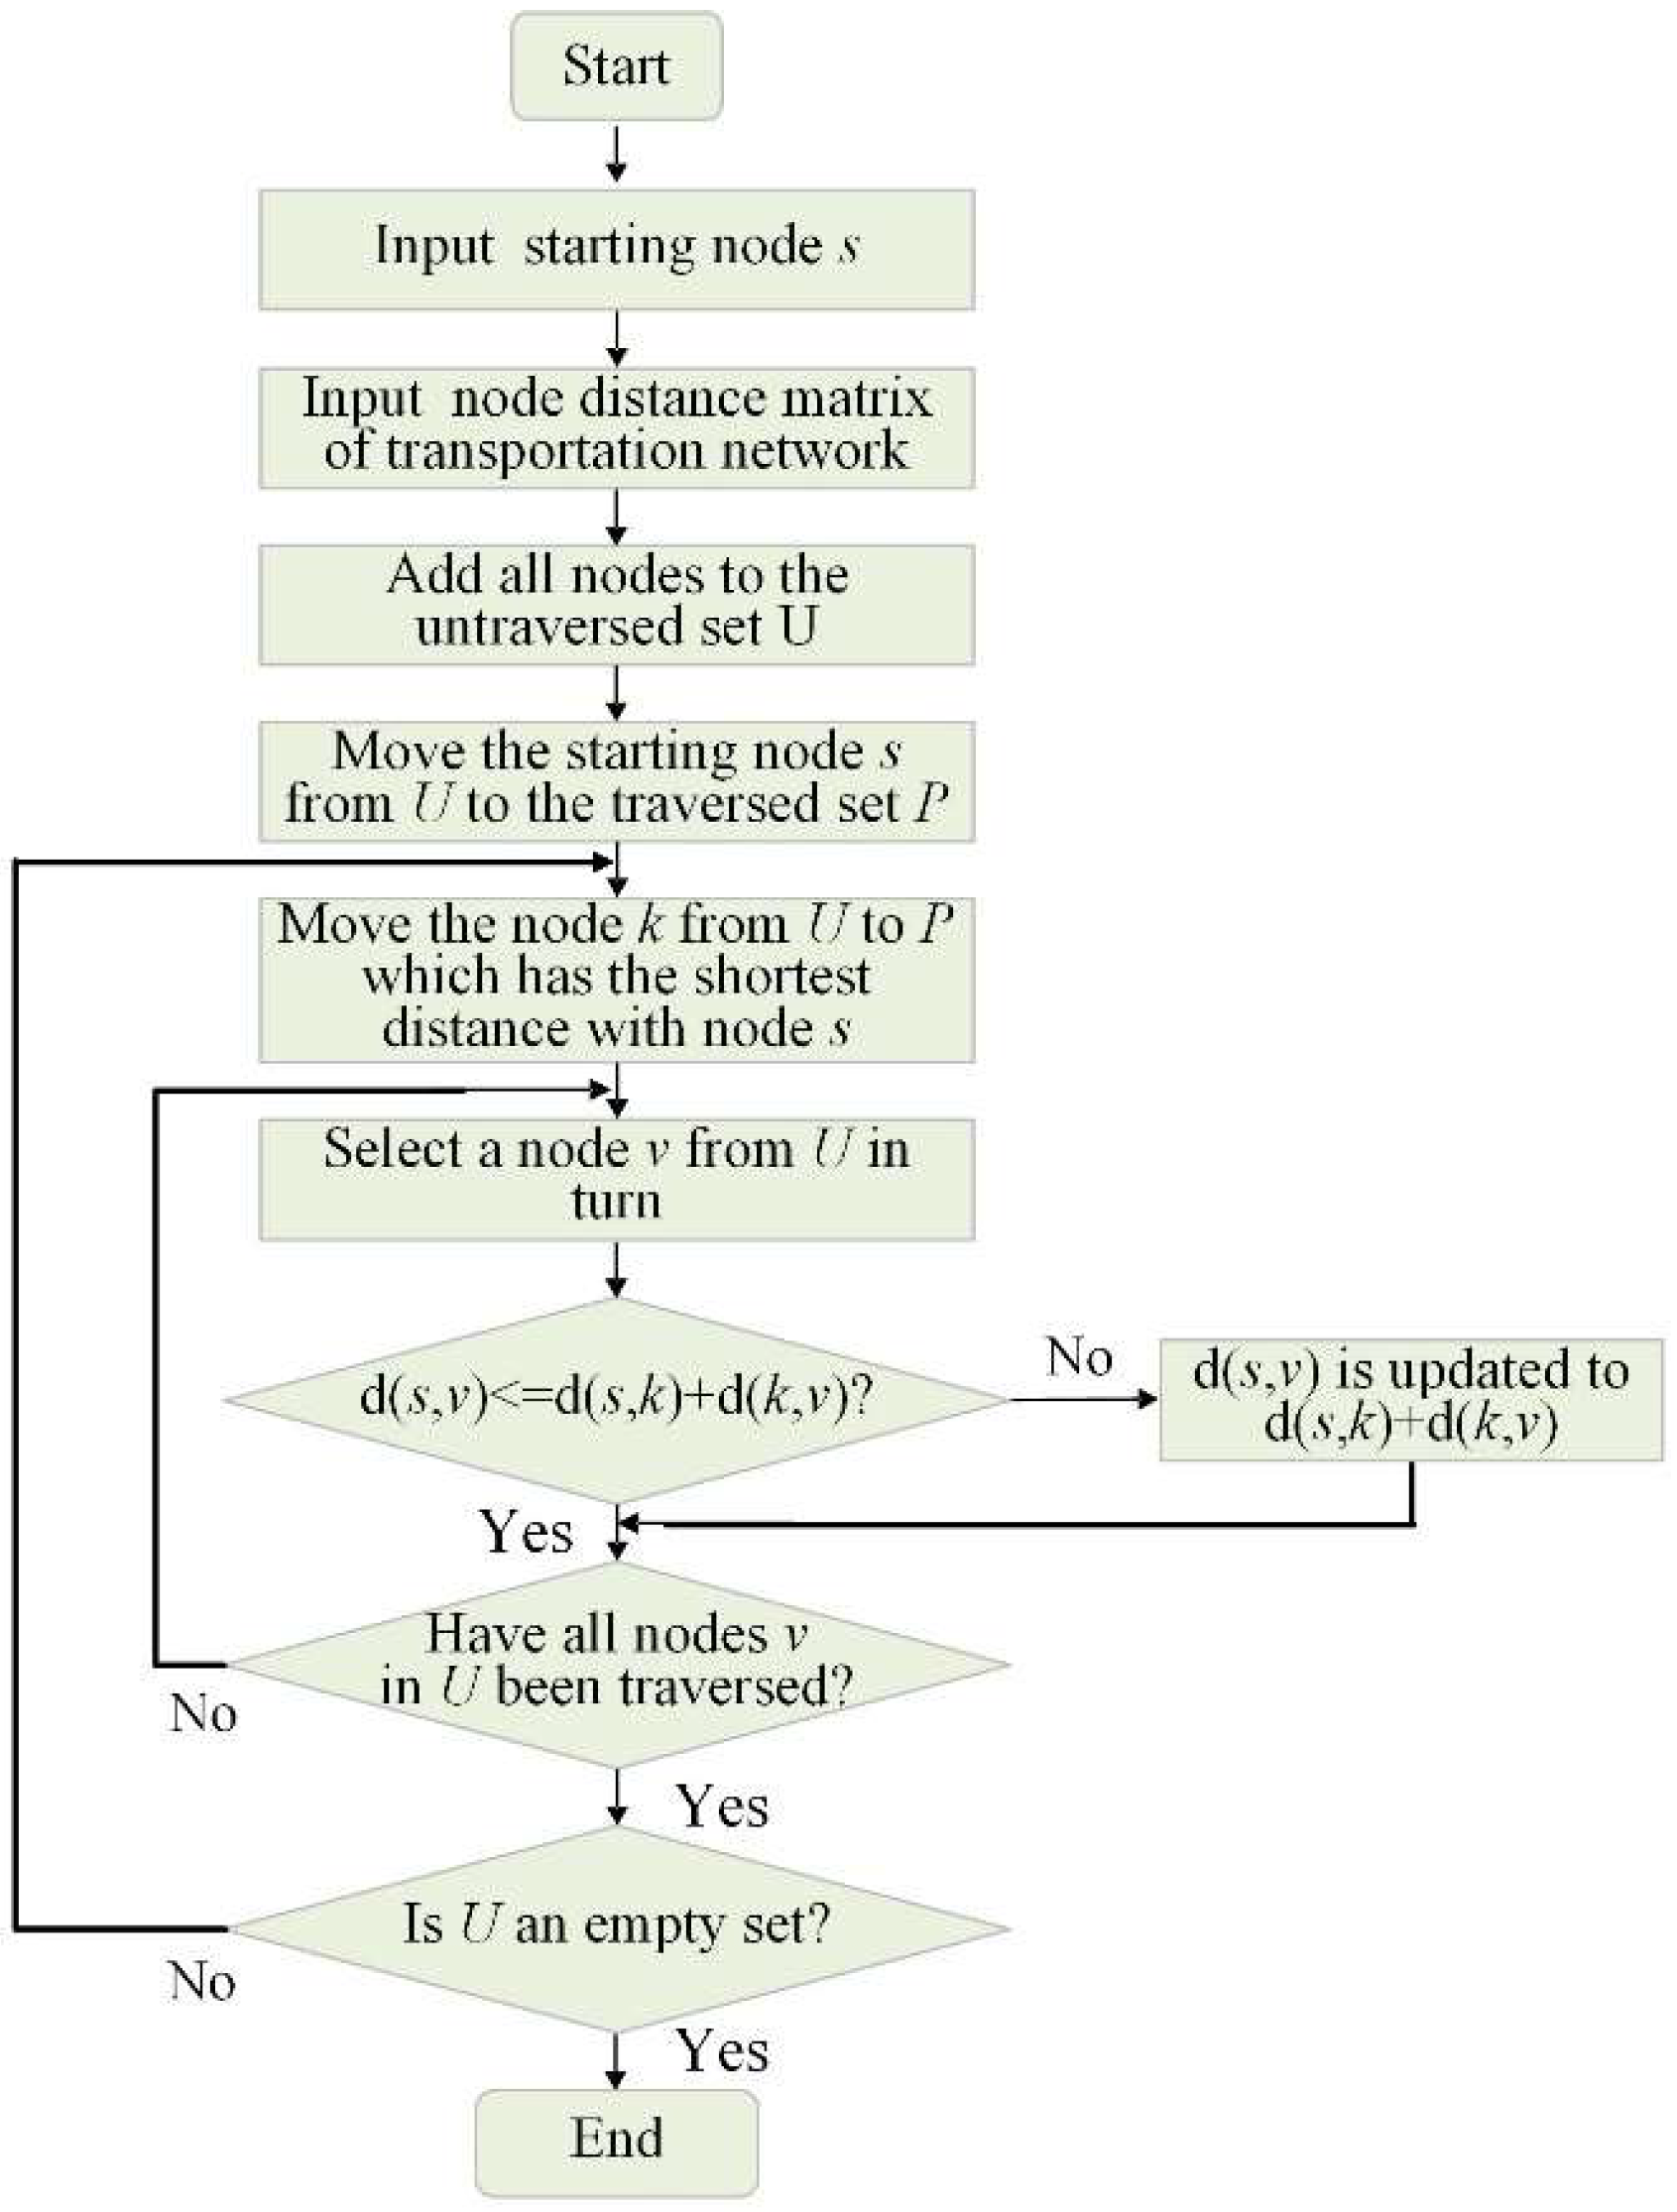
3.2. The Intelligent Recommendation Model of The Shortest Duration Route of EVs

After a large-scale blackout occurs, it is vital to restore the power supply of critical loads as soon as possible. In this situation, intelligently recommending the routes for EVs to reach the designated charging stations for V2G service will improve the efficiency for the critical load to resume power supply to a certain extent. The starting position of each EV participating in the load restoration service is known, and the optimal power and energy assignment is solved by the multi-period load restoration model in the first stage. In the second stage of the model, under the premise of guaranteeing the power and energy needs of each charging station, the route recommendation model specifies the destination charging station and plans an optimal route intelligently for every EV to minimize the sum of the time for all EVs to reach the designated charging stations. The objective function of the second stage model is as follows:
min f second = v = 1 V T v , route
s . t .   f first * = max ( f 1 k f 2 )
where Tv,route is the driving time for the v-t EV to reach the designated charging station and V is the total number of EVs. f first * is the optimal value of the objective function in the first stage model.
In this paper, the Dijkstra algorithm is introduced to calculate the shortest route from the starting node of EVs to the destination charging station. Dijkstra algorithm is the shortest path algorithm from one vertex to the other vertices, and it solves the shortest path problem in the weighted graph [30]. The main feature of the Dijkstra algorithm is to gradually expand to the outer layers (breadth-first search idea) centered on the starting node until it expands to the end. The success rate of the Dijkstra algorithm is the highest because it is able to find the optimal path every time, but the search speed is the slowest. The application scene of this paper is not real-time calculation, and the optimal path is only calculated once. Therefore, the calculation speed is much less important than the success rate and that is why to use the Dijkstra algorithm. The flowchart of the Dijkstra algorithm is shown in Figure 4.
Step 1: Initially, the traversed set p only contains the starting node s and the untraversed set U contains other nodes except s. d( , ) means the distance between two nodes. If the two nodes are not adjacent, the distance is .
Step 2: Select the node k from U which has the shortest distance with s, add node k to the p and remove node k from U.
Step 3: Update the distance between each node v in U and s. If d(s,v) is greater than d(s,k) plus d(k,v), d(s,v) is updated to d(s,k) plus d(k,v). Otherwise, no need to update.
Step 4: Repeat Step 2 and Step 3 until the U becomes an empty set, which means that all nodes have been traversed.

4. Case Study

In this paper, the IEEE 33-bus standard distribution network test system shown in Figure 5 is coupled with the 21-node transportation network system shown in Figure 6. The node coupling relationship between the two networks is shown in Table 1. In Figure 5, bus 1 is a distributed diesel generator and its reserve diesel can provide a total of 1500 kWh of electric energy, whose maximum output is 1 MW. Bus 9, 18 and 5 are EV charging stations CS1, CS2, and CS3, respectively. ①~⑤ are 5 switch branches. The congestion characteristics of the transportation network are taken into account in Figure 6. The closer the road section is to the center, the more congested it is, and the longer the required transit time. The different colors of road sections represent different transit times. The transportation network nodes 1, 3, 5, 8, 9, 11, 13, 16, 17, 18, each of which has 10 EVs willing to participate in the load restoration services. The maximum charging and discharging power of EV is 9.5 kW, and the total battery capacity of EV is 60 kWh [31]. This paper does not include the limitation of the number of charging piles in the charging stations, but the maximum charging and discharging power of the charging stations are limit by its EV number at the time. Assuming that after a fault occurs, the distribution network cannot obtain power from the transformer substation, and the branch(13, 14) and branch(27, 28) are also disconnected due to the fault. Assuming that after evaluating the disaster type, influenced area and the restoration process of the main power grid, the main power grid can restore the power supply for the distribution network in about 3.5 h. This means the blackout lasts for 3.5 h, which is divided into 7 time periods, each time period for 30 min.
Strategy 1: EVs in each transportation node go directly to the charging stations that can be reached in the shortest time to participate in the load restoration service based on a single-time section decision. It restores as much as possible loads in every time period without considering the preservation and reasonable planning of limited energy. Strategy 1 regards the weighted number of restored load as an objective function and makes decisions in every time period independently. Since each decision only considers a single-time section, this strategy does not consider the constraints of the switching number of load states. Strategy 2: EVs in each transportation node go directly to the charging stations that can be reached in the shortest time to participate in the multi-period coordinated decision-making load restoration service. Because the power and energy assignment of EV charging stations are determined by the starting nodes of EVs, the charging stations cannot obtain the optimal power and energy assignment in Strategy 2. Strategy 3: The proposed two-stage multi-period coordinated load restoration strategy is used to make dispatching decisions and recommend routes for EVs, and then perform multi-period coordinated load restoration. The specific differences of the three strategies are shown in Table 2.

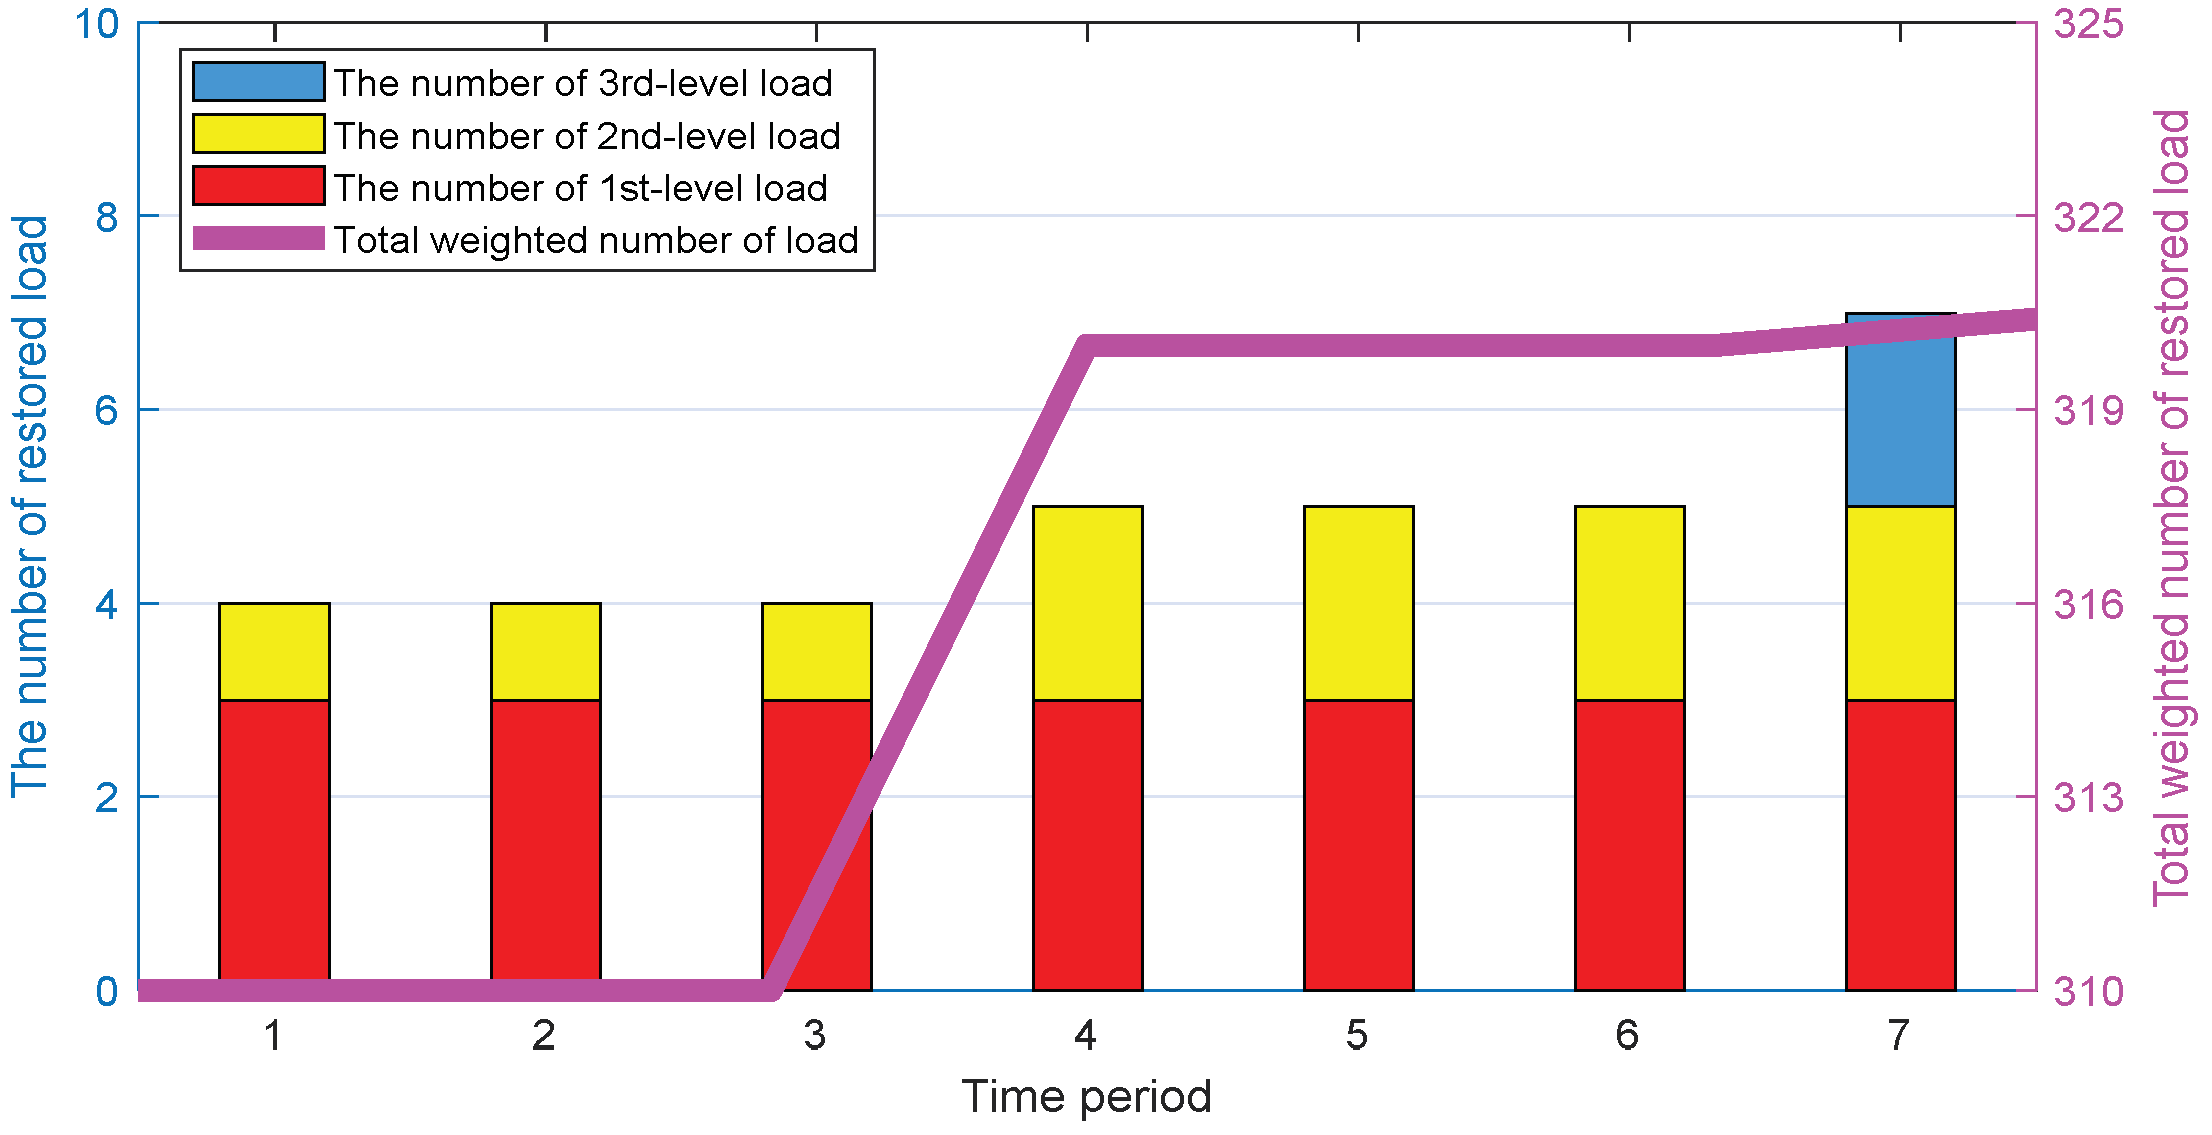
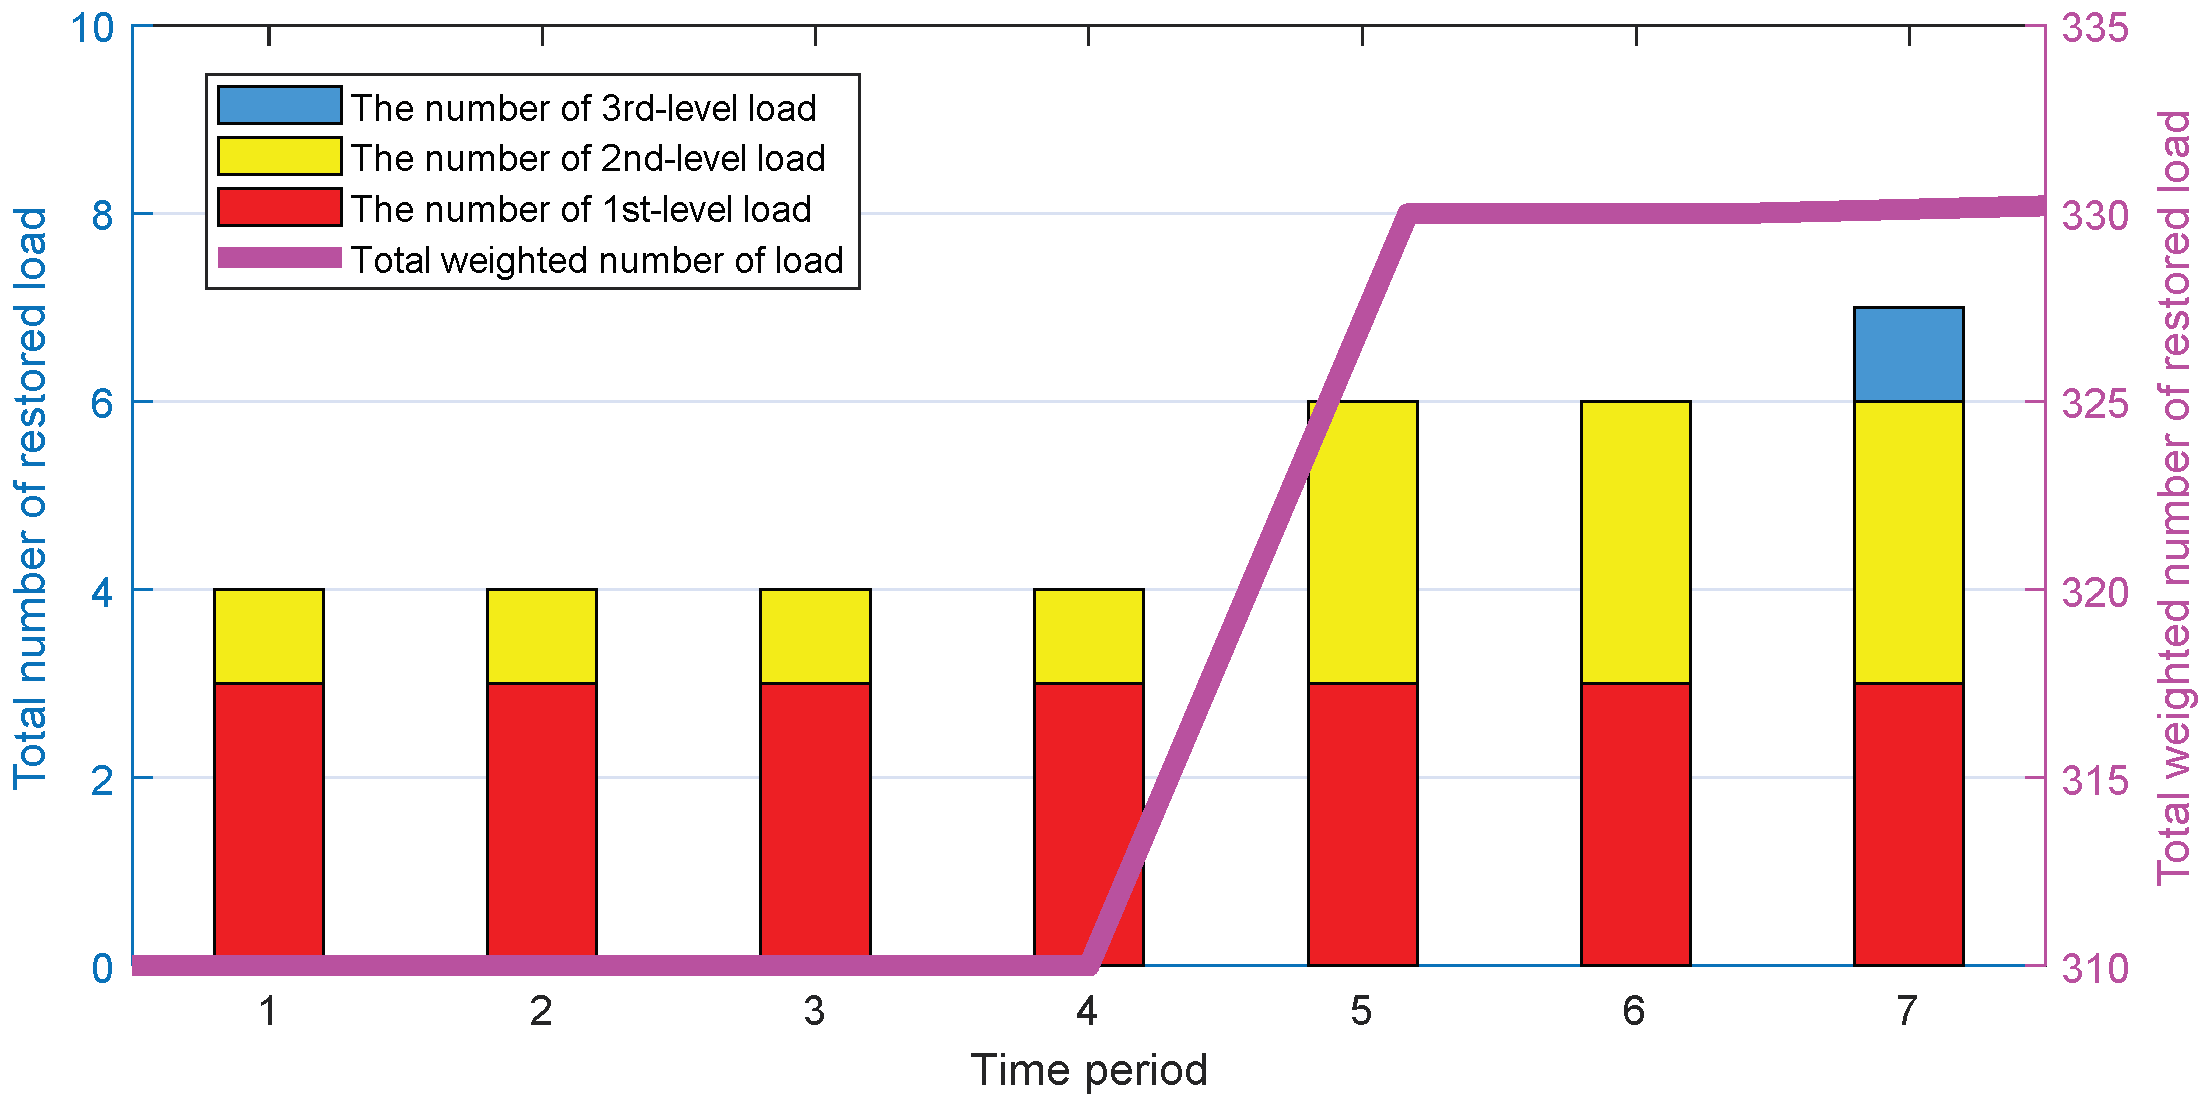
4.1. Analysis of Critical Load Restoration

After the fault occurs, all three strategies mentioned above involve connecting the switches ② and ④. Figure 7, Figure 8 and Figure 9 are the load restoration situations through the three strategies, where the weight coefficient of the 1st-level load is 100, the weight coefficient of the 2nd-level load is 10, and the weight coefficient of the 3rd-level load is 0.2 [9]. As shown in the figures, since Strategy 1 is based on single-time section decision-making, all loads are restored in the first few time periods. However, due to the limitation of energy, the number of 2nd-level loads and 3rd-level loads, which can be supplied, drop at the 4th time period, and the 5th, 6th, 7th time periods can no longer supply any loads. Therefore, all the loads are cut off again. In Strategy 2, due to the adoption of a multi-period coordinated load restoration strategy, a full-period optimization decision is made on the available energy of each power supply source. As a result, all 1st-level loads and some 2nd-level loads can obtain a full-time power supply. A small number of 2nd-level loads and 3rd-level loads can only be restored in the last few time periods. However, the charging station to which each EV goes has not been optimized, making the output power and energy capacity configuration in each charging station not optimal. Strategy 3 is the strategy proposed in this paper. Strategy 3 not only makes the output power and energy capacity configuration of each charging station more reasonable through the dispatching of EVs, but also makes the energy of each power supply source reasonably allocated to each time period, through a multi-period coordinated load restoration strategy. Thus, more 2nd-level loads are restored during the whole time period compared to Strategy 2. Table 3 shows the output of each power supply source in each time period in the three strategies.
Table 4 shows the comparison of the effects of the three strategies. As shown in the table, Strategy 1 has the highest network loss and the lowest total weighted number of restored load in all time periods. Strategy 3 has the lowest network loss and the highest total weighted number of restored loads in all time periods. The effect of Strategy 2 is somewhere between them. Therefore, Strategy 3 has the best effect on critical load restoration, and the effectiveness and superiority of the strategy proposed in this paper are verified.
Table 5 is the comparison of the voltage quality of the three strategies. As shown in the table, Strategy 3 has the highest minimum voltage magnitude, the highest average voltage and the lowest standard deviation of voltage. Therefore, the voltage quality of Strategy 3 is the best among the three strategies, further verifying the superiority of the proposed strategy.
In order to verify the accuracy of the model constructed, it is necessary to analyze the error of SOCR as mentioned in Section 3.1.2. The error index is introduced as Δ d i f f = P m n 2 + Q m n 2 l m n v m . As shown in Figure 10, the error of each branch caused by SOCR transformation in Strategy 3 is below 10−6, which meets the application needs of practical engineering, verifies the accuracy of the model constructed and confirms the reliability of the simulation results in this paper.

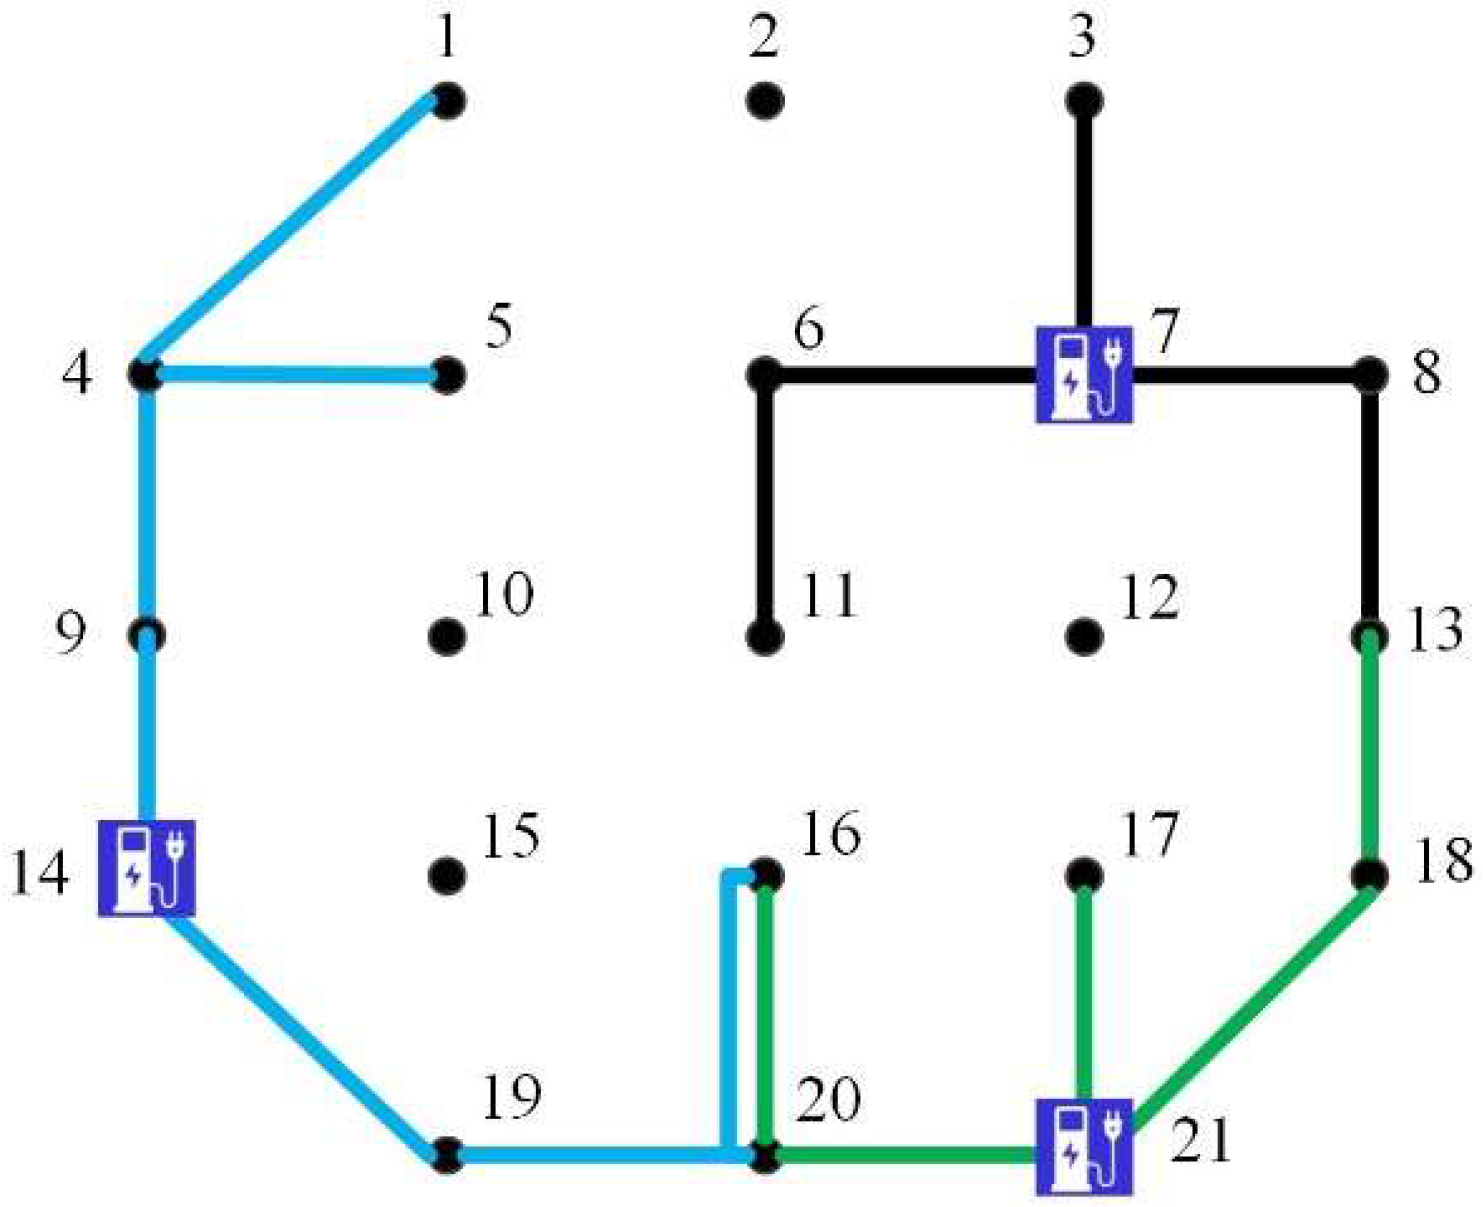
4.2. Analysis of Optimal Route Recommendation of EVs

Table 6 shows the number of EVs that go to 7-node, 14-node and 21-node charging stations, respectively, in each node with EVs. Figure 11 shows the optimal route of every EV. The black routes are the optimal routes from each EV node to the 7-node charging station. The blue routes are the optimal routes from each EV node to the 14-node charging station. The green routes are the optimal routes from each EV node to the 21-node charging station. It can be seen from Figure 11 that the recommended routes avoid the congested road sections in the center as much as possible, which eases the traffic pressure during the blackout and ensures that the EVs could rush to the charging stations in the shortest time to participate in the critical load restoration service.

5. Conclusions

This paper proposes a strategy to utilize the energy of idle EVs to assist the power outage distribution network to restore the power supply of critical loads and realizes the optimal assignment of EV energy in space and time. In order to give full play to the geographic flexibility of EVs, this strategy not only optimally allocates limited EV resources to each charging station, but also conducts route recommendations for EVs to further enhance the restoration effect of this strategy. The proposed strategy is analyzed and compared with two single-stage strategies. The weighted power supply time of loads, total network loss and voltage quality in the three strategies are specifically compared to verify the effectiveness and superiority of the strategy proposed in this paper. According to the comparison and analysis, the following conclusions can be drawn:
  • Idle EVs are a large number of usable power generation resources, and reasonable use of these resources during a blackout is very significant. This paper realizes the optimal space assignment of EV power supply resources and verifies that it is helpful to the load restoration of the distribution network.
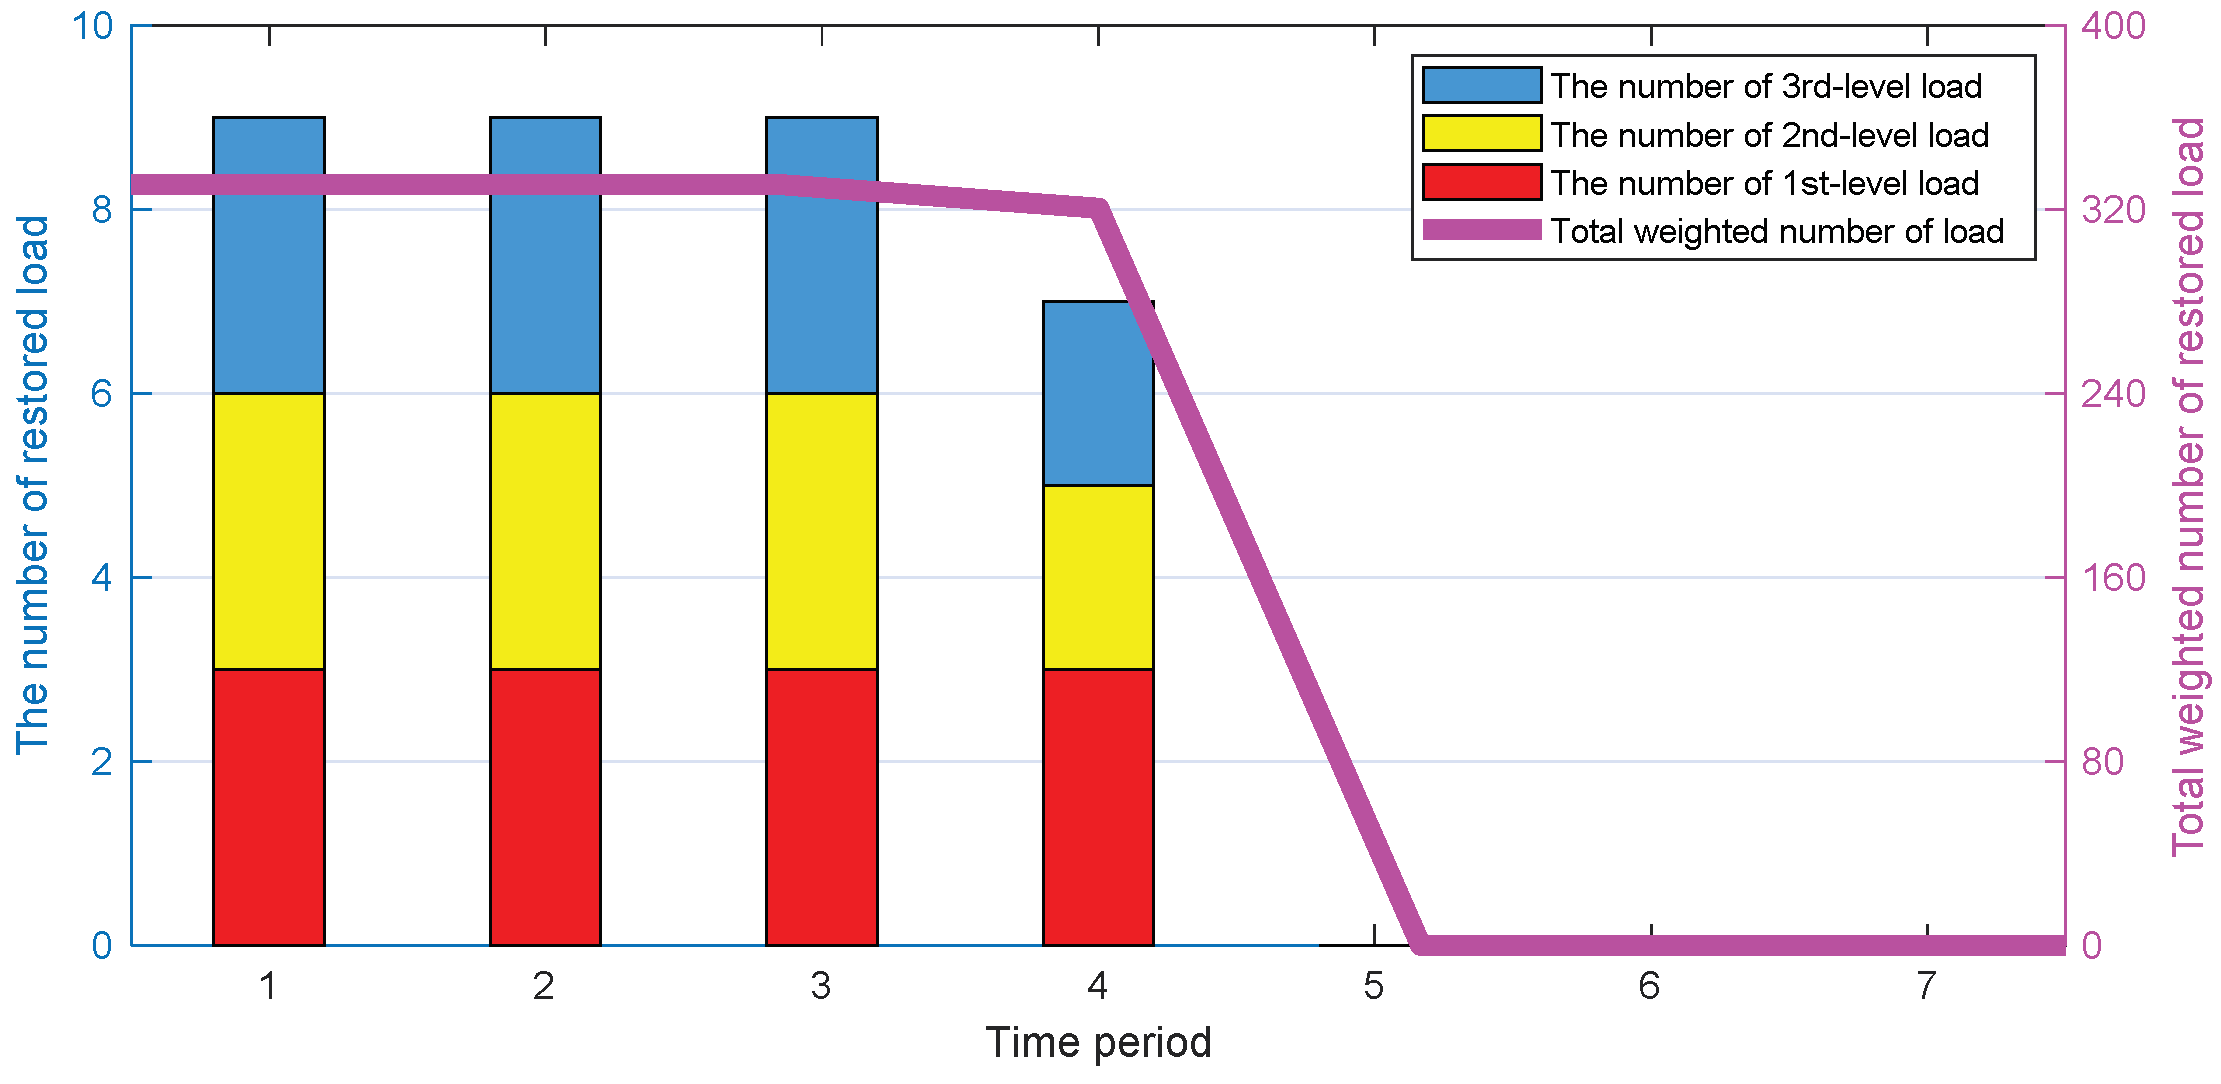
  • By comparing the multi-period coordinated load restoration strategy and the single-time section load restoration strategy, this paper verifies that the multi-period coordinated load restoration model used in the proposed strategy can better allocate the limited energy on time scale to extend the weighted power supply time of the critical loads.
  • The strategy proposed in this paper is more advantageous than the other two strategies in reducing the total network loss of the system, increasing the minimum voltage magnitude, increasing average voltage, and reducing the standard deviation of voltage, which indicates the proposed strategy also has a good effect in improving the economy and safety of the distribution network during load restoration.
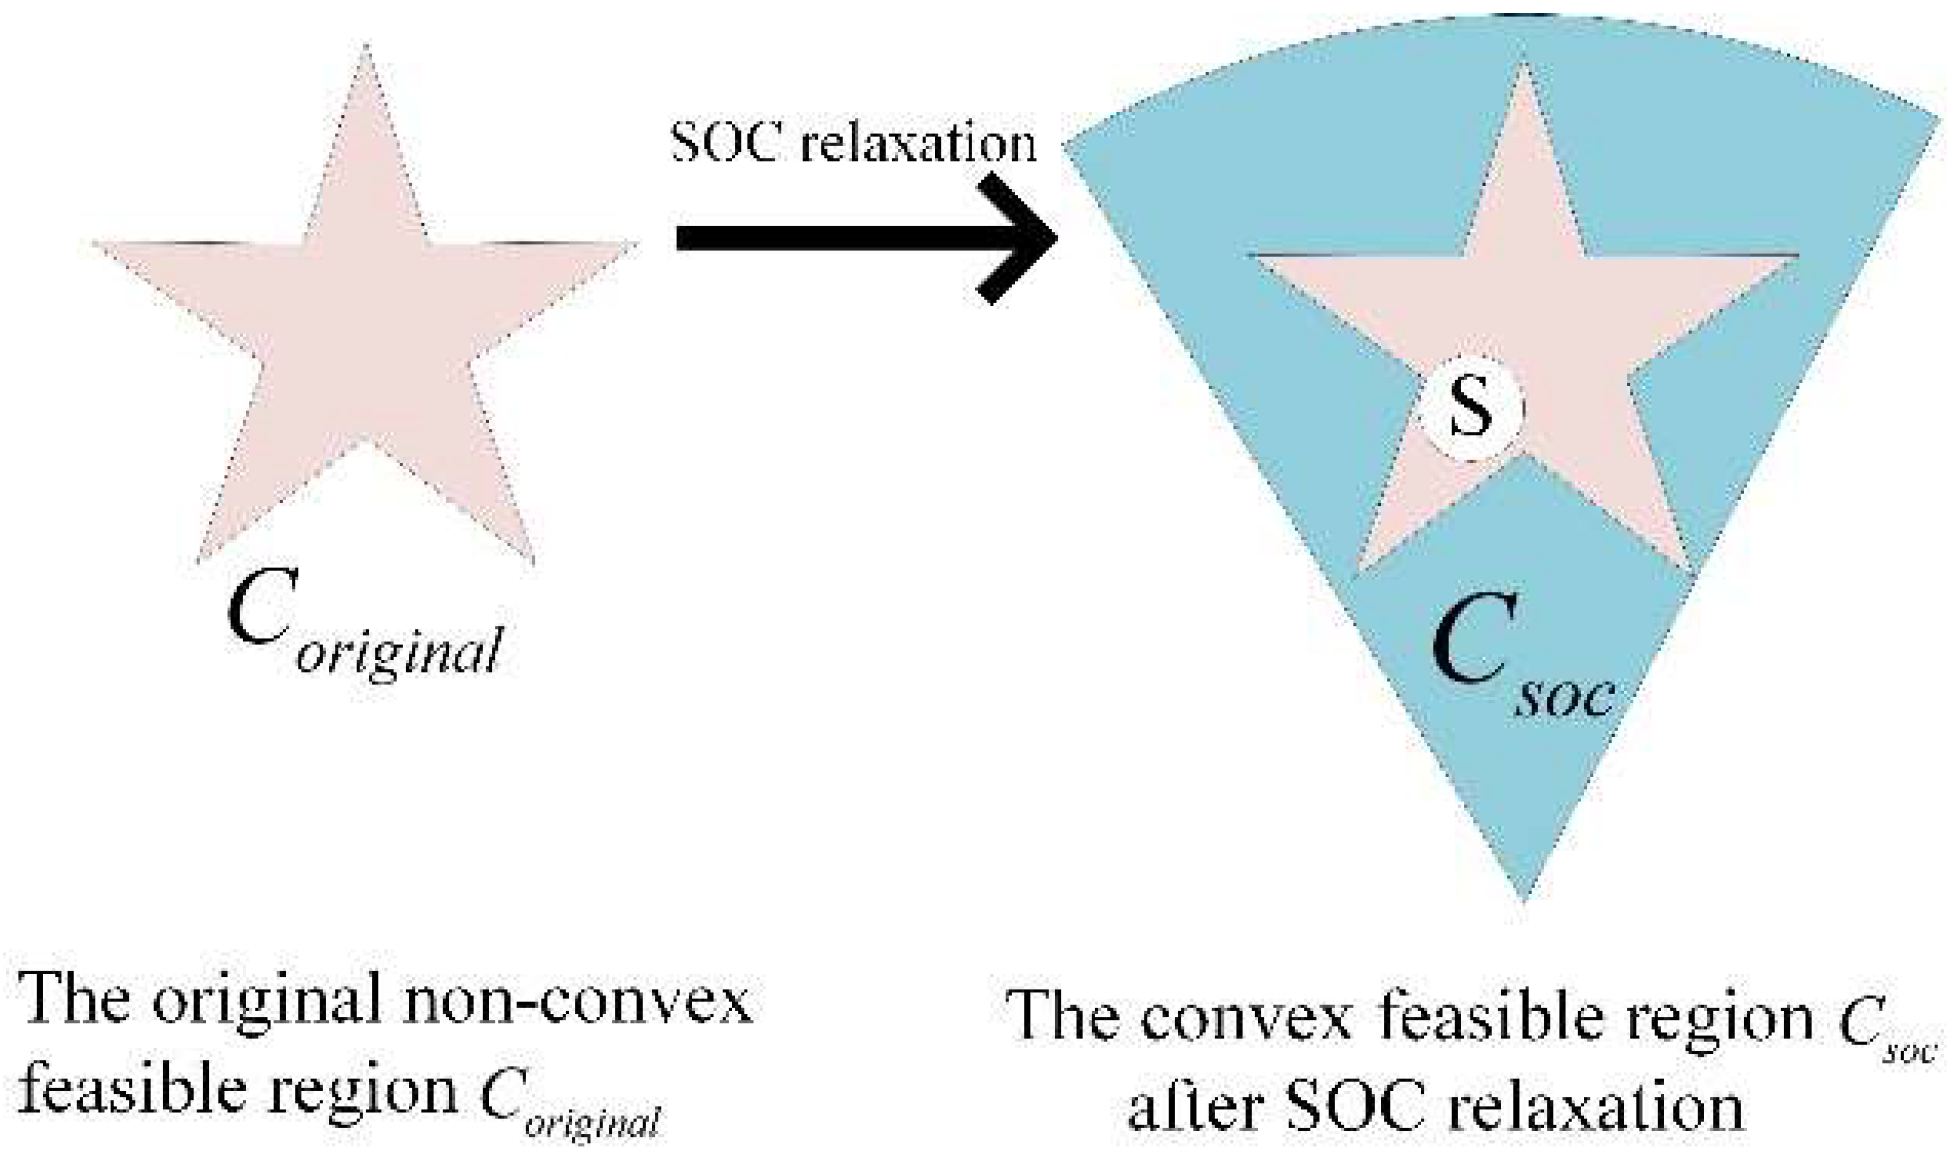
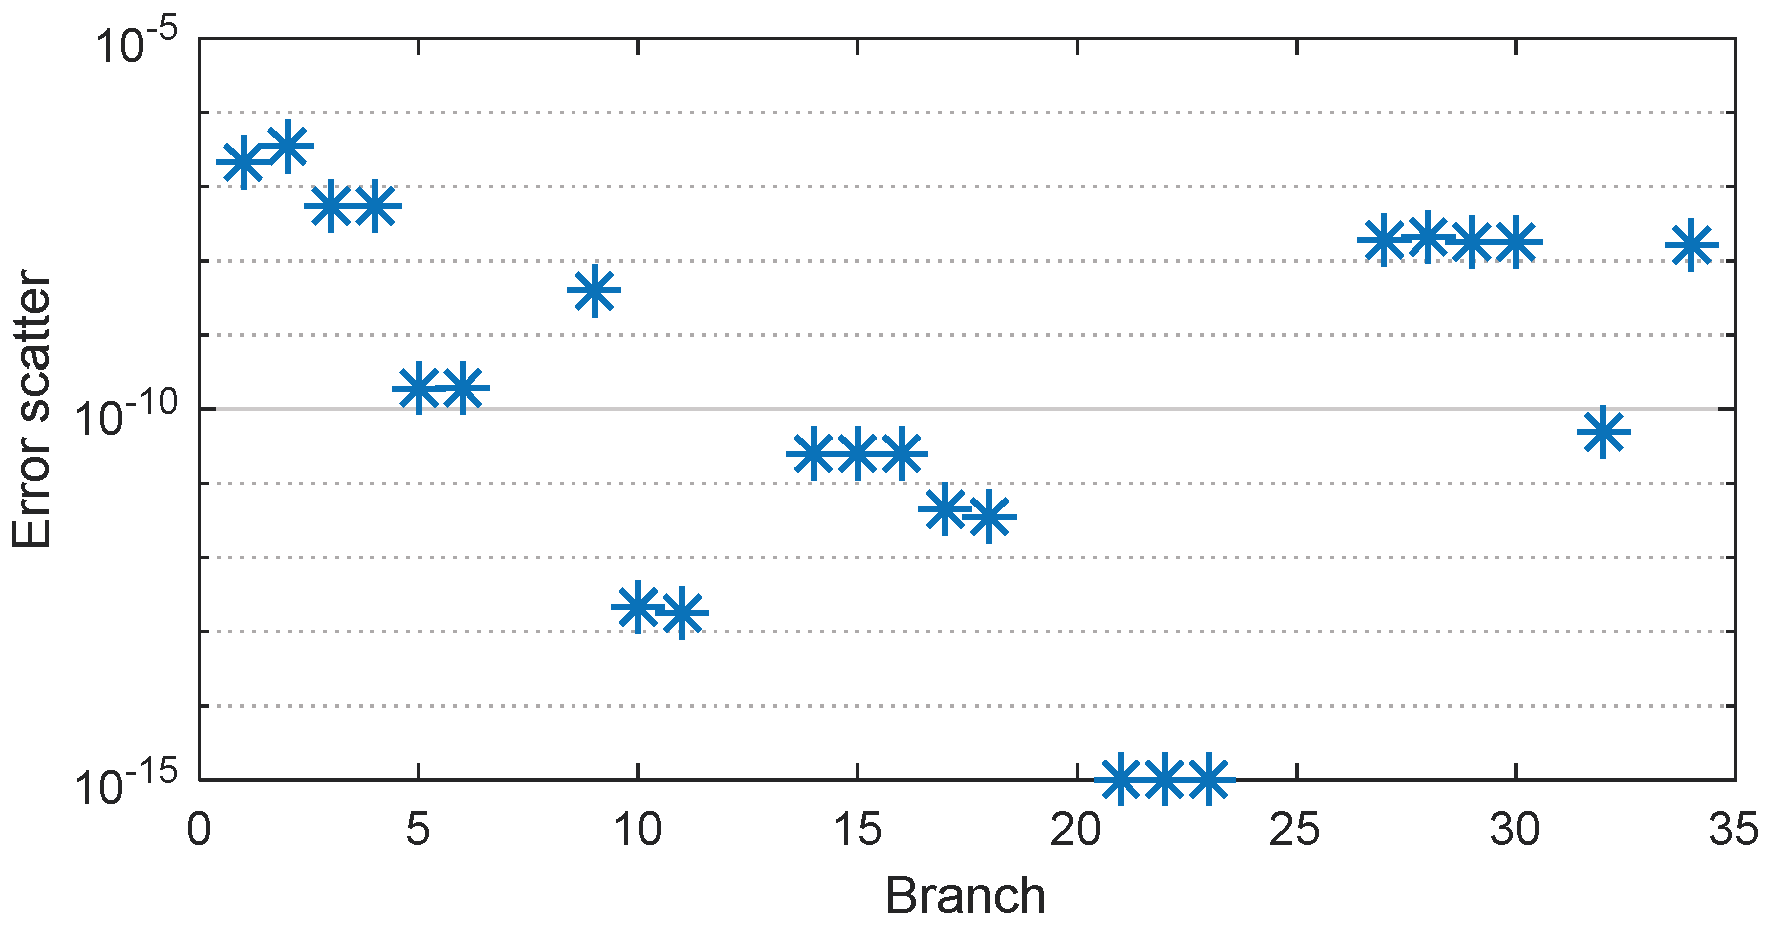
  • Based on the error analysis of the model after SOCR, it can be seen that the error index can meet the application requirements of actual engineering, which further verifies the accuracy of the proposed strategy.

Author Contributions

Conceptualization, S.S., C.W. and Z.L.; Formal analysis, C.W. and Z.L.; Investigation, D.X.; Methodology, S.S. and C.W.; Supervision, S.S.; Validation, S.S., C.W. and Z.L.; Writing—review and editing, S.S. and C.W. All authors have read and agreed to the published version of the manuscript.

Funding

This research was funded by the National Natural Science Foundation of China (51677004).

Data Availability Statement

The datasets used and/or analyzed during the current study are available from the corresponding author on request.

Acknowledgments

We want to thank national active distribution network technology research center of Beijing Jiaotong University for the support in the completion of the project. We also want to thank MDPI publisher.

Conflicts of Interest

The authors declare no conflict of interest. Dong Xia is employee of State Grid Tianjin Electric Power Company Economic and Technology Research Institute. The paper reflects the views of the scientists, and not the company.

References

  1. Kebede, F.S.; Olivier, J.; Bourguet, S.; Machmoum, M. Reliability Evaluation of Renewable Power Systems through Distribution Network Power Outage Modelling. Energies 2021, 14, 3225. [Google Scholar] [CrossRef]
  2. Gao, H.; Chen, Y.; Huang, S.; Xu, Y. Distribution Systems Resilience: An Overview of Research Progress. Autom. Electr. Power Syst. 2015, 39, 1–8. [Google Scholar]
  3. Zhang, Z. The Evaluation of Great Blackout Social Integrated Loss of Power Network Planning; North China Electric Power University: Beijing, China, 2017. [Google Scholar]
  4. Huang, W.; Zhang, X.; Zheng, W. Resilient power network structure for stable operation of energy systems: A transfer learning approach. Appl. Energy 2021, 296, 117065. [Google Scholar] [CrossRef]
  5. Cieslik, W.; Szwajca, F.; Golimowski, W.; Experimental, A.B. Analysis of Residential Photovoltaic (PV) and Electric Vehicle (EV) Systems in Terms of Annual Energy Utilization. Energies 2021, 14, 1085. [Google Scholar] [CrossRef]
  6. Irfan, M.M.; Rangarajan, S.S.; Collins, E.R.; Senjyu, T. Enhancing the Power Quality of the Grid Interactive Solar Photovoltaic-Electric Vehicle System. World Electr. Veh. J. 2021, 12, 98. [Google Scholar] [CrossRef]
  7. Yong, C.; Li, Y.; Zeng, Z.; Zhang, Z.; Zhang, Z.; Liu, Y. Coordinated active and reactive power optimization considering load characteristics for active distribution network. Chin. J. Electr. Eng. 2020, 6, 97–105. [Google Scholar] [CrossRef]
  8. Chen, H.; Li, Z.; Jin, X.; Jiang, T.; Li, X.; Mu, Y. Modeling and optimization of active distribution network with integrated smart buildings. Proc. CSEE 2018, 38, 6550–6562. [Google Scholar]
  9. Agrawal, P.; Kanwar, N.; Gupta, N.; Niazi, K.R.; Swarnkar, A. Resiliency in active distribution systems via network reconfiguration. Sustain. Energy Grids Netw. 2021, 26, 100434. [Google Scholar] [CrossRef]
  10. Li, C.; Miao, S.; Sheng, W. Optimization Operation Strategy of Active Distribution Network Considering Dynamic Network Reconfiguration. Trans. China Electrotech. Soc. 2019, 34, 3909–3919. [Google Scholar]
  11. Ma, C.; Madaniyazi, L.; Xie, Y. Impact of the Electric Vehicle Policies on Environment and Health in the Beijing-Tianjin-Hebei Region. Int. J. Environ. Res. Public Health 2021, 18, 623. [Google Scholar] [CrossRef]
  12. Song, Y.; Yang, X.; Lu, Z. Integration of Plug-In Hybrid and Electric Vehicles: Experience from China. In Proceedings of the 2010 IEEE Power Engineering Society General Meeting, Minneapolis, MN, USA, 25–29 July 2010; pp. 1–5. [Google Scholar]
  13. Sobol, L.; Dyjakon, A. The influence of Power Sources for Charging the Batteries of Electric Cars on CO2 Emissions during Daily Driving: A Case Study from Poland. Energies 2020, 13, 4267. [Google Scholar] [CrossRef]
  14. Chen, S. Research on Service Restoration of Active Distribution Network with Microgrids; Shanghai Jiaotong University: Shanghai, China, 2017. [Google Scholar]
  15. Li, B.; Xiong, Y.; Ren, Z.; Chen, Y.; Zhang, L. Distribution network reconfiguration method considering availability of distribution terminal functions during typhoon disaster. Autom. Electr. Power Syst. 2021, 45, 38–44. [Google Scholar]
  16. Tang, Y.; Wu, Z.; Gu, W.; Yu, P.; Du, J.; Luo, X. Research on Active Distribution Network Fault Recovery Strategy Based on Unified Model Considering Reconstruction and Island Partition. Power Syst. Technol. 2020, 44, 2731–2737. [Google Scholar]
  17. Shi, Q.; Li, F.; Olama, M.; Dong, J.; Xue, Y.; Starke, M.; Feng, W.; Winstead, C.; Kuruganti, T. Post-extreme-event restoration using linear topological constraints and DER scheduling to enhance distribution system resilience. Int. J. Electr. Power Energy Syst. 2021, 131, 107029. [Google Scholar] [CrossRef]
  18. Wang, Y.; Ma, J.; Wang, X.; Xu, Y.; He, J.; Li, J. Critical Load Restoration Method for Distribution Network with Soft Open Point. Autom. Electr. Power Syst. 2021, 45, 104–111. [Google Scholar]
  19. Gao, T.; Li, J.; Wang, Y.; Xu, Y. Optimization Decision-Making Method for Distribution System Restoration Considering the Interdependency Between Power and Water Distribution Systems. Electr. Power Constr. 2021, 42, 54–60. [Google Scholar]
  20. Wang, J.; Zheng, X.; Tai, N.; Liu, Y.; Yang, Z.; Wang, J.; Tu, Q. Optimal recovery strategy of DERs integrated distribution network based on scheduling rationality. IET Renew. Power Gener. 2020, 14, 3888–3896. [Google Scholar] [CrossRef]
  21. Chen, H.; Cong, Q.; Jiang, T.; Zhang, R.; Li, X. Distribution Systems Restoration with Multi-Energy Synergy. Trans. China Electrotech. Soc. 2021, 1–13. [Google Scholar] [CrossRef]
  22. Ma, T.; Jia, B.; Lu, Z.; Cheng, X.; Wang, D. Multi-energy complement and coordinated post-contingency recovery method of distribution energy networks based on master-slave game theory. Electr. Power Autom. Equip. 2020, 40, 38–46. [Google Scholar]
  23. Yao, M.; Wang, Y. Restoration Method of Electric Power Supply for Isolated Island with Auxiliary of Electric Vehicles Considering Impact of Cooling Load. Autom. Electr. Power Syst. 2019, 43, 144–150. [Google Scholar]
  24. Xu, Y.; Wang, Y.; He, J.; Li, C. Optimal Decision-making Method for Multi-period Load Restoration in Distribution Network with Coordination of Multiple Sources. Autom. Electr. Power Syst. 2020, 44, 123–131. [Google Scholar]
  25. Lv, X.; Yang, L.; An, L.; Lin, Z. Multi-fault repair and recovery strategy for local energy internet integrated with transportation network. Electr. Power Autom. Equip. 2020, 40, 32–38. [Google Scholar]
  26. Su, M.; Xu, Y.; Wang, Y.; He, J. Placement of Charging Stations for Electric Vehicles Considering Distribution System Resilience and Charging Convenience. J. Glob. Energy Interconnect. 2019, 2, 341–348. [Google Scholar]
  27. Xu, Y.; Wang, Y.; He, J.; Su, M.; Ni, P. Resilience-Oriented Distribution System Restoration Considering Mobile Emergency Resource Dispatch in Transportation System. IEEE Access 2019, 7, 73899–73912. [Google Scholar] [CrossRef]
  28. Jiang, T.; Li, Z.; Jin, X.; Chen, H.; Li, X.; Mu, Y. Flexible operation of active distribution network using integrated smart buildings with heating, ventilation and air-conditioning systems. Appl. Energy 2018, 226, 181–196. [Google Scholar] [CrossRef]
  29. Li, Z. Modeling and Optimization of Active Distribution Network with Integrated Flexible Loads of Smart Buildings; Northeast Electric Power University: Beijing, China, 2019. [Google Scholar]
  30. Zhang, J.; Nan, Y. Electric car charging path planning under influence of traffic information. J. Comput. Appl. 2016, 36, 282–285. [Google Scholar]
  31. Zhou, Y.; Yue, Y.; Li, S.; Wei, C.; Li, Z.; Su, S. An Energy Management Method of Active Distribution Network with Integrated Electric Vehicles and Distributed Wind Power. In Proceedings of the 2020 IEEE 3rd Student Conference on Electrical Machines and Systems (SCEMS), Jinan, China, 4–6 December 2020; pp. 847–852. [Google Scholar] [CrossRef]
Figure 1. The configuration of the proposed strategy.
Wevj 12 00121 g001
Figure 2. Branch flow model of distribution network.
Wevj 12 00121 g002
Figure 3. Schematic diagram of SOCR.
Wevj 12 00121 g003
Figure 4. Flowchart of Dijkstra algorithm.
Wevj 12 00121 g004
Figure 5. Schematic diagram of IEEE 33-bus system.
Wevj 12 00121 g005
Figure 6. Schematic diagram of the 21-node transportation network.
Wevj 12 00121 g006
Figure 7. Critical load restoration of Strategy 1.
Wevj 12 00121 g007
Figure 8. Critical load restoration of Strategy 2.
Wevj 12 00121 g008
Figure 9. Critical load restoration of Strategy 3.
Wevj 12 00121 g009
Figure 10. Error scatter of each branch.
Wevj 12 00121 g010
Figure 11. Schematic diagram of the optimal routes of every EV.
Wevj 12 00121 g011
Table 1. Coupling nodes in transportation and distribution network.
Transportation Network NodeDistribution Network BusTransportation Network NodeDistribution Network BusTransportation Network NodeDistribution Network Bus
120812157
222931629
3101041717
4111151833
5212161927
62313172031
791452118
Table 2. The differences among the three strategies.
StrategyReasonably Allocate EVs to Charging StationsMulti-Period Coordinated Load Restoration
1××
2×
3
Table 3. Each time period output of each power supply source in the three strategies.
Time PeriodDG Output (kW) In Different StrategyCS1 Output (kW) In Different StrategyCS2 Output (kW) In Different StrategyCS3 Output (kW) In Different Strategy
123123123123
1420.8210.8126.2321.169.9266.4378.9168.50198.4154.3168.2
2420.8210.8126.2321.169.9267.7378.9168.5−1.3198.4154.3168.2
3420.8210.8126.2321.169.9266.4378.9168.50198.4154.3168.2
4128.3210.7187.9320.9196.2266.4378.9168.50196.6154.2106.6
511.7210.7294.4−68.1196.2266.4−25.5168.5168.482.1154.2168.2
611.7210.7294.4−68.1196.2266.4−25.5168.5168.482.1154.2168.2
711.7209.5294.4−68.1281.5350.6−25.5379.5168.482.1154.3168.2
Table 4. Comparison of the load restoration effects of the three strategies.
Remaining Energy(kWh)Network Loss(kW)Total Weighted Number of Restored Load
DGCS1CS2CS3
Strategy 174.00.30.842.012.8331312.2
Strategy 226.1049.3012.4772210.4
Strategy 350.329.9008.0412230.2
Table 5. Comparison of voltage quality of the three strategies.
(p.u.)Minimum Voltage MagnitudeAverage VoltageStandard Deviation of Voltage
Strategy 10.98760.99690.0031
Strategy 20.98810.99620.0030
Strategy 30.99100.99720.0021
Table 6. Assignment results of charging stations for all EVs in the three strategies.
Transportation Network NodeStrategy 1Strategy 2Strategy 3
714217142171421
1010001000100
3100010001000
5010001000100
8100010001000
9010001000100
11100010001000
1300100010901
1600100010082
17001000100010
18001000100010
Publisher’s Note: MDPI stays neutral with regard to jurisdictional claims in published maps and institutional affiliations.

