On Modeling the Cost of Ownership of Plug-In Vehicles


Abstract
1. Introduction
1.1. Background and Related Work
1.2. Objective and Contributions
1.3. Organization of the Manuscript
2. Cost Modeling and Baseline Scenario
- Cost to build the vehicle. This includes cost estimates and forecasting for the vehicle powertrain, which (depending on vehicle powertrain type) includes several subsystems such as the engine, battery, motor, transmission and/or on-board charger. This category also includes direct cost for the rest of the vehicle (assumed to be approximately the same irrespective of the powertrain type), as well as indirect cost that accounts for various overheads (such as administration, equipment amortization/depreciation, research and development, … etc.)
- Mark-ups pertaining to vehicle acquisition. This includes Original Equipment Manufacturer (OEM) profit margin, dealer costs and profit margin, purchase tax, as well as costs for a home charger in case of first time PEV buyers.
- Cost and credits throughout the ownership period. Excluding various forms of incentive (since current analysis is focused on cost competitiveness without incentives), this includes running costs for fuel and/or electricity, registration and insurance, periodic maintenance, as well as a resale value at the end of ownership period. In the case of BEVs, there could also be additional cost for a “replacement vehicle” (assumed to be a CICE) on days when the travel need exceeds the BEV range.
- Direct cost of vehicle without powertrain was estimated at $12,700 for non-BEV and $12,600 for BEV per the tear-down report in [15], but this cost is increased (per the assumptions in [12]) by 6%, 5% and 21% for vehicle size categories in the US of Car, Crossover and Sport Utility Vehicle (SUV), respectively.
- Cost of battery system, which includes the cells, connectors, packaging, and thermal management, had some variation in estimated cost for 2018 in the literature surveyed in [13]. As such, a cost value for 2016 BEV batteries ($273/kWh-pack), for-which there is better agreement in the literature, was projected to an estimated 2030 cost value from [16] ($108/kWh-pack) at a fixed annual percentage reduction. Further details about battery system costs include:
- ∘
- PHEV batteries are 20% more expensive than BEV batteries in terms of $/kWh at the pack level, as per the assumption in [12].
- ∘
- Sizing of a battery pack to achieve a desired electric driving range depends on both the energy efficiency of a vehicle, as well as the battery swing (ratio of usable battery energy between charging/discharging limits to nominal capacity). Typical vehicle energy efficiency for 2018 and expectations for 2030 were adopted from [12]. On the other hand, battery swing is estimated to be 76% for PHEVs and 96% for BEVs, per typical vehicles in [17].
- Cost of motor system, which includes the motor, controller and power electronics, had much variation in the estimated cost for 2018 in the reviewed literature in [13]. An attempt at calibrating a regression model (from publicly available retail prices data) in [13] led to the adoption of a first-order cost model of $300 plus $22.3/kW of motor power. The motor system is understood to be relatively mature technology and as such, the costs are assumed to be getting reduced by only 1% annually up to 2030, per [18].
- Cost of the engine system, which includes the engine, air intake system, fuel system, controller, and exhaust system is also estimated via a first-order model (from [19]) of $845 plus $21.3/kW of engine power. With engine technologies being mature, it is assumed that technology development efforts towards cost reduction are counter-balanced by the need to improve fuel economy, thereby resulting in no significant change in cost of the engine system between 2018 and 2030.
- Cost of the transmission system makes a distinction between the multi-speed or continuous-variable speed gearboxes used in CICEs and PHEVs, versus the single-speed reducers that are typically used in BEVs. With very limited publicly available data, a regression modelling approach in [13] resulted in cost estimates of $580 plus $14.6/kW for multi-speed or continuous-variable speed gearboxes, and $670 plus $3.8 for single-speed reducers. Similar to the engine system, transmission systems are treated as a mature technology, with no significant cost changes expected between 2018 and 2030.
- The charging system includes the on-board charger and cables for PEVs, which are considered as part of the powertrain cost and are estimated at $423 per [15]. The charging system also includes acquisition and installation of a home charger for first-time PEV buyers. A home charger is not considered part of the powertrain cost but is part of the total purchase cost. As per the data sources surveyed in [13], the cost for a (Level-1) home charger for PHEVs is modelled at $300, while cost of a (Level-2) charger for BEVs is modelled at $1854. Similar to the motor system, charging system costs are estimated to decline in cost by only 1% annually up to 2030.
- Indirect cost in 2018 is estimated (per [15]) at 20.5% for mass-market CICEs and at 40% for BEVs since they include newer technologies and are produced in limited volume. In current work, PHEVs in 2018 are assumed to have the same indirect cost as BEVs, while all PEVs are expected to tend towards the same indirect cost of mass-market CICEs (i.e., 20.5%) by 2030.
- Other mark-ups include OEM profit margin, which (per [12]) are assumed to be 5%, 10% and 15% for Car, Crossover and SUV respectively. In addition, the total purchase cost also considers 15% dealer mark-up (dealer operating costs and profit margin) and 8.5% purchase tax.
- Fuel/electricity costs depend on the vehicle efficiency in [gal/mile] and/or [kWh/mile], annual VMT, as well as the ratio of electric-VMT to total VMT, which is known as the utility factor (UF). In [13] and current work, real-world travel data from the California household travel survey (CHTS) [20] is utilized for calculation of the UF for population average, as well as for sub-groups of vehicles that are “less urban” or “more urban” (per clustering analysis in [21]), as summarized in Table 1. For BEVs, the fraction of non-electric miles (on days when travel need exceeds the BEV range) are assumed to be done on a “replacement vehicle” that is a CICE of the same size class, and thus, BEVs may incur “gas cost”. The replacement vehicle is assumed to be a second household vehicle, and thus its usage cost (besides gas consumption) is assumed at a fairly low rate of $0.58/mile ($0.36/km), $0.62/mile ($0.39/km) and $0.65/mile ($0.40/km) for Car, Crossover and SUV, respectively. The cost of gas and electricity are obtained from statistics/predictions by the US Energy Information Administration (EIA) [22,23]. Average gas cost in 2018 was $2.81/gal ($0.74/L) and its baseline 2030 prediction is $3.36/gal ($0.89/L), while average electricity cost was $0.128/kWh in 2018 and is predicted to be $0.130/kWh in 2030.
- Maintenance costs in [13] are based on a report from the American Automobile Association (AAA) [26]. For CICEs, the costs are estimated at $0.085/mile ($0.053/km), $0.091/mile ($0.056/km) and $0.096/mile ($0.060/km) for Car, Crossover and SUV respectively, while BEV Car maintenance costs are estimated at $0.066/mile ($0.041/km). Due to lack of maintenance data for BEV Crossover and SUV, the cost for a BEV Car is scaled proportionally using the ratios of CICE. PHEVs are assumed to have the same maintenance costs as CICEs.
- Re-sale value after five years for a number of CICEs, PHEVs and BEVs at different zip codes was sampled in [13] using data from the Kelly Blue book [27]. The average resale value was observed to be approximately 51% of the vehicle original value for CICEs and PHEVs. On the other hand, resale value for BEVs was approximately 40% of the vehicle original value.
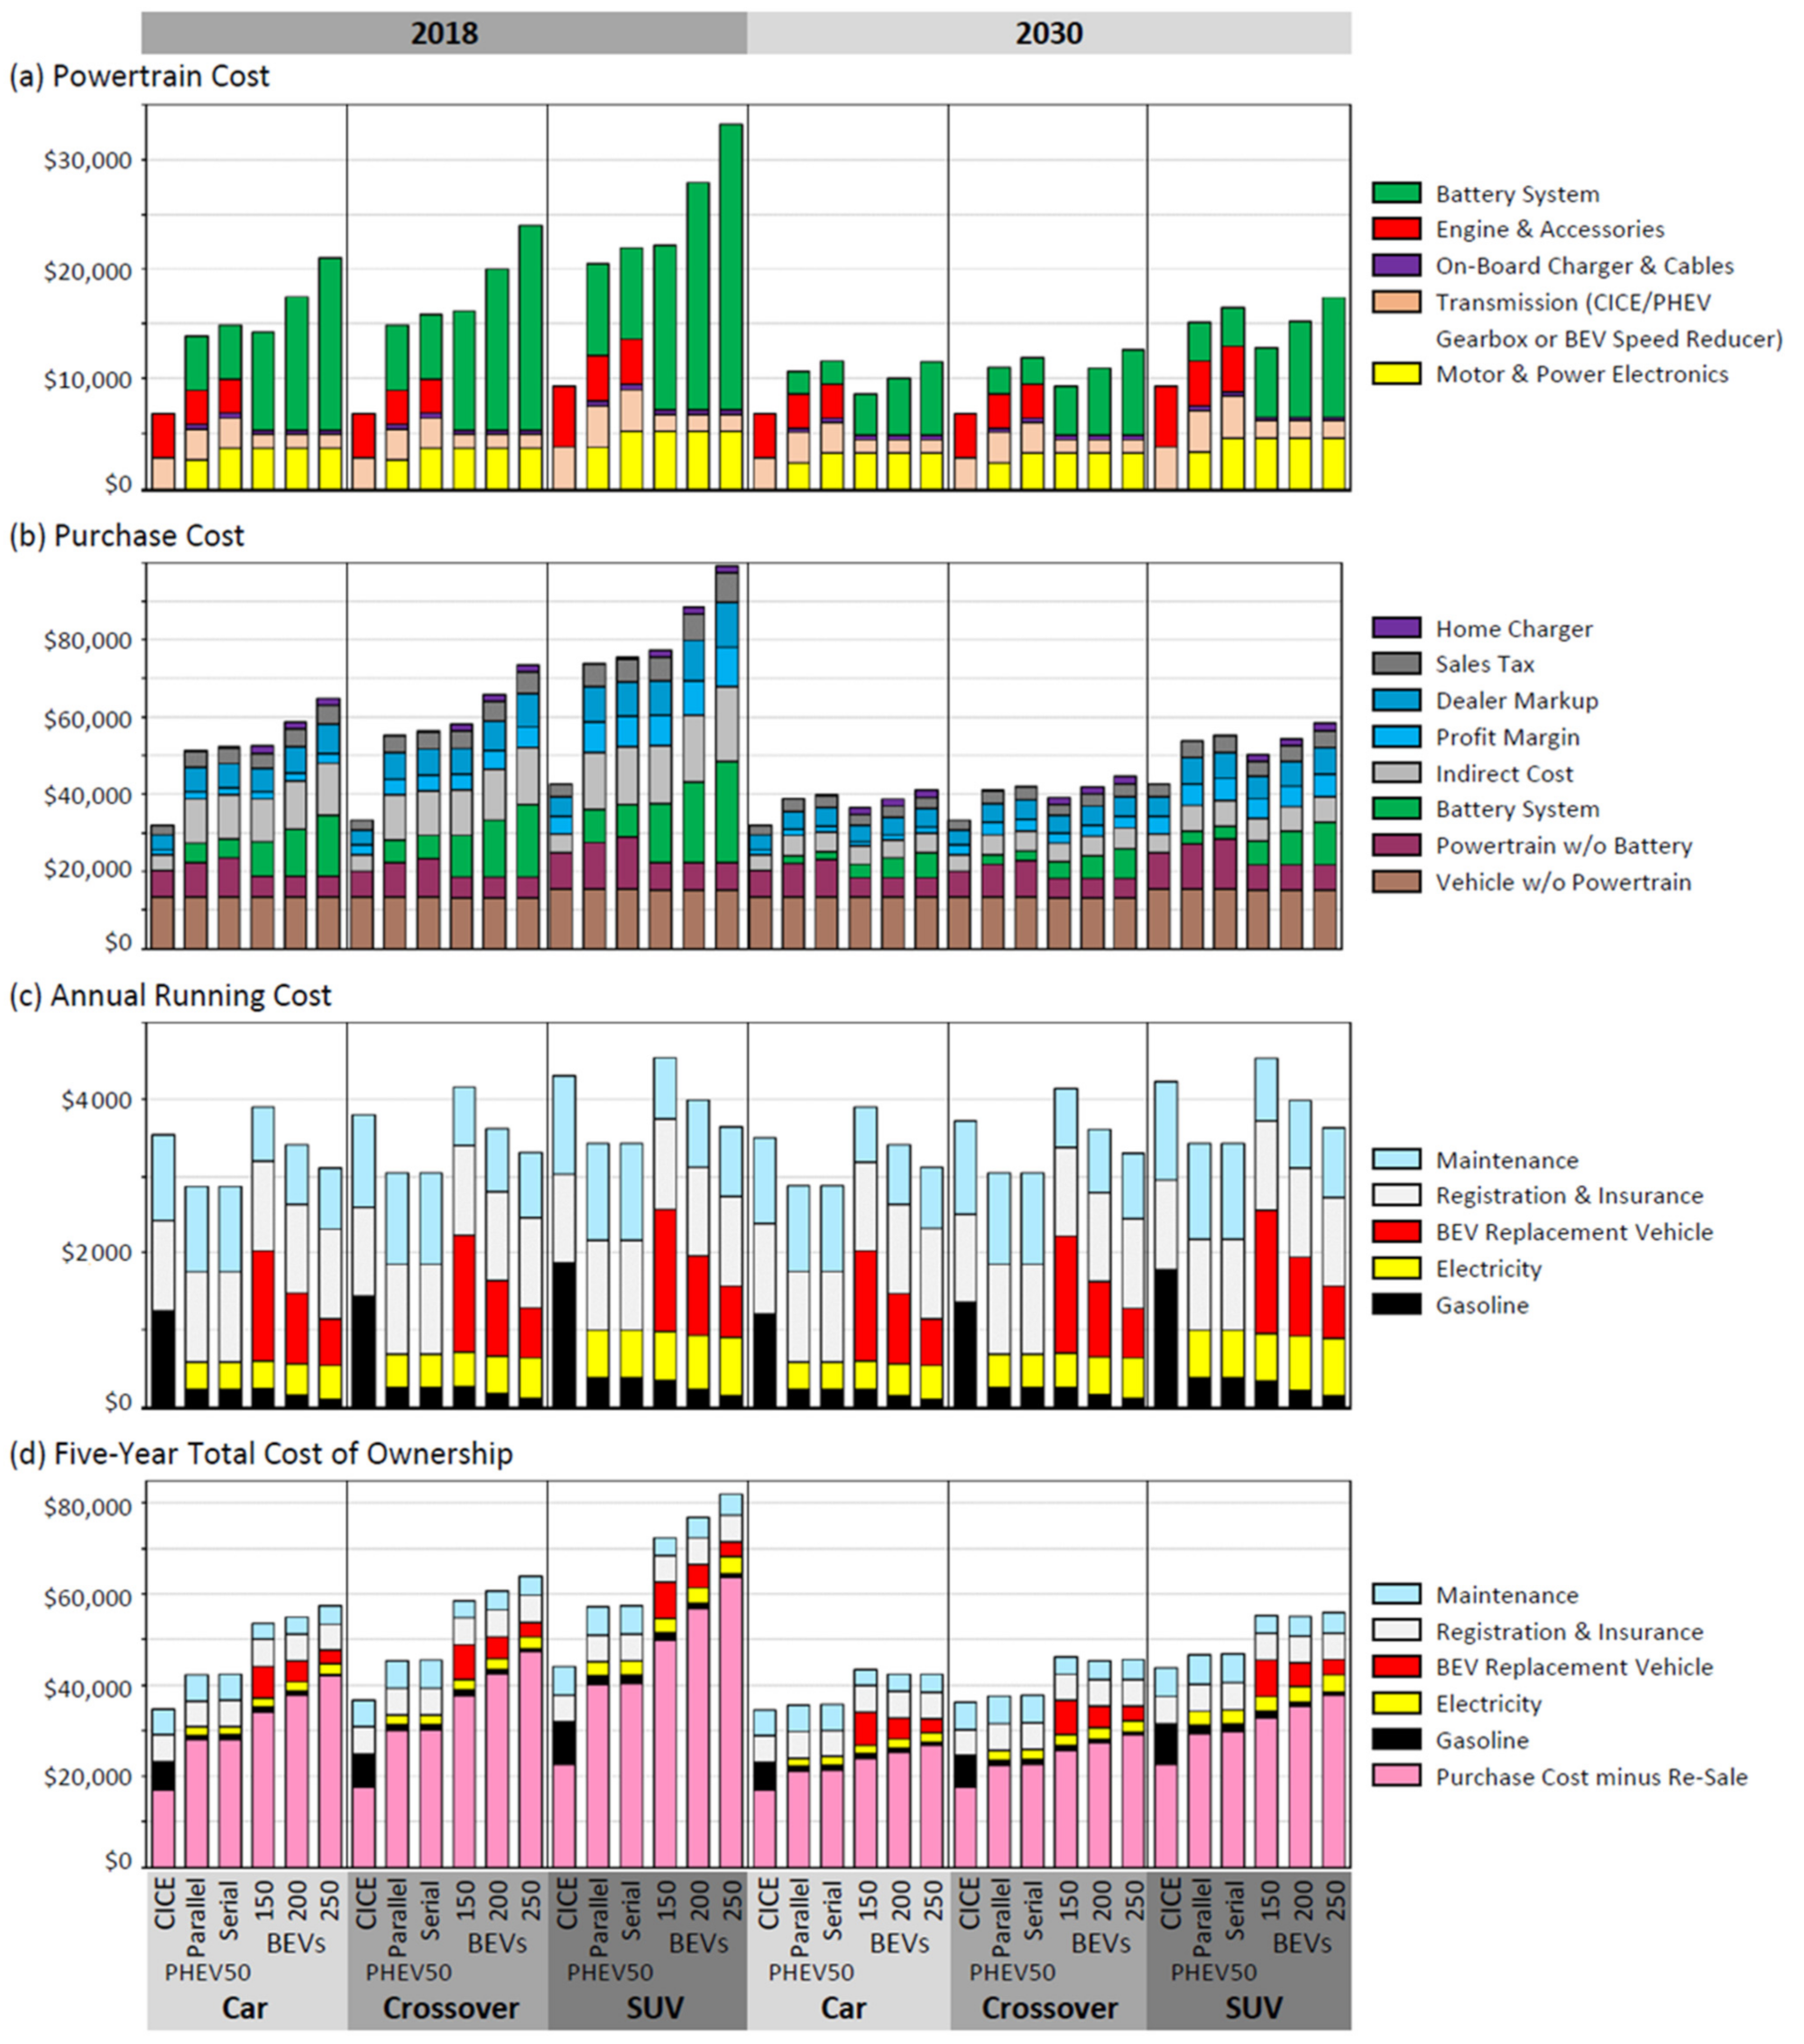
- The cost of PEV powertrains (Figure 1a) appeared to be dominated by battery costs in 2018, with the lowest PEV powertrain cost (for parallel-drive PHEV50) being approximately $7000, $8000 and $11,200 more than CICE in the size categories of Car, Crossover and SUV, respectively. Battery cost predictions in 2030 bring the difference in powertrain costs closer, with the lowest PEV powertrain cost (BEV150) at approximately $1800, $2500 and $3500 more than CICE for Car, Crossover and SUV respectively.
- With the cost of PEV powertrains being higher than that of CICE, and with all mark-ups being approximately the same, the purchase cost of all PEVs remains higher than CICE in 2030 for all size categories (Figure 1b). This includes the assumption that the indirect cost of all PEVs becomes the same as CICEs by 2030.
- Running cost of most PEVs (except BEV150) is lower than corresponding CICE (Figure 1c). While BEVs have lower maintenance cost compared to PHEVs, BEVs incur additional cost for a replacement vehicle for the non-electric fraction of VMT per their UF, resulting in PHEVs having overall lower running cost. Since UF, and by extent, the running cost, can vary significantly depending on vehicle usage pattern, in the upcoming sensitivity analysis section, VMT and UF values (Table 1) corresponding to less urban and more urban sub-groups of vehicle samples in the CHTS dataset will also be considered.
- Another notable observation about running cost is that the increase in unit price of gasoline and electricity for baseline 2030 scenario is mostly counter-balanced by improvements in vehicle efficiency across all powertrain types (per predicted vehicle efficiency values in [12]), resulting in no significant change in cost of gasoline and electricity between 2018 and 2030 for all powertrain types.
- Combining purchase cost and running cost over five years, then accounting for vehicle resale, allows for estimation of TCO (Figure 1d). Although most PEVs have lower running cost than CICE, and despite the gap in purchase cost being relatively small for the baseline 2030 scenario, savings in running cost over five years are insufficient to offset the difference in purchase cost in any of the studied vehicle size categories.
3. Sensitivity Analysis
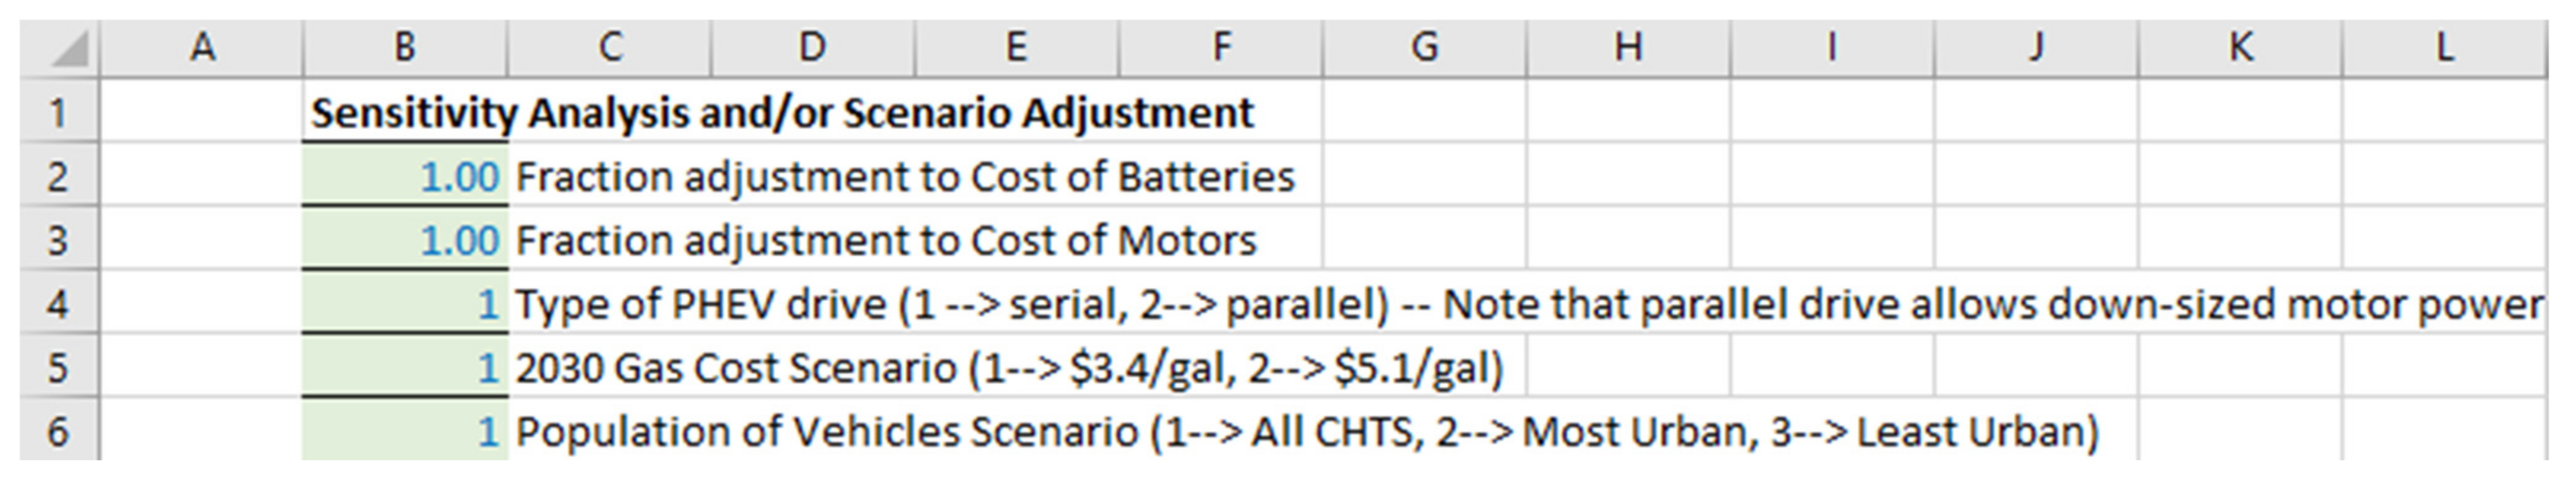
- Motor system (i.e., motor and power electronics) costs that are 20% less expensive than the 2030 baseline (which had assumed 1% annual cost reduction from 2018 to 2030), which is perceived to be an optimistic since motor technology is fairly mature. This adjustment is made by setting the value of the spreadsheet cell B3 (Figure 2) to a value of 0.8
- Battery system costs 20% less expensive than the 2030 baseline (which had assumed $108/kWh for BEV battery packs), implying $86/kWh-pack, which is likely a bounding limit barring new battery technology getting discovered, since to the best of the authors’ knowledge at the time of writing this manuscript, no OEM has made any official announcement regarding battery packs at less than $100/kWh. This adjustment is made by setting the value of the spreadsheet cell B2 (Figure 2) to a value of 0.8
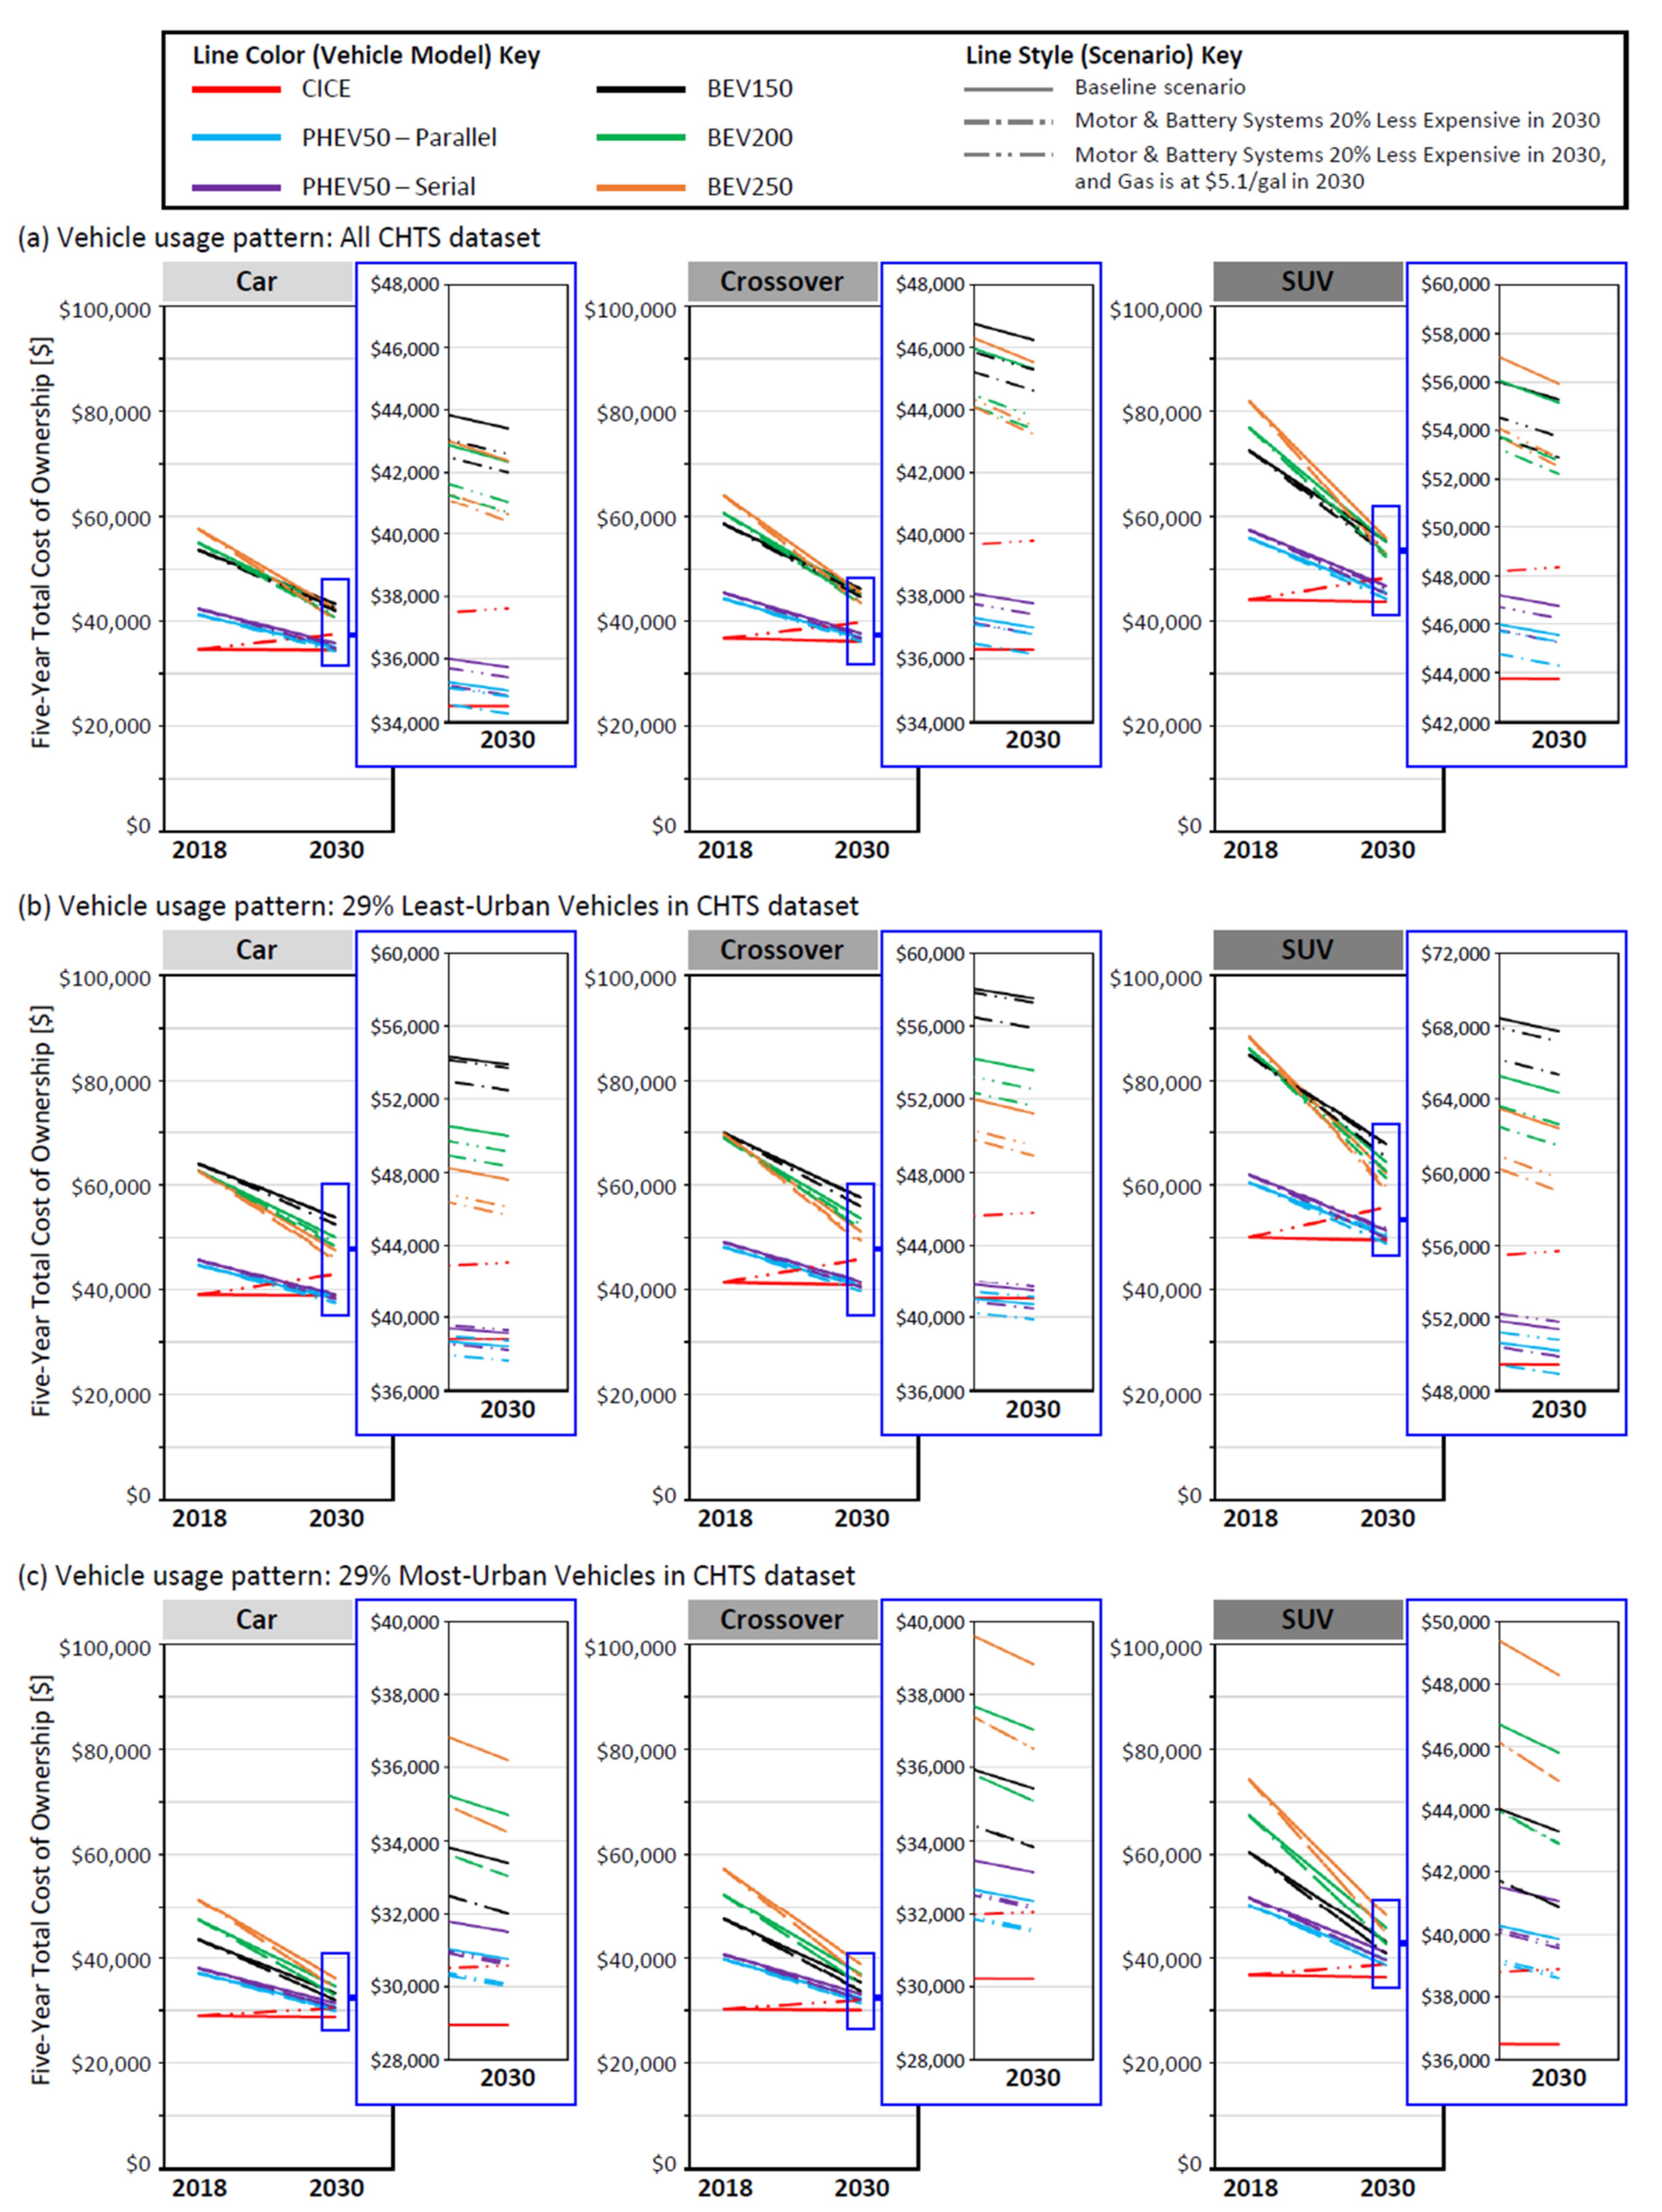
- Due to efficiency improvements (per assumptions in [12]), there is no significant change in the TCO of CICEs between 2018 and 2030 in the baseline scenario (solid red lines in Figure 4) despite the increase of gasoline price from $2.81/gal to $3.36/gal. In the more expensive gasoline scenario ($5.1/gal), however (dashes with double-dot red lines in Figure 4), there is a noticeable increase in the TCO of CICEs across all vehicle usage patterns for all size categories.
- Per Table 1, all PEVs have some amount of equivalent gasoline usage (except BEVs in most-urban driving, which have zero or near-zero equivalent gasoline). As such, the line plots in Figure 4 corresponding to optimistic technology costs (dash-dot lines) have lower cost values than the line plots for optimistic technology costs along with higher gasoline price (dash double-dot lines in Figure 4), except for Figure 4c, where the dash-dot and dash double-dot lines overlap for BEVs. Thus, when making observations via Figure 4, comparisons should be among different line colors (powertrains) for same line style (scenario). Furthermore, there is no dash-dot red line in Figure 4 since the more optimistic battery and more technology cost scenarios have no effect on the TCO of CICE.
- Driving patterns can have a large impact on the TCO of PEVs, and especially BEVs. BEV150 has the lowest 2030 TCO among BEVs for the most urban driving (Figure 4c), BEV200 has the lowest 2030 TCO among BEVs for population average (Figure 4a), while BEV250 has the lowest 2030 TCO among BEVs for the least urban driving (Figure 4b).
- Despite PEVs having high UF (less gasoline usage) for the most-urban vehicles group (Table 1), this sub-population of vehicles have low annual VMT (Table 1), resulting in the running cost savings not being enough to offset the difference in purchase cost minus resale value for any of the PEVs in Figure 4c when considering any same-scenario comparison (i.e., solid-line to solid line, dash-dot to solid red line or dash double-dot to dash-double dot) for any of the vehicle size categories.
- For the population-average driving pattern as represented by all CHTS vehicle samples (Figure 4a), the 2030 TCO of PHEVs can be lower than CICEs for all vehicle size categories when gasoline price is high. If gasoline price were to stay at the baseline 2030 prediction, it would take the more optimistic technology scenario for only the parallel-drive PHEV50 to barely break even with CICE (comparing dash-dot blue line with solid red line in Figure 4a) in the Car and Crossover size categories, but not SUV.
- Despite lower UF (more gasoline usage) for the least-urban vehicles group (Table 1), high annual VMT (VMT) sets the 2030 TCO of PHEVs at a sizable margin below CICEs for the high gasoline price scenario (dash double-dot blue and purple lines compared to dash double-dot red line in Figure 4b) across all vehicle size categories. For this group of vehicles, PHEVs can reach break-even with CICE in terms of TCO even in the baseline scenario (solid blue and purple lines compared to solid red line in Figure 4b) for Car and Crossover size categories.
4. Conclusions
4.1. Summary of Findings
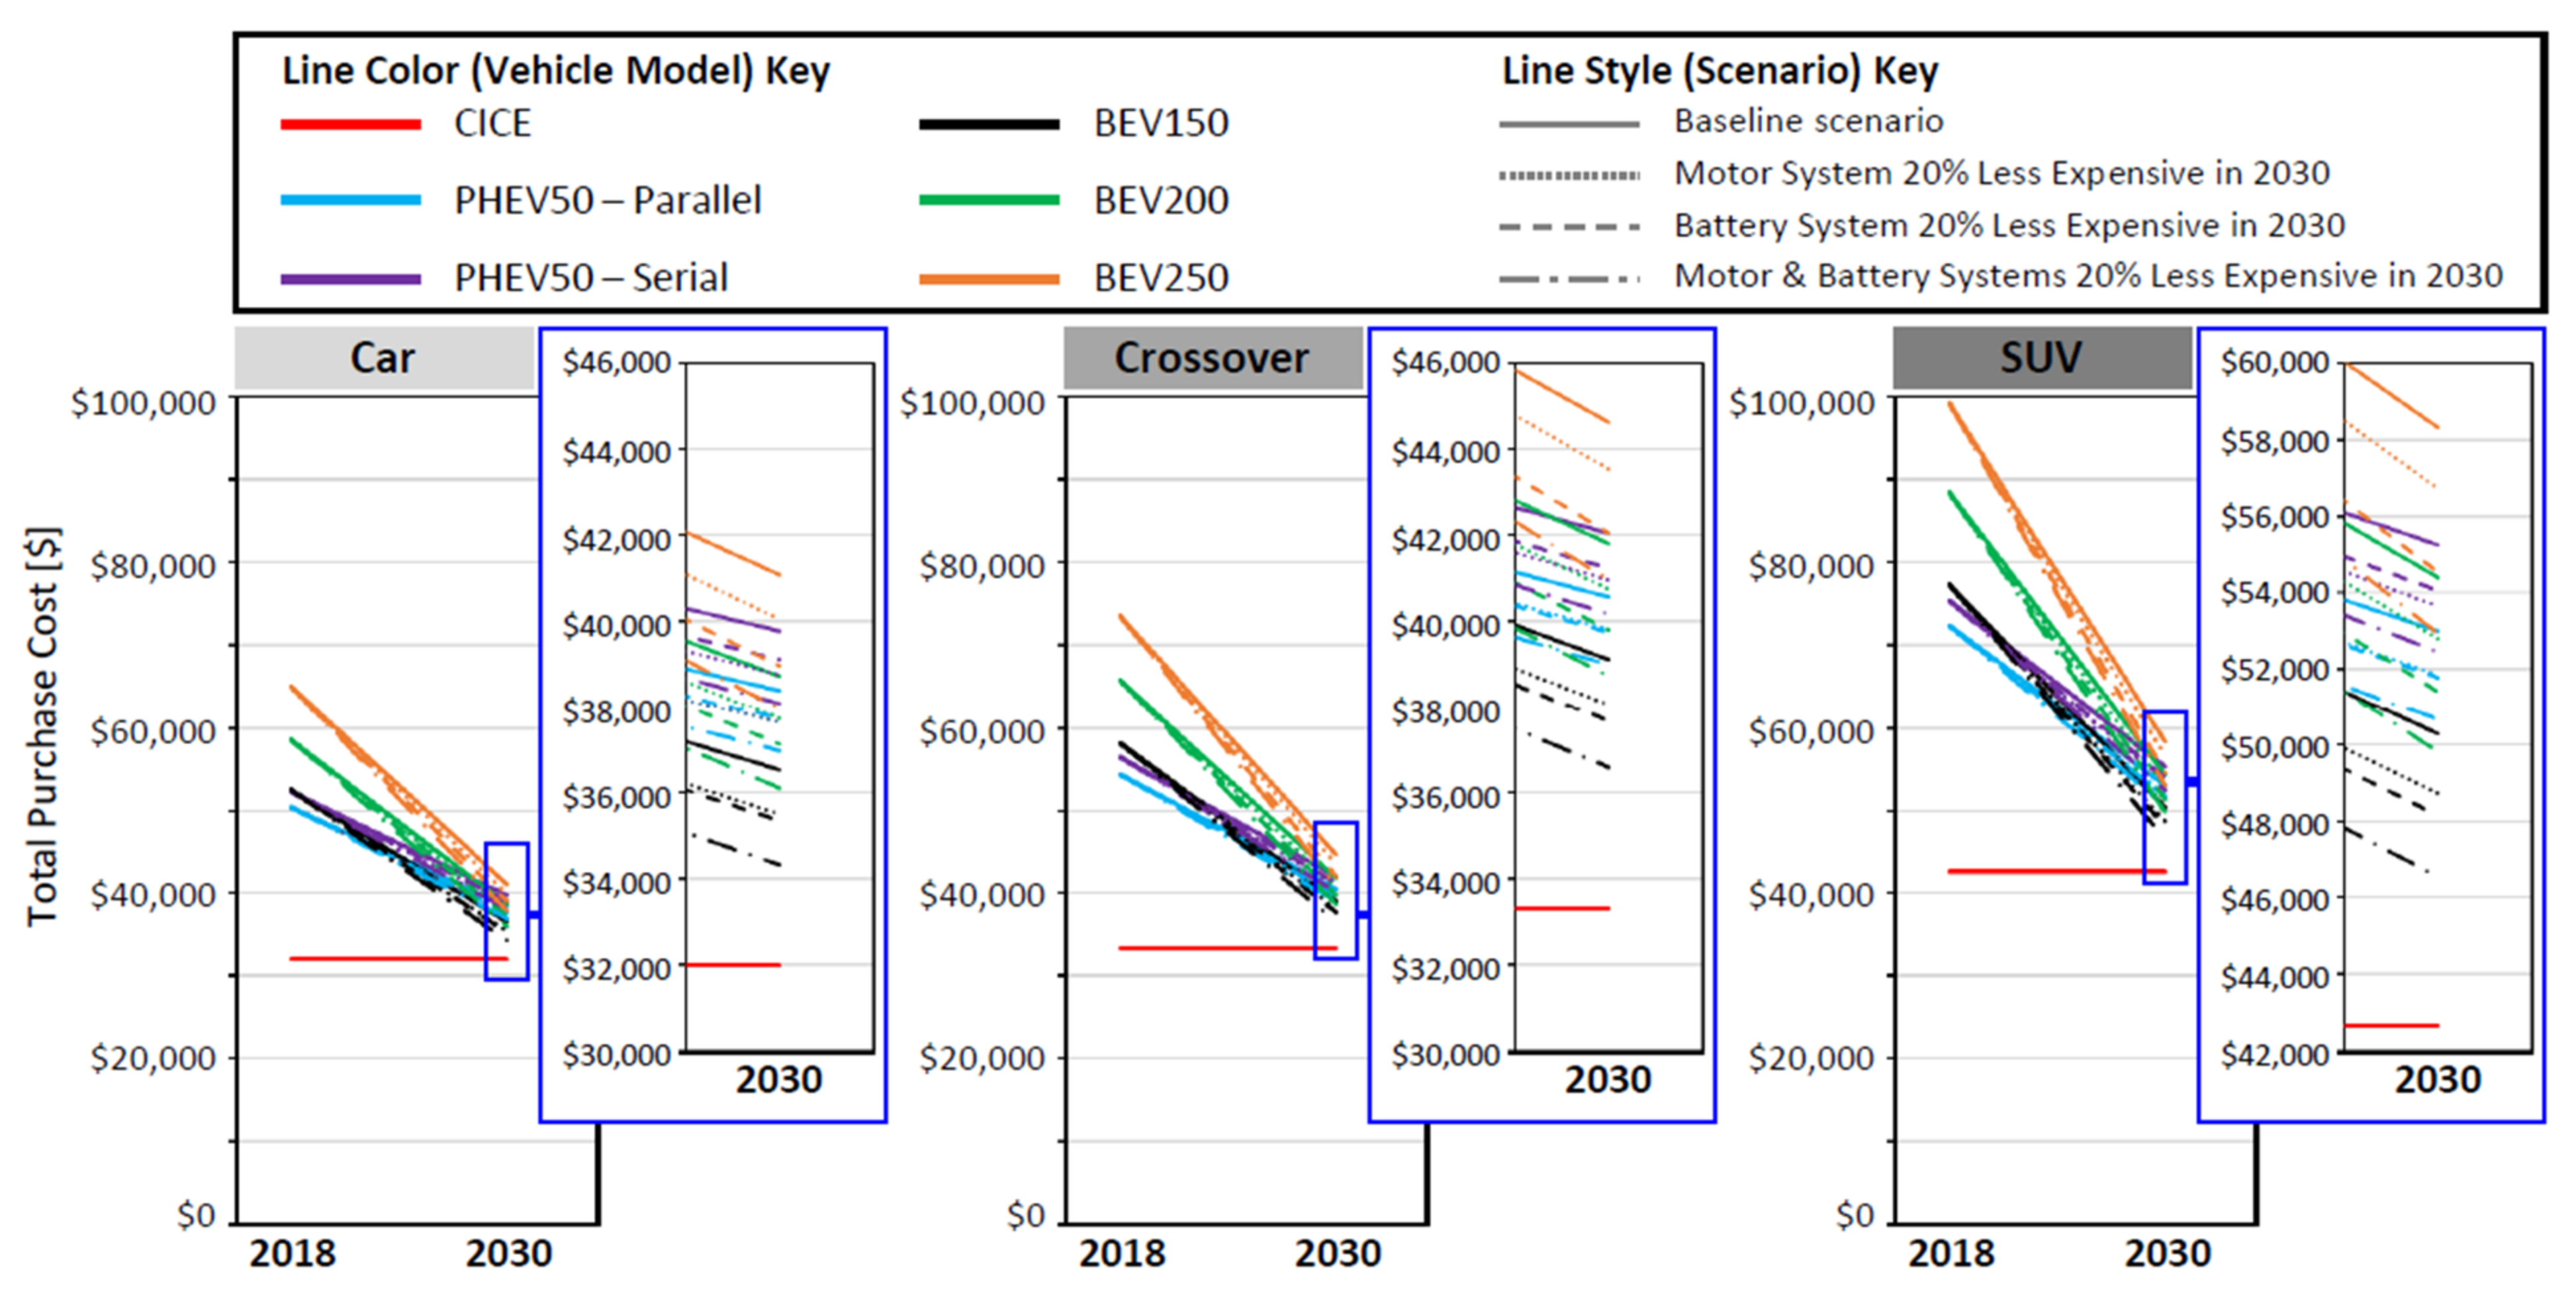
- Without subsides or incentives, parity in the purchase cost between PEVs and CICEs is unlikely to happen before 2030.
- TCO may reach break-even without incentives by 2030 under some PEV-favorable conditions such as lower costs of batteries and motors compared to the baseline prediction, along with higher gasoline price and/or longer annual distance travelled (thus allowing for savings during use phase to make up for the differences in upfront purchase cost).
4.2. Research Development
Author Contributions
Funding
Acknowledgments
Conflicts of Interest
List of Abbreviations
| AAA | American Automobile Association |
| BEV | Battery (only) Electric Vehicle |
| CHTS | California Household Travel Survey |
| CICE | Conventional Internal Combustion Engine vehicle |
| EIA | (United States) Energy Information Administration |
| HOV | High-Occupancy Vehicle |
| OEM | Original Equipment Manufacturer |
| PEV | Plug-in Electric Vehicle |
| PHEV | Plug-in Hybrid Electric Vehicle |
| SUV | Sports Utility Vehicle |
| TCO | Total Cost of Ownership |
| UF | Utility Factor |
| VMT | Vehicle Miles Travelled |
References
- US Department of Energy. Vehicle Technologies Program. 2011. Available online: http://energy.gov/sites/prod/files/2014/05/f15/52723.pdf (accessed on 1 October 2019).
- Axsen, J.; Kurani, K.S.; McCarthy, R.; Yang, C. Plug-in hybrid vehicle GHG impacts in California: Integrating consumer-informed recharge profiles with an electricity-dispatch model. Energy Policy 2011, 39, 1617–1629. [Google Scholar] [CrossRef]
- Karabasoglu, O.; Michalek, J. Influence of driving patterns on life cycle cost and emissions of hybrid and plug-in electric vehicle power trains. Energy Policy 2013, 60, 445–461. [Google Scholar] [CrossRef]
- Yuksel, T.; Tamayao, M.-A.M.; Hendrickson, C.; Azevedo, I.M.L.; Michalek, J.J. Effect of regional grid mix, driving patterns and climate on the comparative carbon footprint of gasoline and plug-in electric vehicles in the United States. Environ. Res. Lett. 2016, 11, 44007. [Google Scholar] [CrossRef]
- Laberteaux, K.; Hamza, K.; Willard, J. Optimizing the electric range of plug-in vehicles via fuel economy simulations of real-world driving in California. Transp. Res. Part D 2019, 73, 15–33. [Google Scholar] [CrossRef]
- Jenn, A.; Azevedo, I.L.; Michalek, J.J. Alternative-fuel-vehicle policy interactions increase U.S. greenhouse gas emissions. Transp. Res. Part A Policy Pract. 2019, 124, 396–407. [Google Scholar] [CrossRef]
- Electric Drive Transportation Association. Electric Drive Sales Dashboard. 2019. Available online: http://www.electricdrive.org/index.php?ht=d/sp/i/20952/pid/20952 (accessed on 1 October 2019).
- US Department of Energy. Federal Tax Credits for New All‑Electric and Plug-in Hybrid Vehicles. 2016. Available online: https://www.fueleconomy.gov/feg/taxevb.shtml (accessed on 1 January 2016).
- California Clean Vehicle Rebate Program. 2015. Available online: https://cleanvehiclerebate.org/eng (accessed on 1 January 2016).
- California Environmental Protection Agency. 2012. Available online: https://ww2.arb.ca.gov/resources/documents/historical-alternative-fuels-vehicles-incentive-programs (accessed on 8 March 2021).
- Traut, E.; Hendrickson, C.; Klampfl, E.; Liu, Y.; Michalek, J.J. Optimal design and allocation of electrified vehicles and dedicated charging infrastructure for minimum lifecycle greenhouse gas emissions and cost. Energy Policy 2012, 51, 524–534. [Google Scholar] [CrossRef]
- Lutsy, N.; Nicholas, M. Update on Electric Vehicle Costs in the United States through 2030. Available online: https://theicct.org/publications/update-US-2030-electric-vehicle-cost (accessed on 1 October 2019).
- Hamza, K.; Laberteaux, K.; Chu, K.-C. On Modeling the Total Cost of Ownership of Electric and Plug-in Hybrid Vehicles; Technical Paper; SAE International: Warrendale, PA, USA, 2020. [Google Scholar]
- Shared folder on Google Drive. 2020. Available online: https://drive.google.com/drive/folders/15aRR8WrrVV6ttqxSJXfcM8lNf0WrTgxK?usp=sharing (accessed on 3 November 2019).
- UBS. UBS Evidence Lab Electric Car Teardown—Disruption Ahead? 2017. Available online: https://neo.ubs.com/shared/d1ZTxnvF2k/ (accessed on 1 October 2019).
- Anderman, M. The xEV Industry Insider Report. 2019. Available online: https://www.totalbatteryconsulting.com/industry-reports/xEV-report/Extract-from-the-xEV-Industry-Report.pdf (accessed on 1 November 2019).
- US Department of Energy. Fuel Economy Guide. 2019. Available online: https://www.fueleconomy.gov/feg/printGuides.shtml (accessed on 1 January 2019).
- National Research Council. Transitions to Alternative Vehicles and Fuels; The National Academic Press: Washington, DC, USA, 2013. [Google Scholar]
- National Renewable Energy Laboratory. Future Automotive Systems Technology Simulator. 2018. Available online: http://www.nrel.gov/transportation/fastsim.html (accessed on 1 October 2019).
- National Renewable Energy Laboratory. 2010–2012 California Household Travel Survey. 2013. Available online: https://www.nrel.gov/transportation/secure-transportation-data/tsdc-california-travel-survey.html (accessed on 1 October 2019).
- Hamza, K.; Laberteaux, K.P. A Cluster Analysis Study of Opportune Adoption of Electric Drive Vehicles for Better Greenhouse Gas Reduction. In Proceedings of the ASME 2016 International Design Engineering Technical Conferences and Computers and Information in Engineering Conference, Charlotte, NC, USA, 21–24 August 2016. [Google Scholar]
- U.S. Energy Information Administration. Weekly Retail Gasoline and Diesel Prices. 2019. Available online: https://www.eia.gov/dnav/pet/pet_pri_gnd_dcus_nus_a.htm (accessed on 1 November 2019).
- EIA. Annual Energy Outlook. 2019. Available online: https://www.eia.gov/outlooks/ieo/pdf/ieo2019.pdf (accessed on 1 November 2019).
- US Department of Transportation. Summary of State Motor‑Vehicle Registration Fee Schedules. 2019. Available online: https://www.fhwa.dot.gov/ohim/hwytaxes/2001/pt11.htm (accessed on 1 October 2019).
- Sayles, J.; The Most Expensive States to Own a Car. U.S. News, 7 January 2020. Available online: https://cars.usnews.com/cars-trucks/most-expensive-states-to-own-a-car (accessed on 1 October 2019).
- American Automobile Association. Your Driving Costs. 2019. Available online: https://exchange.aaa.com/wp-content/uploads/2019/09/AAA-Your-Driving-Costs-2019.pdf (accessed on 1 November 2019).
- Kelly Blue Book. 2019. Available online: https://www.kbb.com/ (accessed on 1 November 2019).
- Helveston, J.P.; Liu, Y.; Feit, E.M.; Fuchs, E.; Klampfl, E.; Michalek, J.J. Will subsidies drive electric vehicle adoption? Measuring consumer preferences in the U.S. and China. Transp. Res. Part A Policy Pract. 2015, 73, 96–112. [Google Scholar] [CrossRef]


| - | CHTS Dataset Vehicle Samples | |||
|---|---|---|---|---|
| All CHTS | 29% Least Urban | 29% Most Urban | ||
| Average Annual VMT (mile/year) (km/year) | 13,250 (21,319) | 18,144 (29,194) | 6944 (11,173) | |
| Utility Factor [%] | PHEV50-Parallel | 72.6% | 61.9% | 93.9% |
| PHEV50-Serial | 72.6% | 61.9% | 93.9% | |
| BEV150 | 81.4% | 70.9% | 99.1% | |
| BEV200 | 88.1% | 81.3% | 99.8% | |
| BEV250 | 92.2% | 89.0% | 100.0% | |
Publisher’s Note: MDPI stays neutral with regard to jurisdictional claims in published maps and institutional affiliations. |
© 2021 by the authors. Licensee MDPI, Basel, Switzerland. This article is an open access article distributed under the terms and conditions of the Creative Commons Attribution (CC BY) license (http://creativecommons.org/licenses/by/4.0/).
Share and Cite
Hamza, K.; Laberteaux, K.P.; Chu, K.-C. On Modeling the Cost of Ownership of Plug-In Vehicles. World Electr. Veh. J. 2021, 12, 39. https://doi.org/10.3390/wevj12010039
Hamza K, Laberteaux KP, Chu K-C. On Modeling the Cost of Ownership of Plug-In Vehicles. World Electric Vehicle Journal. 2021; 12(1):39. https://doi.org/10.3390/wevj12010039
Chicago/Turabian StyleHamza, Karim, Kenneth P. Laberteaux, and Kang-Ching Chu. 2021. "On Modeling the Cost of Ownership of Plug-In Vehicles" World Electric Vehicle Journal 12, no. 1: 39. https://doi.org/10.3390/wevj12010039
APA StyleHamza, K., Laberteaux, K. P., & Chu, K.-C. (2021). On Modeling the Cost of Ownership of Plug-In Vehicles. World Electric Vehicle Journal, 12(1), 39. https://doi.org/10.3390/wevj12010039