
Multi-Criteria, Co-Evolutionary Charging Behavior: An Agent-Based Simulation of Urban Electromobility


Abstract
1. Introduction
2. Related Literature and State of the Art
2.1. Simulation Frameworks
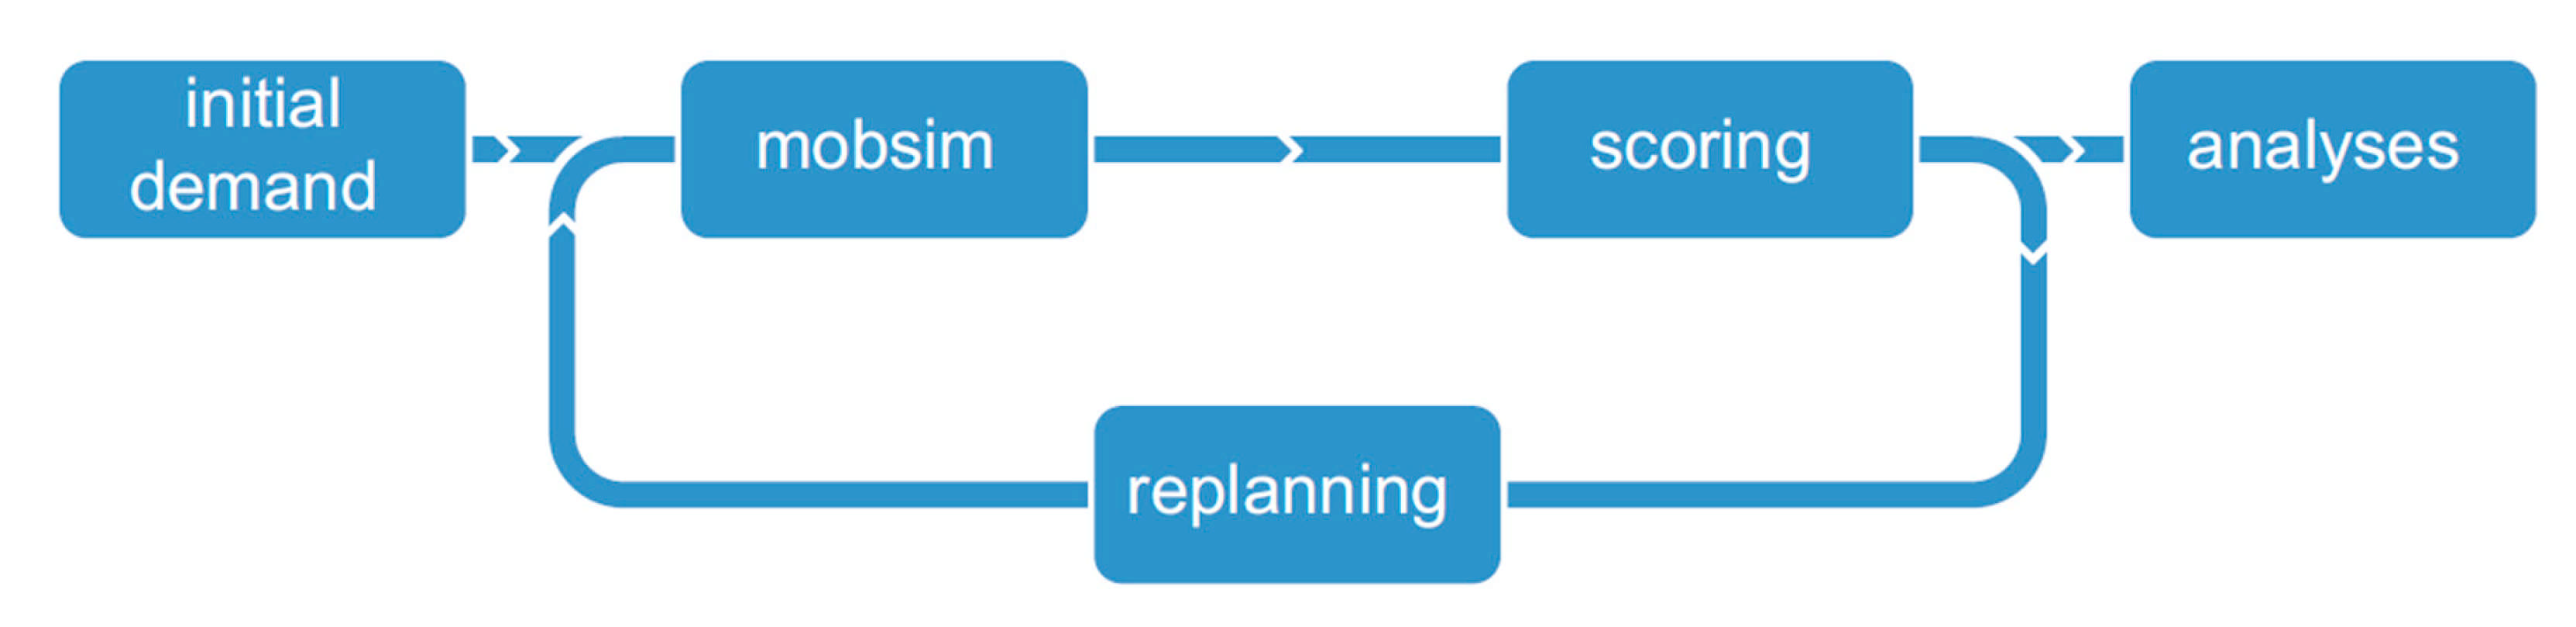
MATSim and EV-Contrib
2.2. User Behavior
- Charging behavior–users’ decision-making regarding their general wish to charge.
- Location choice–users’ decision-making regarding the choice of a specific charging point.
2.2.1. Charging Behavior
2.2.2. Location Choice
2.3. Review Conclusion and Research Gap
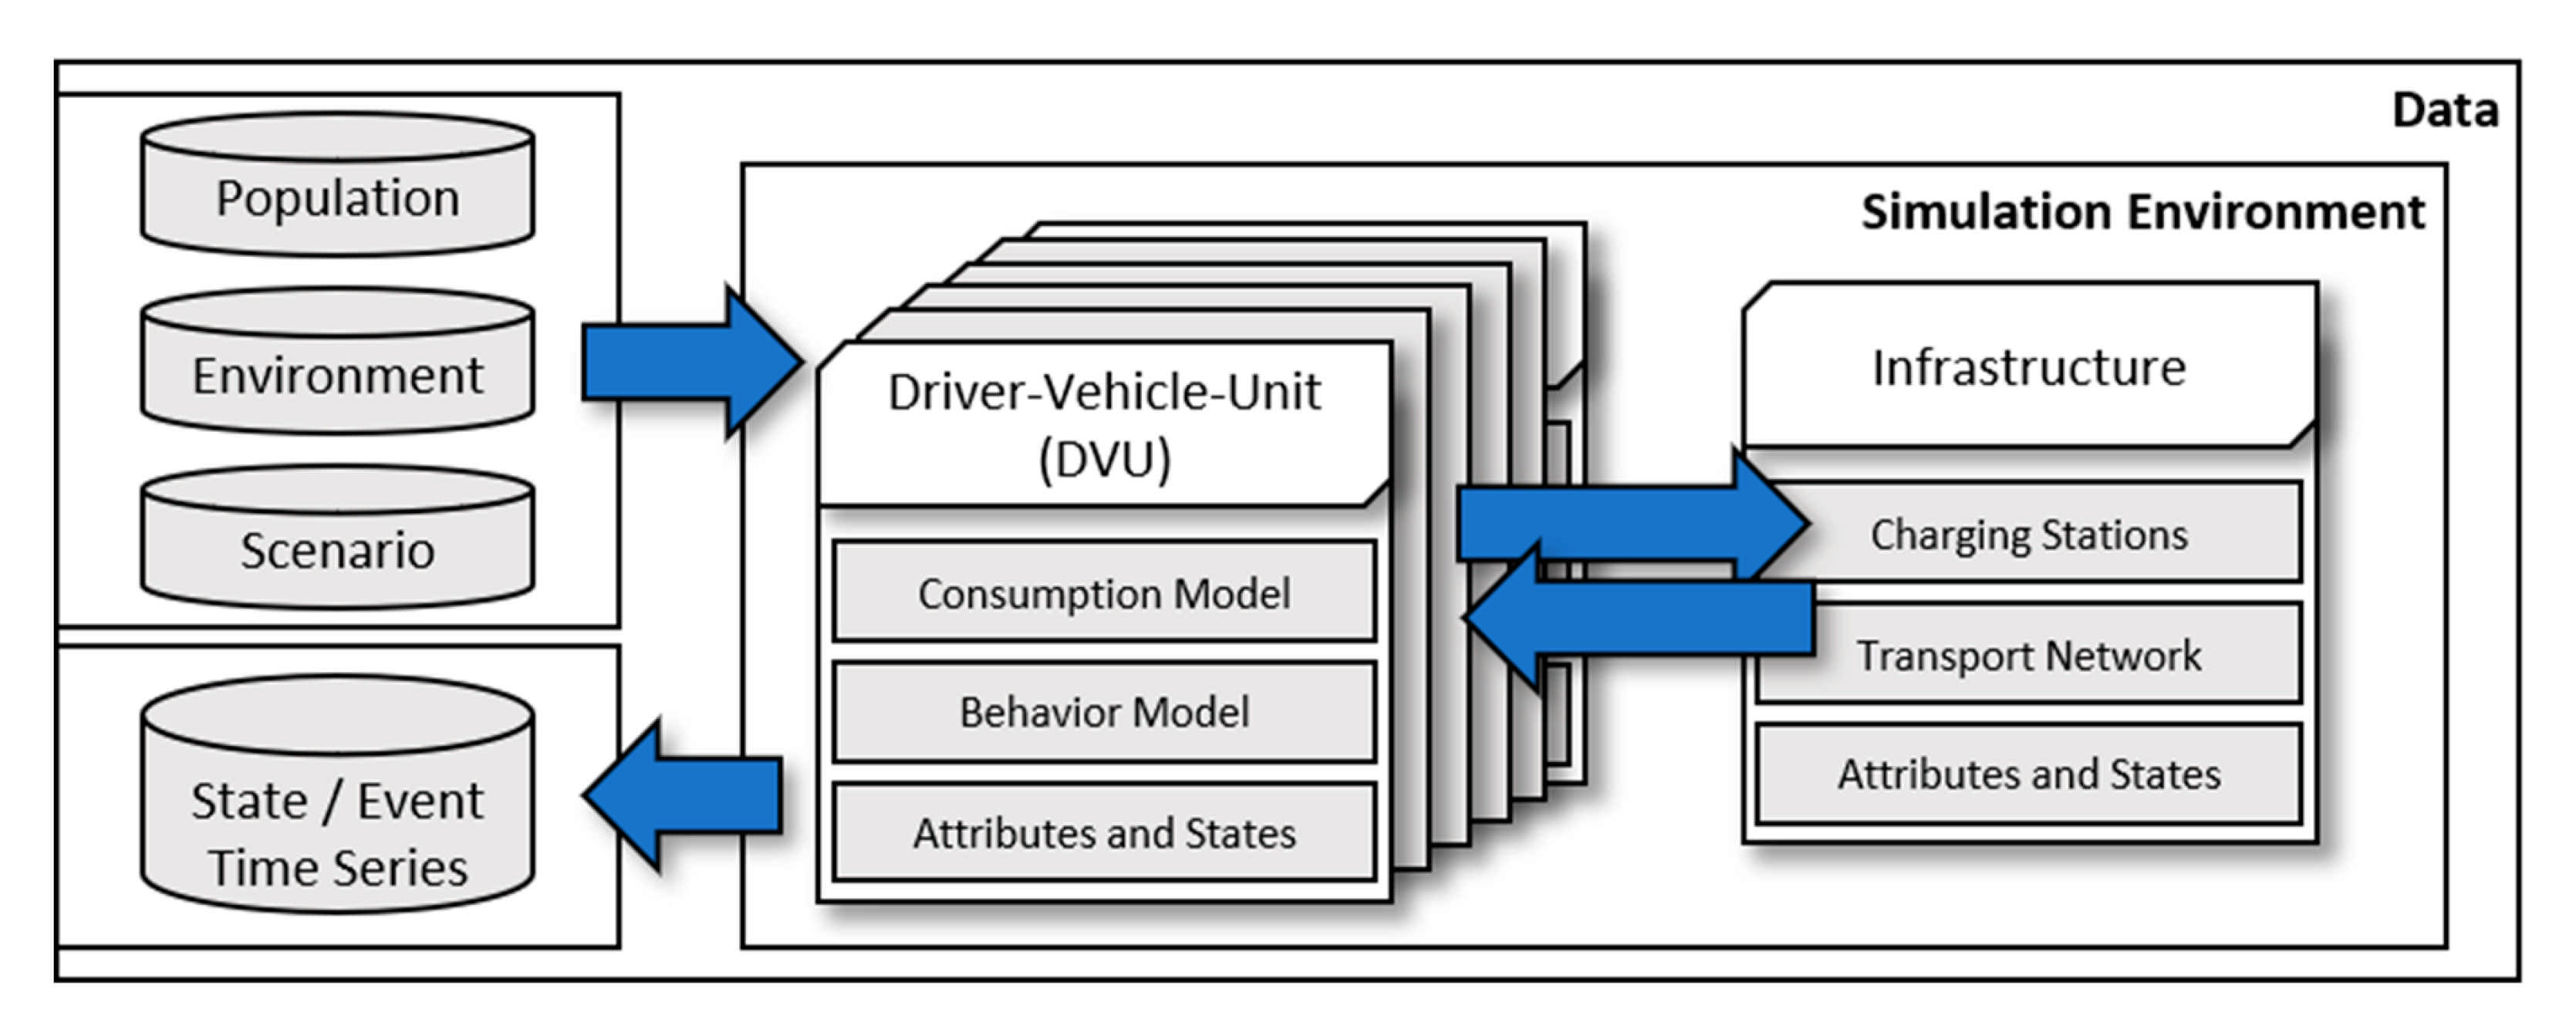
3. Agent-Based Simulation of Urban Electromobility
3.1. Assumptions and Requirements
- The mere feasibility of charging plans does not constitute a sufficient basis on which to model charging behavior, since current BEV typically offer driving ranges that are considerably longer than the average daily mileage of an urban BEV driver. This means that charging activities can be postponed and do not have to take place on a daily basis. Hence, soft criteria like comfort, price and personal preference have to be considered in addition to SOC-driven charging behavior.
- Owing to the relative flexibility afforded by charging in city environments and long driving ranges, multi-day charging behavior has to be considered. Furthermore, real BEV drivers can be expected to take historic experience and future mobility demand into account and do not act solely on the basis of short-term considerations.
- For the same reason, queueing is also not a characteristic user behavior for most charging points within cities. Therefore, location choice has to be explicitly modeled and the level of information an agent has when picking a charging site needs to be aligned with real drivers who use apps and websites to determine the current occupancy of charging stations before choosing a location.
- Users do not interrupt ongoing trips if charging is not strictly essential owing to a very low SOC. Instead, they aim to integrate charging into their daily activities, i.e., agents should be modeled such that they charge during other, primary activities.
- Because charging needs to be modeled as a concurrent activity, charging and parking durations are not necessarily equally long. Specifically, charging points are occupied until primary activities have been completed even if the charging process ends earlier.
- It is not safe to assume that every agent has an opportunity to charge at home in city environments. Instead, private charging points are part of a larger, more heterogeneous charging infrastructure. Therefore, not all vehicles can be expected to be fully charged at the start of a day, and private chargers have to be supplemented by public and work chargers.
3.2. User Behavior
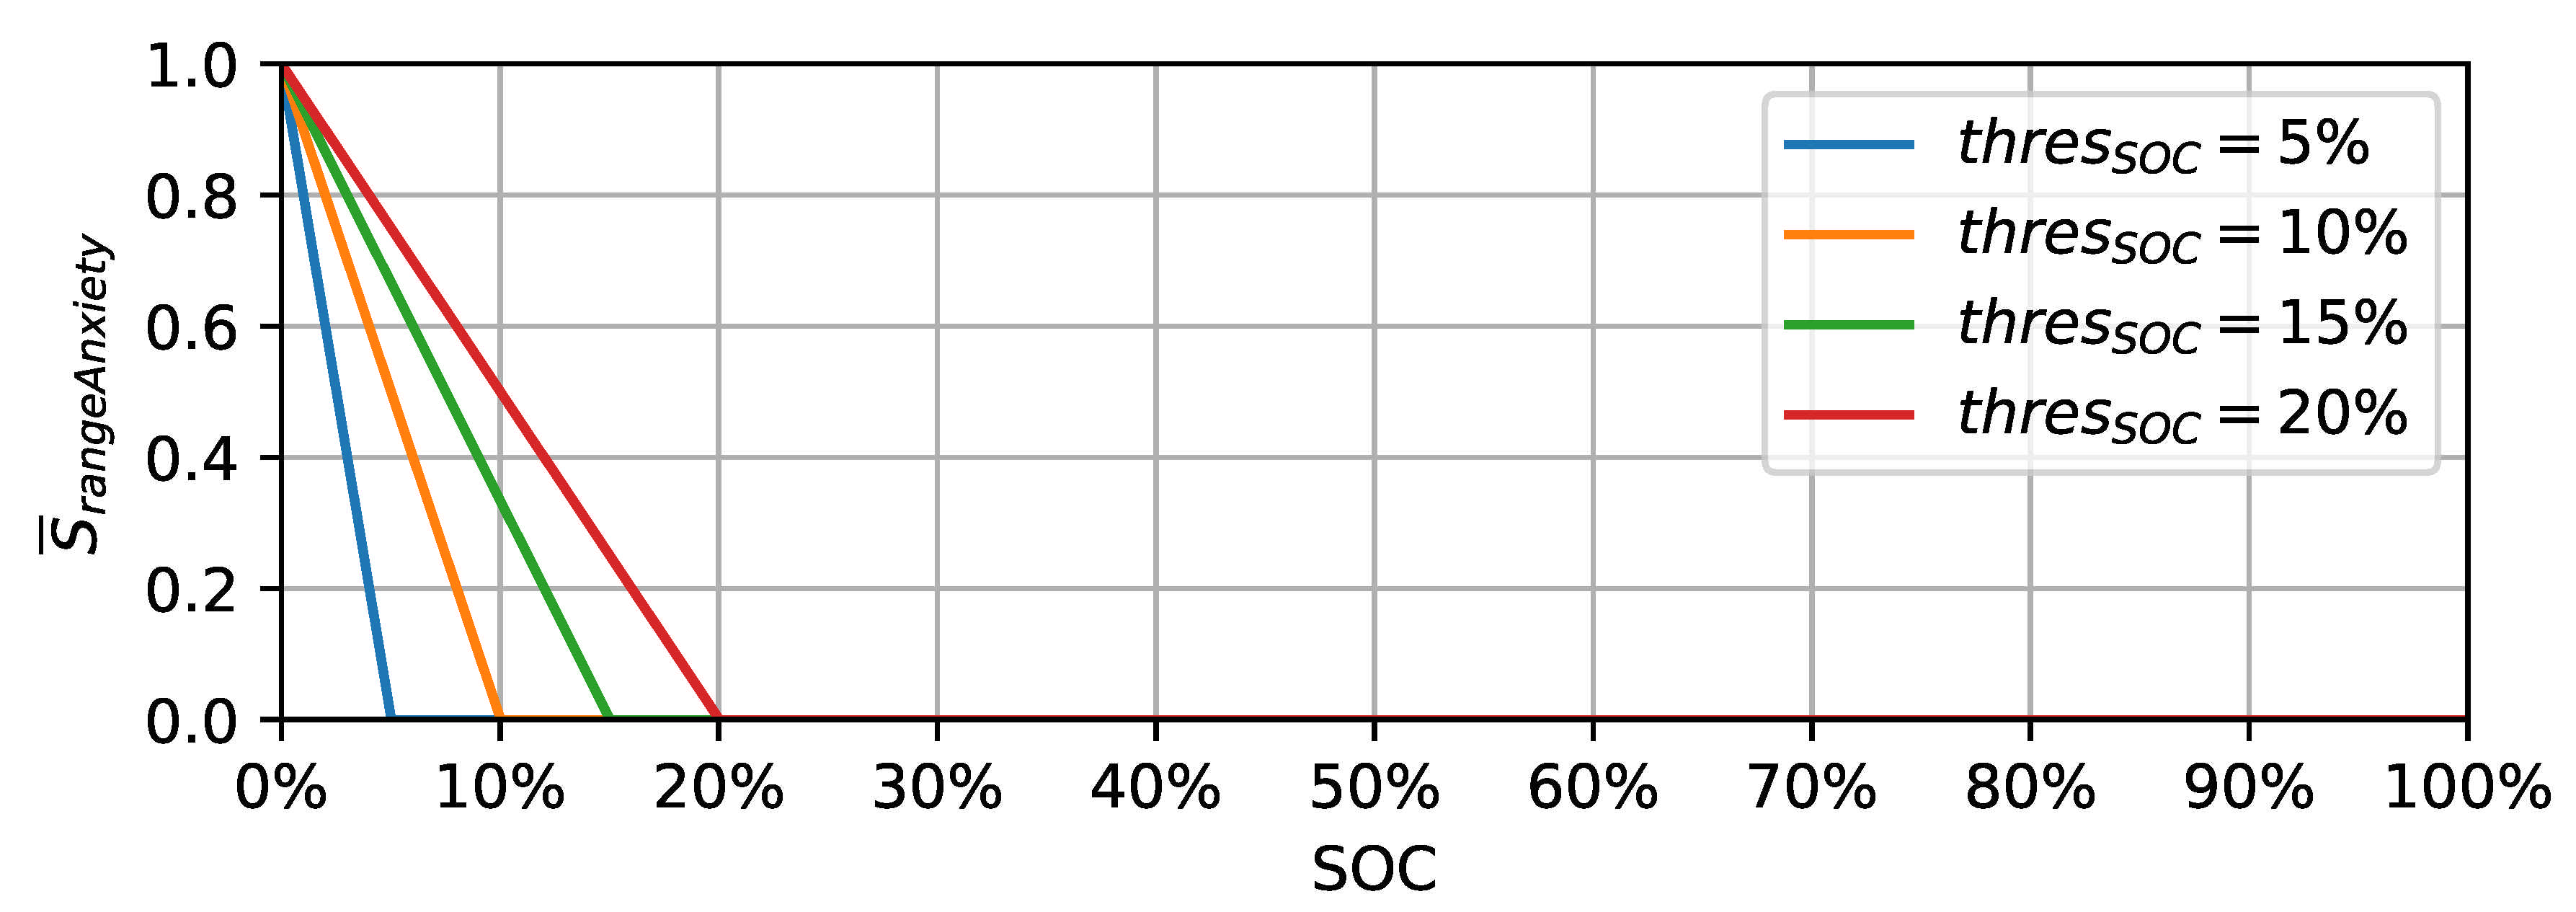
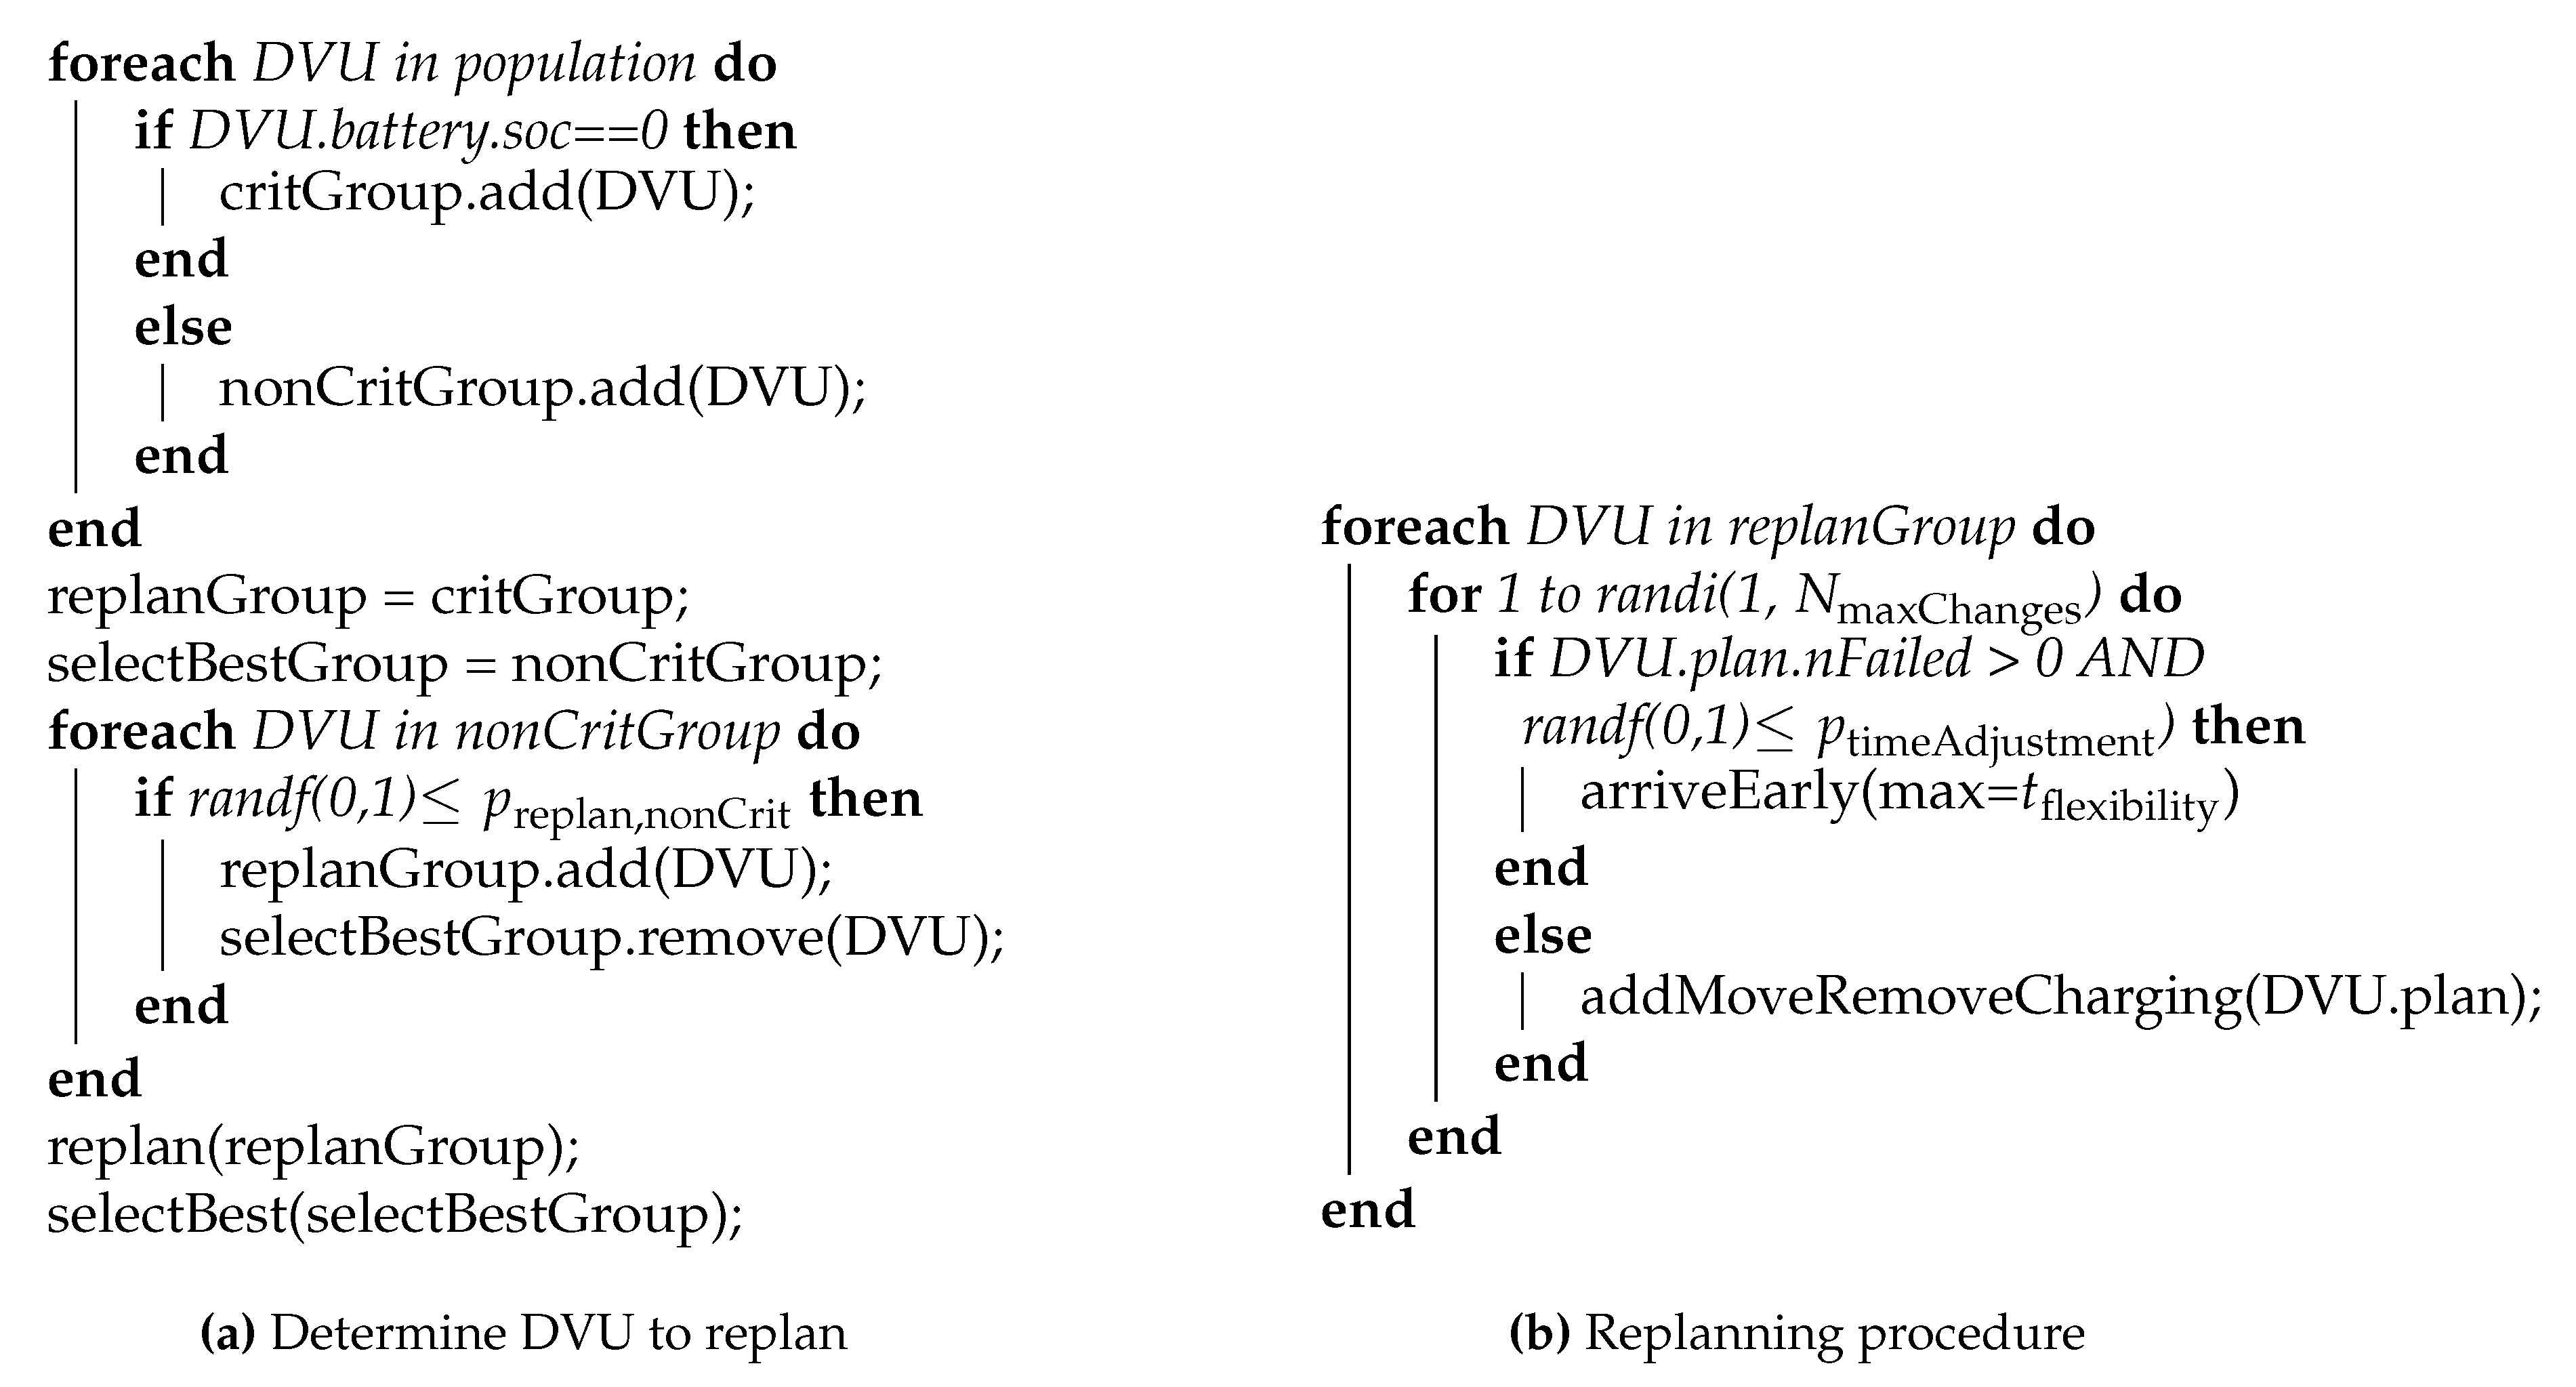
3.2.1. Charging Behavior
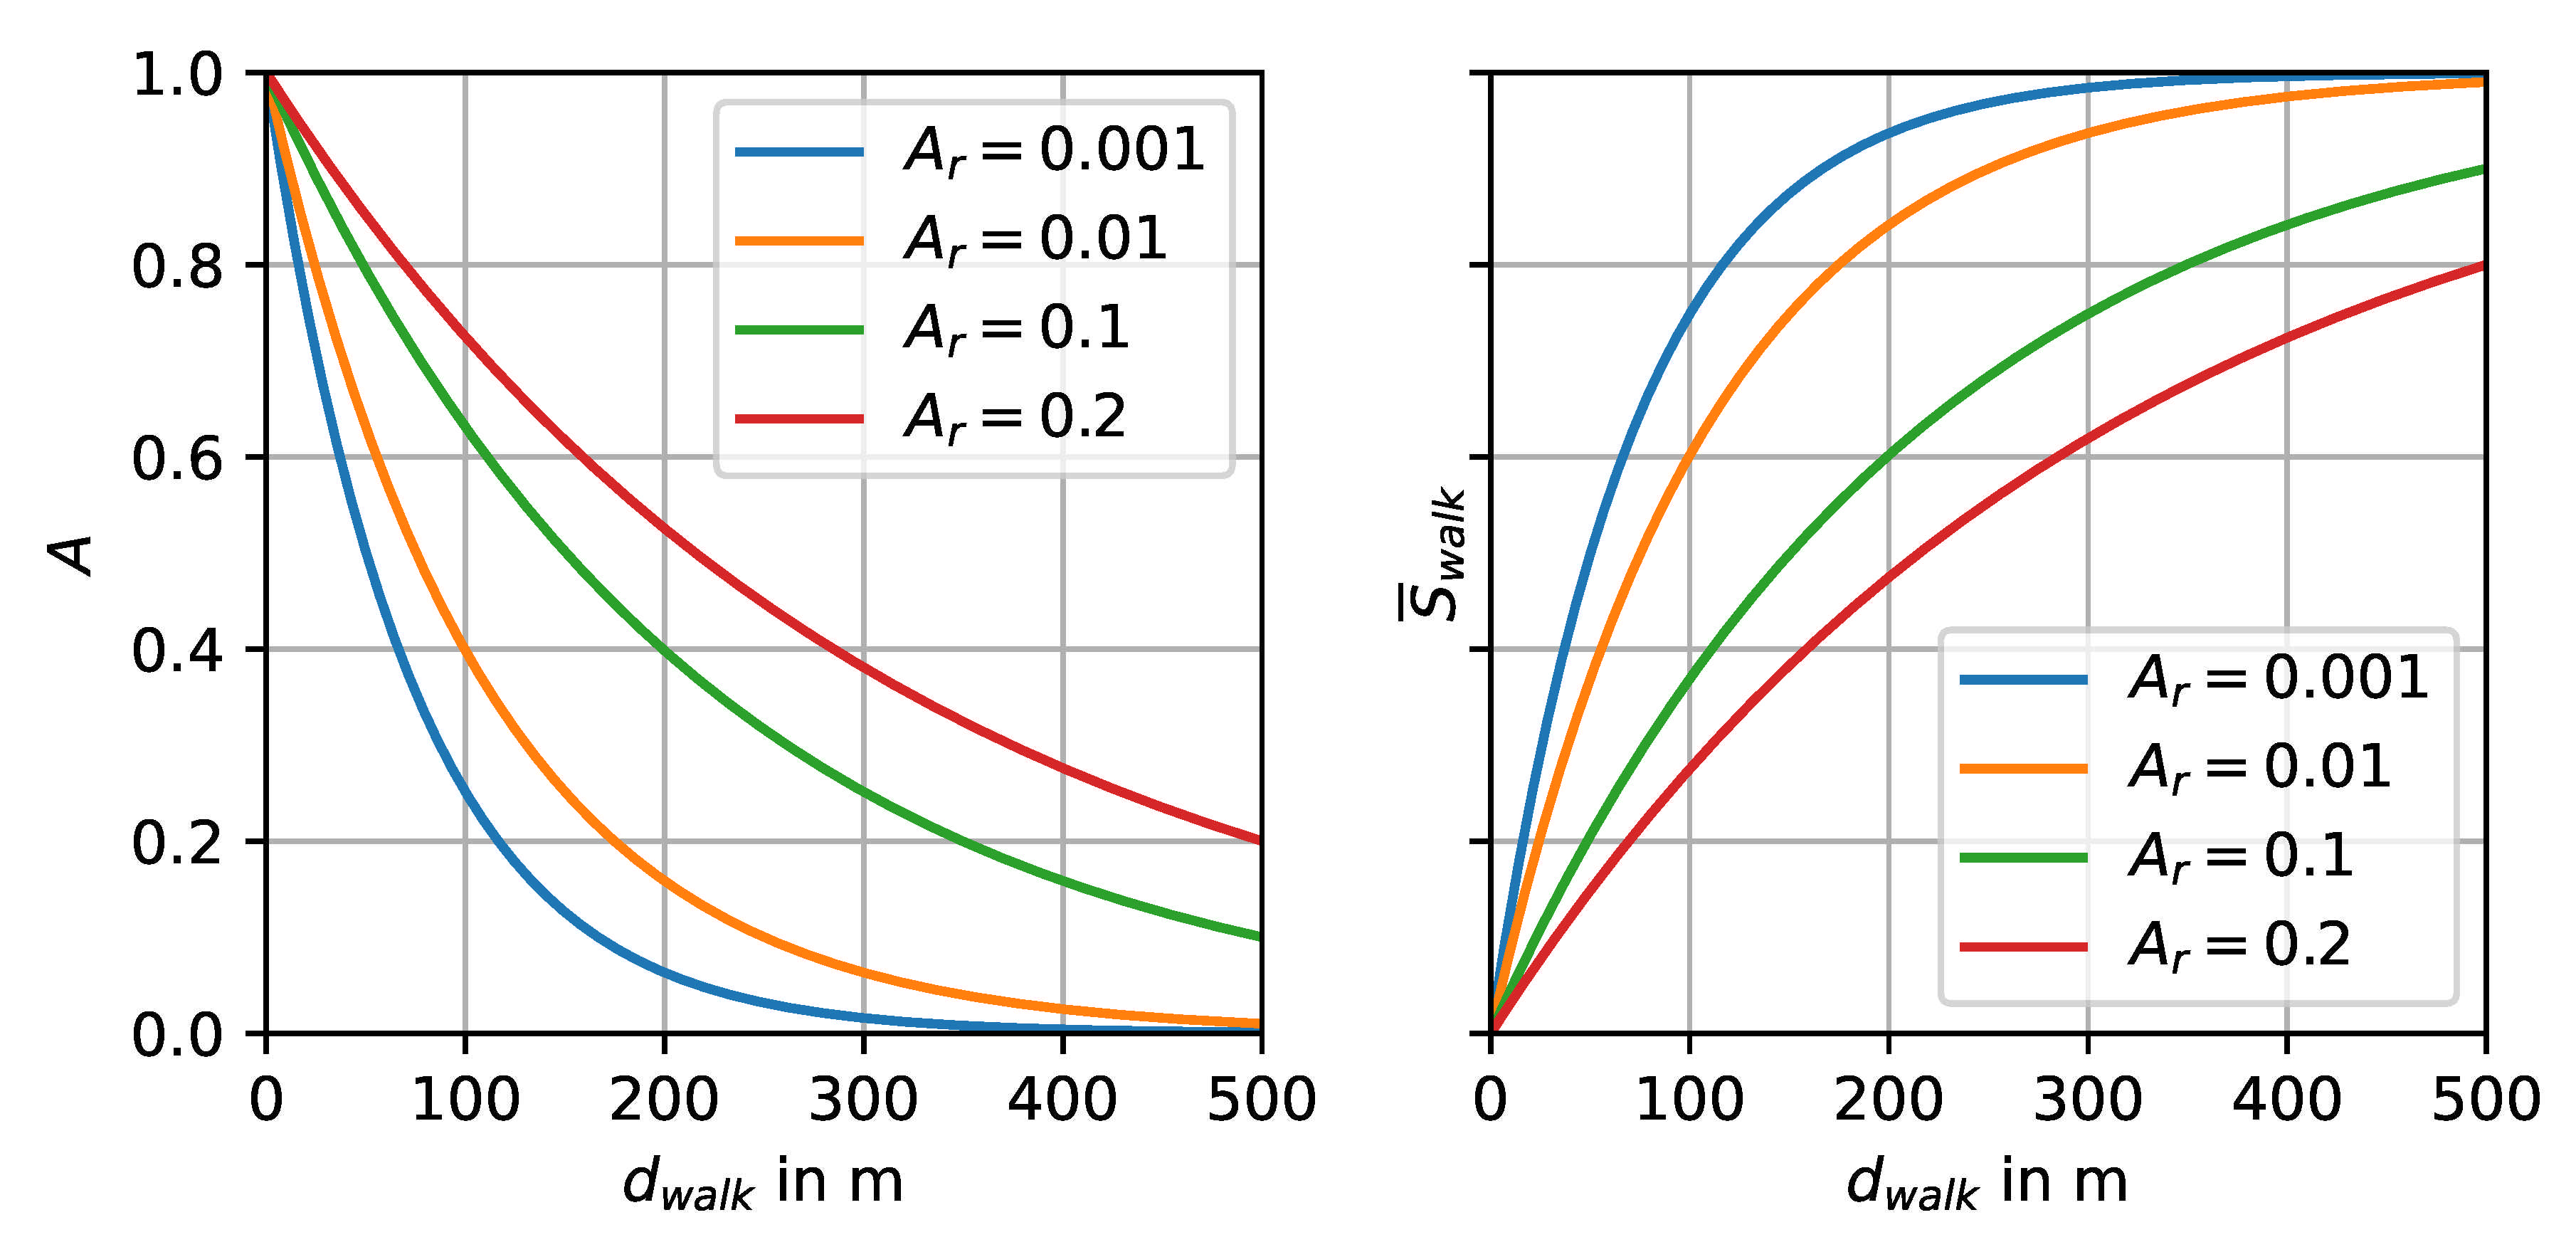
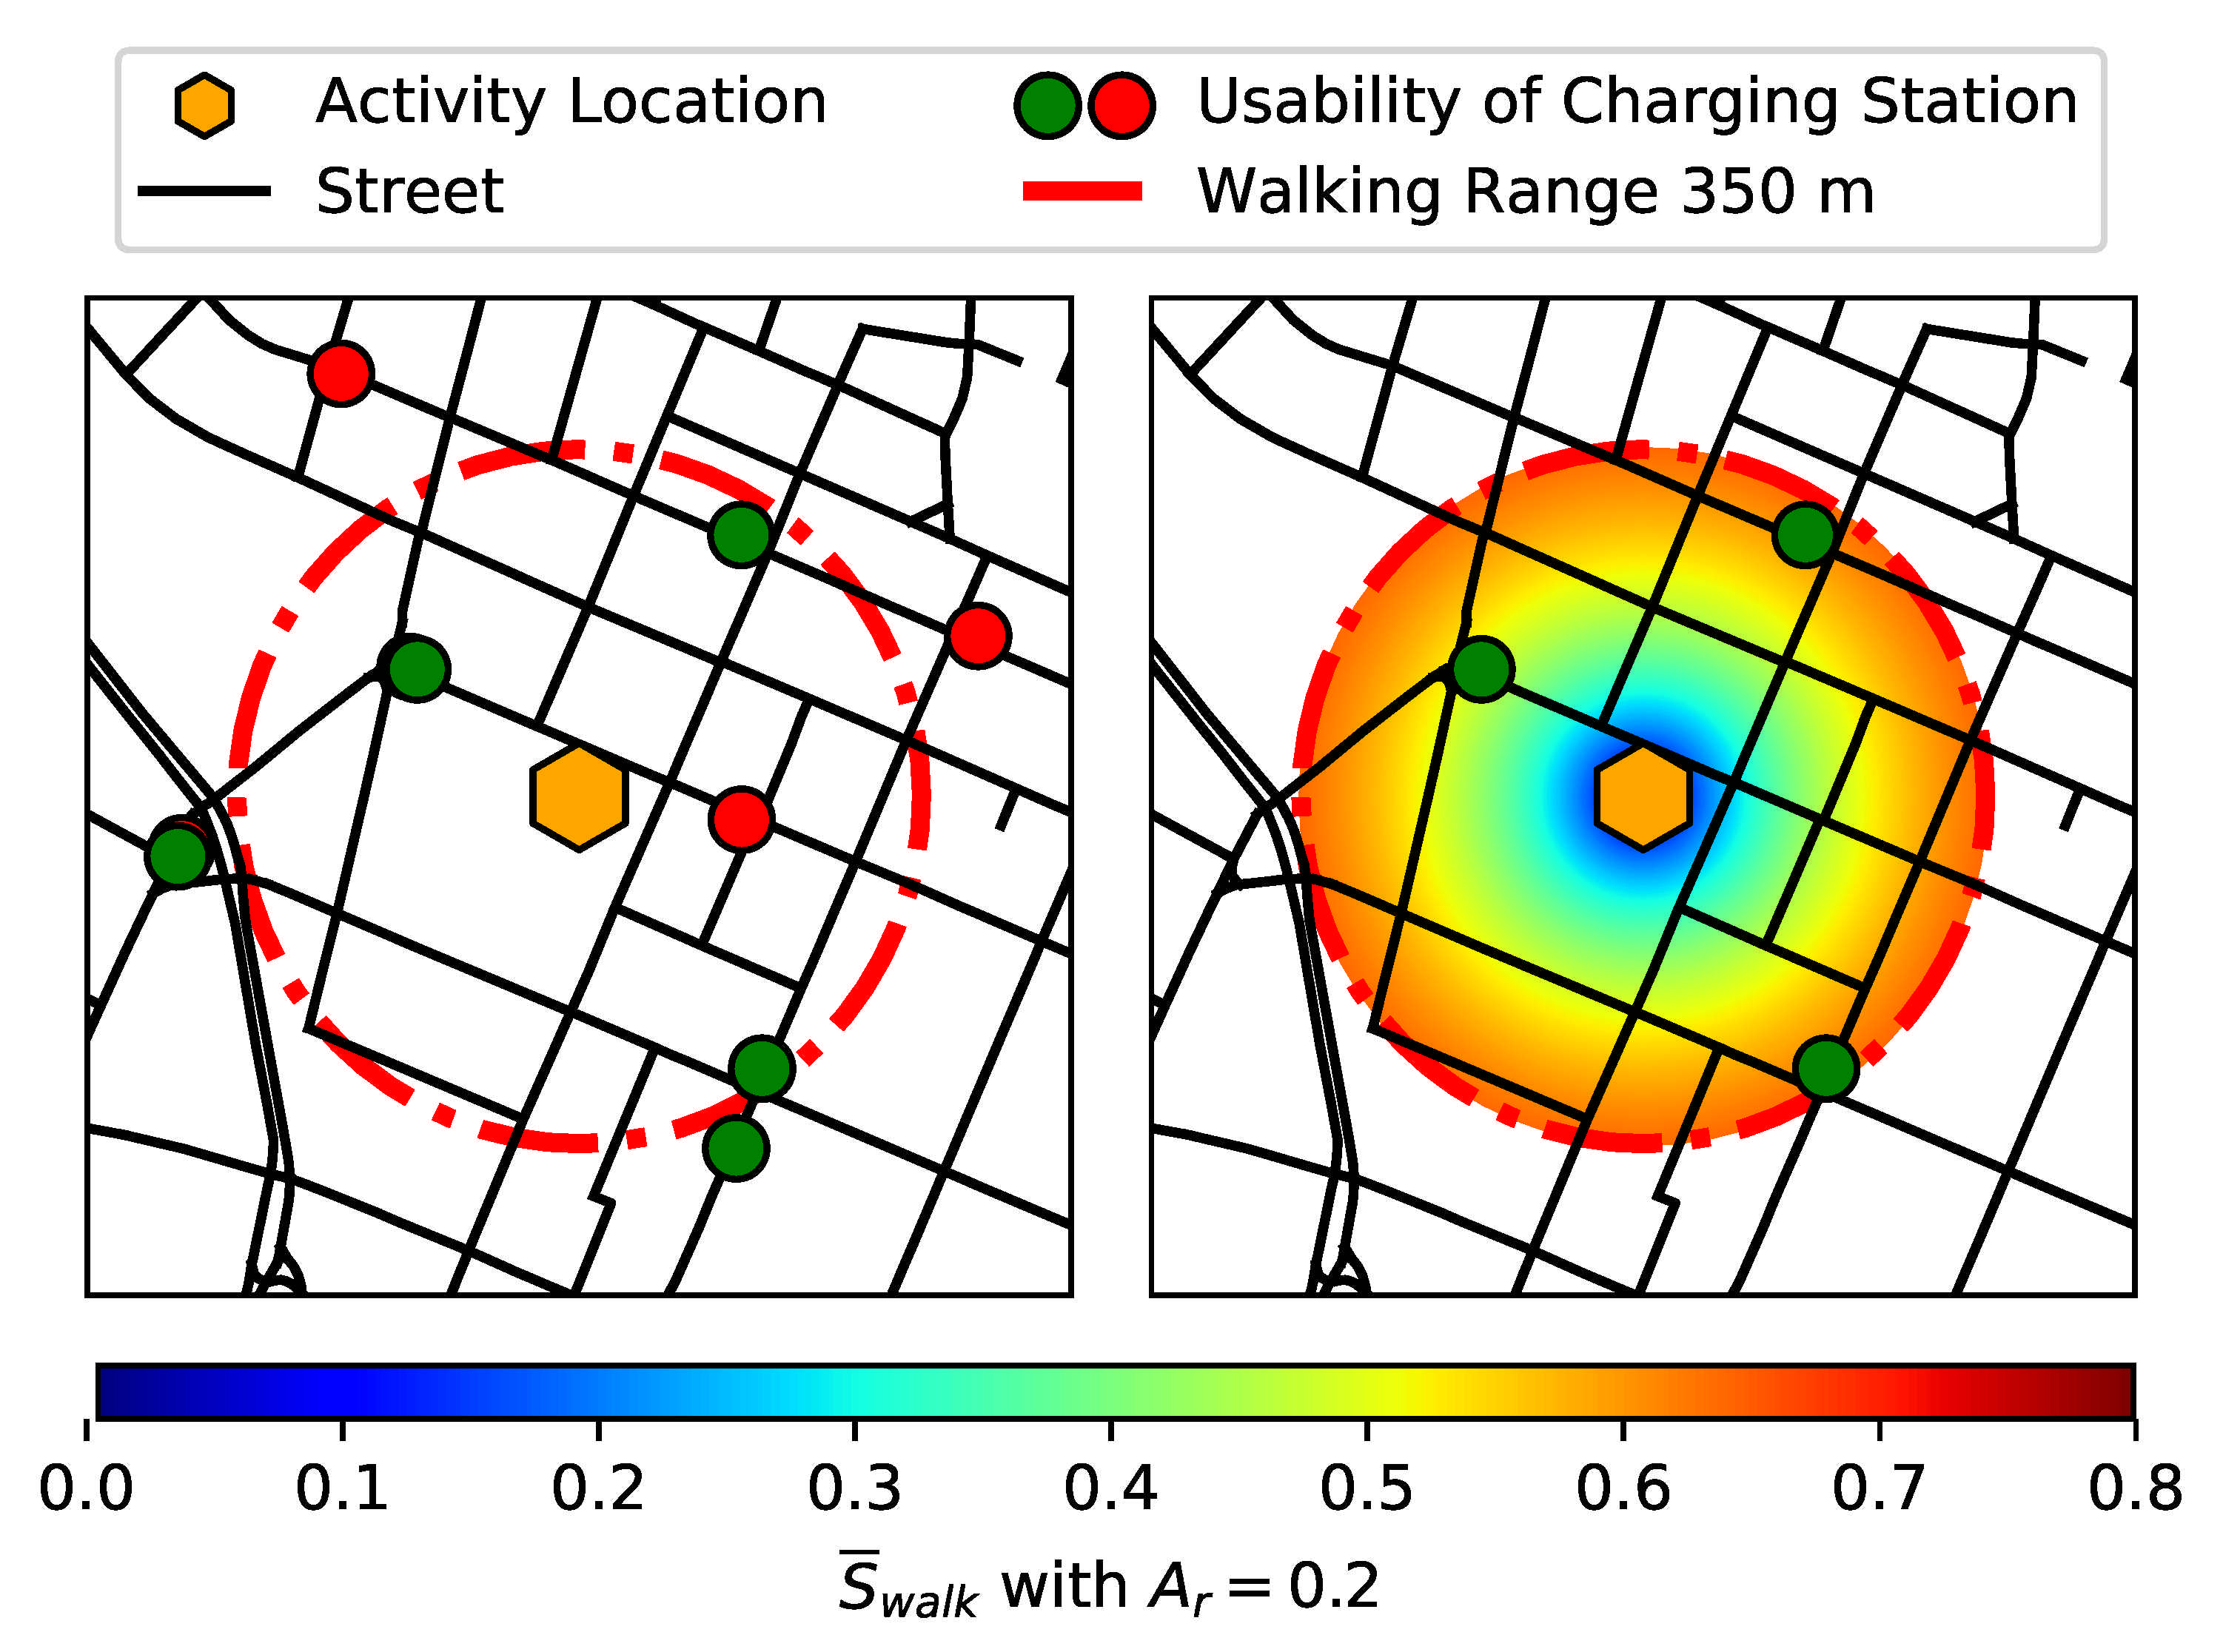
3.2.2. Location Choice
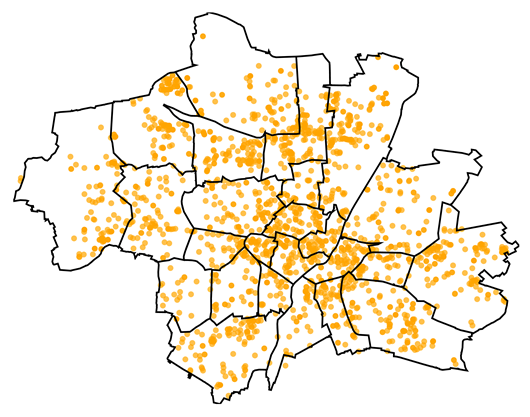
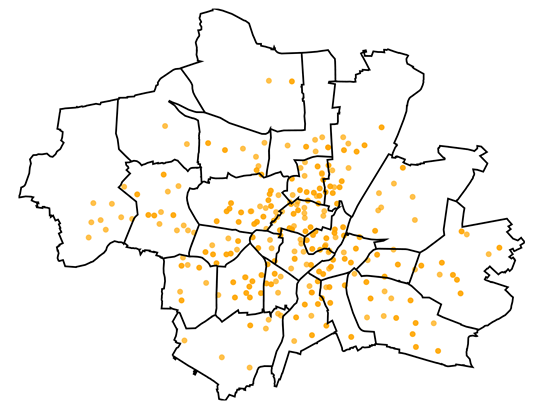
4. Munich Case Study
4.1. Environment
4.2. Simulation Parameters
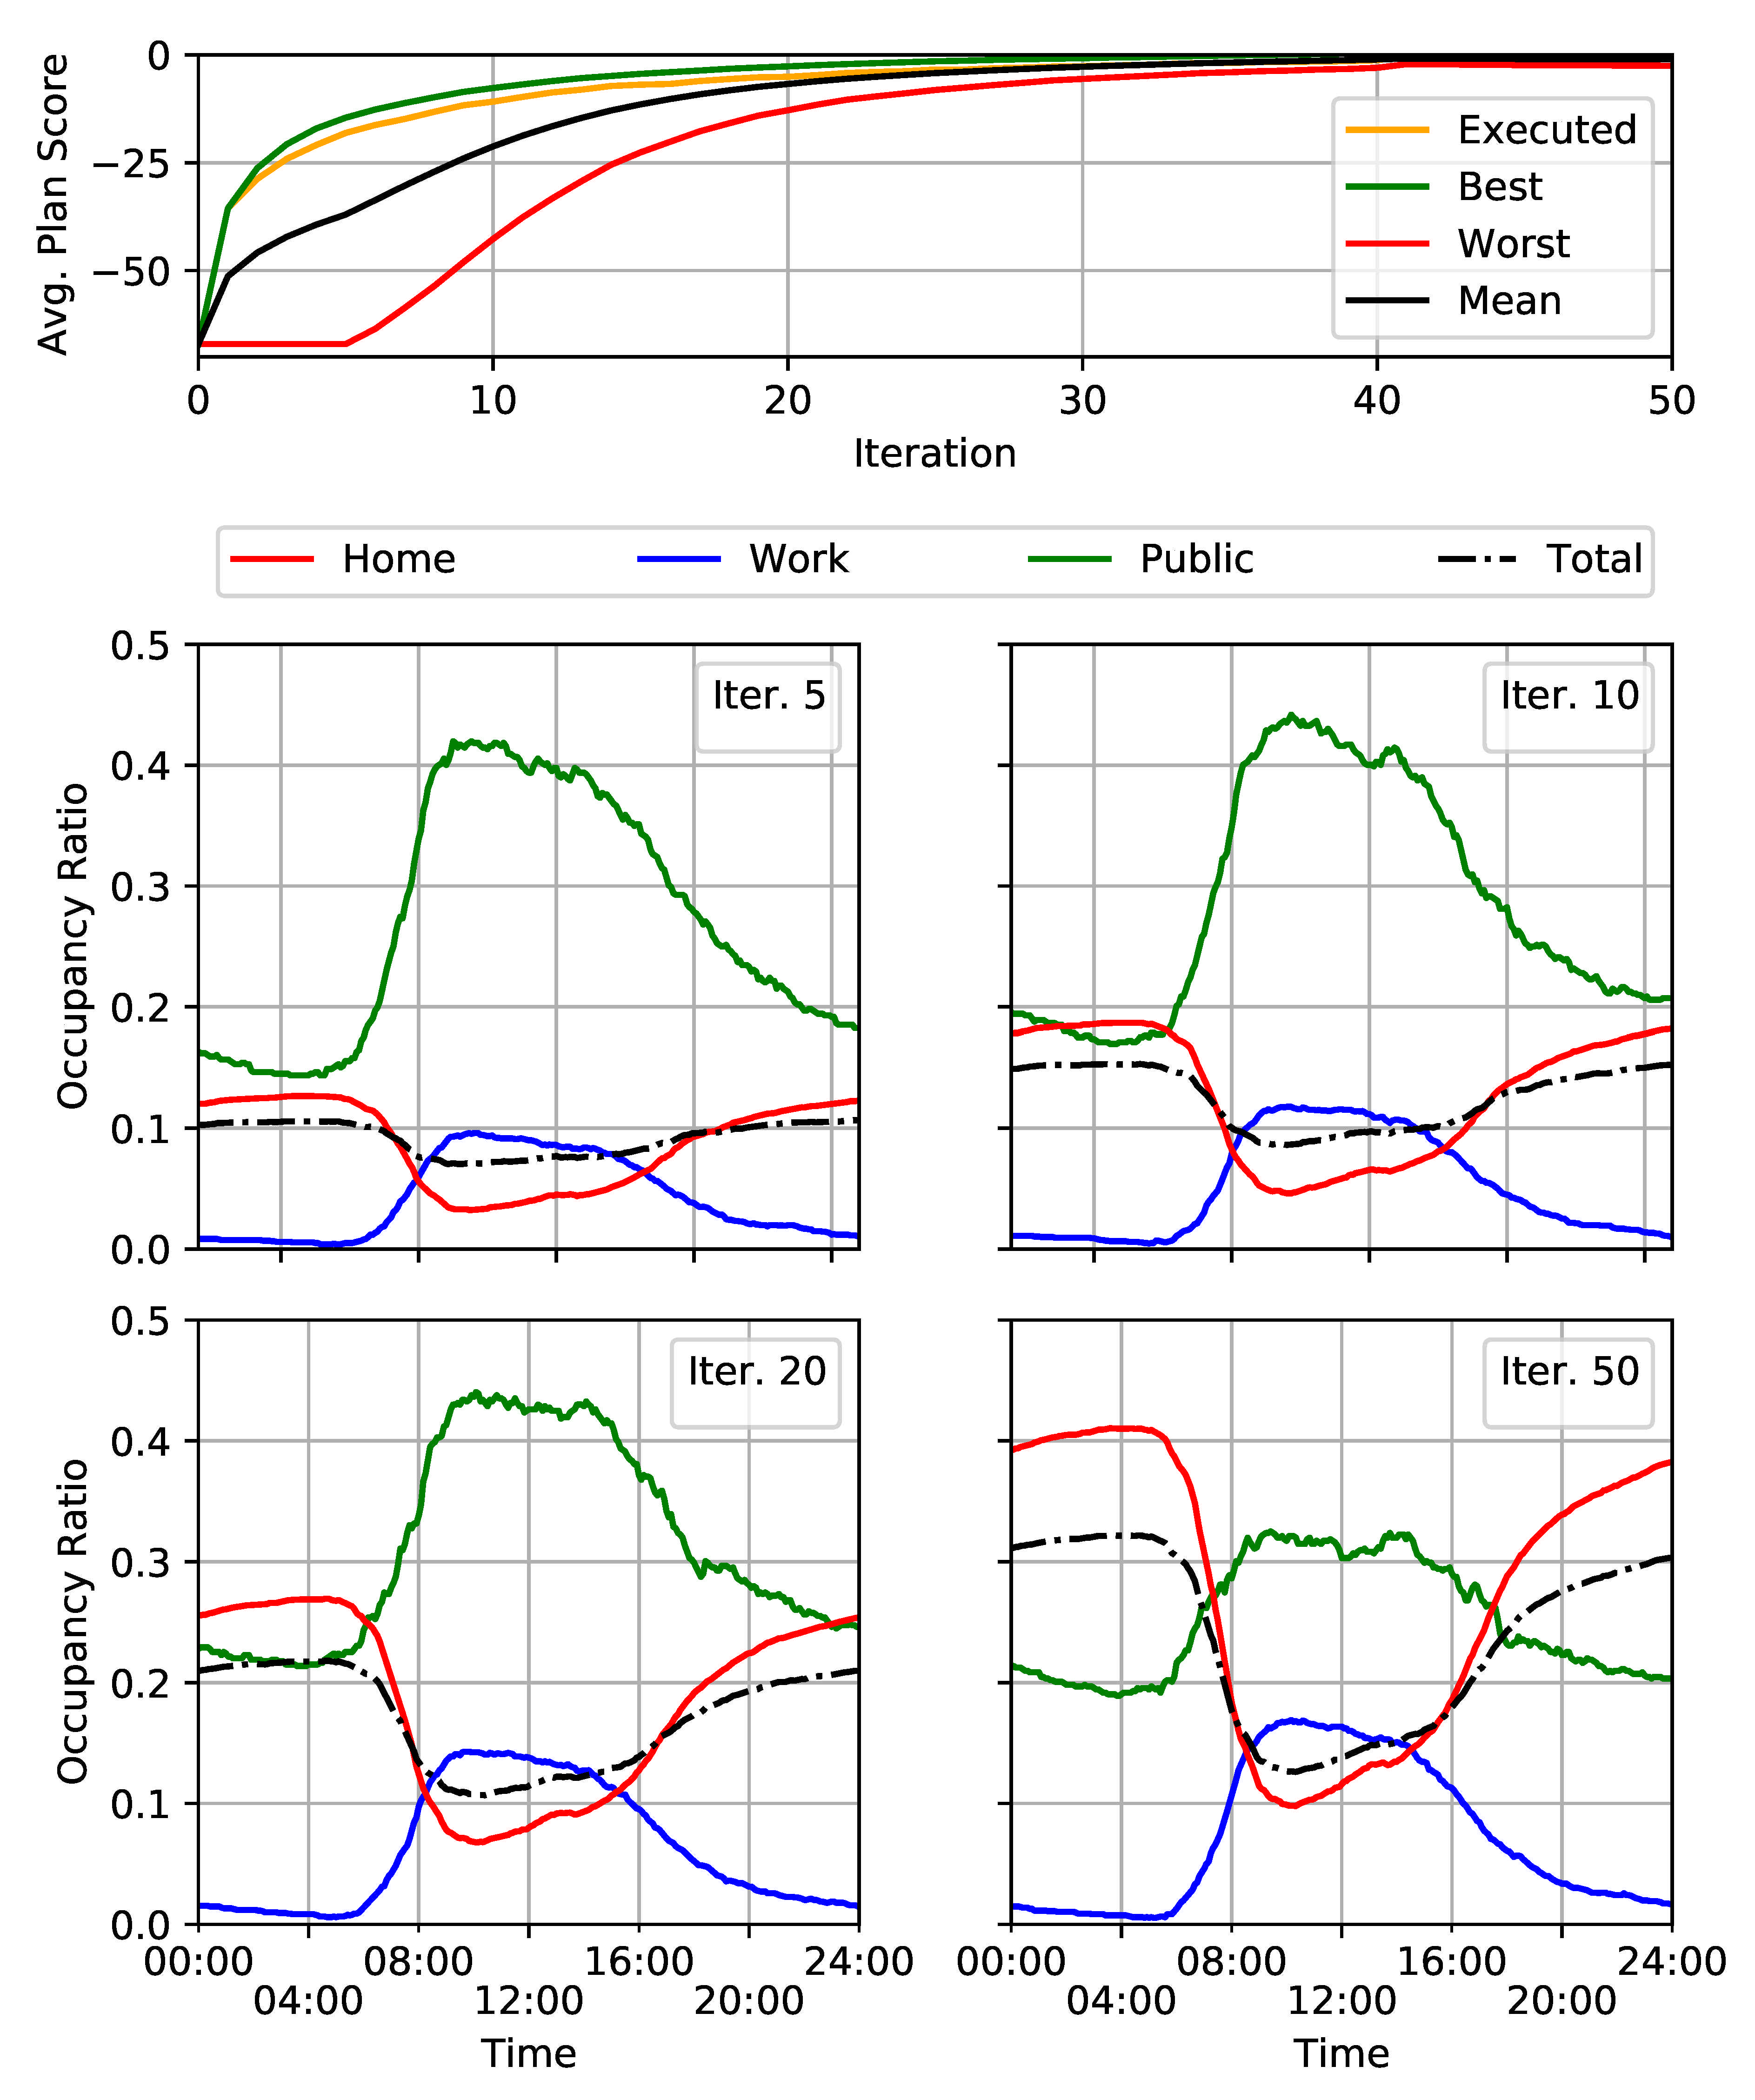
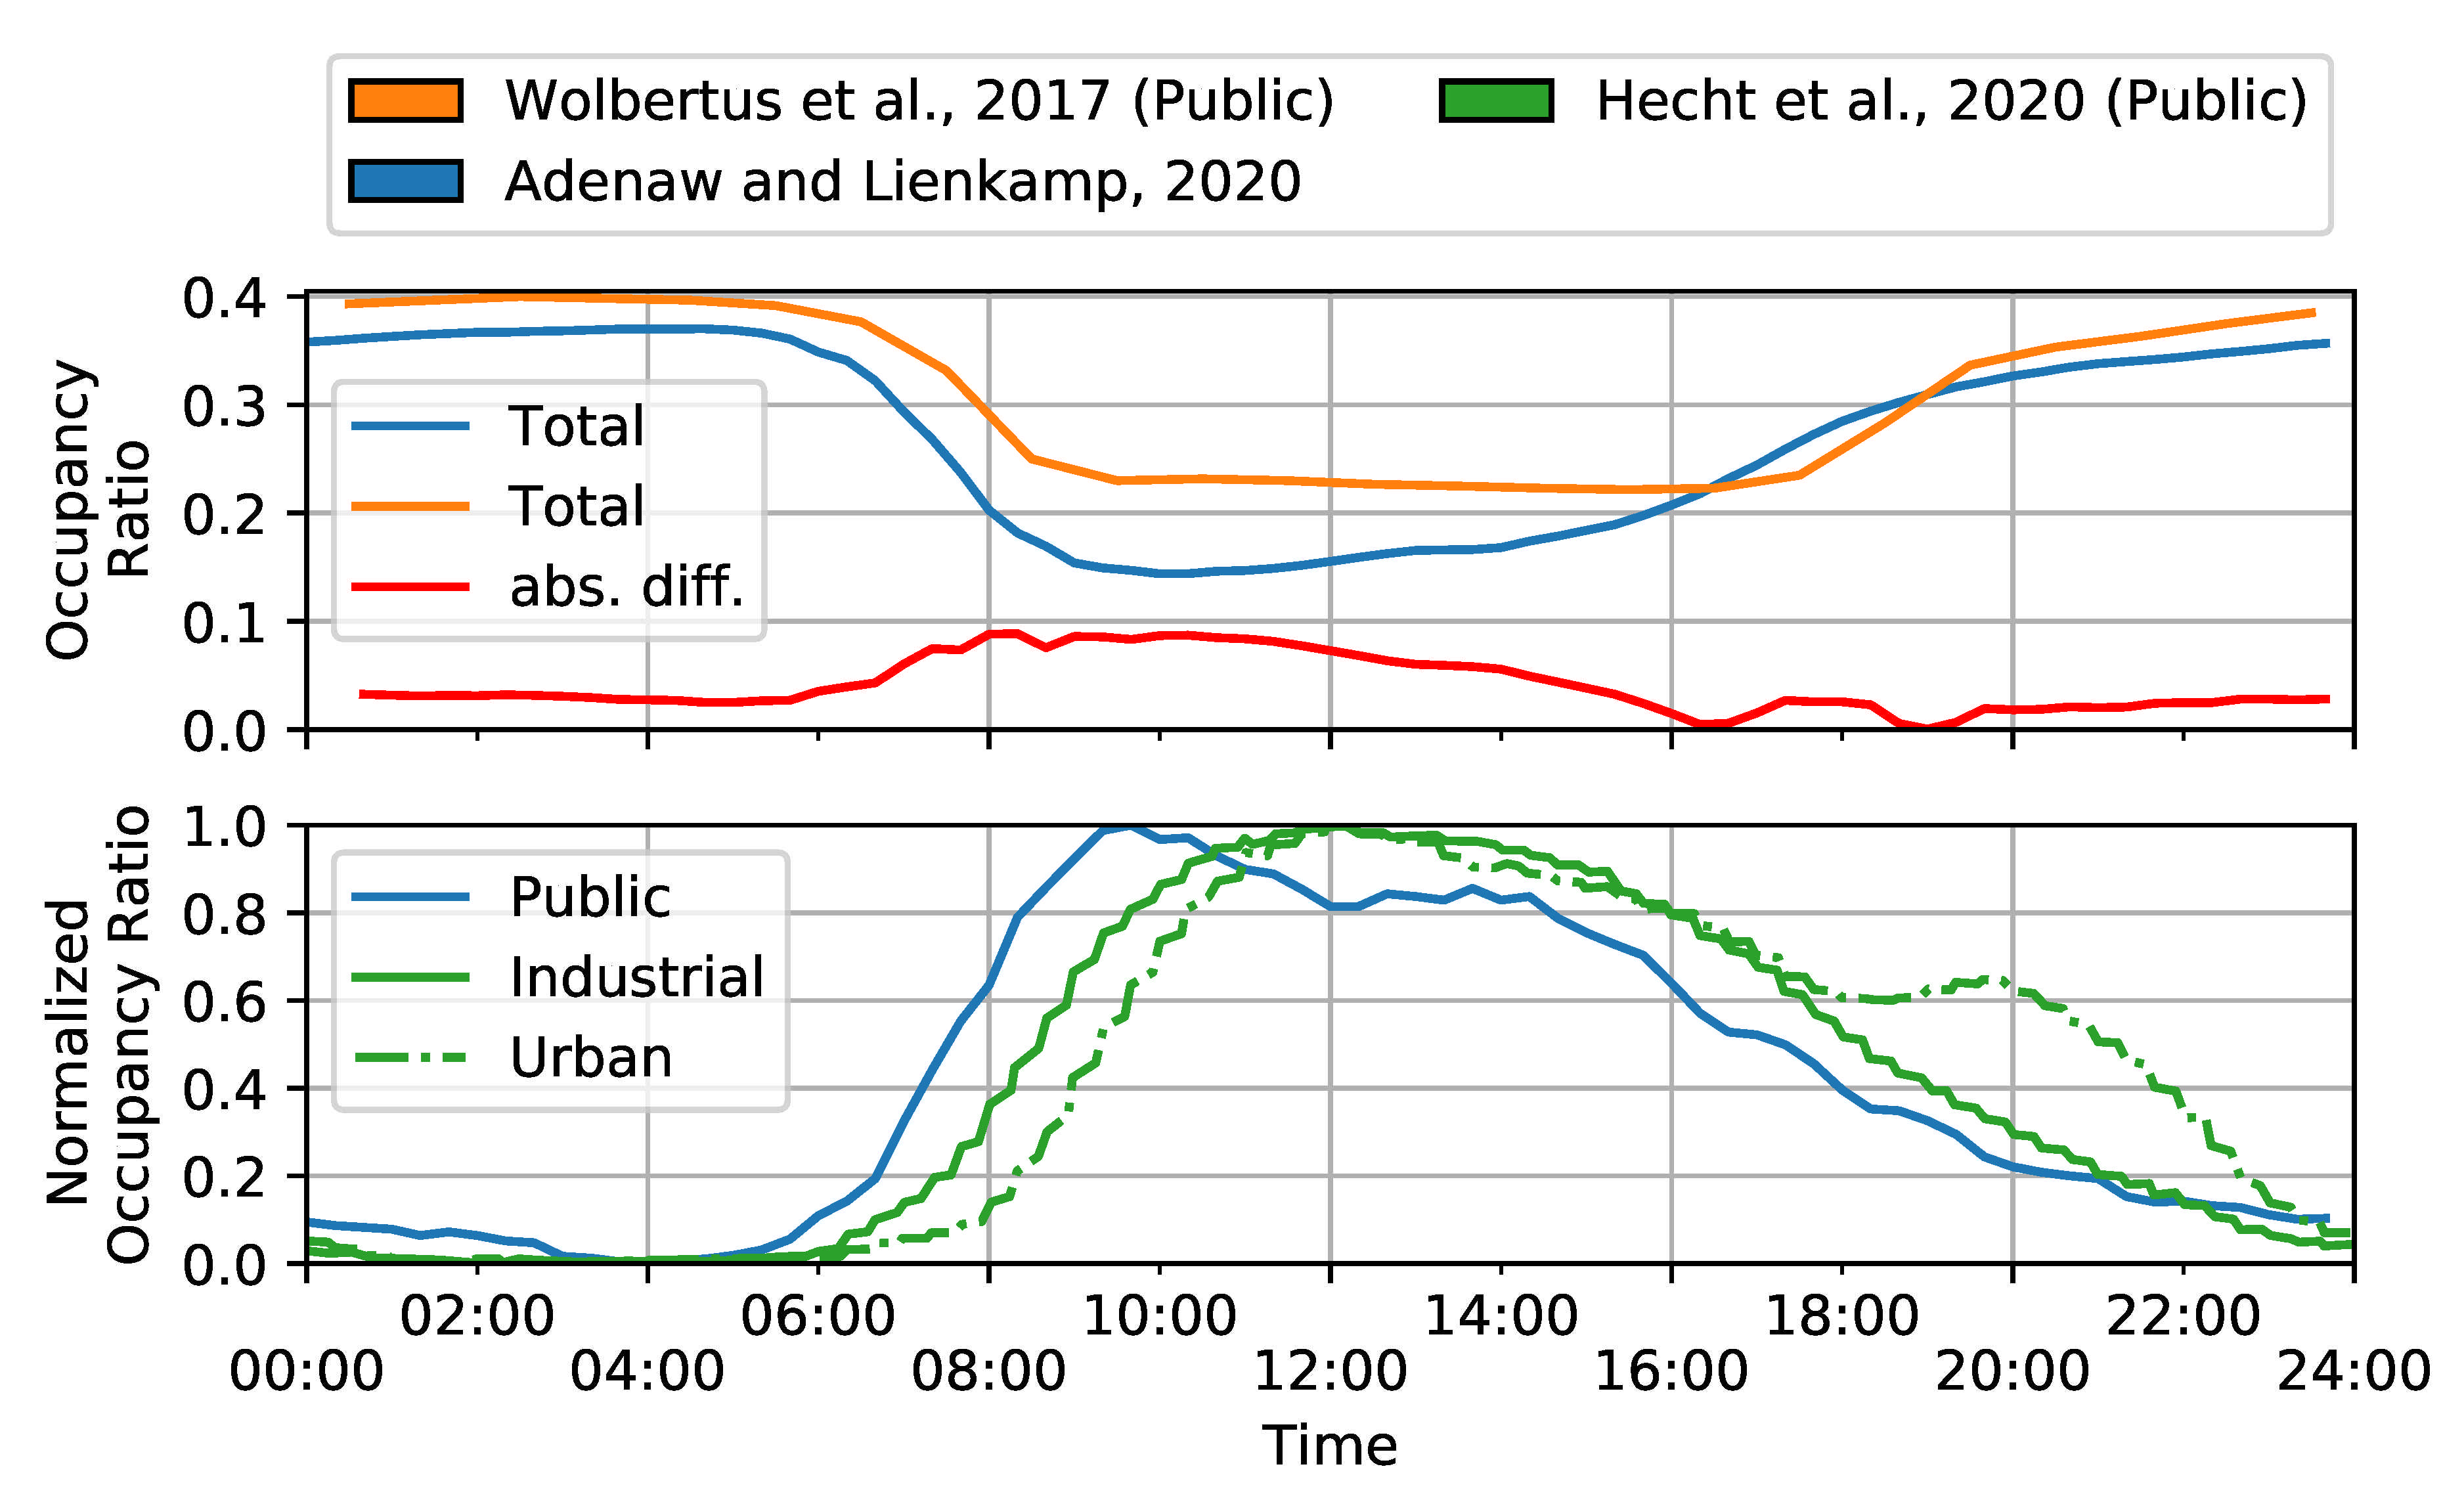
5. Results
6. Discussion and Conclusions
Author Contributions
Funding
Acknowledgments
Conflicts of Interest
Abbreviations
| API | Application Programming Interface |
| BEV | Battery Electric Vehicle |
| BEAM | Behavior, Energy, Autonomy, and Mobility |
| CityMoS | City Mobility Simulator |
| DVU | Driver Vehicle Unit |
| EV-Contrib | Multi Agent Transport Simulation (MATSim) Electric Vehicle Contribution |
| MATSim | Multi Agent Transport Simulation |
| MiTO | Microscopic Transportation Orchestrator |
| UrbanEV-Contrib | Multi Agent Transport Simulation (MATSim) Urban Electric Vehicle |
| Contribution | |
| SOC | State of Charge |
Appendix A


References
- United Nations. Paris Agreement: 2015; United Nations: New York, NY, USA, 2015. [Google Scholar]
- European Union. Regulation No 443/2009 of the European Parliament and of the Council. Off. J. Eur. Union L 2009, 140, 1–15. [Google Scholar]
- Mersky, A.C.; Sprei, F.; Samaras, C.; Qian, Z. Effectiveness of incentives on electric vehicle adoption in Norway. Transp. Res. Part Transp. Environ. 2016, 46, 56–68. [Google Scholar] [CrossRef]
- Hardman, S.; Jenn, A.; Tal, G.; Axsen, J.; Beard, G.; Daina, N.; Figenbaum, E.; Jakobsson, N.; Jochem, P.; Kinnear, N.; et al. A review of consumer preferences of and interactions with electric vehicle charging infrastructure. Transp. Res. Part Transp. Environ. 2018, 62, 508–523. [Google Scholar] [CrossRef]
- Anderson, J.E.; Lehne, M.; Hardinghaus, M. What electric vehicle users want: Real-world preferences for public charging infrastructure. Int. J. Sustain. Transp. 2018, 12, 341–352. [Google Scholar] [CrossRef]
- Pagany, R.; Ramirez Camargo, L.; Dorner, W. A review of spatial localization methodologies for the electric vehicle charging infrastructure. Int. J. Sustain. Transp. 2019, 13, 433–449. [Google Scholar] [CrossRef]
- Deb, S.; Tammi, K.; Kalita, K.; Mahanta, P. Review of recent trends in charging infrastructure planning for electric vehicles. Wiley Interdiscip. Rev. Energy Environ. 2018, 7, e306. [Google Scholar] [CrossRef]
- Wolbertus, R.; Kroesen, M.; van den Hoed, R.; Chorus, C. Fully charged: An empirical study into the factors that influence connection times at EV-charging stations. Energy Policy 2018, 123, 1–7. [Google Scholar] [CrossRef]
- Hardinghaus, M.; Seidel, C.; Anderson, J.E. Estimating Public Charging Demand of Electric Vehicles. Sustainability 2019, 11, 5925. [Google Scholar] [CrossRef]
- Sweda, T.; Klabjan, D. An agent-based decision support system for electric vehicle charging infrastructure deployment. In Proceedings of the 2011 IEEE Vehicle Power and Propulsion Conference, Chicago, IL, USA, 6–9 September 2011; pp. 1–5. [Google Scholar] [CrossRef]
- Pagani, M.; Korosec, W.; Chokani, N.; Abhari, R.S. User behaviour and electric vehicle charging infrastructure: An agent-based model assessment. Appl. Energy 2019, 254, 113680. [Google Scholar] [CrossRef]
- Jäger, B.; Hahn, C.; Lienkamp, M. (Eds.) An Evolutionary Algorithm for an Agent-Based Fleet Simulation Focused on Electric Vehicles; IEEE: Piscataway, NJ, USA, 2016. [Google Scholar] [CrossRef]
- Bi, R.; Xiao, J.; Viswanathan, V.; Knoll, A. Influence of Charging Behaviour Given Charging Station Placement at Existing Petrol Stations and Residential Car Park Locations in Singapore. Procedia Comput. Sci. 2016, 80, 335–344. [Google Scholar] [CrossRef]
- Bi, R.; Xiao, J.; Pelzer, D.; Ciechanowicz, D.; Eckhoff, D.; Knoll, A. A Simulation-Based Heuristic for City-Scale Electric Vehicle Charging Station Placement; IEEE: Piscataway, NJ, USA, 2017. [Google Scholar] [CrossRef]
- Chaudhari, K.; Kandasamy, N.K.; Krishnan, A.; Ukil, A.; Gooi, H.B. Agent-Based Aggregated Behavior Modeling for Electric Vehicle Charging Load. IEEE Trans. Ind. Inform. 2019, 15, 856–868. [Google Scholar] [CrossRef]
- Adenaw, L.; Lienkamp, M. A Model for the Data-based Analysis and Design of Urban Public Charging Infrastructure. In Proceedings of the 2020 Fifteenth International Conference on Ecological Vehicles and Renewable Energies (EVER), Monaco, Monaco, 10–12 September 2020; pp. 1–14. [Google Scholar] [CrossRef]
- Hidalgo, P.; Trippe, A.E.; Lienkamp, M.; Hamacher, T. Mobility Model for the Estimation of the Spatiotemporal Energy Demand of Battery Electric Vehicles in Singapore. In Proceedings of the 2015 IEEE 18th International Conference on Intelligent Transportation Systems, Las Palmas, Spain, 15–18 September 2015; pp. 578–583. [Google Scholar] [CrossRef]
- Viswanathan, V.; Zehe, D.; Ivanchev, J.; Pelzer, D.; Knoll, A.; Aydt, H. Simulation-assisted exploration of charging infrastructure requirements for electric vehicles in urban environments. J. Comput. Sci. 2016, 12, 1–10. [Google Scholar] [CrossRef]
- Marquez-Fernandez, F.J.; Bischoff, J.; Domingues-Olavarria, G.; Alakula, M. Using Multi-Agent Transport Simulations to Assess the Impact of EV Charging Infrastructure Deployment. Transp. Res. Part Policy Pract. 2015, 82, 1–6. [Google Scholar] [CrossRef]
- Klügl, F.; Bazzan, A.L.C. Agent-Based Modeling and Simulation. AI Mag. 2012, 33, 29. [Google Scholar] [CrossRef]
- Holmgren, J.; Ramstedt, L.; Davidsson, P.; Persson, J.A. Multi-Agent-Based Simulation for Analysis of Transport Policy and Infrastructure Measures. Lect. Notes Comput. Sci. 2012, 7580, 1–15. [Google Scholar] [CrossRef]
- ElBanhawy, E.Y.; Dalton, R.; Anumba, C. The Agent Based Modeling of e-mobility. In Proceedings of the 2014 IEEE Transportation Electrification Conference and Expo (ITEC), Dearborn, MI, USA, 15–18 June 2014; pp. 1–6. [Google Scholar] [CrossRef]
- MATSim Community. MATSim: Multi-Agent Transport Simulation. Available online: https://matsim.org/ (accessed on 15 October 2020).
- MATSim Community. Matsim-Libs: Github Repository. Available online: https://github.com/matsim-org/matsim-libs (accessed on 15 October 2020).
- MATSim Community. Ev-Contrib: Github Repository. Available online: https://github.com/matsim-org/matsim-libs/tree/master/contribs/ev (accessed on 30 January 2021).
- Jäger, B.; Agua, F.M.M.; Lienkamp, M. Agent-Based Simulation of a Shared, Autonomous and Electric on-Demand Mobility Solution; IEEE: Piscataway, NJ, USA, 2017. [Google Scholar] [CrossRef]
- Jäger, B.; Wittmann, M.; Lienkamp, M. Agent-based Modeling and Simulation of Electric Taxi Fleets. In Proceedings of the 6th Conference on Future Automotive Technology (CoFAT), Fürstenfeldbrück, Germany, 9–10 May 2017; pp. 1–9. [Google Scholar]
- Bischoff, J.; Maciejewski, M. Agent-based Simulation of Electric Taxicab Fleets. Transp. Res. Procedia 2014, 4, 191–198. [Google Scholar] [CrossRef]
- Zhuge, C.; Shao, C. Agent-Based Modelling of Locating Public Transport Facilities for Conventional and Electric Vehicles. Netw. Spat. Econ. 2018, 18, 875–908. [Google Scholar] [CrossRef]
- Bischoff, J.; Marquez-Fernandez, F.J.; Domingues-Olavarria, G.; Maciejewski, M.; Nagel, K. Impacts of vehicle fleet electrification in Sweden—A simulation-based assessment of long-distance trips. In Proceedings of the 2019 IEEE Intelligent Transportation Systems Conference (ITSC), Cracow, Poland, 5–7 June 2019. [Google Scholar] [CrossRef]
- Zhang, H.; Sheppard, C.J.; Lipman, T.E.; Zeng, T.; Moura, S.J. Charging infrastructure demands of shared-use autonomous electric vehicles in urban areas. Transp. Res. Part Transp. Environ. 2020, 78, 102210. [Google Scholar] [CrossRef]
- BEAM: Behavior, Energy, Autonomy, and Mobility. Available online: https://github.com/LBNL-UCB-STI/beam (accessed on 27 October 2020).
- CityMoS: City Mobility Simulator. Available online: https://www.tum-create.edu.sg/research/project/citymos-city-mobility-simulator (accessed on 27 October 2020).
- Horni, A.; Nagel, K.; Axhausen, K.W. The Multi-Agent Transport Simulation MATSim; Ubiquity Press: London, UK, 2016. [Google Scholar] [CrossRef]
- Franke, T.; Krems, J.F. Understanding charging behaviour of electric vehicle users. Transp. Res. Part Traffic Psychol. Behav. 2013, 21, 75–89. [Google Scholar] [CrossRef]
- Langbroek, J.H.; Franklin, J.P.; Susilo, Y.O. When do you charge your electric vehicle? A stated adaptation approach. Energy Policy 2017, 108, 565–573. [Google Scholar] [CrossRef]
- Morrissey, P.; Weldon, P.; O’Mahony, M. Future standard and fast charging infrastructure planning: An analysis of electric vehicle charging behaviour. Energy Policy 2016, 89, 257–270. [Google Scholar] [CrossRef]
- GNU General Public License, Version 3. 2007. Available online: http://www.gnu.org/licenses/gpl.html (accessed on 23 October 2020).
- Geurs, K.T.; van Wee, B. Accessibility evaluation of land-use and transport strategies: Review and research directions. J. Transp. Geogr. 2004, 12, 127–140. [Google Scholar] [CrossRef]
- Kraftfahrt-Bundesamt. Fahrzeug-Bestand nach Zulassungsbezirken und Gemeinden. Available online: https://www.kba.de/DE/Statistik/Fahrzeuge/Bestand/ZulassungsbezirkeGemeinden/b_zulassungsbezirke_inhalt.html?nn=2601598 (accessed on 18 November 2020).
- Geofabrik.de. OpenStreetMap Data Extracts. Available online: https://download.geofabrik.de/ (accessed on 30 January 2021).
- Philipsen, R.; Brell, T.; Brost, W.; Eickels, T.; Ziefle, M. Running on empty—Users’ charging behavior of electric vehicles versus traditional refueling. Transp. Res. Part F Traffic Psychol. Behav. 2018, 59, 475–492. [Google Scholar] [CrossRef]
- Patt, A.; Aplyn, D.; Weyrich, P.; van Vliet, O. Availability of private charging infrastructure influences readiness to buy electric cars. Transp. Res. Part A Policy Pract. 2019, 125, 1–7. [Google Scholar] [CrossRef]
- Westin, K.; Jansson, J.; Nordlund, A. The importance of socio-demographic characteristics, geographic setting, and attitudes for adoption of electric vehicles in Sweden. Travel Behav. Soc. 2018, 13, 118–127. [Google Scholar] [CrossRef]
- ADAC—Allgemeiner Deutscher Automobilclub e.V. Autokatalog: Nissan Leaf. Available online: https://www.adac.de/rund-ums-fahrzeug/autokatalog/marken-modelle/nissan/leaf/ze1/287894/ (accessed on 6 November 2020).
- ADAC—Allgemeiner Deutscher Automobilclub e.V. Autokatalog: Renault Zoe. Available online: https://www.adac.de/rund-ums-fahrzeug/autokatalog/marken-modelle/renault/zoe/1generation-facelift/301233/ (accessed on 6 November 2020).
- ADAC—Allgemeiner Deutscher Automobilclub e.V. Autokatalog: Tesla Model 3. Available online: https://www.adac.de/rund-ums-fahrzeug/autokatalog/marken-modelle/tesla/model-3/1generation/308033/ (accessed on 6 November 2020).
- ADAC—Allgemeiner Deutscher Automobilclub e.V. Autokatalog: Audi e-tron. Available online: https://www.adac.de/rund-ums-fahrzeug/autokatalog/marken-modelle/audi/e-tron/1generation/309078/ (accessed on 6 November 2020).
- Moeckel, R. Constraints in household relocation: Modeling land-use/transport interactions that respect time and monetary budgets. J. Transp. Land Use 2013. [Google Scholar] [CrossRef]
- Professorship of Modeling Spatial Mobility. SILO: Github Repository. Available online: https://github.com/msmobility/silo (accessed on 6 November 2020).
- Moeckel, R.; Kuehnel, N.; Llorca, C.; Moreno, A.T.; Rayaprolu, H. Agent-Based Simulation to Improve Policy Sensitivity of Trip-Based Models. J. Adv. Transp. 2020, 2020, 1902162. [Google Scholar] [CrossRef]
- Professorship of Modeling Spatial Mobility. MiTO: Github Repository. Available online: https://github.com/msmobility/mito (accessed on 6 November 2020).
- Llorca, C.; Amini, S.; Moreno, A.T.; Moeckel, R. Validation of an agent-based travel demand model with floating car data. Transp. Res. Procedia 2019, 37, 242–249. [Google Scholar] [CrossRef]
- Van der waerden, P.; Timmermans, H.; de Bruin-Verhoeven, M. Car drivers’ characteristics and the maximum walking distance between parking facility and final destination. J. Transp. Land Use 2017, 10, 1–11. [Google Scholar] [CrossRef]
- Wolbertus, R.; Hoed, R.v.d. Charging Station Hogging: A Data-Driven Analysis. In Proceedings of the 30th International Electric Vehicle Symposium & Exhibition (EVS30), Stuttgart, Germany, 9–11 October 2017; pp. 1–14. [Google Scholar]
- Funke, S.Á.; Sprei, F.; Gnann, T.; Plötz, P. How much charging infrastructure do electric vehicles need? A review of the evidence and international comparison. Transp. Res. Part D Transp. Environ. 2019, 77, 224–242. [Google Scholar] [CrossRef]
- Hecht, C.; Das, S.; Bussar, C.; Sauer, D.U. Representative, empirical, real-world charging station usage characteristics and data in Germany. eTransportation 2020, 6, 100079. [Google Scholar] [CrossRef]
- Weldon, P.; Morrissey, P.; Brady, J.; O’Mahony, M. An investigation into usage patterns of electric vehicles in Ireland. Transp. Res. Part Transp. Environ. 2016, 43, 207–225. [Google Scholar] [CrossRef]


| Contribution | Charging Behavior | Location Choice | Assumptions and Remarks |
|---|---|---|---|
| [10] Sweda and Klabjan, 2011 | Always charged overnight, otherwise not specified | At home, otherwise not specified | All agents have access to home charging |
| [11] Pagani et al., 2019 | Combined charging behavior and location choice: When SOC ≤ 50%, evaluate charging opportunity with stochastic model based on available charger types (public, home, work) and distances | End of charging depends on user preference: (i) Leave after completion of charging (ii) Stay plugged for buffer time (iii) Move vehicle after work | |
| [12] Jäger et al., 2016 | Evolutionary algorithm considering plan feasibility | Nearest | Taxi use case Charge up to 80% SOC or up to 100% in scheduled breaks |
| [13] Bi et al., 2016 | (i) SOC ≤ threshold (ii) SOC ≤ estimatedTripConsumption + safetyMargin (iii) SOC ≤ estimatedTripConsumption + energyToNearestCSAtDestination | Nearest | Stop charging at 80% SOC Charge at trip destination if charger is available |
| [14] Bi et al., 2017 | As [13] (ii) but with added opportunity charging | Nearest | – |
| [15] Chaudhari et al., 2019 | SOC ≤ threshold or SOC ≤ threshold + estimatedSOCNeed | At destination | Threshold parameters and energy estimation accuracy are person attributes |
| [17] Hidalgo et al., 2015 | Parking and SOC ≤ 30% or parking longer than 2h and SOC ≤ 60% | At destination | – |
| [18] Viswanathan et al., 2016 | None | None | Charging is not explicitly simulated Energy usage is tracked resulting in an energy demand |
| [19] Marquez-Fernandez et al., 2015 | En-route charging, conditions not specified | Not specified | Focus on long-distance journeys along highways BEV are fully-charged in the mornings |
| [26] Jäger et al., 2017 (a) | SOC ≤ threshold | Closest to passenger drop-off | Taxi use case |
| [27] Jäger et al., 2017 (b) | SOC ≤ 6% | Closest to passenger drop-off | Taxi use case Stop charging at 80% SOC Agents are unaware of charging station occupancy and queue up if chargers are taken |
| [28] Bischoff and Maciejewski, 2014 | SOC ≤ 20% or no trip request | Nearest taxi rank | Taxi use case Charge up to 80% SOC BEV are fully-charged in the mornings |
| [29] Zhuge and Shao, 2018 | While parking and when trip cannot be finished | At destination or at nearest en-route charger | Focus on the behavior of facility placing agents |
| [30] Bischoff et al., 2019 | Combined charging behavior and location choice: Minimization of stops and trip duration to finish long-distance travel | Focus on long-distance journeys along highways BEV are fully-charged in the mornings | |
| [31] Zhang et al., 2020 | SOC ≤ threshold | Nearest | – |
| Vehicle | Consumption | Battery Capacity | Maximum C-Rate | Amount |
|---|---|---|---|---|
| Nissan Leaf [45] | /100 | 40 kWh | 1.5 C | 2550 |
| Renault Zoe [46] | /100 | 41 kWh | 1.5 C | 2526 |
| Tesla Model 3 [47] | /100 | 50 kWh | 2.0 C | 2474 |
| Audi e-tron [48] | /100 | kWh | 2.0 C | 2450 |
| Type | Power | Plugs | Stations | Plugs |
|---|---|---|---|---|
| Home | 11 | 1 | 8324 | 8324 |
| Work | 11 | 1 | 2023 | 2023 |
| Public | 22 | 2 | 386 | 772 |
| Total | – | – | 10,733 | 11,119 |
| Parameter | Value | Parameter | Value | Parameter | Value |
|---|---|---|---|---|---|
| 5 | −10.0 | ||||
| 20% | −5.0 | ||||
| 0.3 | 2 | −1.0 | |||
| +1 |
Publisher’s Note: MDPI stays neutral with regard to jurisdictional claims in published maps and institutional affiliations. |
© 2021 by the authors. Licensee MDPI, Basel, Switzerland. This article is an open access article distributed under the terms and conditions of the Creative Commons Attribution (CC BY) license (http://creativecommons.org/licenses/by/4.0/).
Share and Cite
Adenaw, L.; Lienkamp, M. Multi-Criteria, Co-Evolutionary Charging Behavior: An Agent-Based Simulation of Urban Electromobility. World Electr. Veh. J. 2021, 12, 18. https://doi.org/10.3390/wevj12010018
Adenaw L, Lienkamp M. Multi-Criteria, Co-Evolutionary Charging Behavior: An Agent-Based Simulation of Urban Electromobility. World Electric Vehicle Journal. 2021; 12(1):18. https://doi.org/10.3390/wevj12010018
Chicago/Turabian StyleAdenaw, Lennart, and Markus Lienkamp. 2021. "Multi-Criteria, Co-Evolutionary Charging Behavior: An Agent-Based Simulation of Urban Electromobility" World Electric Vehicle Journal 12, no. 1: 18. https://doi.org/10.3390/wevj12010018
APA StyleAdenaw, L., & Lienkamp, M. (2021). Multi-Criteria, Co-Evolutionary Charging Behavior: An Agent-Based Simulation of Urban Electromobility. World Electric Vehicle Journal, 12(1), 18. https://doi.org/10.3390/wevj12010018