Charging and Discharging Strategies of Electric Vehicles: A Survey

 ,
, 
 and
and 
Abstract
1. Introduction
1.1. Motivation and Background
1.2. Literature Review
1.3. Contribution
- Clearly and systematically classifies different charging and discharging strategies
- Presents (in detail) the advantages and barriers as well as positive and negative impacts on power grids of the identified strategies
- Defines new strategies that (up to the date of this review) were not mentioned in the literature
- Rates the strategies based on detailed coverage of multiple aspects of interest
- Comprehensively identifies the optimization constraints of charging/discharging strategies as covered in the literature
- Provides recommendations on the suitability of each strategy for specific applications
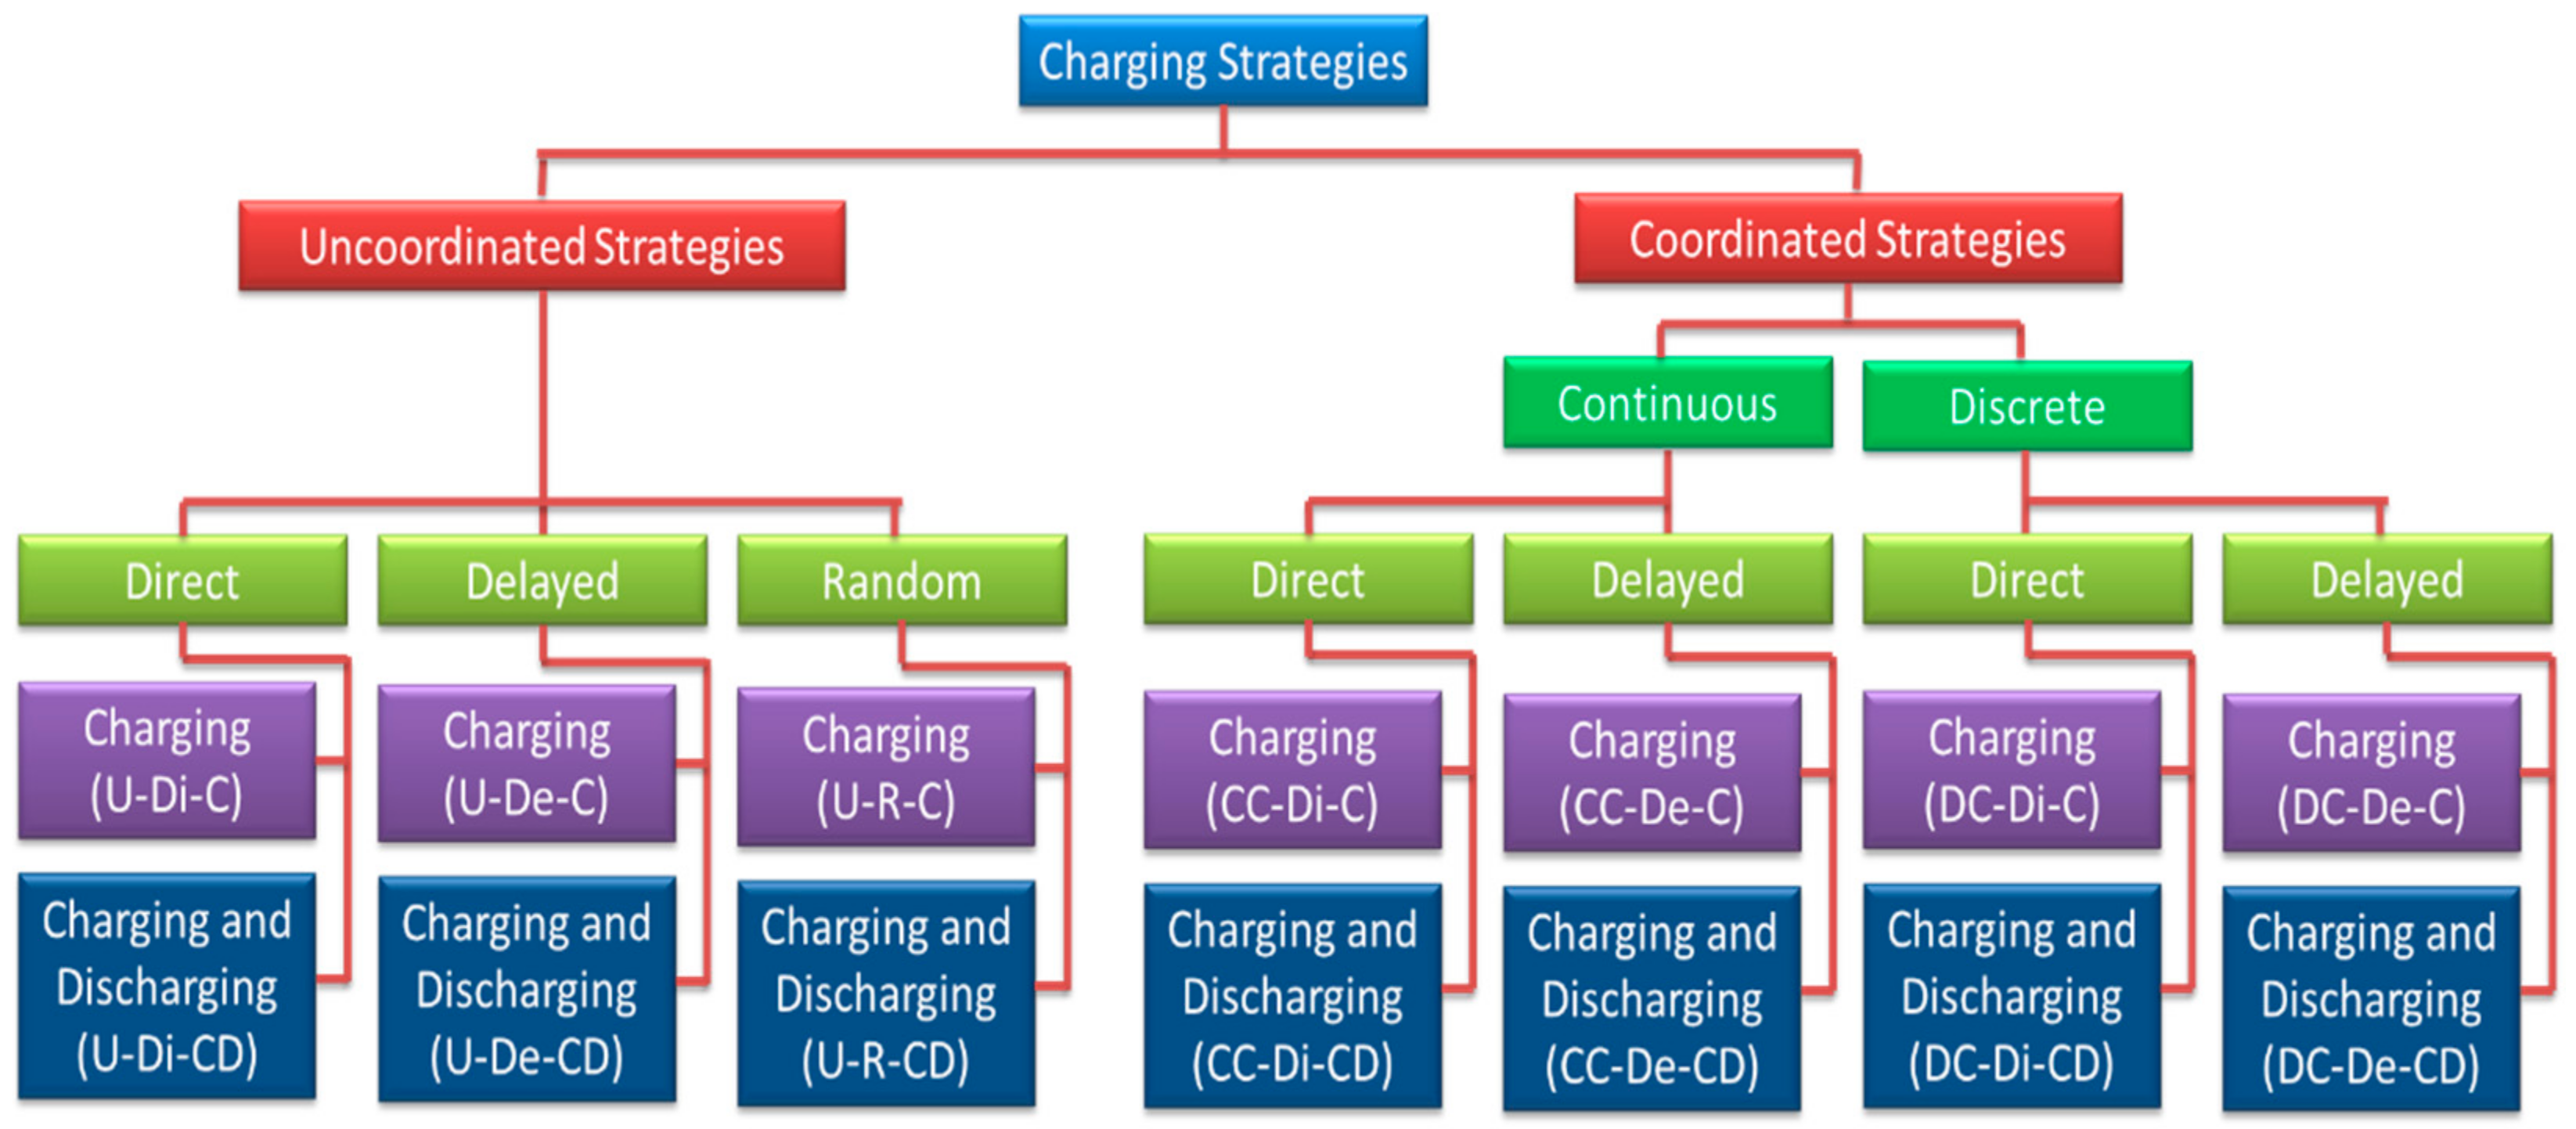
2. Categorizing All Charging Strategies
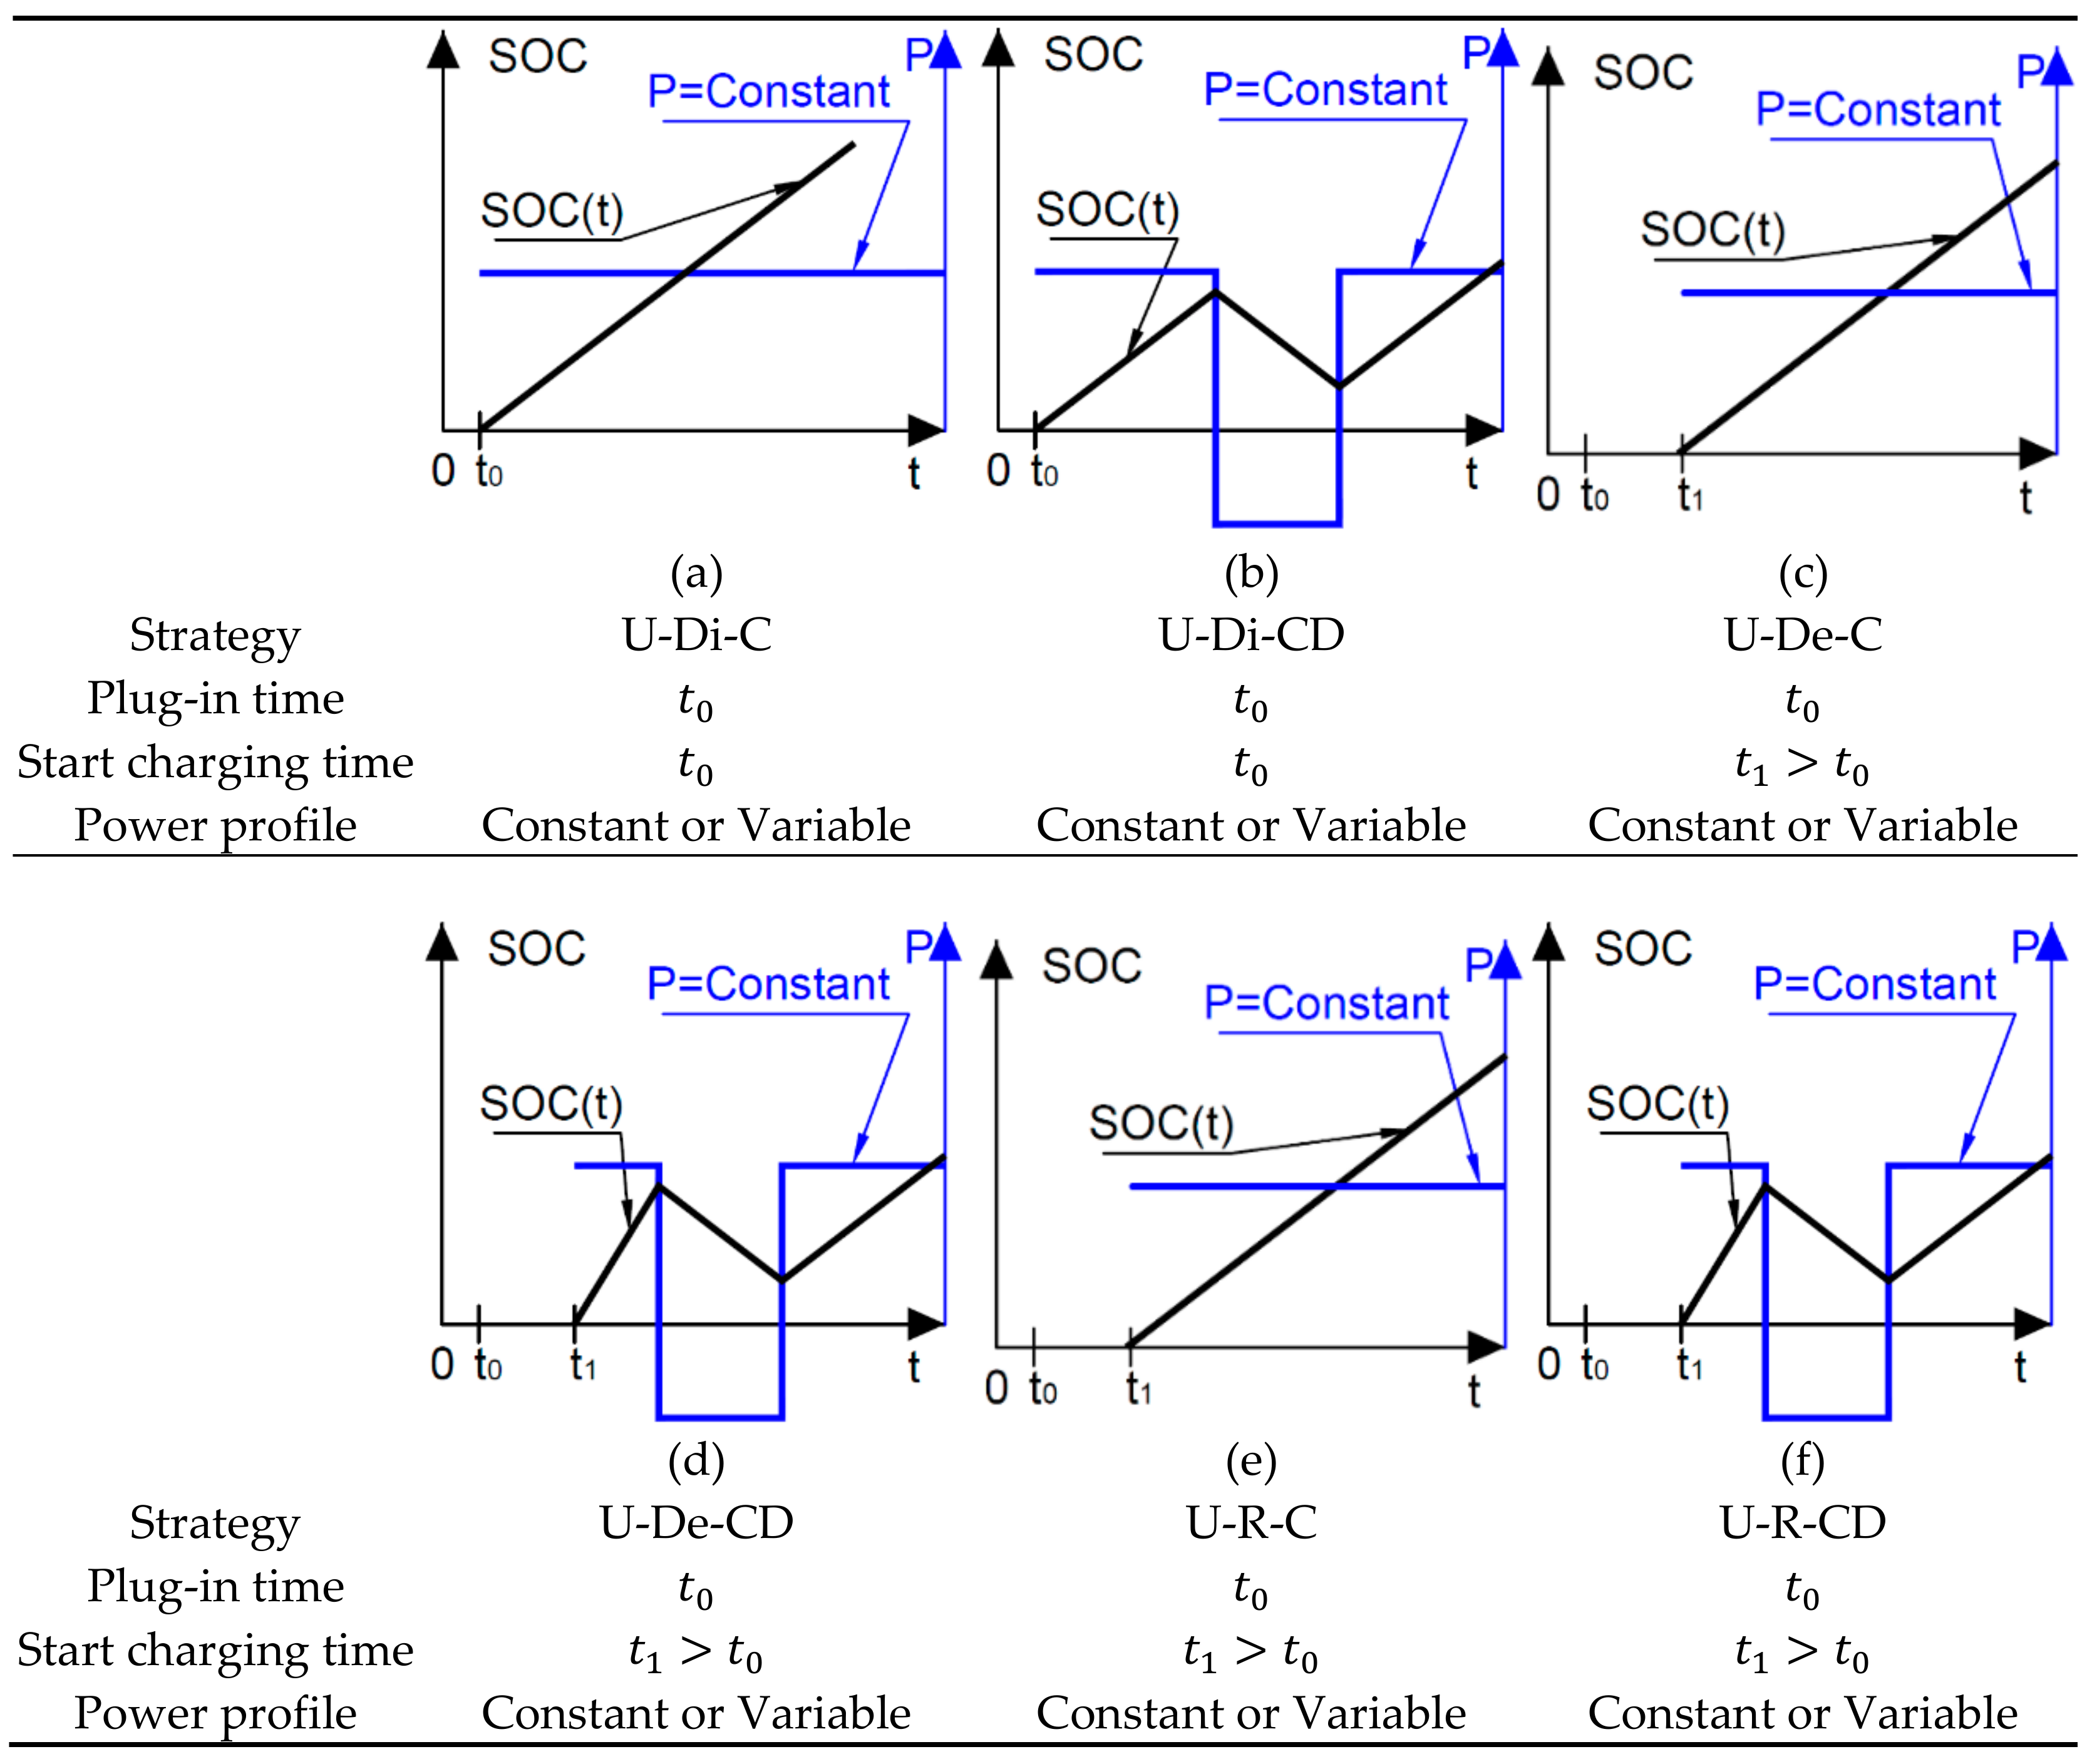
2.1. Uncoordinated Strategies
2.2. Coordinated Strategies

| Strategy | Definition and References that Discuss/Propose the Strategy | ||
|---|---|---|---|
| Item | Name and Abbreviation | ||
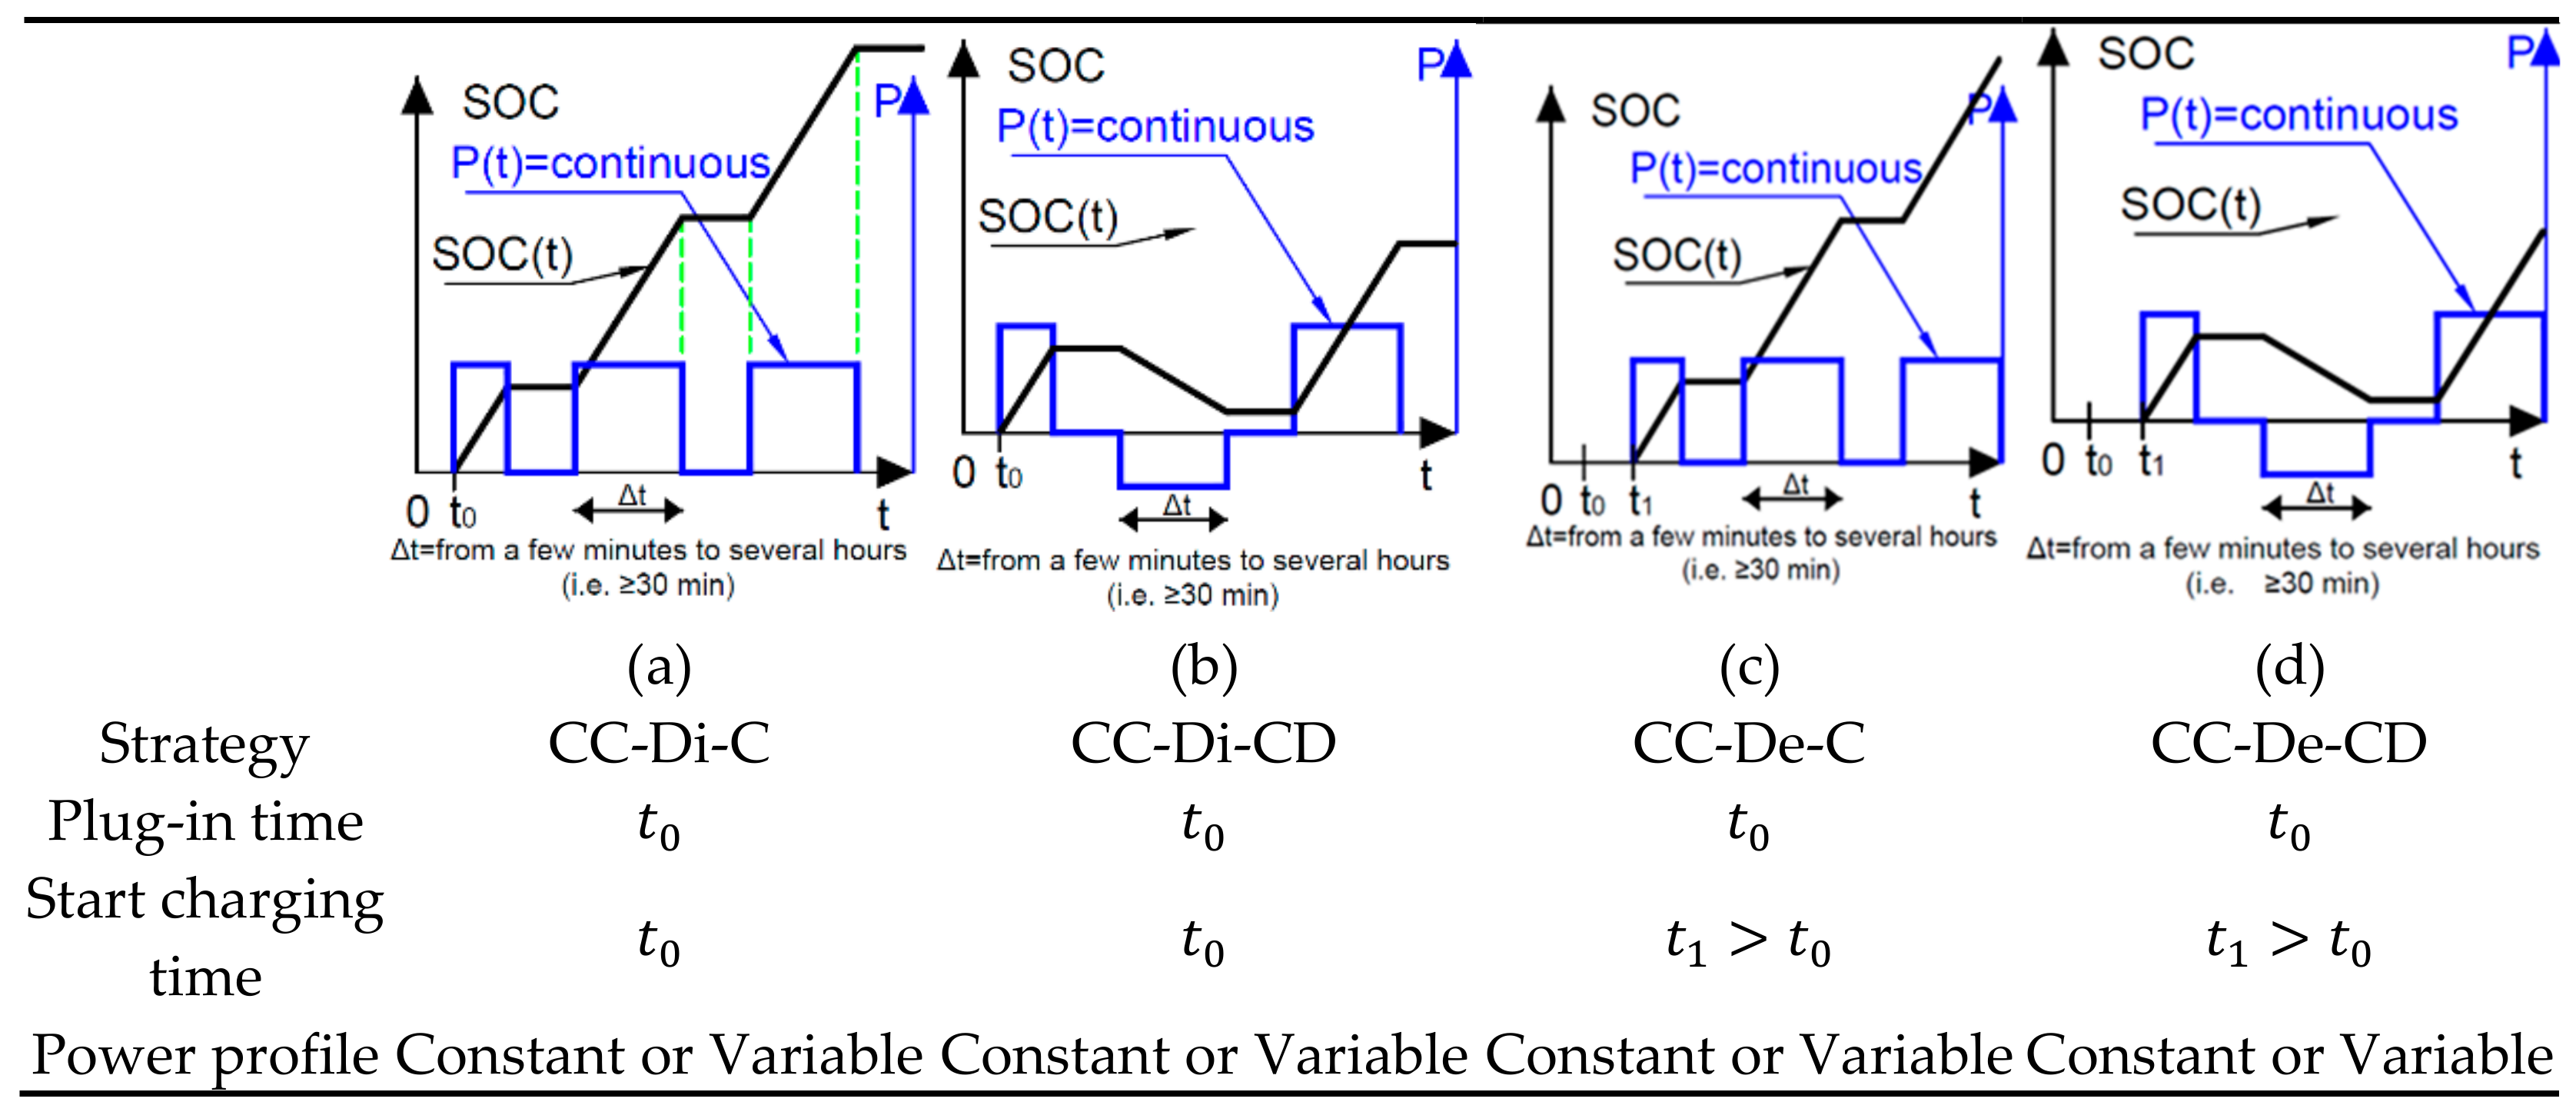
| 7. | Continuous Coordinated Direct Charging | CC-Di-C | The charging mode of a single or fleet of EVs, which automatically charge when they are connected to the PG until they are charged to the desired SOC or disconnected. It uses an optimization technique that charges EVs continuously during a certain period of time without being interrupted. Furthermore, the charging mode is coordinated in a way to avoid charging during the on-peak time and fill valleys during the off-peak time [26,38,44,46]. This strategy also includes fuzzy coordinated Direct Charging in which it uses the Fuzzy reasoning [39] as well as real-time coordination [44]. |
| 8. | Continuous Coordinated Direct Charging and Discharging | CC-Di-CD | SAS7. Additionally, the discharging mode could be used to supply electricity to the load or the PG during the on-peak time. The discharging occurs in a coordinated manner (as defined in Section 2.2) during the on-peak time and when the electricity price is very high [47,48]. The discharging power rate is optimized and controlled. Therefore, it is highly recommended to use this strategy because of its many advantages, such as reducing the peak load, minimizing the total operating cost, etc. This strategy includes the fuzzy coordinated direct charging and discharging (it has not been studied yet, and it is highly recommended). |
| 9. | Continuous Coordinated Delayed Charging | CC-De-C | The charging mode of a single or fleet of EVs in which the charging is delayed to the off-peak time [20,40,49,50,51]. It uses an optimization technique to charge EVs continuously during a certain period without being interrupted. There are reasons to use this strategy such as (1) it reduces the congestion on the network; (2) it charges when the electricity price is low [49]; and (3) it fills valleys [49,51]. |
| 10. | Continuous Coordinated Delayed Charging and Discharging | CC-De-CD | SAS9. Furthermore, the characteristic of the discharging mode is similar to strategy 8 (CC-Di-CD). Ref. [40] used this strategy in which the discharging occurs when the load overpasses the limit on the transformer. |

| Strategy | Definition and References that Discuss/Propose the Strategy | ||
|---|---|---|---|
| Item | Name and Abbreviation | ||
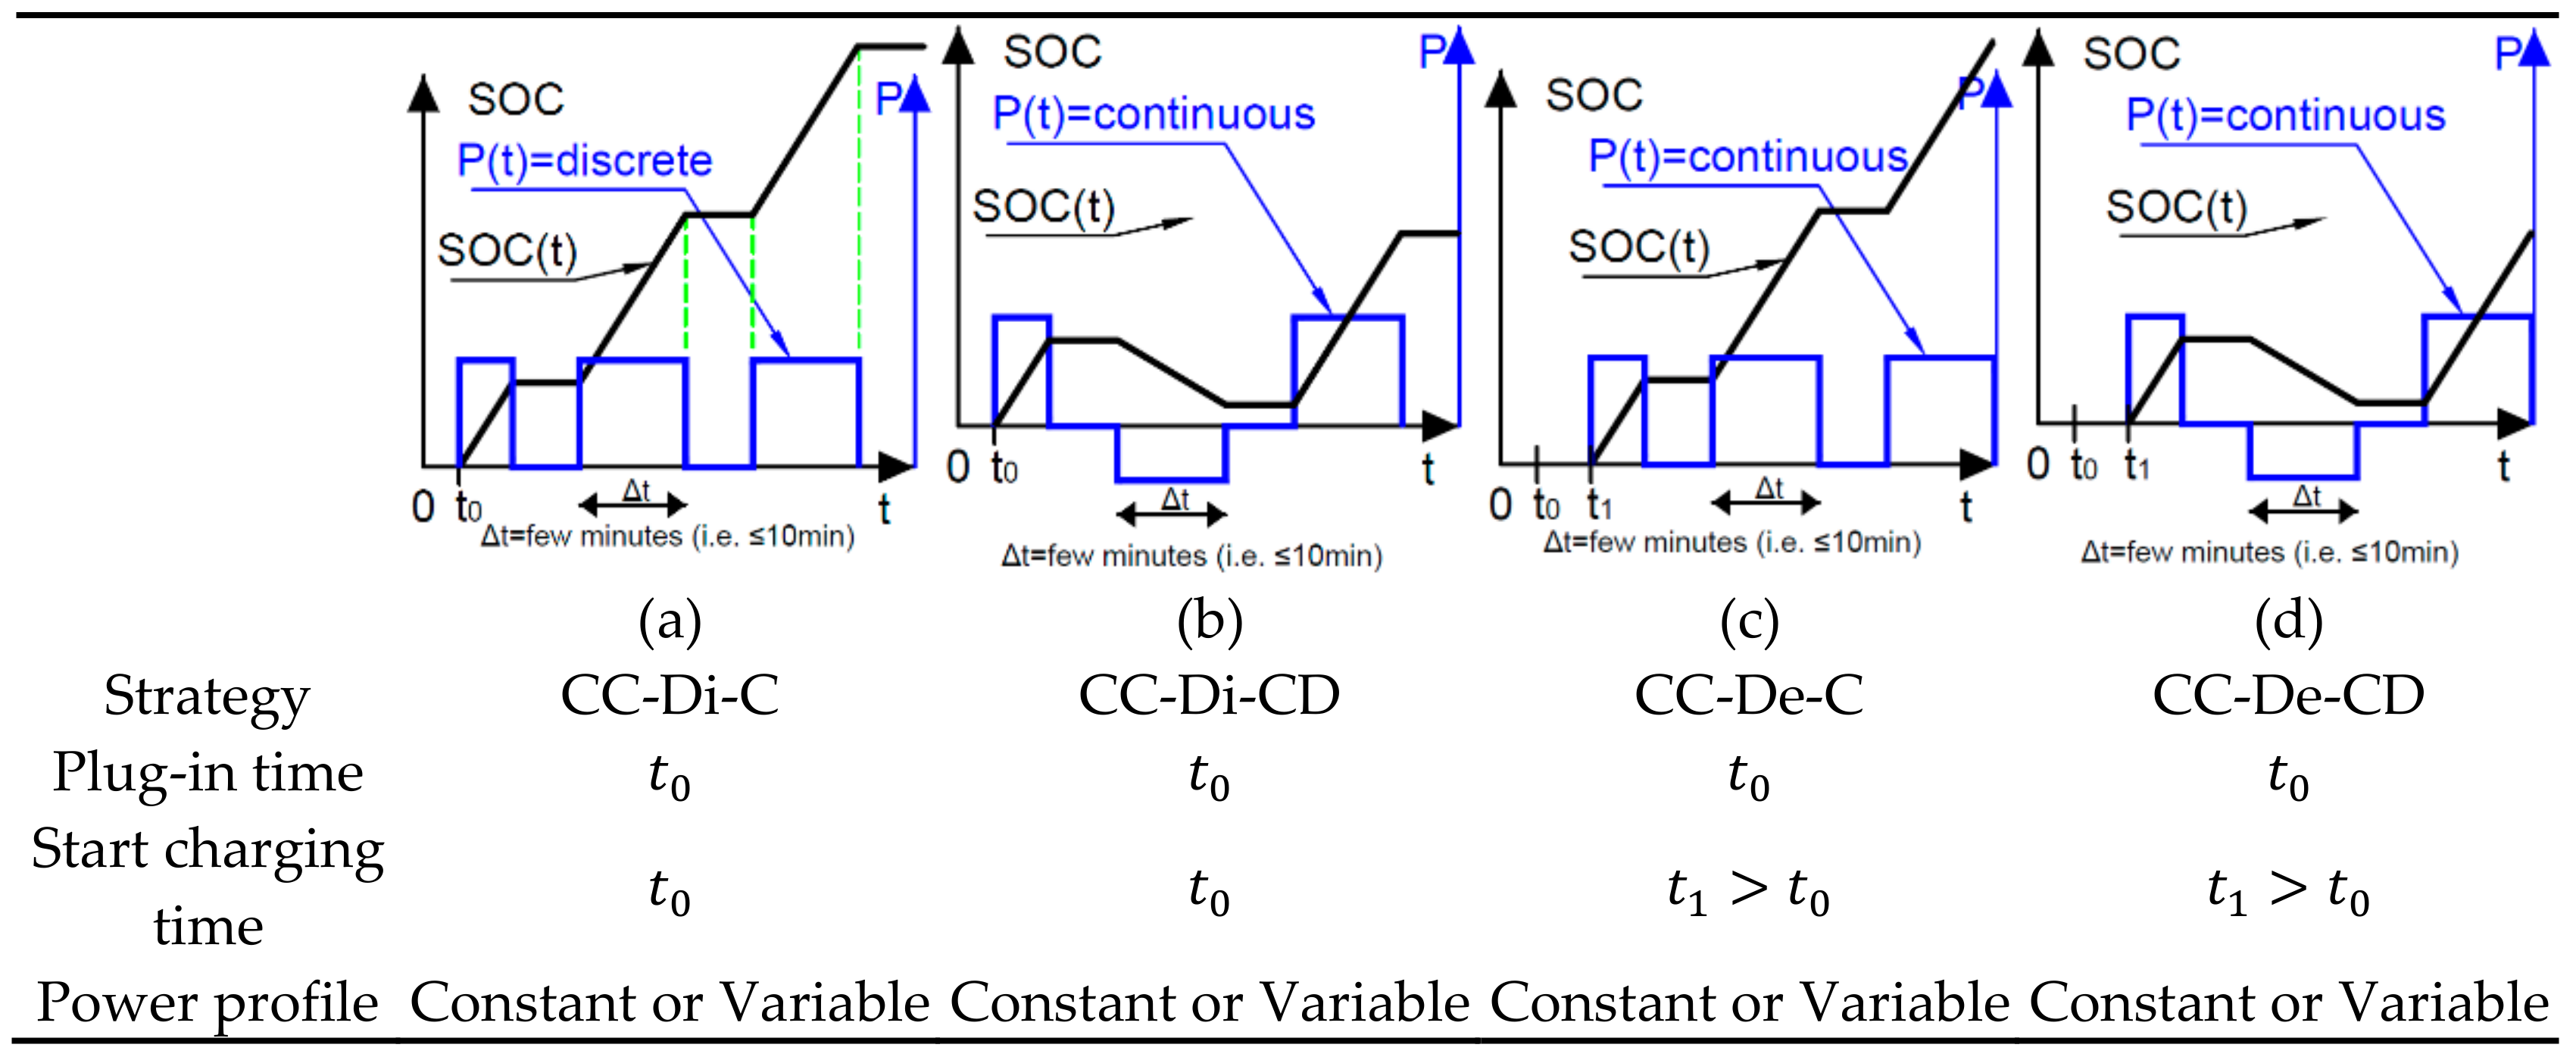
| 11. | Discrete Coordinated Direct Charging | DC-Di-C | The charging mode of a fleet of EVs in which they automatically charge when they are connected to the PG until they are charged to the desired SOC or disconnected. It uses optimization techniques, and it charges EVs within discrete intervals for a period, as defined in Section 2.2. The width of the interval depends on the engineer who designs the optimization algorithm. It could range from several seconds to several minutes. The intervals could be equally or unequally distributed. For each interval, the charging occurs for a limited number of EVs. The same charged EVs could not be charged in the next interval. The charging partition of EVs depends on many factors such as their numbers, their initial and the desired final SOC, their priority of charging, and their arrival and departure time. The purpose of this method is to extend the charging mode to a more extended period to reduce the impact of EVs’ high penetration on the grid [52,53]. |
| 12. | Discrete Coordinated Direct Charging and Discharging | DC-Di-CD | SAS11. In addition, the characteristic of the discharging mode is similar to strategy 8 (CC-Di-CD), but the difference is that the charging time is decomposed of different intervals instead of one interval. Therefore, the peak demand is reduced and prolonged to a wider period. This strategy has not been studied yet to the best of the authors’ knowledge. It is highly recommended to use this strategy for its many advantages. |
| 13. | Discrete Coordinated Delayed Charging | DC-De-C | SAS9. However, the difference is that discrete charging is used instead of continuous charging. The charging process is delayed to a longer period in order to reduce the detrimental impact on the PG. This strategy has not yet been used to the best of the authors’ knowledge. |
| 14. | Discrete Coordinated Delayed Charging and Discharging | DC-De-CD | SAS13 and SAS10. However, the difference is that discrete charging is used instead of continuous charging. This strategy has not yet been used to the best of the authors’ knowledge. |
3. Comparative Study and Analysis
3.1. Complexity Comparison
- Complexity of charging. To implement some strategies (especially coordinated ones), we may need advanced equipment to control the charging rate and duration [55,56,57]. Thus, software, programming, optimization, data transmission, and reading the electricity market price are all design requirements that add complexity to the system, whether at the grid side or the EV side. For instance, in the table, VS stands for a very simple charging strategy, in which a single bidirectional charger is used without using any optimization methods or control strategies. The EV is just charged when it is plugged into the electricity with a specific power rate. S1, S3, and S5 are considered as simple charging strategies for the previously mentioned reasons. The charging strategy becomes complex when a bidirectional charger is used, in which the power flow is in both directions. Therefore, S stands for a Simple charging strategy in which a bidirectional charger is used (such as strategies S2, S4, and S6). This strategy is more complicated than the previous one; however, it is always considered simple since optimization techniques and methods are not used. Therefore, we are not able to control the charging and discharging of the batteries as we would like, and the power rate is almost considered constant. The third level of complexity is when optimization algorithms are used beside the unidirectional chargers to control the charging of the batteries as the case of strategies S7, S9, S11, and S13. These strategies have almost the same complexity as the use a single bidirectional controller and optimization algorithms, which make the system more complicated than the previous strategies. Finally, VC represents the most complex strategy, in which a bidirectional converter and advanced optimization algorithms and control strategies are used to control the charging and discharging of the batteries. This is the case of the strategies S8, S10, S12, and S14 in which the charging rate is not fixed as the previous ones, but it varies depending on the output results of the optimization algorithms. Therefore, controlling the batteries becomes very complex, which require high control and communication speed.
- Complexity of power electronic interfaces. To achieve the charging/discharging process, the EV must use a power electronics interface linking it to the grid. Such an interface is simple when only the charging mode is used. It requires a diode bridge, unidirectional converter, and unidirectional power flow [21,36]. It is complex when both charging and discharging modes are used. It requires semiconductor devices (such as MOSFETs, IGBTs, or GTOs), bidirectional chargers, and control mechanisms for bidirectional power flow [21,36,58].
- Requirement of control and digital communication. Some strategies (again, especially the coordinated ones) need advanced communication means between EVs, chargers, aggregators (PL/CS), and the PG [9,10,21,43,58,59,60,61,62,63]. Some institutions provide specifications and requirements on this topic, such as IEEE, Society of Automotive Engineering (SAE) [64,65], as well as National Electric Infrastructure Working Council [66,67]. Strategies S1 to S6 do not need any communication, as they are uncoordinated charging and discharging strategies. It means that the EVs start charging when they are plugged to the electricity. Therefore, there is no need for any communication with external agents. On the other hand, strategies S7, S9, S11, and S13 need communication since they are coordinated charging strategies. Hence, communication is considered complex compared to the previous one. Finally, strategies S8, S10, S12, and S14 are considered as very complex strategies since bidirectional converters are used and since the communication does not deal only with the charging process but also with the discharging process that makes the optimization and control much more complicated compared to the previous strategies. Hence, more advanced, and complex optimization algorithms are needed to control the bidirectional power flow from the batteries to the grid.
- Necessity of collecting and storing data. The data collection and storage are mandatory for a smart grid, or at least for a grid with smart loads such as EVs. They allow the aggregator to optimize the charging and discharging of its EVs, minimizing the total charging cost, control the active and reactive power flow from the EVs to the grid, and vice versa, etc. Similar to the previous point, the complexity of the communication also includes the complexity of the data and information needed. Strategies S1 to S6 do not require any data from the system operator and the electricity retailer since they are uncoordinated charging. However, for coordinated charging strategies such as S7, S9, S11, and S13, some data are needed such as the electricity price, and the power profile. These data are necessary to obtain an optimal solution to charge the EVs in a way to satisfy the objective function of the EV and parking lot owners, the system operator, etc. Finally, a bidirectional converter needs much more data since the optimization algorithm does not calculate only the charging profile but both charging and discharging power profiles. Therefore, more data are needed besides the mentioned ones. In this case, the algorithm should know the preferences of the EV owner, what is the final state of charge, at which rate he wants to charge and discharge his battery, how much energy he allows to discharge from his battery, etc. All these data increase the complexity of strategies S8, S10, S12, and S14.
| Charging Strategy | ||||||||||||||||
|---|---|---|---|---|---|---|---|---|---|---|---|---|---|---|---|---|
| Description | S1:U-Di-C | S2: U-Di-CD | S3: U-De-C | S4: U-De-CD | S5: U-R-C | S6: U-R-CD | S7: CC-Di-C | S8: CC-Di-CD | S9: CC-De-C | S10: CC-De-CD | S11: DC-Di-C | S12: DC-Di-CD | S13: DC-De-C | S14: DC-De-CD | References | |
| 1. | Complexity of charging | VS | S | VS | S | VS | S | C | VC | C | VC | C | VC | C | VC | [9,21,36,52,53,55] |
| 2. | Complexity of power electronic topology | S | C | S | C | S | C | S | C | S | C | S | C | S | C | |
| 3. | Require control and digital communication | N | N | N | N | N | N | Y | VC | Y | VC | Y | VC | Y | VC | |
| 4. | Require complex data collection and storage from EVs, aggregator, power network, and other parties | N | N | N | N | N | N | Y | VC | Y | VC | Y | VC | Y | VC | [9] |
3.2. Economic and Power Losses Comparison
- 5.
- Operation cost reduction. It shows the impact of different charging strategies on the operation cost of the mentioned elements. For strategies S1 to S6, the charging and discharging of EVs did not reduce the operation cost. This is due to the fact that uncoordinated charging may result in peak load demand, especially if there are lots of EVs charging at the same time. Therefore, additional generators will be turned on just to supply the peak demand during a very short period, which will increase the operating cost and increase the financial losses of the system operator. On the other hand, coordinated charging strategies such as S7, S9, S11, and S13 are able to shift the peak demand to another period when the consumption is lower. Therefore, it somehow limits the operation cost, and there is no need to turn on a generator. On the contrary, the charging and discharging strategies such as S8, S10, S12, and S14 can minimize the operation cost as they are able to provide ancillary services by injecting power to the grid when needed and store energy when there is an excess in the power generation. The best strategy among all the others is S12, since it has more flexibility to charge and discharge during a very short period (less than 10 min), which is very beneficial for the system operator, and it can be used to regulate the frequency and the voltage on the grid whenever needed.
- 6.
- Power loss reduction. The power losses in this paper are on the lines and transformers. The power loss is equal to the resistance of the line multiplied by the square of the current (). It means that when the current increases on the lines, the power losses increase, too. Uncoordinated charging strategies (S1 to S6) are not capable of minimizing the power demand on the grid. On the contrary, they increase it, since most of the EVs can charge at the same time, which will put more stress on the network and increase the power losses. On the other hand, coordinated charging strategies (S7, S9, S11, and S13) can reduce the power losses by shifting their charging to off-peak times. Coordinated charging and discharging strategies (S8, S10, S12, and S14) are able not just to avoid high power losses but to minimize them. Optimization algorithms and advanced control strategies can detect the high peak demand on the network and order the EVs to discharge during these periods, which may minimize the power and energy losses [21,39,42,44,47].
- 7.
- Revenues from ancillary services. Usually, uncoordinated charging and discharging strategies (S1 to S6) do not participate in the ancillary services. In contrast, the coordinated charging strategies have very limited participation since they can only shift their charging and cannot inject power to the grid. On the other hand, coordinated charging and discharging strategies (S8, S10, S12, and S14) use a bidirectional converter, which allows the EV to absorb and inject power to the grid, regulate the voltage and the frequency, and inject active and reactive power when needed [11,12,13,21,25,47].
- 8.
- The necessity of additional investments or expensive equipment. The cost of chargers, power electronics circuits, and infrastructure are high [13,21,33,36,56,68] when using bidirectional power flow capability. It includes on/off-board smart meters [11,58], on/off-board chargers, data infrastructure, sensors [58], etc. The infrastructure might need upgrades because of (1) potential high demand by EVs fleets, (2) EV being a smart load, and (3) the use of power electronic interfaces that support bidirectional power flow; at the same time, a CST may reduce the installation of other equipment on the PG, reducing additional investments on the infrastructure [69]. It is obvious when an uncoordinated charging strategy is used using the unidirectional charger (such as S1, S3, and S5), there is no need to invest in an advanced infrastructure, as it will not serve the grid, since it is uncoordinated [70,71,72,73,74,75,76,77,78]. By adding a bidirectional charger, the investment increases, which is the case of S2, S4, and S6. The investment increases when the charging strategy becomes more complex [79,80,81,82,83,84,85,86,87,88] such as using bidirectional chargers [89,90,91,92,93,94], and advanced communication protocols [95,96,97,98,99,100], optimization algorithms [101,102,103,104,105,106,107,108,109,110,111,112,113,114,115,116,117,118,119,120,121,122,123,124,125,126,127,128,129,130,131,132,133,134,135,136] and development boards [137,138,139,140,141,142], which is the case of strategies S8, S10, S12, and S14.
| Charging Strategy | ||||||||||||||||
|---|---|---|---|---|---|---|---|---|---|---|---|---|---|---|---|---|
| Description | S1:U-Di-C | S2: U-Di-CD | S3: U-De-C | S4: U-De-CD | S5: U-R-C | S6: U-R-CD | S7: CC-Di-C | S8: CC-Di-CD | S9: CC-De-C | S10: CC-De-CD | S11: DC-Di-C | S12: DC-Di-CD | S13: DC-De-C | S14: DC-De-CD | References | |
| 5. | Operation cost reduction | |||||||||||||||
| 1. Power plants | N | N | N | N | N | N | L | Y | L | L | L | Y | L | L | [12,142] | |
| 2. Power grid | N | N | N | N | N | N | L | Y | L | L | L | Y | L | L | [56,57,143] | |
| 3. EV charging electricity cost | N | N | N | N | N | N | Y | Y | Y | Y | Y | Y | Y | Y | [36,144,145,146,147,148,149] | |
| 4.Reduce dependency on small/micro expensive power units | N | N | N | N | N | N | N | Y | N | L | N | Y | N | L | [12] | |
| 5. Turn off some generators during on-peak time by providing energy to the grid using V2G | N | N | N | N | N | N | N | Y | N | L | N | Y | N | L | [12,47] | |
| 6. | Power and energy losses are reduced on the PG | N | N | N | N | N | N | Y | Y | Y | Y | Y | Y | Y | Y | [95,96,97,98,99] |
| 7. | Generate revenue from ancillary services | N | N | N | N | N | N | N | Y | N | L | N | Y | N | L | [51,78] |
| 8. | Infrastructure and equipment expenses/investments | |||||||||||||||
| 1. Cost of chargers, power electronics, and infrastructure are high | N | Y | N | Y | N | Y | N | Y | N | Y | N | Y | N | Y | [21,39,44] | |
| 2. Infrastructure needs upgrade to support the strategy | N | Y | N | Y | N | Y | N | Y | N | Y | N | Y | N | Y | [21,39,44] | |
| 3. Avoid additional investment on the infrastructure | N | N | N | N | N | N | Y | Y | Y | Y | Y | Y | Y | Y | [21,39,44] | |
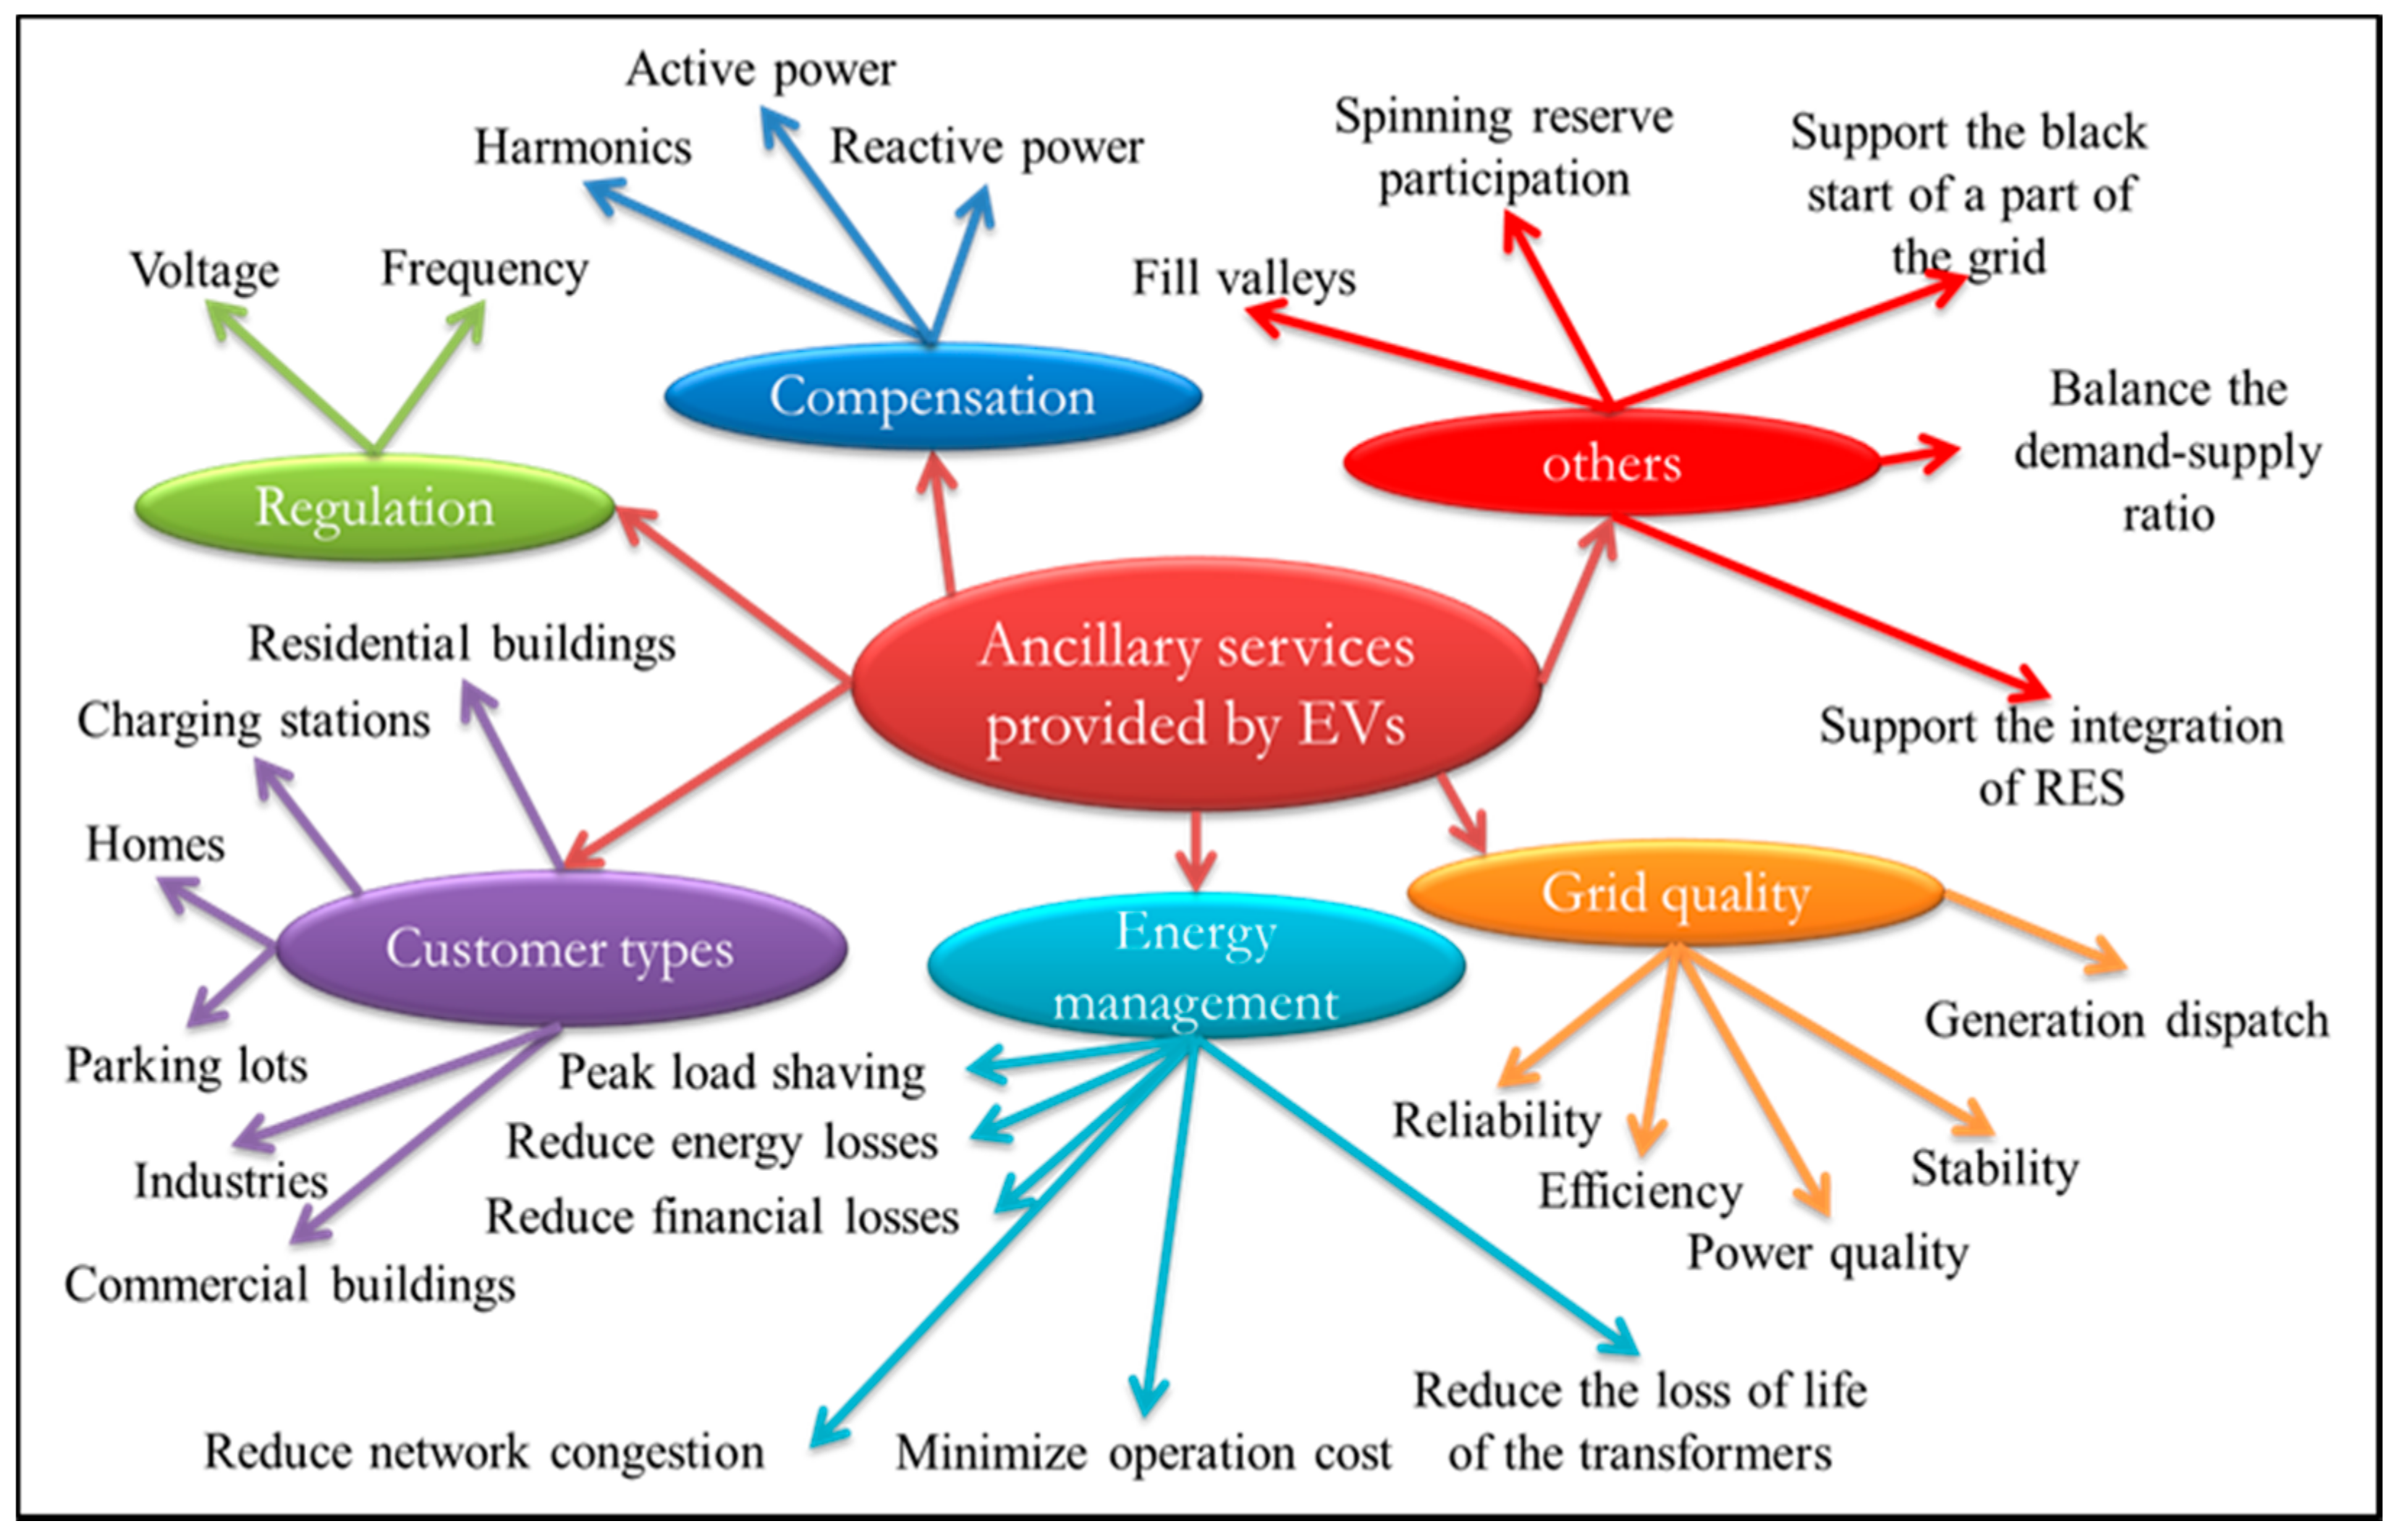
3.3. Ancillary Services and Peak Demand Aspects
- 9.
- Ancillary services provided. Depending on the type of CST, it may provide different types of ancillary services, which are very important to stabilize the PG. For example, for frequency regulation, there are three types of control, which are defined by the Union for the Coordination of Transmission of Electricity [88]. Other types of ancillary services include voltage regulation, supporting the integration of RESs, etc. Note that ancillary services might be provided only by CST. EVs using UST are treated as normal loads. In general, uncoordinated charging strategies (S1 to S6) do not provide ancillary services, while the coordinated ones (S7 to S14) do provide them. More specifically, coordinated charging and discharging strategies such as S8, S10, S12, and S14 can provide better ancillary services than just the coordinated charging, as mentioned in the previous table. More precisely, strategies S10 and S12 are considered as the best ones, since they are able to provide all kinds of ancillary services such as voltage and frequency regulations, reduce harmonic distortions, and many others, which is not the case of other strategies.
- 10.
- Network congestion relief. It means that sometimes, the network can have a lot of electric burdens, and congestion can be created, which puts the distribution systems in danger. UST (S1 to S6) are the worst, since they increase in the network congestion, while CST (S7 to S14) reduce network congestion and improve the load factor. More particularly, when discharging EV is considered (S8, S10, S12, and S14), the strategies participate in the reduction of the network congestion because they can inject energy into the grid when there is high demand.
- 11.
- Optimize charging time and power demand. Optimization techniques help the aggregator and PG to optimize the charging time of EVs, the power demand, and flow. Strategies S1 to S6 do not use optimization, since they are uncoordinated charging strategies. Strategies S7 to S14 use optimization and advanced algorithms; therefore, optimal solutions are necessary to improve the functionality of the power grid and minimize the technical and economic losses.
- 12.
- Peaks and valleys improvements. CST might shave the peak demand on a distribution transformer, shift the hourly generation portfolio, balance the demand and supply by valley filling [19,21,89] (sometimes referred to as ‘load-leveling’ [90]), and minimize the load variance [81]. USTs are not the best strategies, since they are not capable of shifting their load and filling the valleys automatically because they do not use advanced optimization algorithms to control their power profiles. In the CSTs, S8 and S12 are the best, since they are capable of shifting their energy demand to off-peak time and participating in shaving the peak demand by injecting energy into the grid.
- 13.
- Duration of response time. The response time of ancillary services should be very short compared to other conventional power generators (e.g., nuclear or hydropower plants or wind farms). Therefore, EVs may potentially replace other regulation service units [51,78]. Some strategies (S7, S9, S11, and S13) have a limited response time because they use only a unidirectional power flow from the grid to the EVs, or they use delayed charging strategies. However, S8 and S12 always show superior performance compared to other strategies since they have short response times and can instantly or within a few minutes to respond to the requirements of the system operator.
| Charging Strategy | ||||||||||||||||
|---|---|---|---|---|---|---|---|---|---|---|---|---|---|---|---|---|
| Description | S1:U-Di-C | S2: U-Di-CD | S3: U-De-C | S4: U-De-CD | S5: U-R-C | S6: U-R-CD | S7: CC-Di-C | S8: CC-Di-CD | S9: CC-De-C | S10: CC-De-CD | S11: DC-Di-C | S12: DC-Di-CD | S13: DC-De-C | S14: DC-De-CD | References | |
| 9. | Ancillary serviced provided | [60,62,69,150] | ||||||||||||||
| 1. Improve grid stability | N | N | N | N | N | N | L | Y | L | L | L | Y | L | L | [36,151,152,153,154,155,156,157,158,159,160,161] | |
| 2. Frequency regulation | N | N | N | N | N | N | L | Y | L | L | L | Y | L | L | [13,21,25,29,51,69,71,72,73,74,75] | |
| 3. Voltage regulation | N | N | N | N | N | N | L | Y | L | L | L | Y | L | L | [77,161,162,163,164,165,166] | |
| 4. Harmonic regulation | N | N | N | N | N | N | L | Y | L | L | L | Y | L | L | [161] | |
| 5. Support the integration of RES | N | N | N | N | N | N | N | Y | N | Y | N | Y | N | Y | [21,47,56,57,60,69] | |
| 6. Spinning reserve participation | N | N | N | N | N | N | L | Y | L | L | L | Y | L | L | [13,21,47,75,78] | |
| 7. Energy storage (i.e., injects energy into the grid) | N | N | N | N | N | N | N | Y | N | L | N | Y | N | L | [36,47,79] | |
| 8. Improve power quality | N | N | N | N | N | N | N | Y | N | L | N | Y | N | L | [36,39,44,47] | |
| 9. Improve grid efficiency and reliability | N | N | N | N | N | N | L | Y | L | L | L | Y | L | L | [21,80] | |
| 10. Active and reactive power regulation | N | N | N | N | N | N | L | Y | L | L | L | Y | L | L | [33,39,44,47] | |
| 11. Improve generation dispatch | N | N | N | N | N | N | L | Y | L | L | L | Y | L | L | [21] | |
| 12. Replace large-scale energy storage systems | N | N | N | N | N | N | N | Y | N | L | N | Y | N | L | [21] | |
| 13. Black start a part of the distribution grid | N | N | N | N | N | N | N | Y | N | L | N | Y | N | L | [21] | |
| 10. | Reduce network congestion and load factor | N | N | N | N | N | N | Y | Y | Y | Y | Y | Y | Y | Y | [21,31,42,81] |
| 11. | Optimize charging time and power demand | N | N | N | N | N | N | Y | Y | Y | Y | Y | Y | Y | Y | [22] |
| 12. | Peaks and valleys in daily demands | |||||||||||||||
| 1. Peak shaving | N | N | N | N | N | N | N | Y | N | L | N | Y | N | L | [21,33,36,48] | |
| 2. Shifting hourly generation portfolio | N | N | N | N | N | N | N | Y | N | L | N | Y | N | L | [39,44,47] | |
| 3. Balance load valleys by valley filling and minimize load variance | N | N | N | N | N | N | Y | Y | Y | Y | Y | Y | Y | Y | [39] | |
| 13. | Response time is shorter than conventional generators | N | N | N | N | N | N | L | Y | L | L | L | Y | L | L | [21] |
3.4. Operating Aspects
- 14.
- EVs interacting with the grid. When USTs are used, the number of charging EVs is not limited. Thus, it might negatively affect the PG (e.g., a large fleet of EVs might be connected at 8:30 AM when people drive from their homes to the workplace, overloading the distribution transformer of the area). When a CST is used, the number of charging EVs could be limited in order to maintain the stability of the PG. This might be done by adjusting the penetration level (e.g., the total number of EVs being charged at a specific instant) to a certain limit without violating the constraints on the PG [91]. Therefore, it is possible to charge a larger number of EVs using CSTs compared to the USTs, which might satisfy the EV owners.
- 15.
- Priority of charging/discharging. The priority of charging and discharging is considered in some papers of the mentioned categories with “Y”. USTs show chaos, since the charging of EVs is not organized even in an EV parking lot; each EV starts to charge when it is plugged to the electricity, disregarding what is happening on the network. However, CSTs show more organization while charging the existing EVs. This is due to the fact that optimization algorithms are used, and users’ preferences are also considered, which will improve the performance of the system and increase the satisfaction of both EV owner and the system operator or parking lot owner.
- 16.
- Charging management and timing. It shows whether charging occurs instantly or it is delayed depending on the constraints of EVs and the PG [21,43,45,51,79]. Table 7 shows whether the management of charging and discharging becomes difficult and complex for a large number of EVs when discrete charging methods are used. The period of charging and discharging is extended, thus reducing the management reliability and dissatisfying many clients [55].
| Charging Strategy | ||||||||||||||||
|---|---|---|---|---|---|---|---|---|---|---|---|---|---|---|---|---|
| Description | S1:U-Di-C | S2: U-Di-CD | S3: U-De-C | S4: U-De-CD | S5: U-R-C | S6: U-R-CD | S7: CC-Di-C | S8: CC-Di-CD | S9: CC-De-C | S10: CC-De-CD | S11: DC-Di-C | S12: DC-Di-CD | S13: DC-De-C | S14: DC-De-CD | References | |
| 14. | EVs interacting with the grid | |||||||||||||||
| 1. A large number of EVs participate in the charging mode | Y | Y | Y | Y | Y | Y | L | L | L | L | L | L | L | L | [164] | |
| 2. Increase EVs penetration level while respecting constraints of the PG | N | N | N | N | N | N | Y | Y | Y | Y | Y | Y | Y | Y | [161] | |
| 15. | Priority of charging/discharging is considered | N | N | N | N | N | N | Y | Y | Y | Y | Y | Y | Y | Y | [162] |
| 16. | Charging management and timing | |||||||||||||||
| 1. Charging occurs instantly | Y | Y | N | N | Y | Y | Y | Y | N | N | Y | Y | N | N | [20,21] | |
| 2. Delayed charging depending on constraints of EVs and PG | N | N | Y | Y | N | N | M | N | Y | Y | M | N | Y | Y | [20,21] | |
| 3. Complex management of charging and discharging | N | N | N | N | N | N | N | N | N | N | Y | Y | Y | Y | [20,21] | |
| 4. Arrival and departure time of each EV is considered | N | N | N | N | N | N | Y | Y | Y | Y | Y | Y | Y | Y | [161,162,163,164,165,166] | |
3.5. Detrimental Impact on EV, PG, or Environment
- 17.
- Potential battery degradation. Lithium-ion batteries might experience a reduction in their lifetime due to being excessively charged and discharged. An excessive discharge of stored energy in a battery may cause cycling wear as well as a reduction in its lifetime and total capacity. However, some new technologies are being developed, which are less impacted by the discharging and high charging rate [92]. Another solution is to provide trading inquiries before discharging, as suggested in [93]. The owner may decide the minimum SOC (which would then become a constraint in the optimization/algorithm used by the aggregators). This might not only be important to avoid the degradation of the battery but also to ensure that the EV has enough energy left when they use their EV again. Usually, USTs face less degradation, since the charging power profile is almost constant all the time and does not reach a high rate (for example, the charging rate at 4 kW). Meanwhile, CSTs face higher degradation since the charging rate may increase (e.g., 7 kW) at specific periods, which may increase the stress on the batteries. Sometimes, the aggregator or the system operator may increase the charging rate of the EV at a specific period when there is not much demand on the network in order to avoid EVs charging during the on-peak time. Therefore, these strategies are mostly used and convenient for the system operator, which will help them minimize the congestion and losses on the network. By including discharging strategies, the stress on the batteries increases, and their lifetime is reduced. Hence, it is up to the EV owner to decide whether he wants to participate in the ancillary services or not and which power rate to accept to charge or discharge his battery. For example, an EV owner may agree to charge his EV at 6 kW and does not allow a charging rate higher than this value, even when there is a need on the network. At the same time, he can restrict the discharging to 2 kW even when the aggregator needs a rate of 6 kW. This factor could be an agreement between the EV owner and the aggregator, and incentive programs could be applied to incite the EV owner to participate in the ancillary services and get paid for that.
- 18.
- Overloading impact on distribution transformers. Due to high power demand from the base load only (“1”), from the base load and EVs (“2”), or from both (“3”), the lifetime of distribution transformers might be reduced [23,94]; overheat, shutdown, insulation breakdown, increase in losses, and reduction in efficiency are all potential consequences [21,36,42,44,45,87,95,96,97]. It may also overpass its operating limits [20,21,33,42,98]. The same applies to cables and distribution infrastructure. The impact of EVs depends on their number; a small number may have a small impact, and a large number may have a large impact. However, it depends on the charging strategies as well. In general, the existing transformers are designed to support only the base load without EVs. It means that a high penetration level of EVs can deteriorate the transformer. Hence, it is very important to use advanced control strategies such as S7 to S14 and, more specifically, S8 and S12 in which they are capable of reducing the stress on the transformer, therefore increasing its lifetime. USTs can be applied when the number of connected EVs is very limited (e.g., maximum 2 EVs on the transformer), while CSTs can even connect many EVs on the same transformer without affecting its lifetime. However, the charging period is extended to reduce stress.
- 19.
- Impact on the PG. The detrimental impact on the PG could be caused by a high-power demand from base load only, base load + EVs, or from both. It could negatively impact the PG by reducing its efficiency, high peak demand could be created even during the off-peak time [9,20,21,22,36,42,44], or the system may lose its stability and experience voltage and frequency violations [21,33,36,45]. A shortage in the PG could be created when the demand on a certain bus exceeds the power supply. It may cause a severe voltage drop [99]. USTs (S1 to S6) make the PG very vulnerable. However, CSTs can improve the impact of EVs on the PG. More precisely, S8 and S12 show better performance compared to other strategies, since they use bidirectional power flow and advanced optimization and control algorithms, and they can respond immediately to any request from the system operator.
- 20.
- Reduction of harmful gases. The emission of harmful gases could be reduced by using EVs in the condition that they are not supplied by power plants that consume fossil fuel. Generally, when EVs are supplied by conventional power plants, the emission of harmful gases is much higher than conventional vehicles. Hence, it is thus recommended that EVs should be supplied by RESs, or power plants where fossil fuel is not used (e.g., nuclear power plant, hydropower plant, etc.) [12,23,29,35,51,57]. In general, USTs (S1 to S6) might increase the energy demand during a certain period, which obliges the system operator or the power utility to turn on some fossil-fuel based power plants to respond to the demand. Therefore, the emission of harmful gases is increased. However, the CSTs (S7 to S14) are able to reduce their power demand during certain periods, which might reduce the stress on the network and reduce the possibility of turning on some fossil-fuel based power plants to supply the demand. More precisely, S8 and S12 are the best among all other strategies since they discharge and minimize the possibility of turning on some generators.
| Charging Strategy | ||||||||||||||||
|---|---|---|---|---|---|---|---|---|---|---|---|---|---|---|---|---|
| Description | S1:U-Di-C | S2: U-Di-CD | S3: U-De-C | S4: U-De-CD | S5: U-R-C | S6: U-R-CD | S7: CC-Di-C | S8: CC-Di-CD | S9: CC-De-C | S10: CC-De-CD | S11: DC-Di-C | S12: DC-Di-CD | S13: DC-De-C | S14: DC-De-CD | References | |
| 17. | Battery might experience | |||||||||||||||
| 1. Degradation due to regulation service | N | Y | N | Y | N | Y | N | M | N | M | N | M | N | M | [21,51,82,83,84] | |
| 2. Cycling wear | L | Y | L | Y | L | Y | N | M | N | M | N | M | N | M | [79,82,85] | |
| 3. Lifetime & storage capacity reduction | L | Y | L | Y | L | Y | N | Y | N | Y | N | Y | N | Y | [21,86] | |
| 18. | Impact on Distribution transformers due to high power demand from Base Load “1”, Base Load + EVs “2”, or Both “3” | 3 | 3 | 3 | 3 | 3 | 3 | 1 | N | 1 | 1 | 1 | N | 1 | 1 | [161,162,163,164,165,166] |
| 19. | Negative impact on the PG due to high power demand from Base Load “1”; Base Load + EVs “2”, or Both “3” | [161,162,163,164,165,166] | ||||||||||||||
| 1. Power grid’s efficiency is decreased | 3 | 3 | 3 | 3 | 3 | 3 | 1 | N | 1 | 1 | 1 | N | 1 | 1 | [161,162,163,164,165,166] | |
| 2. High demand during off-peak time | 3 | 3 | 3 | 3 | 3 | 3 | 1 | N | 1 | 1 | 1 | N | 1 | 1 | [161,162,163,164,165,166] | |
| 3. Loss of stability | 3 | 3 | 3 | 3 | 3 | 3 | 1 | N | 1 | 1 | 1 | N | 1 | 1 | [161,162,163] | |
| 4. Uncontrolled load | 3 | 3 | 3 | 3 | 3 | 3 | 1 | N | 1 | 1 | 1 | N | 1 | 1 | [21,33,45] | |
| 5. Increase in power and energy losses | 3 | 3 | 3 | 3 | 3 | 3 | 1 | N | 1 | 1 | 1 | N | 1 | 1 | [20,21,33,36,87] | |
| 6. Network congestion | 3 | 3 | 3 | 3 | 3 | 3 | 1 | N | 1 | 1 | 1 | N | 1 | 1 | [87] | |
| 7. Reduced PG reliability | 3 | 3 | 3 | 3 | 3 | 3 | 1 | N | 1 | 1 | 1 | N | 1 | 1 | [21,33] | |
| 8. Shortage in the PG (i.e., demand exceeds supply) | 3 | 3 | 3 | 3 | 3 | 3 | 1 | N | 1 | 1 | 1 | N | 1 | 1 | [21,33] | |
| 20. | Emission of CO2, NOx, SO2, etc, and fossil fuel usage are reduced for | |||||||||||||||
| 1. EV | Y | Y | Y | Y | Y | Y | Y | Y | Y | Y | Y | Y | Y | Y | [21,32,47] | |
| 2. Conventional power plants when EVs are charged from RES | N | N | N | N | N | N | Y | Y | Y | Y | Y | Y | Y | Y | [47,56,57] | |
| 3. Peak demand periods | N | N | N | N | N | N | N | Y | N | L | N | Y | N | L | [47,56,57] | |
4. Operation of Power Systems in the Presence of EVs as Dispatchable Loads
4.1. The Optimization Problem
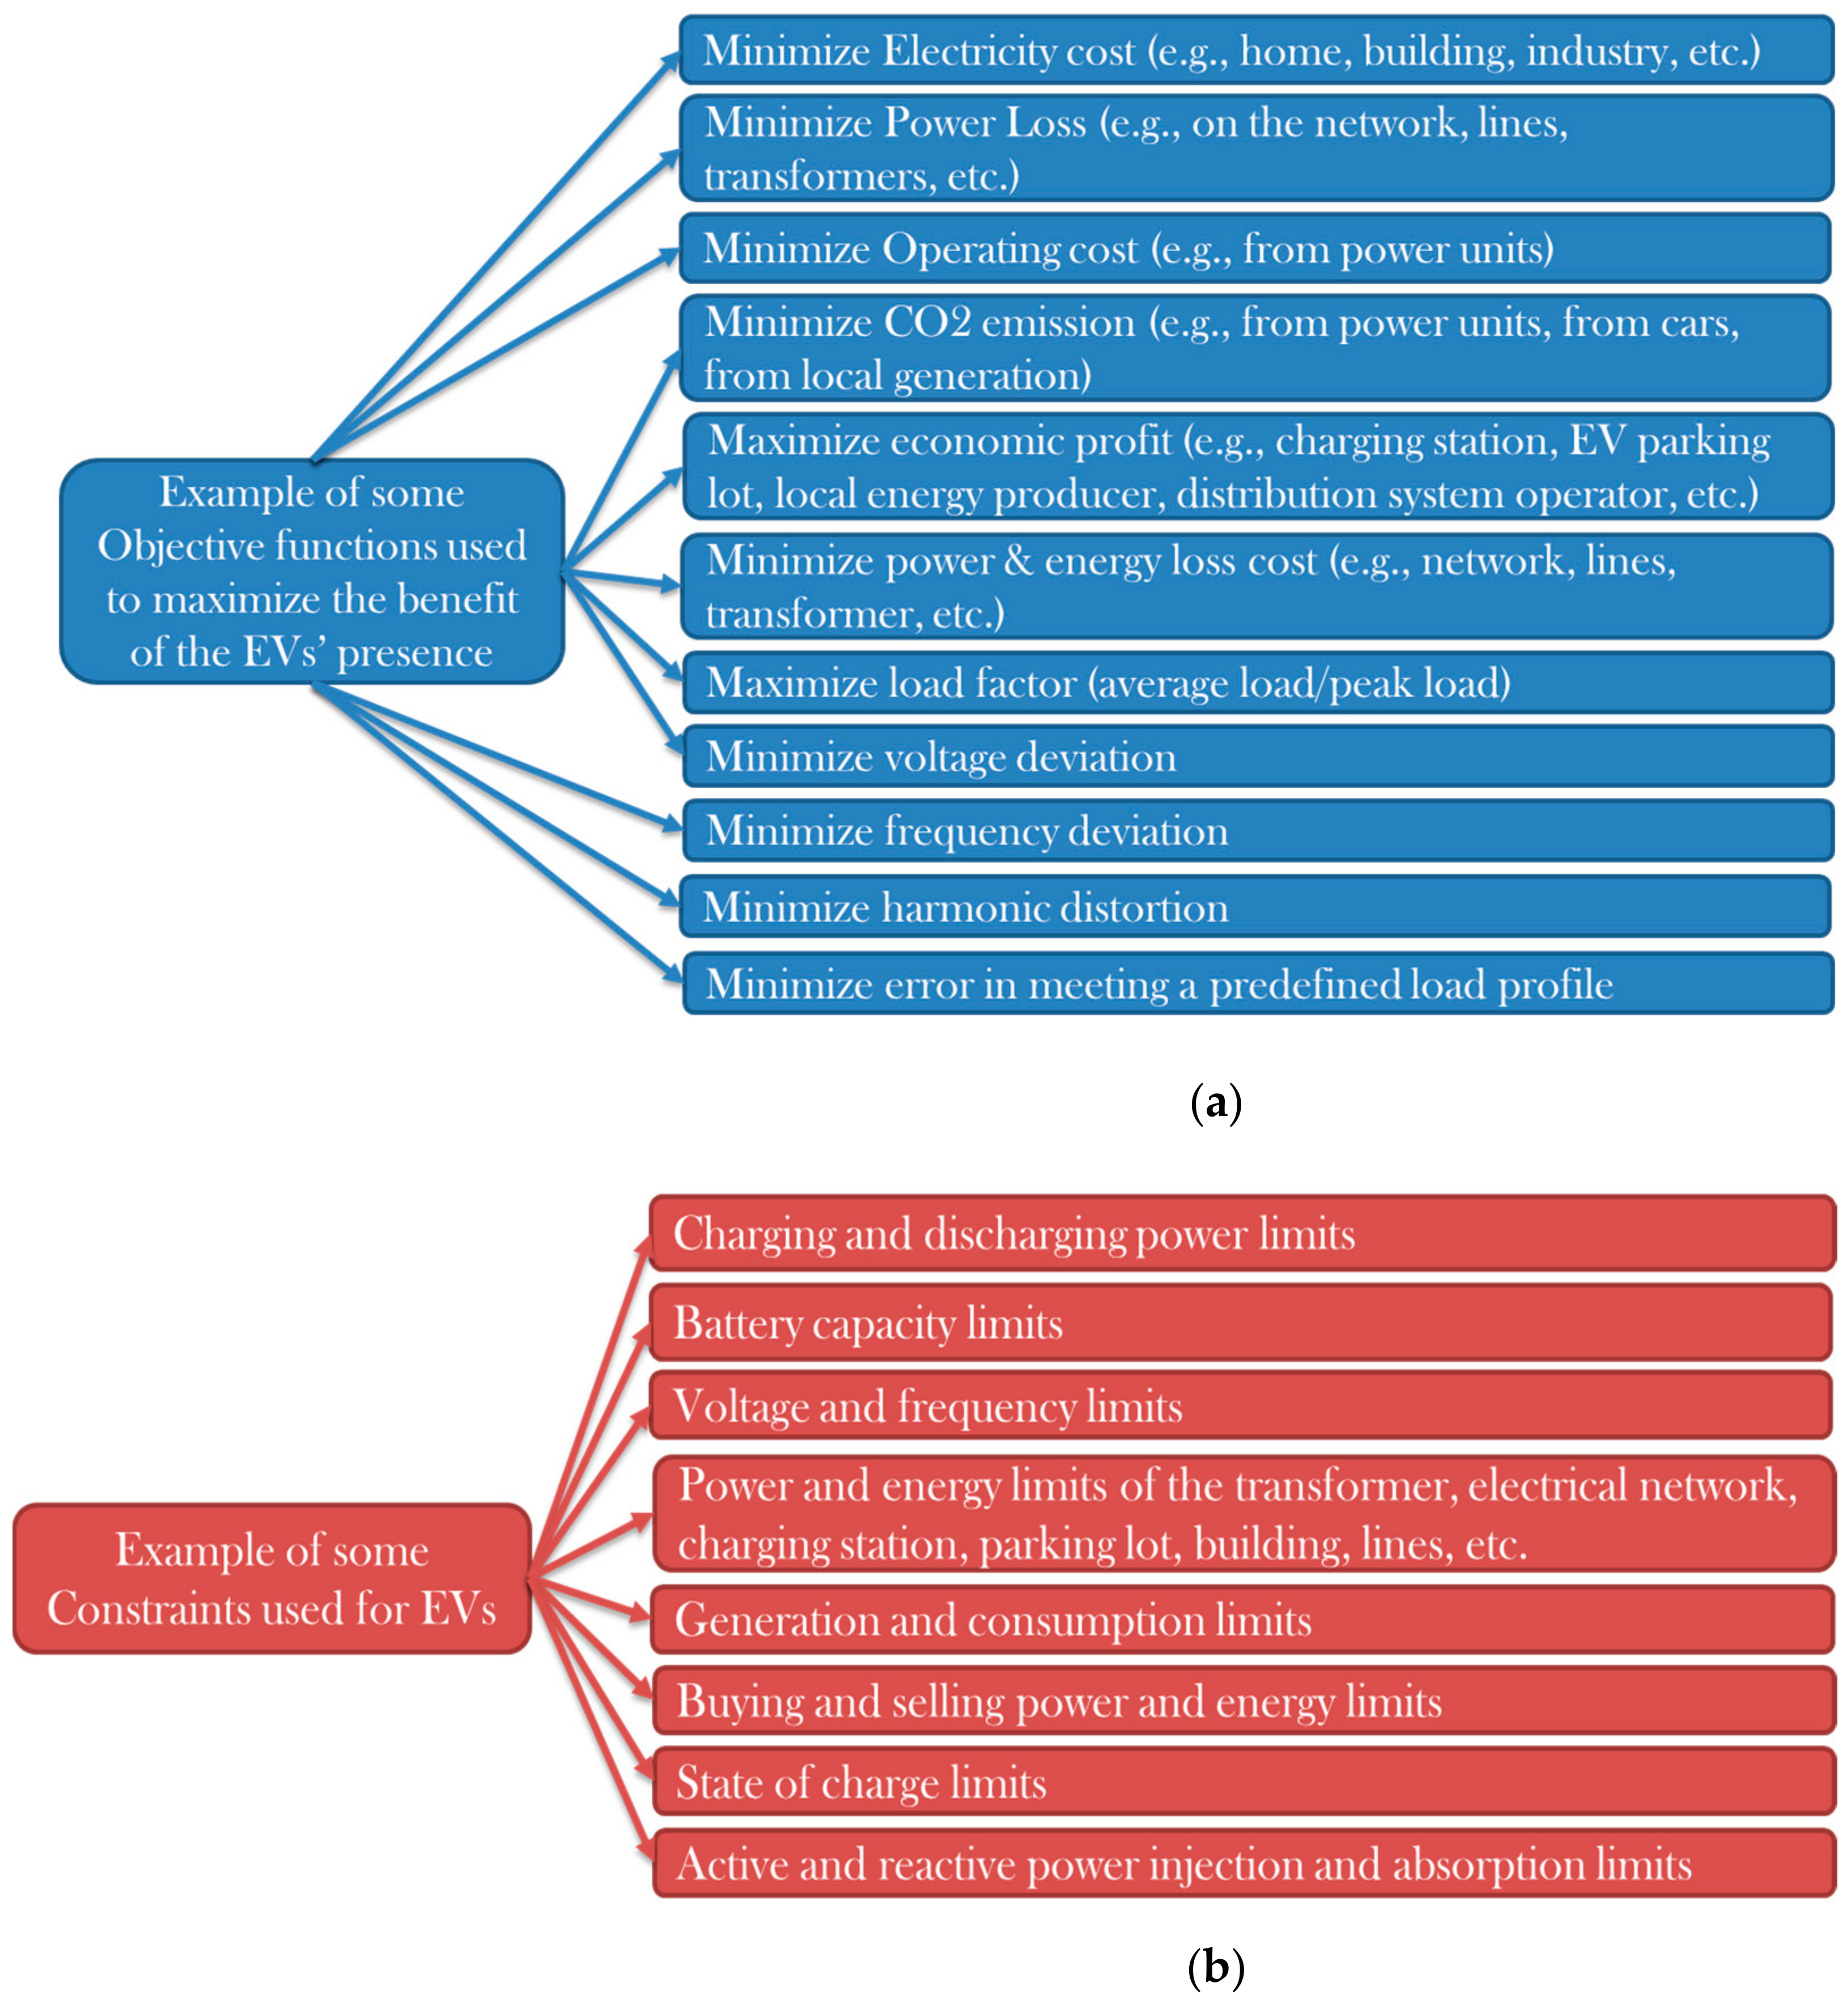
4.2. Objective Functions
| and | time-based electricity tariff (e.g., Time-of-Use (Pricing) (ToU), Real-Time Pricing (RTP)), [$/kWh] |
| and | bought and sold power from/to the grid, [kW] |
| and | limit-based electricity tariff of the energy [$/kWh] and power [$/kW] |
| and | energy and power limit that should be respected in order to avoid the additional tariff |
| and | ancillary service-based electricity price for the energy [$/kWh] and power [$/kW] |
| and | energy and power needed to provide ancillary services |
| and | incentive-based electricity tariff for the energy [$/kWh] and power [$/kW] |
| and | incentive-based energy and power limits |
4.3. Optimization Constraints
- Technical objectives, which include the minimization of energy losses, increased robustness, minimization of voltage deviation, support the integration of RES, balancing power supply and demand, and reducing peak power demand
- Economic objectives such as minimizing the cost of charging or deferral of transmission system upgrades
- Coupled techno-economic objectives that combine the two previous aspects influencing the total energy price to be paid by a client.
| Optimized Element | Constraints | Equation |
|---|---|---|
| Total load of a unit (e.g., home, building, etc.) | Power limits | |
| Absorption of reactive power limits | ||
| Injection of reactive power limits | ||
| Energy limits | ||
| Selling power limit | ||
| Selling energy limit | ||
| EV | Charging power limit | |
| Discharging power limit | ||
| State of charge limit | ||
| Final state of charge | ||
| Discharging to home and grid | ||
| BSS | Charging power limit | |
| Discharging power limit | ||
| State of charge limit | ||
| Final state of charge (optional) | ||
| Discharging to home and grid | ||
| PV | Discharging to home and grid | |
| Wind Turbine | Discharging to home and grid |
5. Future Work and Recommendations
- For S1 to S6, it is proposed to limit the charging power rate (e.g., 3kW) in order to reduce the adverse impact on the PG. The control of the charging rate should be done by the EV owner.
- For S3 and S4, it is recommended to create a mobile application that informs the user when to plug in his EV.
- S7, S9, S11, and S13 are recommended when the base load does not overpass the limits imposed by the transformer bus or PSO. They are not capable of reducing the peak load. Therefore, it is suggested to create a mobile application that can be used by the EV owners. It consists of informing them when they have to disconnect their EVs or how much charging power they should draw, depending on the information is supplied by the PSO. Of course, such a type of participation requires incentivizing offers such as a fixed or percent reduction on electricity costs.
- S8, S10, S12, and S14 are highly recommended to be used in almost any case. They allow the discharging during the on-peak time in order to reduce the peak load and respect the limits imposed by the transformer and PSO. The problem of these strategies is their high cost and complexity. In return, they help to stabilize the PG, generate revenues from providing ancillary services, etc. (refer to Table 5 and Table 6). In addition, the installation of capacitor banks and other elements on the network could be prevented or reduced.
- The most recommended strategy is S8, which has the highest performance rate compared to all strategies. It is quite similar to S12, but the difference is that S12 may not be used at home or for a single EV because it uses a discrete method.
| Charging Strategy | ||||||||||||||
|---|---|---|---|---|---|---|---|---|---|---|---|---|---|---|
| Description | S1:U-Di-C | S2: U-Di-CD | S3: U-De-C | S4: U-De-CD | S5: U-R-C | S6: U-R-CD | S7: CC-Di-C | S8: CC-Di-CD | S9: CC-De-C | S10: CC-De-CD | S11: DC-Di-C | S12: DC-Di-CD | S13: DC-De-C | S14: DC-De-CD |
| Recommended for a | ||||||||||||||
| 1. Home | M | M | M | M | M | M | Y | Y | Y | Y | - | - | - | - |
| 2. Parking lot | N | N | N | N | N | N | Y | Y | Y | Y | Y | Y | Y | Y |
| Recommended for a | ||||||||||||||
| 1. Small number of EVs on the same bus | M | M | M | M | M | M | Y | Y | Y | Y | Y | Y | Y | Y |
| 2. Medium number of EVs on the same bus | N | N | N | N | N | N | Y | Y | Y | Y | Y | Y | Y | Y |
| 3. Large number of EVs on the same bus | N | N | N | N | N | N | Y | Y | Y | Y | Y | Y | Y | Y |
| Overall rating (rating from 10 with 10 being the best) | 1 | 2 | 2 | 3 | 3 | 4 | 9 | 10 | 7 | 8 | 8 | 9 | 7 | 8 |
6. Conclusions
Author Contributions
Funding
Conflicts of Interest
Abbreviations
| BEV | Battery Electric Vehicle |
| CS | Charging Station |
| CST | Coordinated Strategies |
| EPRI | Electric Power Research Institute |
| EV | Electric Vehicles |
| G2V | Grid-to-Vehicle |
| H2V | Home-to-Vehicle |
| ICE | Internal Combustion Engine |
| IEA | International Energy Agency |
| PG | Power Grid |
| PHEV | Plug-in Hybrid Electric Vehicle |
| PL | Parking Lot |
| PSO | Power System Operator |
| RES | Renewable Energy Source |
| RTP | Real-Time Pricing |
| SAE | Society of Automotive Engineering |
| SOC | State-Of-Charge |
| ToU | Time-of-Use (Pricing) |
| UST | Uncoordinated Strategy |
| V2G | Vehicle-to-Grid |
| V2H | Vehicle-to-Home |
| V2V | Vehicle-to-Vehicle |
References
- BP. BP Statistical Review of World Energy, 68th ed.; BP: London, UK, 2019. [Google Scholar]
- BP. BP Energy Outlook 2035. In BP Energy Outlook; BP: London, UK, 2015. [Google Scholar]
- Energy Agency. Key World Energy Statistics 2019. Available online: https://webstore.iea.org/key-world-energy-statistics-2019 (accessed on 5 January 2020).
- IEA. World Energy Outlook 2019; IEA: Paris, France, 2019; Available online: https://www.iea.org/reports/world-energy-outlook-2019 (accessed on 20 December 2019).
- Trigg, T.; Telleen, P.; Boyd, R.; Cuenot, F.; D’Ambrosio, D.; Gaghen, R.; Gagné, J.F.; Hardcastle, A.; Houssin, D.; Jones, A.R. Global EV outlook: Understanding the electric vehicle landscape to 2020. Int. Energy Agency 2013, 1, 1–40. [Google Scholar]
- Ayre, J. Electric car demand growing, global market hits 740,000 units. Clean Tech. 2015, 23, 2019. Available online: https://www.bcsea.org/electric-car-demand-growing-global-market-hits-740000-units (accessed on 15 December 2019).
- Sharma, A.; Shih, S.; Srinivasan, D. A smart scheduling strategy for charging and discharging of electric vehicles. In Proceedings of the 2015 IEEE Innovative Smart Grid Technologies-Asia (ISGT ASIA), Bangkok, Thailand, 3–6 November 2015; pp. 1–6. [Google Scholar]
- Sovacool, B.K.; Hirsh, R.F. Beyond batteries: An examination of the benefits and barriers to plug-in hybrid electric vehicles (PHEVs) and a vehicle-to-grid (V2G) transition. Energy Policy 2009, 37, 1095–1103. [Google Scholar] [CrossRef]
- Sundstrom, O.; Binding, C. Flexible charging optimization for electric vehicles considering distribution grid constraints. IEEE Trans. Smart Grid 2011, 3, 26–37. [Google Scholar] [CrossRef]
- Kempton, W.; Letendre, S.E. Electric vehicles as a new power source for electric utilities. Transp. Res. Part D Transp. Environ. 1997, 2, 157–175. [Google Scholar] [CrossRef]
- Tomic, J.; Kempton, W. Using fleets of electric-drive vehicles for grid support. J. Power Sources 2007, 168, 459–468. [Google Scholar] [CrossRef]
- Saber, A.Y.; Venayagamoorthy, G.K. Intelligent unit commitment with vehicle-to-grid—A cost-emission optimization. J. Power Sources 2010, 195, 898–911. [Google Scholar] [CrossRef]
- Kempton, W.; Tomic, J. Vehicle-to-grid power fundamentals: Calculating capacity and net revenue. J. Power Sources 2005, 144, 268–279. [Google Scholar] [CrossRef]
- Bhattarai, B.P.; Myers, K.S.; Bak-Jensen, B.; Paudyal, S. Multi-time scale control of demand flexibility in smart distribution networks. Energies 2017, 10, 37. [Google Scholar] [CrossRef]
- Khan, S.U.; Mehmood, K.K.; Haider, Z.M.; Bukhari, S.B.A.; Lee, S.-J.; Rafique, M.K.; Kim, C.-H. Energy management scheme for an EV smart charger V2G/G2V application with an EV power allocation technique and voltage regulation. Appl. Sci. 2018, 8, 648. [Google Scholar] [CrossRef]
- Jourabchi, M. Impact of Plug-in Hybrid Vehicles on Northwest Power System: A Preliminary Assessment; Northwest Power and Conservation Council: Portland, OR, USA, 2008. [Google Scholar]
- Sioshansi, R.; Fagiani, R.; Marano, V. Cost and emissions impacts of plug-in hybrid vehicles on the Ohio power system. Energy Policy 2010, 38, 6703–6712. [Google Scholar] [CrossRef]
- Sioshansi, R.; Denholm, P. Emissions impacts and benefits of plug-in hybrid electric vehicles and vehicle-to-grid services. Environ. Sci. Technol. 2009, 43, 1199–1204. [Google Scholar] [CrossRef] [PubMed]
- Jansen, K.H.; Brown, T.M.; Samuelsen, G.S. Emissions impacts of plug-in hybrid electric vehicle deployment on the US western grid. J. Power Sources 2010, 195, 5409–5416. [Google Scholar] [CrossRef]
- Clement-Nyns, K.; Haesen, E.; Driesen, J. The impact of charging plug-in hybrid electric vehicles on a residential distribution grid. IEEE Trans. Power Syst. 2009, 25, 371–380. [Google Scholar] [CrossRef]
- Yilmaz, M.; Krein, P.T. Review of the impact of vehicle-to-grid technologies on distribution systems and utility interfaces. IEEE Trans. Power Electron. 2012, 28, 5673–5689. [Google Scholar] [CrossRef]
- Qian, K.; Zhou, C.; Allan, M.; Yuan, Y. Modeling of load demand due to EV battery charging in distribution systems. IEEE Trans. Power Syst. 2010, 26, 802–810. [Google Scholar] [CrossRef]
- Aravinthan, V.; Jewell, W. Controlled electric vehicle charging for mitigating impacts on distribution assets. IEEE Trans. Smart Grid 2015, 6, 999–1009. [Google Scholar] [CrossRef]
- Ng, K.-H.; Sheble, G.B. Direct load control-A profit-based load management using linear programming. IEEE Trans. Power Syst. 1998, 13, 688–694. [Google Scholar] [CrossRef]
- Sortomme, E.; El-Sharkawi, M.A. Optimal charging strategies for unidirectional vehicle-to-grid. IEEE Trans. Smart Grid 2010, 2, 131–138. [Google Scholar] [CrossRef]
- Mets, K.; D’hulst, R.; Develder, C. Comparison of intelligent charging algorithms for electric vehicles to reduce peak load and demand variability in a distribution grid. J. Commun. Netw. 2012, 14, 672–681. [Google Scholar] [CrossRef]
- Lee, T.-F.; Cho, M.-Y.; Hsiao, Y.-C.; Chao, P.-J.; Fang, F.-M. Optimization and implementation of a load control scheduler using relaxed dynamic programming for large air conditioner loads. IEEE Trans. Power Syst. 2008, 23, 691–702. [Google Scholar]
- Hsu, Y.-Y.; Su, C.-C. Dispatch of direct load control using dynamic programming. IEEE Trans. Power Syst. 1991, 6, 1056–1061. [Google Scholar]
- Han, S.; Han, S.; Sezaki, K. Development of an optimal vehicle-to-grid aggregator for frequency regulation. IEEE Trans. Smart Grid 2010, 1, 65–72. [Google Scholar]
- El-Bayeh, C.Z.; Mougharbel, I.; Saad, M.; Chandra, A.; Lefebvre, S.; Asber, D.; Lenoir, L. A novel approach for sizing electric vehicles Parking Lot located at any bus on a network. In Proceedings of the 2016 IEEE Power and Energy Society General Meeting (PESGM), Boston, MA, USA, 17–21 July 2016. [Google Scholar]
- EPRI. Environmental Assessment of Plug-In Hybrid Electric Vehicles. In Volume 1: Nationwide Greenhouse Gas Emissions; Final Report; Electric Power Research Institute (EPRI): Palo Alto, CA, USA, 2007. [Google Scholar]
- Samaras, C.; Meisterling, K. Life Cycle Assessment of Greenhouse Gas Emissions from Plug-In Hybrid Vehicles: Implications for Policy. Environ. Sci. Technol. 2008, 42, 3170–3176. [Google Scholar] [CrossRef]
- Masoum, M.A.; Moses, P.S.; Hajforoosh, S. Distribution transformer stress in smart grid with coordinated charging of plug-in electric vehicles. In Proceedings of the 2012 IEEE PES Innovative Smart Grid Technologies (ISGT), Washington, DC, USA, 16–20 January 2012; pp. 1–8. [Google Scholar]
- Schneider, K.; Gerkensmeyer, C.; Kintner-Meyer, M.; Fletcher, R. Impact assessment of plug-in hybrid vehicles on pacific northwest distribution systems. In Proceedings of the 2008 IEEE Power and Energy Society General Meeting-Conversion and Delivery of Electrical Energy in the 21st Century, Pittsburgh, PA, USA, 20–24 July 2008; pp. 1–6. [Google Scholar]
- Yang, Z.; Li, K.; Foley, A.; Zhang, C. Optimal scheduling methods to integrate plug-in electric vehicles with the power system: A review. IFAC Proc. Int. Fed. Autom. Control 2014, 47, 8594–8603. [Google Scholar] [CrossRef]
- Yilmaz, M.; Krein, P.T. Review of battery charger topologies, charging power levels, and infrastructure for plug-in electric and hybrid vehicles. IEEE Trans. Power Electron. 2012, 28, 2151–2169. [Google Scholar] [CrossRef]
- Solanke, T.U.; Ramachandaramurthy, V.K.; Yonga, J.Y.; Pasupuleti, J.; Kasinathan, P.; Rajagopalan, A. A review of strategic charging–discharging control of grid-connected electric vehicles. J. Energy Storage 2020, 28, 101193. [Google Scholar] [CrossRef]
- Hua, L.; Wang, J.; Zhou, C. Adaptive electric vehicle charging coordination on distribution network. IEEE Trans. Smart Grid 2014, 5, 2666–2675. [Google Scholar]
- Masoum, A.S.; Deilami, S.; Abu-Siada, A.; Masoum, M.A.S. Fuzzy approach for online coordination of plug-in electric vehicle charging in smart grid. IEEE Trans. Sustain. Energy 2014, 6, 1112–1121. [Google Scholar] [CrossRef]
- O’Connell, A.; Flynn, D.; Richardson, P.; Keane, A. Controlled charging of electric vehicles in residential distribution networks. In Proceedings of the 2012 3rd IEEE PES Innovative Smart Grid Technologies Europe (ISGT Europe), Berlin, Germany, 14–17 October 2012; pp. 1–7. [Google Scholar]
- Aldaoudeyeh, A.-M.I.; Kavasseri, R.G.; Lima, I.T. Characterization of Forward Electricity Market Price Variations and Price-Responsive Demands. In Proceedings of the 2017 Ninth Annual IEEE Green Technologies Conference (GreenTech), Denver, CO, USA, 29–31 March 2017; pp. 211–218. [Google Scholar]
- Clement, K.; Haesen, E.; Driesen, J. Coordinated charging of multiple plug-in hybrid electric vehicles in residential distribution grids. In Proceedings of the 2009 IEEE/PES Power Systems Conference and Exposition, Seattle, WA, USA, 15–18 March 2009; pp. 1–7. [Google Scholar]
- Clement-Nyns, K.; Haesen, E.; Driesen, J. The impact of vehicle-to-grid on the distribution grid. Electr. Power Syst. Res. 2011, 81, 185–192. [Google Scholar] [CrossRef]
- Deilami, S.; Masoum, A.S.; Moses, P.S.; Masoum, M.A.S. Real-time coordination of plug-in electric vehicle charging in smart grids to minimize power losses and improve voltage profile. IEEE Trans. Smart Grid 2011, 2, 456–467. [Google Scholar] [CrossRef]
- Moses, P.S.; Masoum, M.A.; Hajforoosh, S. Overloading of distribution transformers in smart grid due to uncoordinated charging of plug-In electric vehicles. In Proceedings of the 2012 IEEE PES Innovative Smart Grid Technologies (ISGT), Washington, DC, USA, 16–20 January 2012; pp. 1–6. [Google Scholar]
- Cao, Y.; Tang, S.; Li, C.; Zhang, P.; Tan, Y.; Zhang, Z.; Li, J. An optimized EV charging model considering TOU price and SOC curve. IEEE Trans. Smart Grid 2011, 3, 388–393. [Google Scholar] [CrossRef]
- Khodayar, M.E.; Wu, L.; Shahidehpour, M. Hourly coordination of electric vehicle operation and volatile wind power generation in SCUC. IEEE Trans. Smart Grid 2012, 3, 1271–1279. [Google Scholar] [CrossRef]
- He, Y.; Venkatesh, B.; Guan, L. Optimal scheduling for charging and discharging of electric vehicles. IEEE Trans. Smart Grid 2012, 3, 1095–1105. [Google Scholar] [CrossRef]
- Ma, Z.; Callaway, D.; Hiskens, I. Decentralized charging control for large populations of plug-in electric vehicles: Application of the Nash certainty equivalence principle. In Proceedings of the 2010 IEEE International Conference on Control Applications, Yokohama, Japan, 8–10 September 2010; pp. 191–195. [Google Scholar]
- Heydt, G.T. The impact of electric vehicle deployment on load management straregies. IEEE Trans. Power Appar. Syst. 1983, 5, 1253–1259. [Google Scholar] [CrossRef]
- Ahn, C.; Li, C.-T.; Peng, H. Optimal decentralized charging control algorithm for electrified vehicles connected to smart grid. J. Power Sources 2011, 196, 10369–10379. [Google Scholar] [CrossRef]
- Xu, G. Optimal Scheduling for Charging Electric Vehicles with Fixed Setup Costs. Master’s Thesis, Department of Industrial Engineering, University of Louisville, Louisville, KY, USA, 2013. [Google Scholar]
- Nguyen, V.-L.; Tran-Quoc, T.; Bacha, S.; Nguyen, B. Charging strategies to minimize the peak load for an electric vehicle fleet. In Proceedings of the IECON 2014-40th Annual Conference of the IEEE Industrial Electronics Society, Dallas, TX, USA, 29 October–1 November 2014; pp. 3522–3528. [Google Scholar]
- Liu, C.; Chau, K.T.; Wu, D.; Gao, S. Opportunities and challenges of vehicle-to-home, vehicle-to-vehicle, and vehicle-to-grid technologies. Proc. IEEE 2013, 101, 2409–2427. [Google Scholar] [CrossRef]
- Callaway, D.S.; Hiskens, I.A. Achieving controllability of electric loads. Proc. IEEE 2010, 99, 184–199. [Google Scholar] [CrossRef]
- Saber, A.Y.; Venayagamoorthy, G.K. Plug-in vehicles and renewable energy sources for cost and emission reductions. IEEE Trans. Ind. Electron. 2010, 58, 1229–1238. [Google Scholar] [CrossRef]
- Al-Awami, A.T.; Sortomme, E. Coordinating vehicle-to-grid services with energy trading. IEEE Trans. Smart Grid 2011, 3, 453–462. [Google Scholar] [CrossRef]
- Su, W.; Eichi, H.; Zeng, W.; Chow, M.Y. A survey on the electrification of transportation in a smart grid environment. IEEE Trans. Ind. Inform. 2011, 8, 1–10. [Google Scholar] [CrossRef]
- Tuttle, D.P.; Baldick, R. The evolution of plug-in electric vehicle-grid interactions. IEEE Trans. Smart Grid 2012, 3, 500–505. [Google Scholar] [CrossRef]
- Kempton, W.; Tomic, J. Vehicle-to-grid power implementation: From stabilizing the grid to supporting large-scale renewable energy. J. Power Sources 2005, 144, 280–294. [Google Scholar] [CrossRef]
- DiPeso, J. Cars to grid: An electrifying idea. Environ. Qual. Manag. 2008, 18, 89–94. [Google Scholar] [CrossRef]
- Quinn, C.; Zimmerle, D.; Bradley, T.H. The effect of communication architecture on the availability, reliability, and economics of plug-in hybrid electric vehicle-to-grid ancillary services. J. Power Sources 2010, 195, 1500–1509. [Google Scholar] [CrossRef]
- Markel, T.; Kuss, M.; Denholm, P. Communication and control of electric drive vehicles supporting renewables. In Proceedings of the 2009 IEEE Vehicle Power and Propulsion Conference, Dearborn, MI, USA, 7–10 September 2009; pp. 27–34. [Google Scholar]
- Scholer, R.A.; Maitra, A.; Ornelas, E.; Bourton, M.; Salazar, J. Communication between plug-in vehicles and the utility grid. In SAE Technical Paper; SAE International: Warrendale, PA, USA, 2010. [Google Scholar]
- Communication between Plug-In Vehicles and Off-Board DC Chargers. 2011. Available online: http://standards.sae.org/wip/j2847/2/ (accessed on 7 February 2019).
- Gungor, V.C.; Sahin, D.; Kocak, T.; Ergut, S.; Buccella, C.; Cecati, C.; Hancke, G.P. Smart grid technologies: Communication technologies and standards. IEEE Trans. Ind. Inform. 2011, 7, 529–539. [Google Scholar] [CrossRef]
- Ferreira, J.C.; Monteiro, V.; Afonso, J.L. Smart electric vehicle charging system. In Proceedings of the 2011 IEEE Intelligent Vehicles Symposium (IV), Baden-Baden, Germany, 5–9 June 2011; pp. 758–763. [Google Scholar]
- Lassila, J.; Haakana, J.; Tikka, V.; Partanen, J. Methodology to analyze the economic effects of electric cars as energy storages. IEEE Trans. Smart Grid 2011, 3, 506–516. [Google Scholar] [CrossRef]
- Pillai, J.R.; Bak-Jensen, B. Integration of vehicle-to-grid in the western Danish power system. IEEE Trans. Sustain. Energy 2010, 2, 12–19. [Google Scholar] [CrossRef]
- Singh, M.; Kumar, P.; Kar, I. Implementation of vehicle to grid infrastructure using fuzzy logic controller. IEEE Trans. Smart Grid 2012, 3, 565–577. [Google Scholar] [CrossRef]
- Kempton, W.; Udo, V.; Huber, K.; Komara, K.; Letendre, S.; Baker, S.; Brunner, D.; Pearre, N. A test of vehicle-to-grid (V2G) for energy storage and frequency regulation in the PJM system. In Results from an Industry-University Research Partnership 32; University of Delaware: Newark, DE, USA, November 2008. [Google Scholar]
- Bashash, S.; Fathy, H.K. Transport-based load modeling and sliding mode control of plug-in electric vehicles for robust renewable power tracking. IEEE Trans. Smart Grid 2011, 3, 526–534. [Google Scholar] [CrossRef]
- Falahi, M.; Chou, H.M.; Ehsani, M.; Xie, L.; Butler-Purry, K.L. Potential power quality benefits of electric vehicles. IEEE Trans. Sustain. Energy 2013, 4, 1016–1023. [Google Scholar]
- Hu, W.; Su, C.; Chen, Z.; Bak-Jensen, B. Optimal operation of plug-in electric vehicles in power systems with high wind power penetrations. IEEE Trans. Sustain. Energy 2013, 4, 577–585. [Google Scholar]
- Dallinger, D.; Krampe, D.; Wietschel, M. Vehicle-to-grid regulation reserves based on a dynamic simulation of mobility behavior. IEEE Trans. Smart Grid 2011, 2, 302–313. [Google Scholar] [CrossRef]
- Richardson, P.; Flynn, D.; Keane, A. Optimal charging of electric vehicles in low-voltage distribution systems. IEEE Trans. Power Syst. 2011, 27, 268–279. [Google Scholar] [CrossRef]
- Monteiro, V.; Pinto, J.; Afonso, J.L. Improved vehicle-for-grid (iV4G) mode: Novel operation mode for EVs battery chargers in smart grids. Int. J. Electr. Power Energy Syst. 2019, 110, 579–587. [Google Scholar] [CrossRef]
- Kempton, W.; Jasna, T.; Steven, L.; Alec, B.; Timothy, L. Vehicle-to-Grid Power: Battery, Hybrid, and Fuel Cell Vehicles as Resources for Distributed Electric Power in California; Institution of Transportation Studies, University of California: Davis, CA, USA, June 2001. [Google Scholar]
- Peterson, S.B.; Whitacre, J.; Apt, J. The economics of using plug-in hybrid electric vehicle battery packs for grid storage. J. Power Sources 2010, 195, 2377–2384. [Google Scholar] [CrossRef]
- Srivastava, A.K.; Annabathina, B.; Kamalasadan, S. The challenges and policy options for integrating plug-in hybrid electric vehicle into the electric grid. Electr. J. 2010, 23, 83–91. [Google Scholar] [CrossRef]
- Sortomme, E.; Hindi, M.M.; MacPherson, J.S.D.; Venkata, S.S. Coordinated charging of plug-in hybrid electric vehicles to minimize distribution system losses. IEEE Trans. Smart Grid 2010, 2, 198–205. [Google Scholar] [CrossRef]
- Peterson, S.B.; Apt, J.; Whitacre, J. Lithium-ion battery cell degradation resulting from realistic vehicle and vehicle-to-grid utilization. J. Power Sources 2010, 195, 2385–2392. [Google Scholar] [CrossRef]
- Andersson, S.-L.; Elofsson, A.K.; Galus, M.D.; Göransson, L.; Karlsson, S.; Johnsson, F.; Andersson, G. Plug-in hybrid electric vehicles as regulating power providers: Case studies of Sweden and Germany. Energy Policy 2010, 38, 2751–2762. [Google Scholar] [CrossRef]
- Williams, B.D.; Kurani, K.S. Commercializing light-duty plug-in/plug-out hydrogen-fuel-cell vehicles: Mobile Electricity, technologies and opportunities. J. Power Sources 2007, 166, 549–566. [Google Scholar] [CrossRef]
- Brooks, A.; Thesen, S.H. PG&E and tesla motors: Vehicle to grid demonstration and evaluation program. In Proceedings of the 23rd Electric Vehicles Symposium, Green Car Congress, Energy, Technologies, Issues and Policies for Sustainable Mobility, 12 September 2007; pp. 1–10. [Google Scholar]
- Dogger, J.D.; Roossien, B.; Nieuwenhout, F.D. Characterization of Li-ion batteries for intelligent management of distributed grid-connected storage. IEEE Trans. Energy Convers. 2010, 26, 256–263. [Google Scholar] [CrossRef]
- Moghbel, M.; Masoum, M.A.; Fereidoni, A. Coordinated charging of plug-in electric vehicles in unbalanced three-phase residential networks with smart three-phase charger. In Proceedings of the 2014 Australasian Universities Power Engineering Conference (AUPEC), Perth, WA, Australia, 28 September–1 October 2014; pp. 1–6. [Google Scholar]
- Galus, M.D.; Zima, M.; Andersson, G. On integration of plug-in hybrid electric vehicles into existing power system structures. Energy Policy 2010, 38, 6736–6745. [Google Scholar] [CrossRef]
- Koyanagi, F.; Uriu, Y. A strategy of load leveling by charging and discharging time control of electric vehicles. IEEE Trans. Power Syst. 1998, 13, 1179–1184. [Google Scholar] [CrossRef]
- Wu, D.; Chau, K.; Gao, S. Multilayer framework for vehicle-to-grid operation. In Proceedings of the 2010 IEEE Vehicle Power and Propulsion Conference, Lille, France, 1–3 September 2010; pp. 1–6. [Google Scholar]
- Lopes, J.A.P.; Soares, F.J.; Almeida, P.M.R. Integration of electric vehicles in the electric power system. IEEE Trans. Smart Grid 2010, 99, 168–183. [Google Scholar] [CrossRef]
- Choudhary, N.; Li, C.; Chung, H.-S.; Moore, J.; Thomas, J.; Jung, Y. High-performance one-body core/shell nanowire supercapacitor enabled by conformal growth of capacitive 2D WS2 layers. ACS Nano 2016, 10, 10726–10735. [Google Scholar] [CrossRef]
- Guo, D.; Zhou, C. Realistic modeling of vehicle-to-grid in an enterprise parking lot: A stackelberg game approach. In Proceedings of the 2018 IEEE Texas Power and Energy Conference (TPEC), College Station, TX, USA, 8–9 February 2018; pp. 1–6. [Google Scholar]
- Moghe, R.; Kreikebaum, F.; Hernandez, J.E.; Kandula, R.P.; Divan, D. Mitigating distribution transformer lifetime degradation caused by grid-enabled vehicle (GEV) charging. In Proceedings of the 2011 IEEE Energy Conversion Congress and Exposition, Phoenix, AZ, USA, 17–22 September 2011; pp. 835–842. [Google Scholar]
- Gong, Q.; Midlam-Mohler, S.; Marano, V.; Rizzoni, G. Study of PEV charging on residential distribution transformer life. IEEE Trans. Smart Grid 2011, 3, 404–412. [Google Scholar] [CrossRef]
- Yunus, K.J.; Reza, M.; Zelaya-De La Parra, H.; Srivastava, K. Impacts of stochastic residential plug-in electric vehicle charging on distribution grid. In Proceedings of the 2012 IEEE PES Innovative Smart Grid Technologies (ISGT), Washington, DC, USA, 16–20 January 2012; pp. 1–8. [Google Scholar]
- Kelly, L.; Rowe, A.; Wild, P. Analyzing the impacts of plug-in electric vehicles on distribution networks in British Columbia. In Proceedings of the 2009 IEEE Electrical Power & Energy Conference (EPEC), Montreal, QC, Canada, 22–23 October 2009; pp. 1–6. [Google Scholar]
- Van Vliet, O.; Brouwer, A.S.; Kuramochi, T.; van den Broek, M.; Faaij, A. Energy use, cost and CO2 emissions of electric cars. J. Power Sources 2011, 196, 2298–2310. [Google Scholar] [CrossRef]
- Hadley, S.W.; Tsvetkova, A.A. Potential impacts of plug-in hybrid electric vehicles on regional power generation. Electr. J. 2009, 22, 56–68. [Google Scholar] [CrossRef]
- El-Bayeh, C.Z.; Mougharbel, I.; Saad, M.; Chandra, A.; Lefebvre, S.; Asber, D.; Lenoir, L. A detailed review on the parameters to be considered for an accurate estimation on the Plug-in Electric Vehicle’s final State of Charge. In Proceedings of the 2016 3rd International Conference on Renewable Energies for Developing Countries (REDEC), Zouk Mosbeh, Lebanon, 13–15 July 2016; pp. 1–6. [Google Scholar]
- Bellman, R. Dynamic programming and Lagrange multipliers. Proc. Natl. Acad. Sci. USA 1956, 42, 767–769. [Google Scholar] [CrossRef]
- Gass, S.I. Linear Programming: Methods and Applications, 5th ed.; Dover Publications: Mineola, NY, USA, 2010. [Google Scholar]
- Schuller, A.; Ilg, J.; van Dinther, C. Benchmarking electric vehicle charging control strategies. In Proceedings of the 2012 IEEE PES Innovative Smart Grid Technologies (ISGT), Washington, DC, USA, 16–20 January 2012; pp. 1–8. [Google Scholar]
- Ramachandran, B.; Ramanathan, A. Decentralized demand side management and control of PEVs connected to a smart grid. In Proceedings of the Power Systems Conference (PSC), 2015 Clemson University, Carolina, CA, USA, 10–13 March 2015; pp. 1–7. [Google Scholar] [CrossRef]
- Yunjian, X.; Feng, P. Scheduling for charging plug-in hybrid electric vehicles, in Decision and Control (CDC). In Proceedings of the 2012 IEEE 51st Annual Conference, Maui, HI, USA, 10–13 December 2012; pp. 2495–2501. [Google Scholar] [CrossRef]
- Hajimiragha, A.; Canizares, C.A.; Fowler, M.W.; Elkamel, A. Optimal transition to plug-in hybrid electric vehicles in Ontario, Canada, considering the electricity-grid limitations. IEEE Trans. Ind. Electron. 2009, 57, 690–701. [Google Scholar] [CrossRef]
- Phan, D.T.; Xiong, J.; Ghosh, S. A distributed scheme for fair EV charging under transmission constraints. In Proceedings of the 2012 American Control Conference (ACC), Montreal, QC, Canada, 27–29 June 2012; pp. 1053–1058. [Google Scholar]
- Myerson, R.B. Game Theory: Analysis of Conflict; Harvard University Press: Cambridge, MA, USA, 1997. [Google Scholar]
- Ma, Z.; Callaway, D.S.; Hiskens, I.A. Decentralized charging control of large populations of plug-in electric vehicles. IEEE Trans. Control Syst. Technol. 2011, 21, 67–78. [Google Scholar] [CrossRef]
- Kleinrock, L. Queueing systems. In Volume I: Theory; Wiley-Interscience: Hoboken, NJ, USA, 1975. [Google Scholar]
- Yang, X.-S. Nature-Inspired Metaheuristic Algorithms; Luniver Press: Bristol, UK, 2010. [Google Scholar]
- Skalak, D.B. Prototype and feature selection by sampling and random mutation hill climbing algorithms. In Machine Learning, Proceedings of the Eleventh International Conference, Rutgers University, New Brunswick, NJ, USA, 10–13 July 1994; Morgan Kaufmann Publishers: Burlington, MA, USA, 1994; pp. 293–301. [Google Scholar]
- Aarts, E.; Korst, J. Simulated Annealing and Boltzmann Machines: A Stochastic Approach to Combinatorial Optimization and Neural Computing; John Wiley & Sons, Inc.: New York, NY, USA, 1989; p. 272. [Google Scholar]
- Dorigo, M.; Birattari, M.; Blum, C.; Clerc, M.; Stützle, T.; Winfield, A.F.T. Ant Colony Optimization and Swarm Intelligence. In Proceedings of the 5th International Workshop, ANTS 2006, Brussels, Belgium, 4–7 September 2006; Springer: Berlin/Heidelberg, Germany, 2006; Volume 4150. [Google Scholar]
- Simon, D. Biogeography-based optimization. IEEE Trans. Evol. Comput. 2008, 12, 702–713. [Google Scholar] [CrossRef]
- Hansen, N.; Ostermeier, A. Completely derandomized self-adaptation in evolution strategies. Evol. Comput. 2001, 9, 159–195. [Google Scholar] [CrossRef] [PubMed]
- Storn, R.; Price, K. Differential evolution–a simple and efficient heuristic for global optimization over continuous spaces. J. Glob. Optim. 1997, 11, 341–359. [Google Scholar] [CrossRef]
- Su, W.; Chow, M.-Y. Computational intelligence-based energy management for a large-scale PHEV/PEV enabled municipal parking deck. Appl. Energy 2012, 96, 171–182. [Google Scholar] [CrossRef]
- Su, W.; Chow, M.-Y. Performance evaluation of an EDA-based large-scale plug-in hybrid electric vehicle charging algorithm. IEEE Trans. Smart Grid 2011, 3, 308–315. [Google Scholar] [CrossRef]
- Goldberg, D.E.; Holland, J.H. Genetic Algorithms and Machine Learning; Springer: Berlin, Germany, 1988. [Google Scholar]
- Piccolo, A.; Ippolito, L.; zo Galdi, V.; Vaccaro, A. Optimisation of energy flow management in hybrid electric vehicles via genetic algorithms. In Proceedings of the 2001 IEEE/ASME International Conference on Advanced Intelligent Mechatronics, Proceedings (Cat. No.01TH8556), Como, Italy, 8–12 July 2001; Volume 1, pp. 434–439. [Google Scholar]
- Damousis, I.G.; Bakirtzis, A.G.; Dokopoulos, P.S. A solution to the unit-commitment problem using integer-coded genetic algorithm. IEEE Trans. Power Syst. 2004, 2, 1165–1172. [Google Scholar] [CrossRef]
- Cheng, C.-P.; Liu, C.-W.; Liu, C.-C. Unit commitment by Lagrangian relaxation and genetic algorithms. IEEE Trans. Power Syst. 2000, 15, 707–714. [Google Scholar] [CrossRef]
- Bashash, S.; Moura, S.J.; Fathy, H.K. On the aggregate grid load imposed by battery health-conscious charging of plug-in hybrid electric vehicles. J. Power Sources 2011, 196, 8747–8754. [Google Scholar] [CrossRef]
- Ciornei, I.; Kyriakides, E. A GA-API solution for the economic dispatch of generation in power system operation. IEEE Trans. Power Syst. 2011, 27, 233–242. [Google Scholar] [CrossRef]
- Geem, Z.W.; Kim, J.H.; Loganathan, G.V. A new heuristic optimization algorithm: Harmony search. Simulation 2001, 76, 60–68. [Google Scholar] [CrossRef]
- Hajforoosh, S.; Nabavi, S.; Masoum, M. Coordinated aggregated-based particle swarm optimisation algorithm for congestion management in restructured power market by placement and sizing of unified power flow controller. IET Sci. Meas. Technol. 2012, 6, 267–278. [Google Scholar] [CrossRef]
- Kennedy, J.; Eberhart, R. Particle swarm optimization. In Proceedings of the ICNN’95-International Conference on Neural Networks, Perth, WA, Australia, 27 November–1 December 1995; Volume 4, pp. 1942–1948. [Google Scholar]
- Hutson, C.; Venayagamoorthy, G.K.; Corzine, K.A. Intelligent scheduling of hybrid and electric vehicle storage capacity in a parking lot for profit maximization in grid power transactions. In Proceedings of the 2008 IEEE Energy 2030 Conference, Atlanta, GA, USA, 17–18 November 2008; pp. 1–8. [Google Scholar]
- Miranda, V.; Fonseca, N. EPSO-evolutionary particle swarm optimization, a new algorithm with applications in power systems. In Proceedings of the IEEE/PES Transmission and Distribution Conference and Exhibition, Yokohama, Japan, 6–10 October 2002; Volume 2, pp. 745–750. [Google Scholar]
- Venayagamoorthy, G.K.; Mitra, P.; Corzine, K.; Huston, C. Real-time modeling of distributed plug-in vehicles for V2G transactions. In Proceedings of the 2009 IEEE Energy Conversion Congress and Exposition, San Jose, CA, USA, 20–24 September 2009; pp. 3937–3941. [Google Scholar]
- Ting, T.; Rao, M.; Loo, C. A novel approach for unit commitment problem via an effective hybrid particle swarm optimization. IEEE Trans. Power Syst. 2006, 21, 411–418. [Google Scholar] [CrossRef]
- Zhao, J.; Wen, F.; Dong, Z.Y.; Xue, Y.; Wong, K.P. Optimal dispatch of electric vehicles and wind power using enhanced particle swarm optimization. IEEE Trans. Ind. Inform. 2012, 8, 889–899. [Google Scholar] [CrossRef]
- Meng, K.; Wang, H.G.; Dong, Z.Y.; Wong, K.P. Quantum-inspired particle swarm optimization for valve-point economic load dispatch. IEEE Trans. Power Syst. 2009, 25, 215–222. [Google Scholar] [CrossRef]
- Niknam, T.; Azizipanah-Abarghooee, R.; Aghaei, J. A new modified teaching-learning algorithm for reserve constrained dynamic economic dispatch. IEEE Trans. Power Syst. 2012, 28, 749–763. [Google Scholar] [CrossRef]
- AMPL Download a Demo Version. 2020. Available online: http://ampl.com/try-ampl/download-a-demo-version/ (accessed on 14 December 2020).
- Battistelli, C.; Baringo, L.; Conejo, A. Optimal energy management of small electric energy systems including V2G facilities and renewable energy sources. Electr. Power Syst. Res. 2012, 92, 50–59. [Google Scholar] [CrossRef]
- Sousa, T.; Morais, H.; Vale, Z.; Faria, P.; Soares, J. Intelligent energy resource management considering vehicle-to-grid: A simulated annealing approach. IEEE Trans. Smart Grid 2011, 3, 535–542. [Google Scholar] [CrossRef]
- All Solvers for AMPL. 2020. Available online: http://ampl.com/products/solvers/all-solvers-for-ampl/ (accessed on 15 December 2020).
- Leemput, N.; Leemput, N.; Van Roy, J.; Geth, F.; Tant, P.; Claessens, B.; Driesen, J. Comparative analysis of coordination strategies for electric vehicles. In Proceedings of the 2011 2nd IEEE PES International Conference and Exhibition on Innovative Smart Grid Technologies, Manchester, UK, 5–7 December 2011; pp. 1–8. [Google Scholar]
- De Breucker, S.; Jacqmaer, P.; De Brabandere, K.; Driesen, J.; Belmans, R. Grid Power Quality Improvements Using Grid-Coupled Hybrid Electric Vehicles Pemd 2006. In Proceedings of the 3rd IET International Conference on Power Electronics, Machines and Drives (PEMD 2006), Dublin, Ireland, 4–6 April 2006. [Google Scholar]
- Xiong, S.; Ji, J.; Ma, X. Comparative life cycle energy and GHG emission analysis for BEVs and PHEVs: A case study in China. Energies 2019, 12, 834. [Google Scholar] [CrossRef]
- Yeddanapudi, S.R.K.; Li, Y.; McCalley, J.D.; Chowdhury, A.A.; Jewell, W.T. Risk-based allocation of distribution system maintenance resources. IEEE Trans. Power Syst. 2008, 23, 287–295. [Google Scholar] [CrossRef]
- Shiau, C.-S.N.; Samaras, C.; Hauffe, R.; Michalek, J.J. Impact of battery weight and charging patterns on the economic and environmental benefits of plug-in hybrid vehicles. Energy Policy 2009, 37, 2653–2663. [Google Scholar] [CrossRef]
- Weiller, C. Plug-in hybrid electric vehicle impacts on hourly electricity demand in the United States. Energy Policy 2011, 39, 3766–3778. [Google Scholar] [CrossRef]
- Milano, F. Power System Analysis Toolbox. In Documentation for PSAT Version 2.0.0; Prof. Federico Milano’s Website; University College Dublin: Dublin, Ireland, 2008. [Google Scholar]
- Li, C.; Tang, S.; Cao, Y.; Xu, Y.; Li, Y.; Li, J.; Zhang, R. A new stepwise power tariff model and its application for residential consumers in regulated electricity markets. IEEE Trans. Power Syst. 2012, 28, 300–308. [Google Scholar] [CrossRef]
- Torabikalaki, R.; Gomes, A. Optimizing the coordinated charging of a group of electric vehicles. In Proceedings of the 2014 IEEE Vehicle Power and Propulsion Conference (VPPC), Coimbra, Portugal, 27–30 October 2014; pp. 1–6. [Google Scholar]
- Deng, R.; Yang, Z.; Chow, M.; Chen, J. A Survey on Demand Response in Smart Grids: Mathematical Models and Approaches. IEEE Trans. Ind. Inform. 2015, 11, 570–582. [Google Scholar] [CrossRef]
- El-Bayeh, C.Z.; Alzaareer, K.; Brahmi, B.; Zellagui, M.; Eicker, U. An Original Multi-Criteria Decision-Making Algorithm for Solar Panels Selection in Buildings. Energy 2021, 217, 1–15. [Google Scholar] [CrossRef]
- Høyland, K.; Wallace, S.W. Generating scenario trees for multistage decision problems. Manag. Sci. 2001, 47, 295–307. [Google Scholar] [CrossRef]
- Melhem, O.G.F.Y.; Hammoudan, Z.; Moubayed, N. Thermal and Electrical Load Management in Smart Home Based on Demand Response and Renewable Energy Resources. In Proceedings of the Third International Conference on Electrical and Electronic Engineering, Telecommunication Engineering and Mechatronics (EEETEM2017), Hadath, Lebanese, 28 April 2017. [Google Scholar]
- El-Bayeh, C.Z.; Mougharbel, I.; Saad, M.; Chandra, A.; Lefebvre, S.; Asber, D. Impact of Considering Variable Battery Power Profile of Electric Vehicles on the Distribution Network. In Proceedings of the International Conference on Renewable Energies for Developing Countries, Beirut, Lebanon, 1–2 November 2018. [Google Scholar]
- Gupta, A.; Yadav, A. Challenges in Demand Side Management in Smart Power Grid: A Review. Int. J. Eng. Sci. Math. 2017, 6, 120–125. [Google Scholar]
- Ramchurn, S.D.; Vytelingum, P.; Rogers, A.; Jennings, N. Agent-based control for decentralised demand side management in the smart grid. In Proceedings of the 10th International Conference on Autonomous Agents and Multiagent Systems—Volume 1, Taipei, Taiwan, 2–6 May 2011. [Google Scholar]
- Zhang, J.; Yan, J.; Liu, Y.; Zhang, H.; Lv, G. Daily electric vehicle charging load profiles considering demographics of vehicle users. Appl. Energy 2020, 274, 1–12. [Google Scholar] [CrossRef]
- Jinghong, Z.; Xiaoyu, W.; Kun, M.; Chun, Z.; Shouzhen, Z. Aggregation Model-Based Optimization for Electric Vehicle Charging Strategy. IEEE Trans. Smart Grid 2013, 4, 1058–1066. [Google Scholar] [CrossRef]
- Junior, B.R.P.; Cossi, A.M.; Contreras, J.; Mantovani, J.R.S. Multiobjective multistage distribution system planning using tabu search. Gener. Transm. Distrib. 2014, 8, 35–45. [Google Scholar] [CrossRef]
- Ahmed, M.S.; Mohamed, A.; Shareef, H.; Homod, R.Z.; Ali, J.A. Artificial neural network based controller for home energy management considering demand response events. In Proceedings of the 2016 International Conference on Advances in Electrical, Electronic and Systems Engineering (ICAEES), Putrajaya, Malaysia, 14–16 November 2016. [Google Scholar]
- Masoum, M.A.S.; Deilami, S.; Islam, S. Mitigation of harmonics in smart grids with high penetration of plug-in electric vehicles. In Proceedings of the Power and Energy Society General Meeting, Minneapolis, MN, USA, 25–29 July 2010. [Google Scholar]
- El-Bayeh, C.Z.; Eicker, U.; Alzaareer, K.; Brahmi, B.; Zellagui, M. A Novel Data-Energy Management Algorithm for Smart Transformers to Optimize the Total Load Demand in Smart Homes. Energies 2020, 13, 4984. [Google Scholar] [CrossRef]
- El-Bayeh, C.Z.; Alzaareer, K.; Brahmi, B.; Zellagui, M. A Novel Algorithm for Controlling Active and Reactive Power Flows of Electric Vehicles in Buildings and Its Impact on the Distribution Network. World Electr. Veh. J. 2020, 11, 43. [Google Scholar] [CrossRef]
- El-Bayeh, C.Z.; Mougharbel, I.; Saad, M.; Chandra, A.; Asber, D.; Lenoir, L.; Lefebvre, S. Novel Soft-Constrained Distributed Strategy To Meet High Penetration Trend of PEVs at Homes. Energy Build. 2018, 178, 331–346. [Google Scholar] [CrossRef]
- El-Bayeh, C.Z.; Mougharbel, I.; Saad, M.; Asber, D.; Chandra, A.; Lefebvre, S. Novel Approach for Optimizing the Transformer’s Critical Power Limit. IEEE Access 2018, 6, 55870–55882. [Google Scholar] [CrossRef]
- El-Bayeh, C.Z.; Alzaareer, K.; Brahmi, B.; Mougharbel, I.; Saad, M.; Chandra, A.; Eicker, U. A Novel Programmable Smart Transformer for Energy Management in Buildings. In Proceedings of the 5th International Conference on Renewable Energies for Developing Countries, Marrakech, Morocco, 24–26 March 2020. [Google Scholar]
- El-Bayeh, C.Z.; Mougharbel, I.; Saad, M.; Chandra, A.; Lefebvre, S.; Asber, D. Novel Multilevel Soft Constraints at Homes for Improving the Integration of Plug-in Electric Vehicles. In Proceedings of the International Conference on Renewable Energies for Developing Countries, Beirut, Lebanon, 1–2 November 2018. [Google Scholar]


| Strategy | Definition and References that Discuss/Propose the Strategy | ||
|---|---|---|---|
| Item | Name and Abbreviation | ||
| 1. | Uncoordinated Direct Charging | U-Di-C | The charging mode of a single or a fleet of EVs that automatically charge when they are connected to a PG until they are charged to the desired SOC or disconnected [9,17,20,26,38,39,40]. |
| 2. | Uncoordinated Direct Charging and Discharging | U-Di-CD | SAS1. In addition, the discharging mode could be used to supply electricity to the load or the PG during the on-peak time. The discharging occurs in an uncoordinated manner (as defined in Section 2.1) and subject to the owner’s desire. The discharging power rate is not optimized or controlled. Therefore, it is not recommended to use it because it might discharge at an unwanted power rate. Therefore, it creates unnecessary demand reduction. This strategy has not been studied yet to the best of our knowledge. |
| 3. | Uncoordinated Delayed Charging and Discharging | U-De-C | The charging mode of a single or a fleet of EVs in which the charging is delayed to a certain period (usually to the off-peak time) in order to reduce the power congestion during the on-peak time. Since it uses uncoordinated charging (as defined in Section 2.1), the delay of charging may create another peak load during the off-peak time (a phenomenon known as “rebound peak” [41]). Therefore, it could have a negative impact on the PG. This strategy was studied by [42,43]. |
| 4. | Uncoordinated Delayed Charging | U-De-CD | SAS3. In addition, the characteristic of the discharging mode is similar to strategy 2 (U-Di-CD). This strategy has not been studied yet to the best of the authors’ knowledge. |
| 5. | Uncoordinated Random Charging | U-R-C | The charging mode of a fleet of EVs distributed randomly during a certain period. This type of charging is similar to strategy 3 (U-De-C), but the difference is that in the latter, the EVs are not distributed randomly during a certain period of time. Some papers studied this strategy, such as [33,44,45]. Paper [38] studied a similar type of charging called “random schedule”, in which the distribution of charging EVs is done randomly during a certain period |
| 6. | Uncoordinated Random Charging and Discharging | U-R-CD | SAS5. The characteristic of the discharging mode is similar to strategies 2 and 4 (U-Di-CD, U-De-CD). This strategy has not been studied yet to the best of the authors’ knowledge. |
| Algorithm | Reference |
|---|---|
| Mathematical programming | |
| [157] |
| [158] |
| [125] |
| [115] |
| [117] |
| [113] |
| [158] |
| [159] |
| [160] |
| Meta-heuristic | |
| [157] |
| [12] |
| [114] |
| [115] |
| [117] |
| [113] |
| [158] |
| Artificial Intelligence | |
| [159] |
Publisher’s Note: MDPI stays neutral with regard to jurisdictional claims in published maps and institutional affiliations. |
© 2021 by the authors. Licensee MDPI, Basel, Switzerland. This article is an open access article distributed under the terms and conditions of the Creative Commons Attribution (CC BY) license (http://creativecommons.org/licenses/by/4.0/).
Share and Cite
El-Bayeh, C.Z.; Alzaareer, K.; Aldaoudeyeh, A.-M.I.; Brahmi, B.; Zellagui, M. Charging and Discharging Strategies of Electric Vehicles: A Survey. World Electr. Veh. J. 2021, 12, 11. https://doi.org/10.3390/wevj12010011
El-Bayeh CZ, Alzaareer K, Aldaoudeyeh A-MI, Brahmi B, Zellagui M. Charging and Discharging Strategies of Electric Vehicles: A Survey. World Electric Vehicle Journal. 2021; 12(1):11. https://doi.org/10.3390/wevj12010011
Chicago/Turabian StyleEl-Bayeh, Claude Ziad, Khaled Alzaareer, Al-Motasem I. Aldaoudeyeh, Brahim Brahmi, and Mohamed Zellagui. 2021. "Charging and Discharging Strategies of Electric Vehicles: A Survey" World Electric Vehicle Journal 12, no. 1: 11. https://doi.org/10.3390/wevj12010011
APA StyleEl-Bayeh, C. Z., Alzaareer, K., Aldaoudeyeh, A.-M. I., Brahmi, B., & Zellagui, M. (2021). Charging and Discharging Strategies of Electric Vehicles: A Survey. World Electric Vehicle Journal, 12(1), 11. https://doi.org/10.3390/wevj12010011