Profitability of Frequency Regulation by Electric Vehicles in Denmark and Japan Considering Battery Degradation Costs


Abstract

1. Introduction
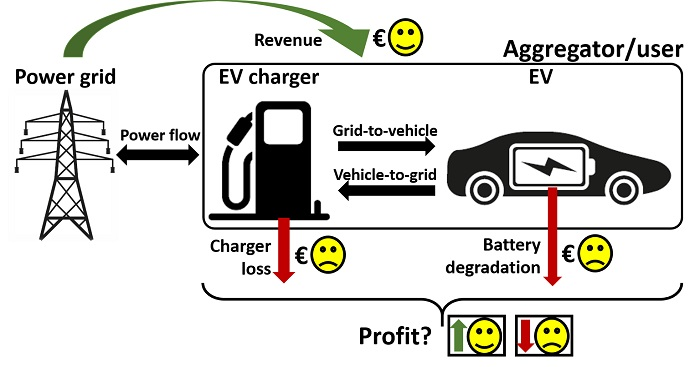
2. Profit Evaluation
2.1. Revenue Assessment
2.2. Energy Cost Assessment
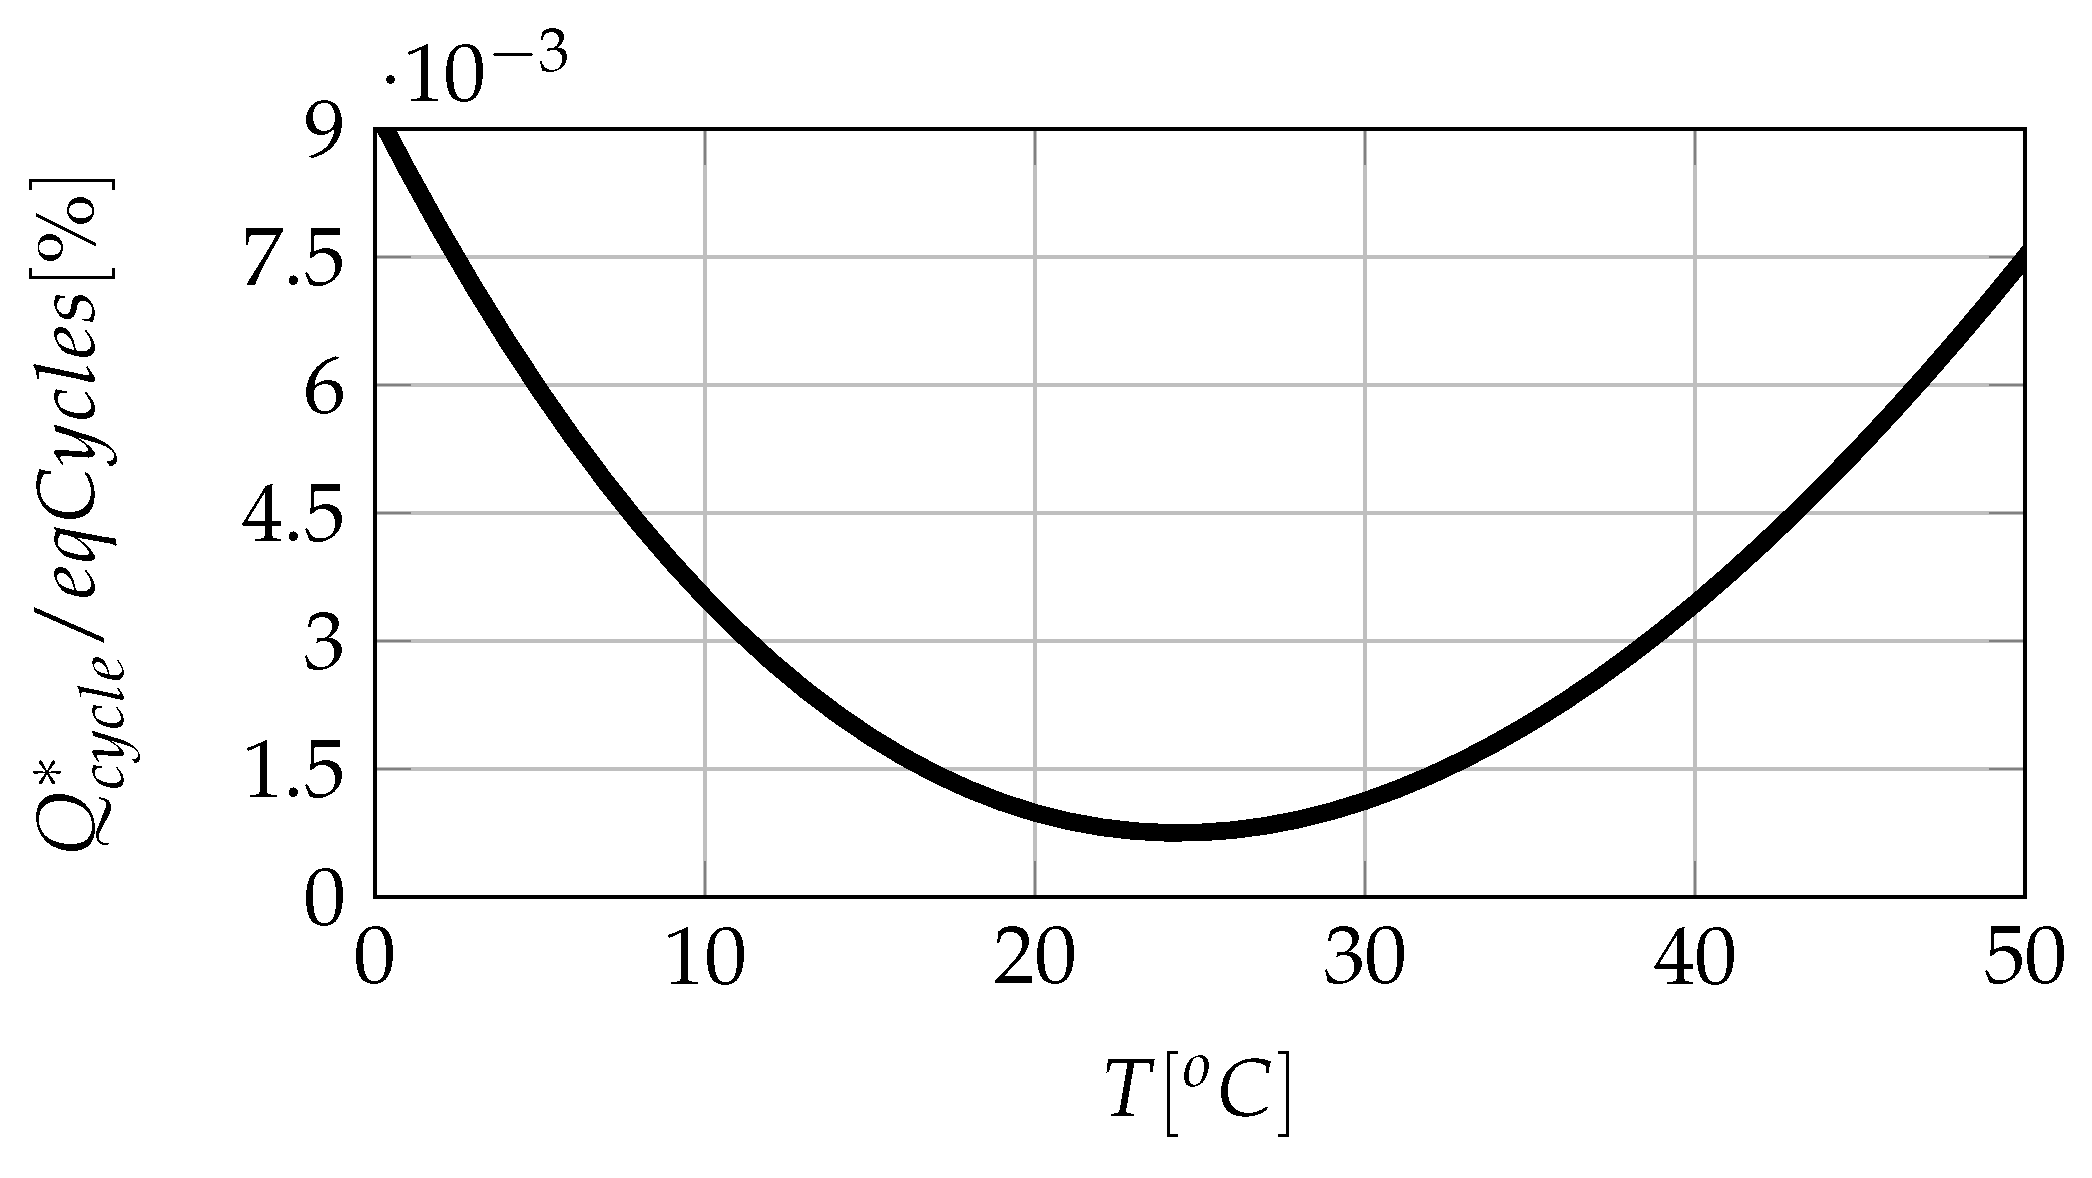
2.3. Degradation Cost Assessment
2.3.1. General Assessment
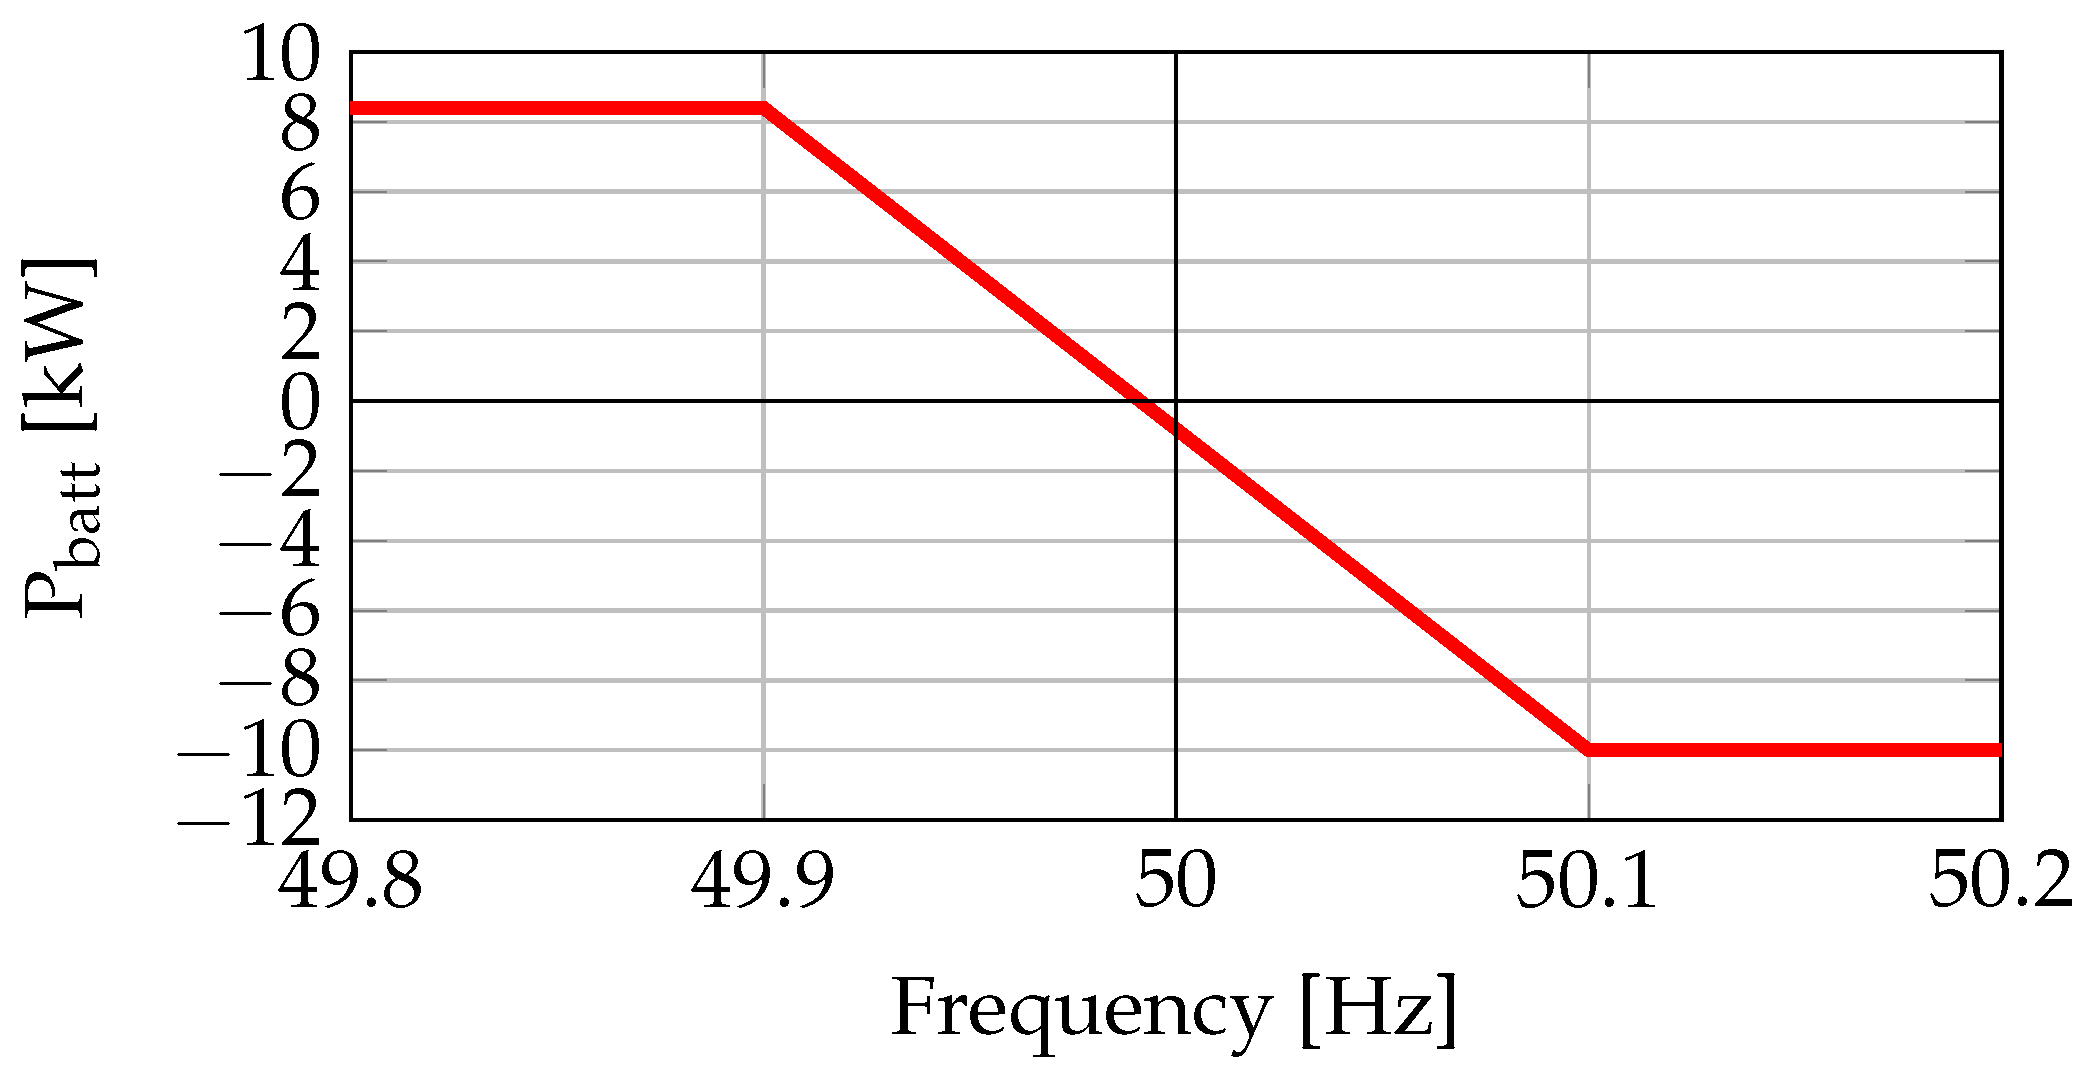
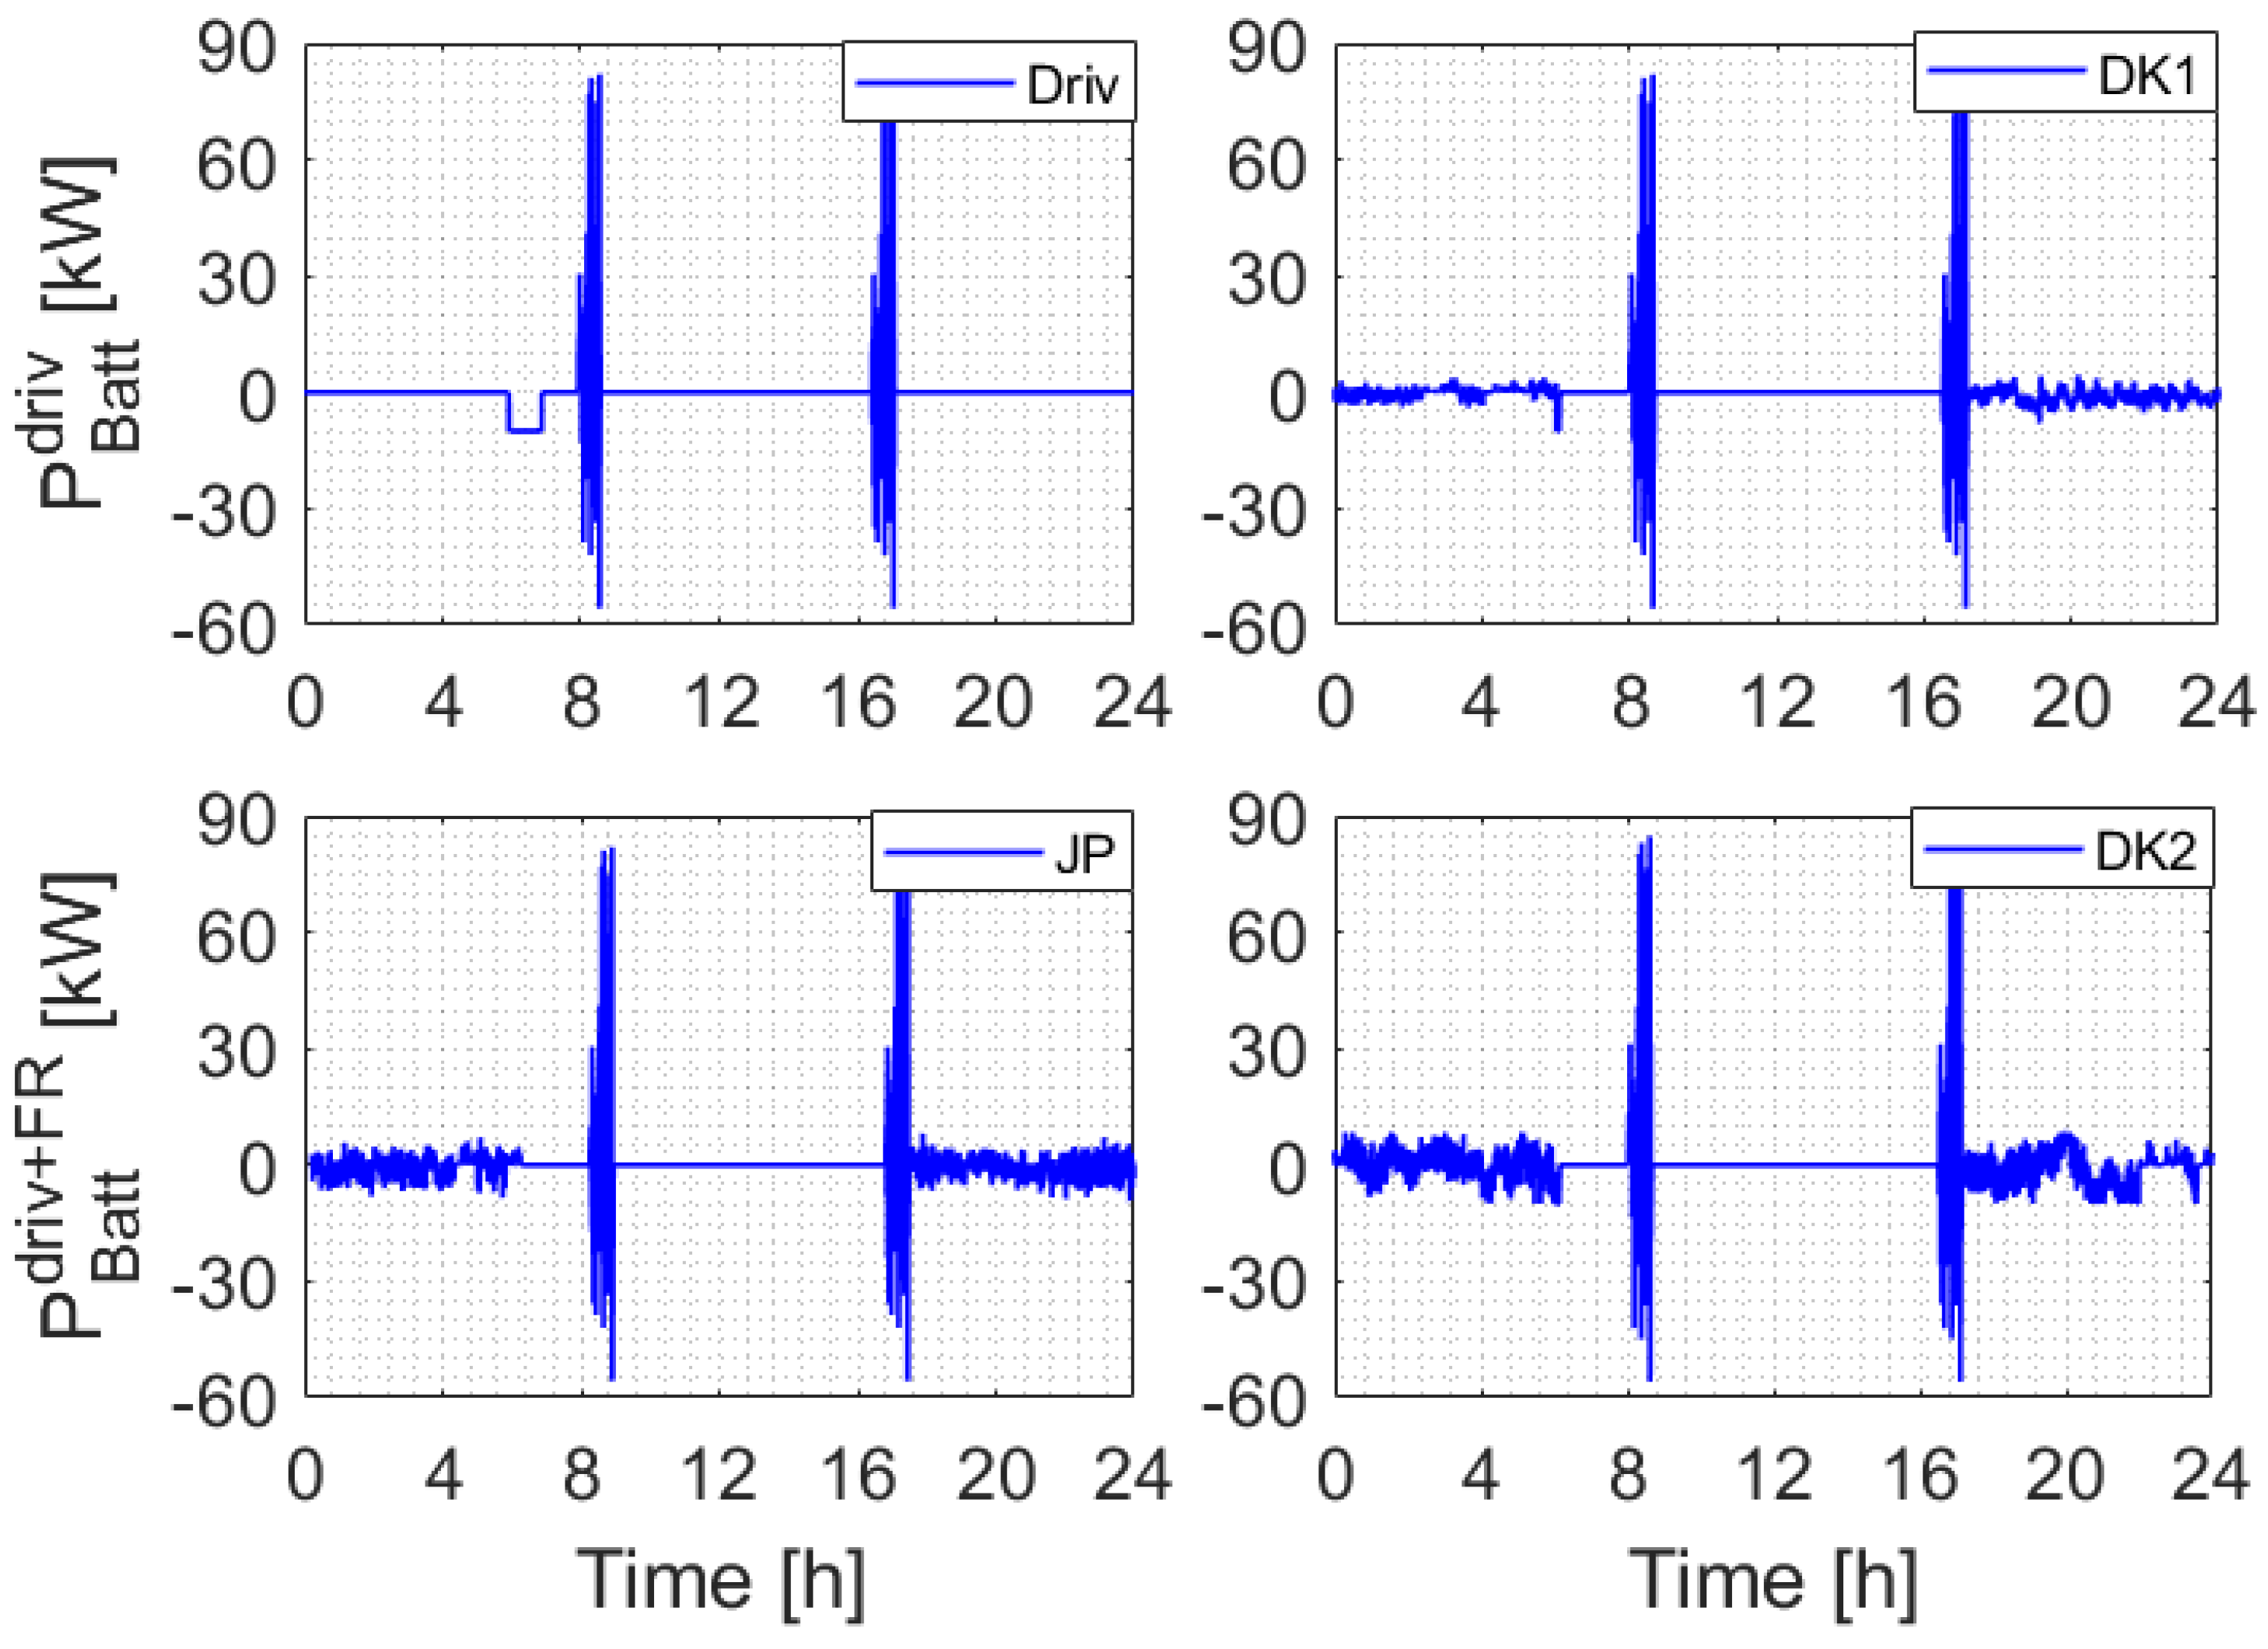
2.3.2. Frequency Regulation Assessment
- driving (): the EV is only driven
- driving plus FR (): the EV is driven and used for providing FR service.
3. Test Case
3.1. Technical Characterization Battery
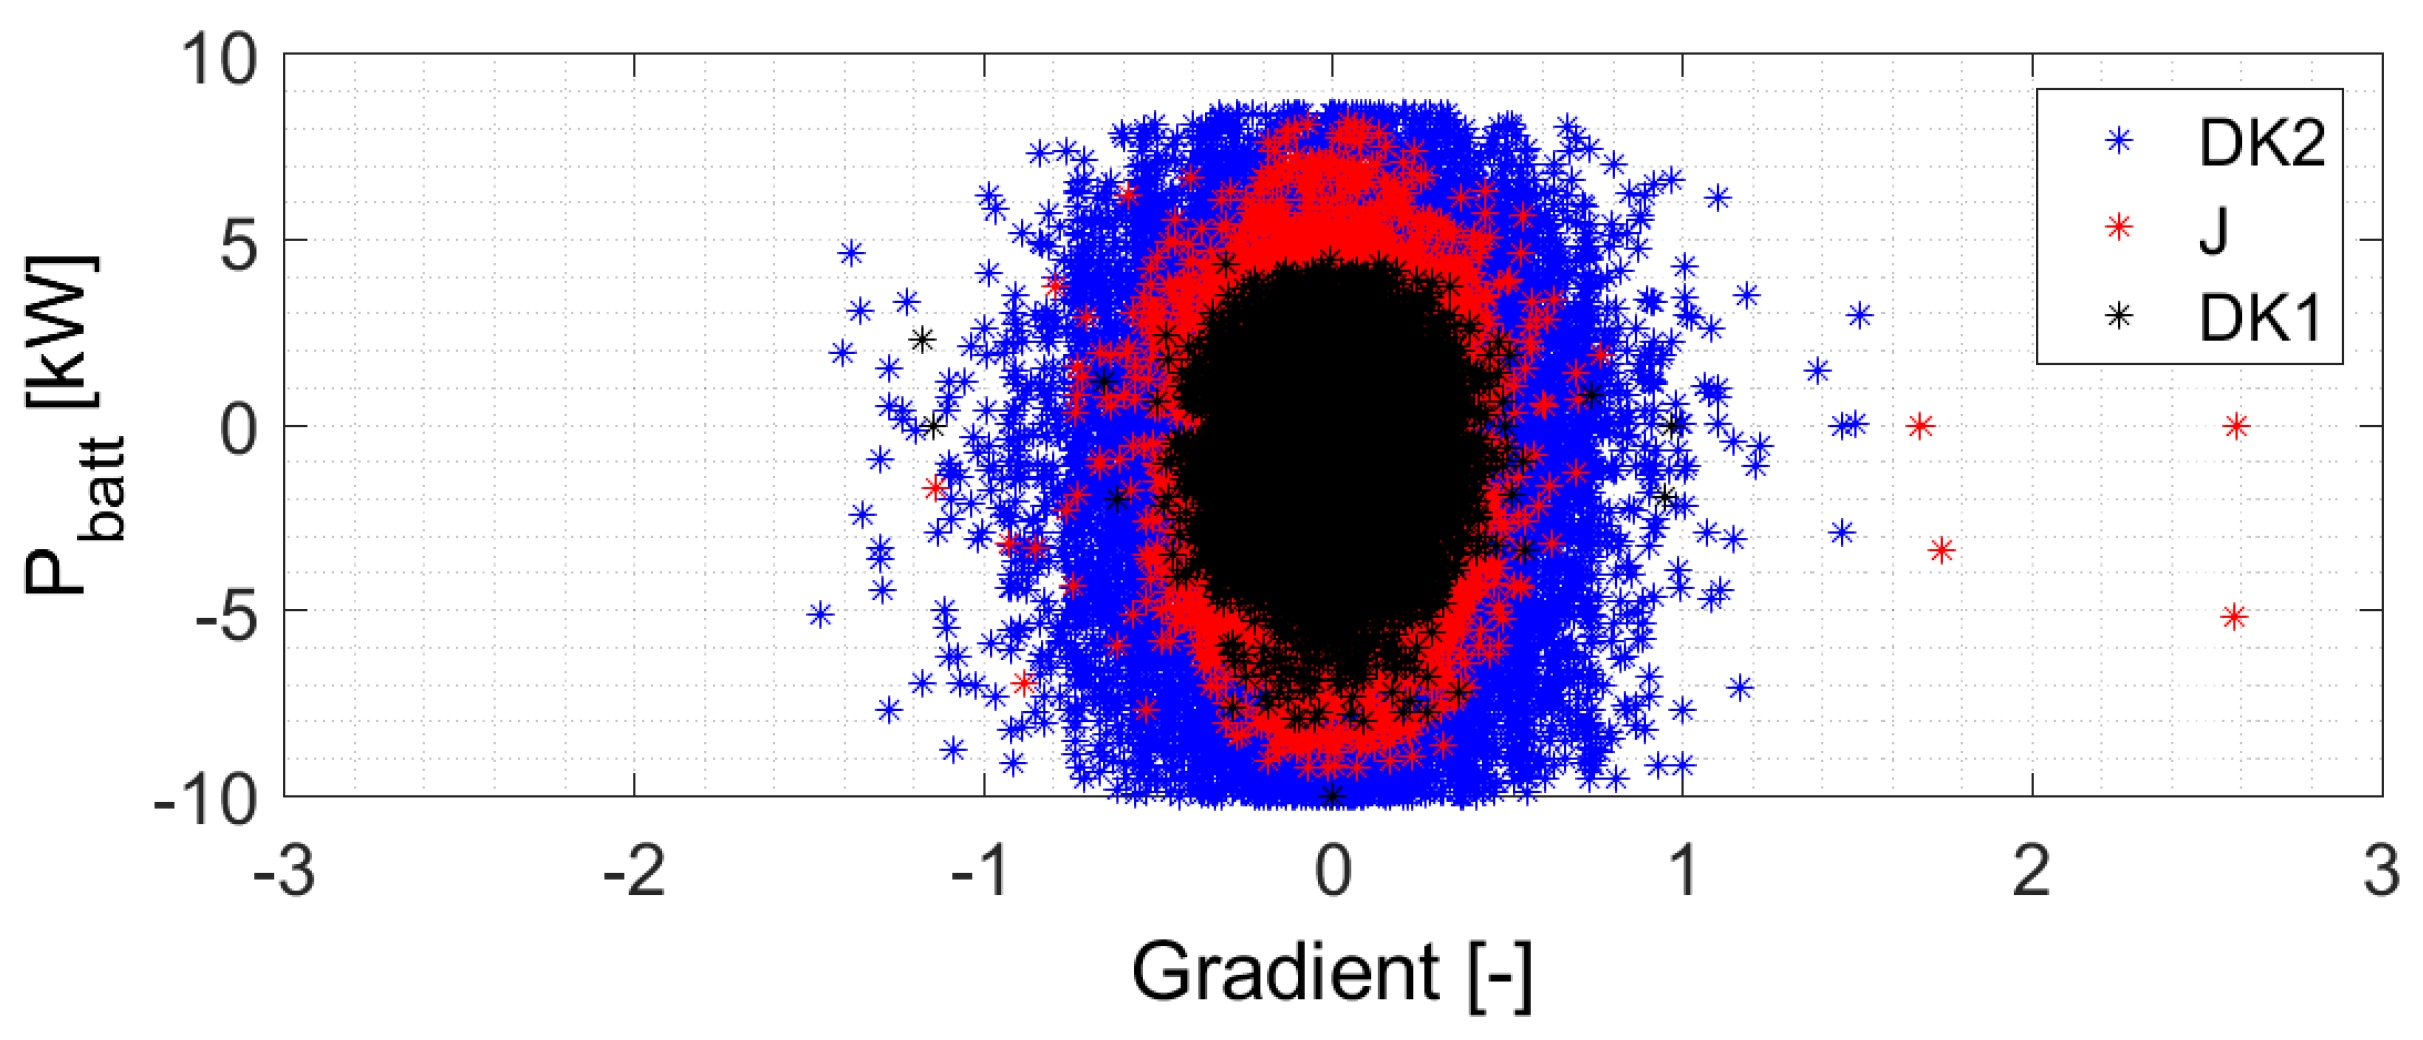
3.1.1. Input: Power
3.1.2. Input: Temperature
3.2. Economic Characterization
3.2.1. Frequency Regulation Price
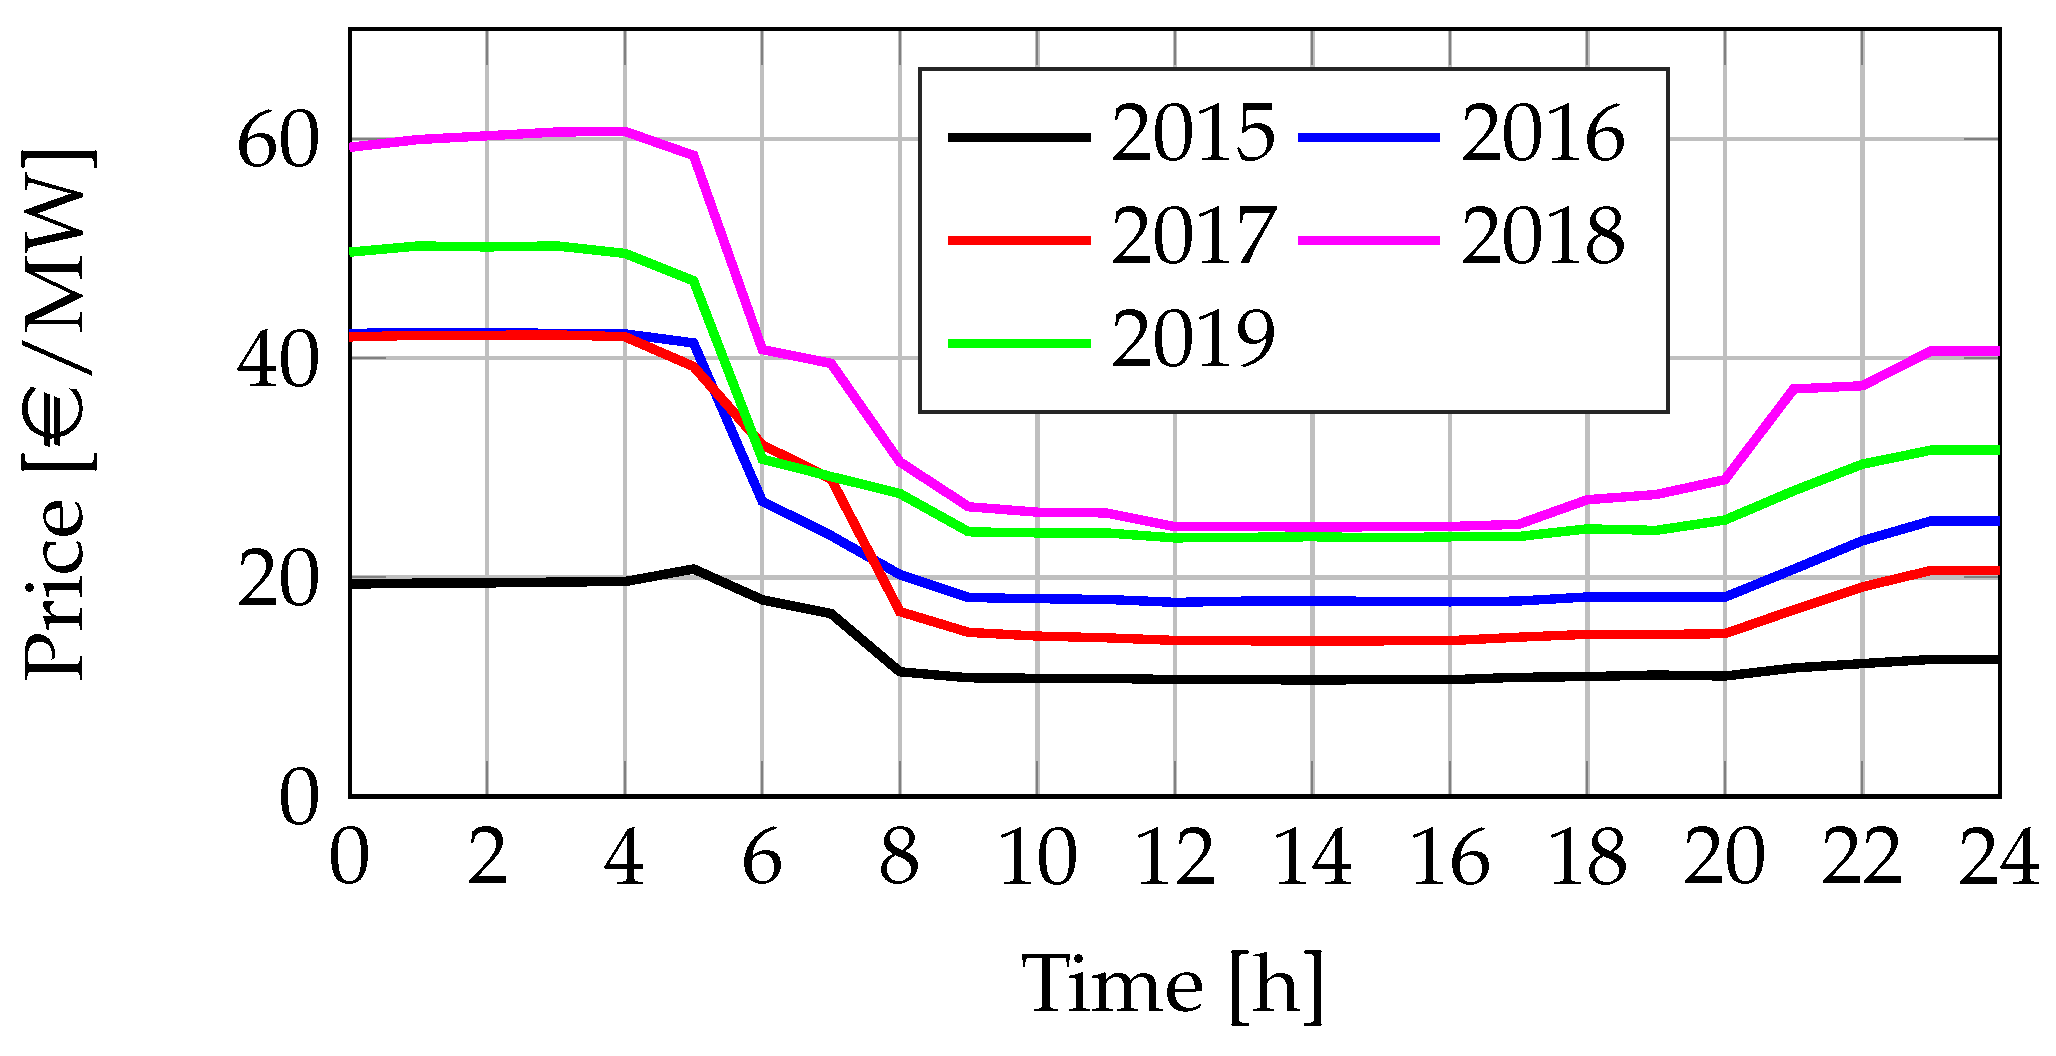
3.2.2. Electricity Price
3.2.3. Battery Price
4. Results
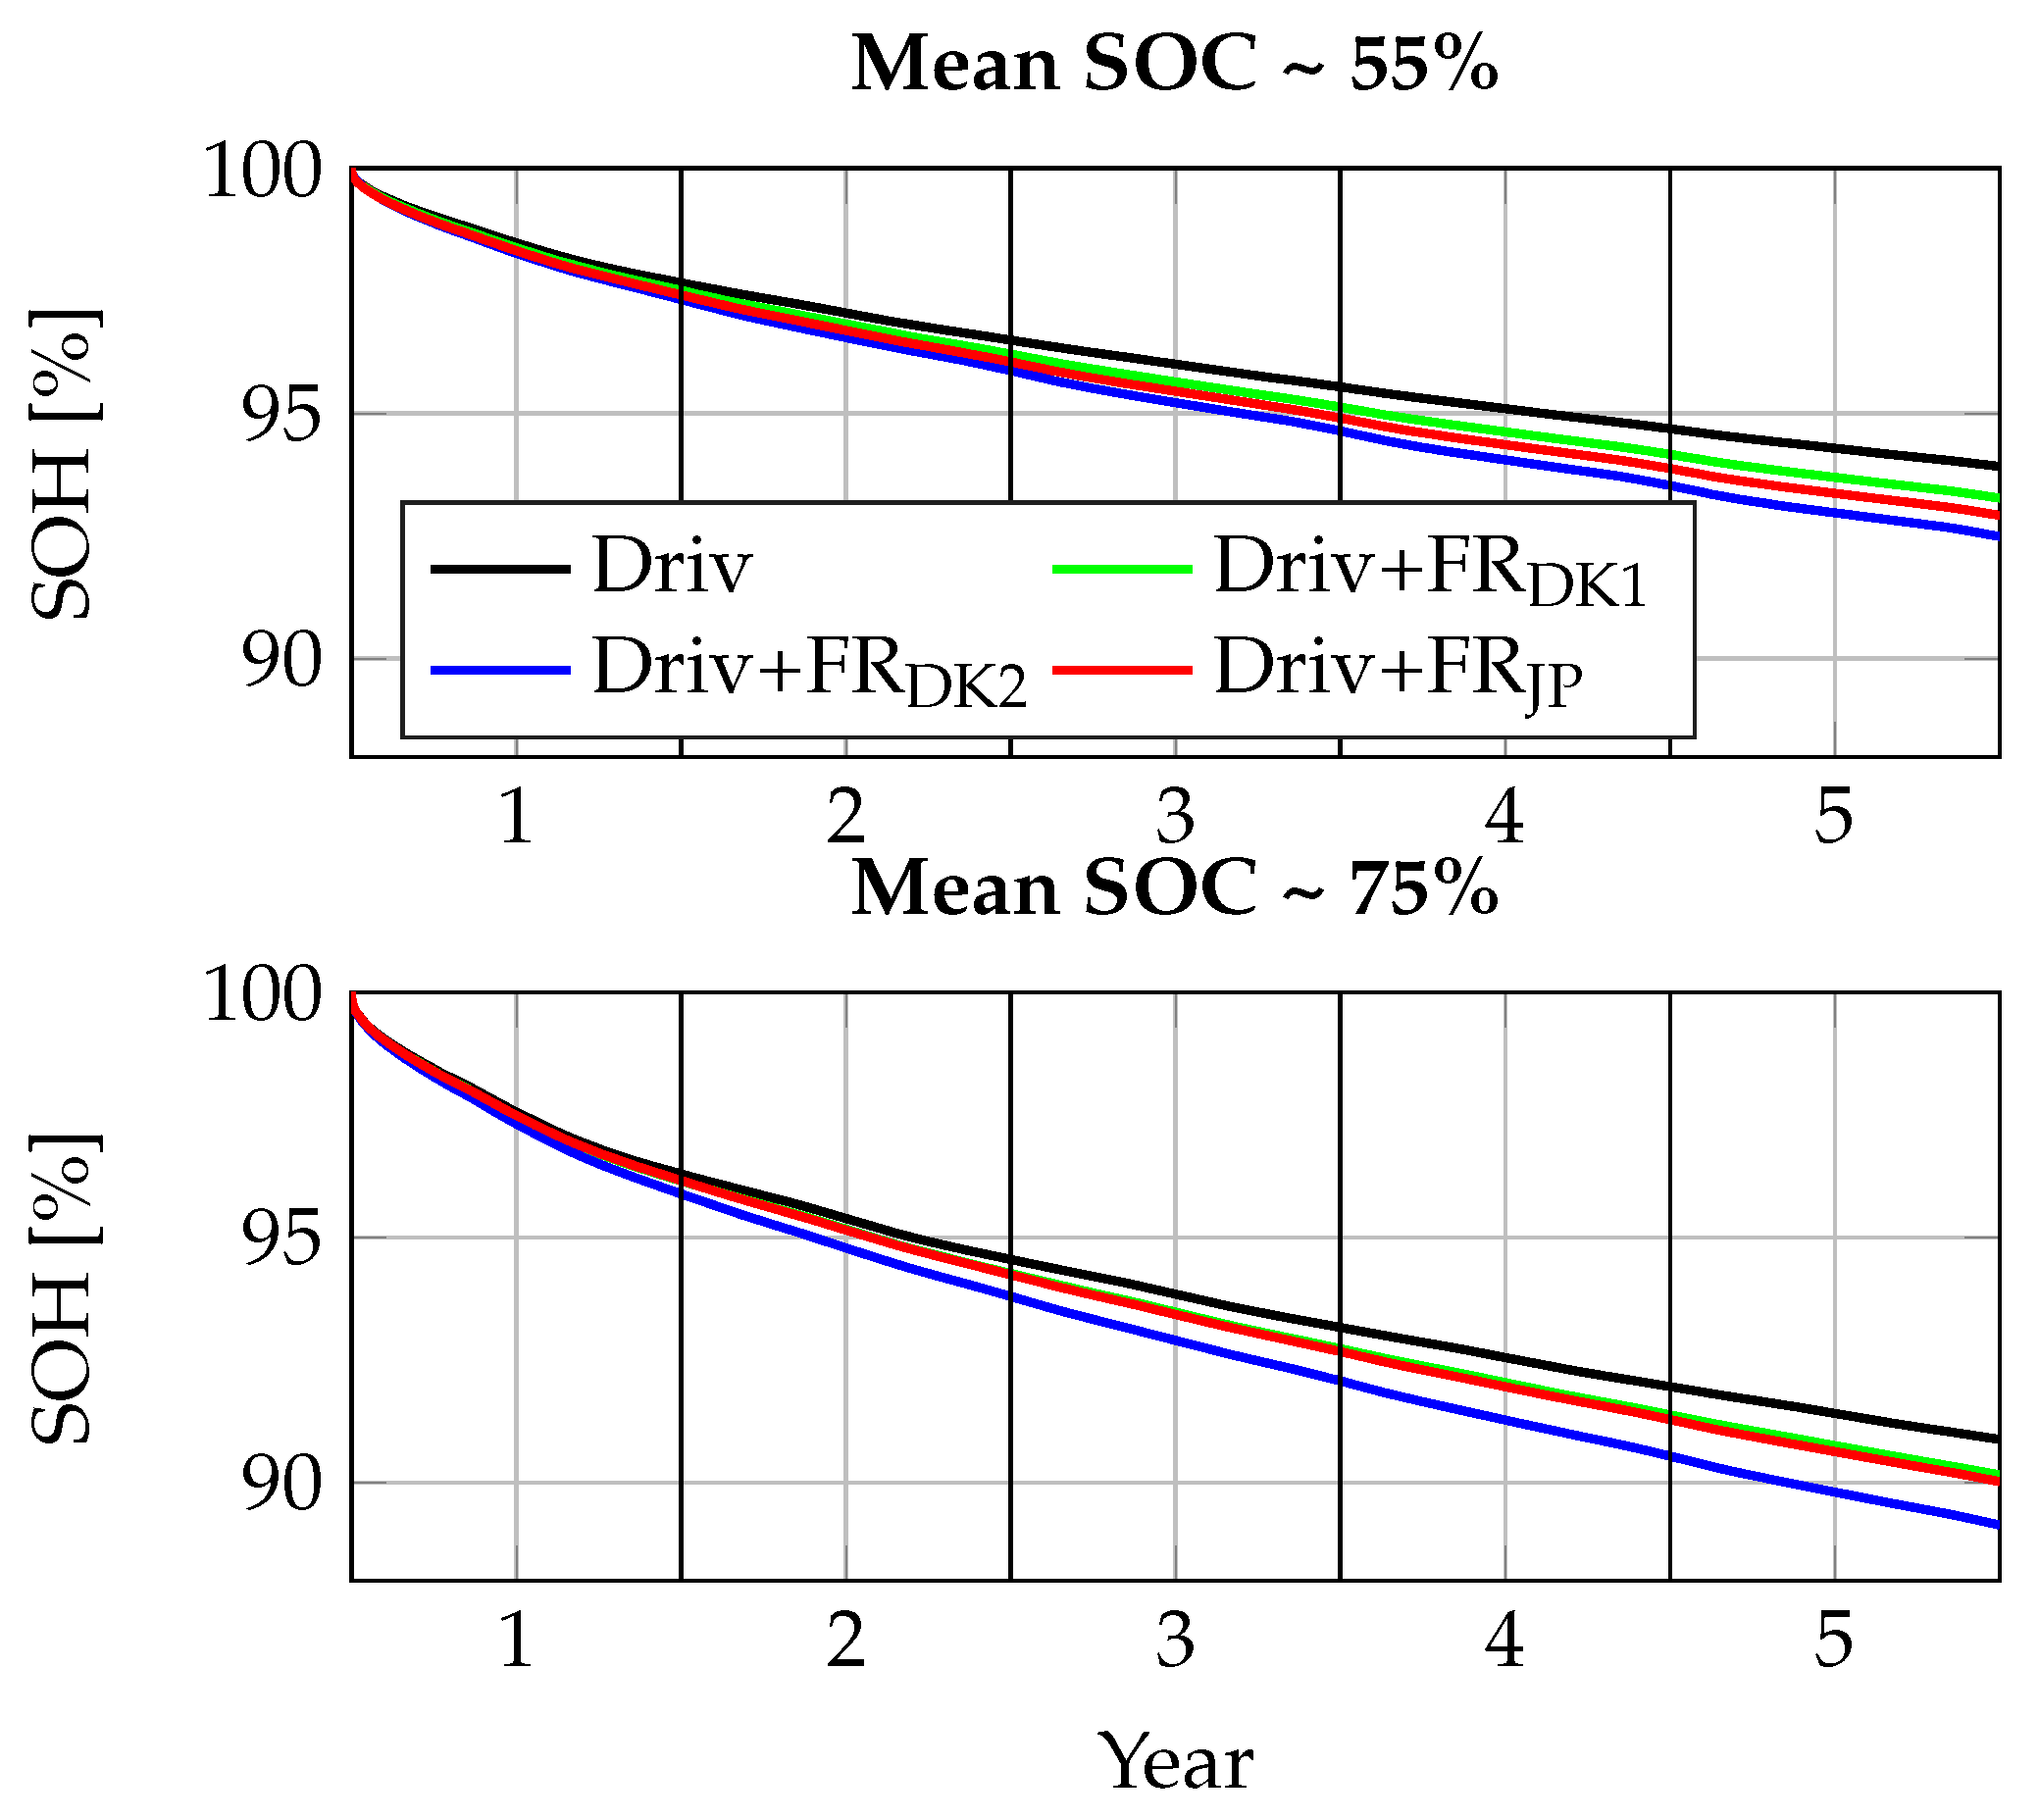
4.1. Technical Results
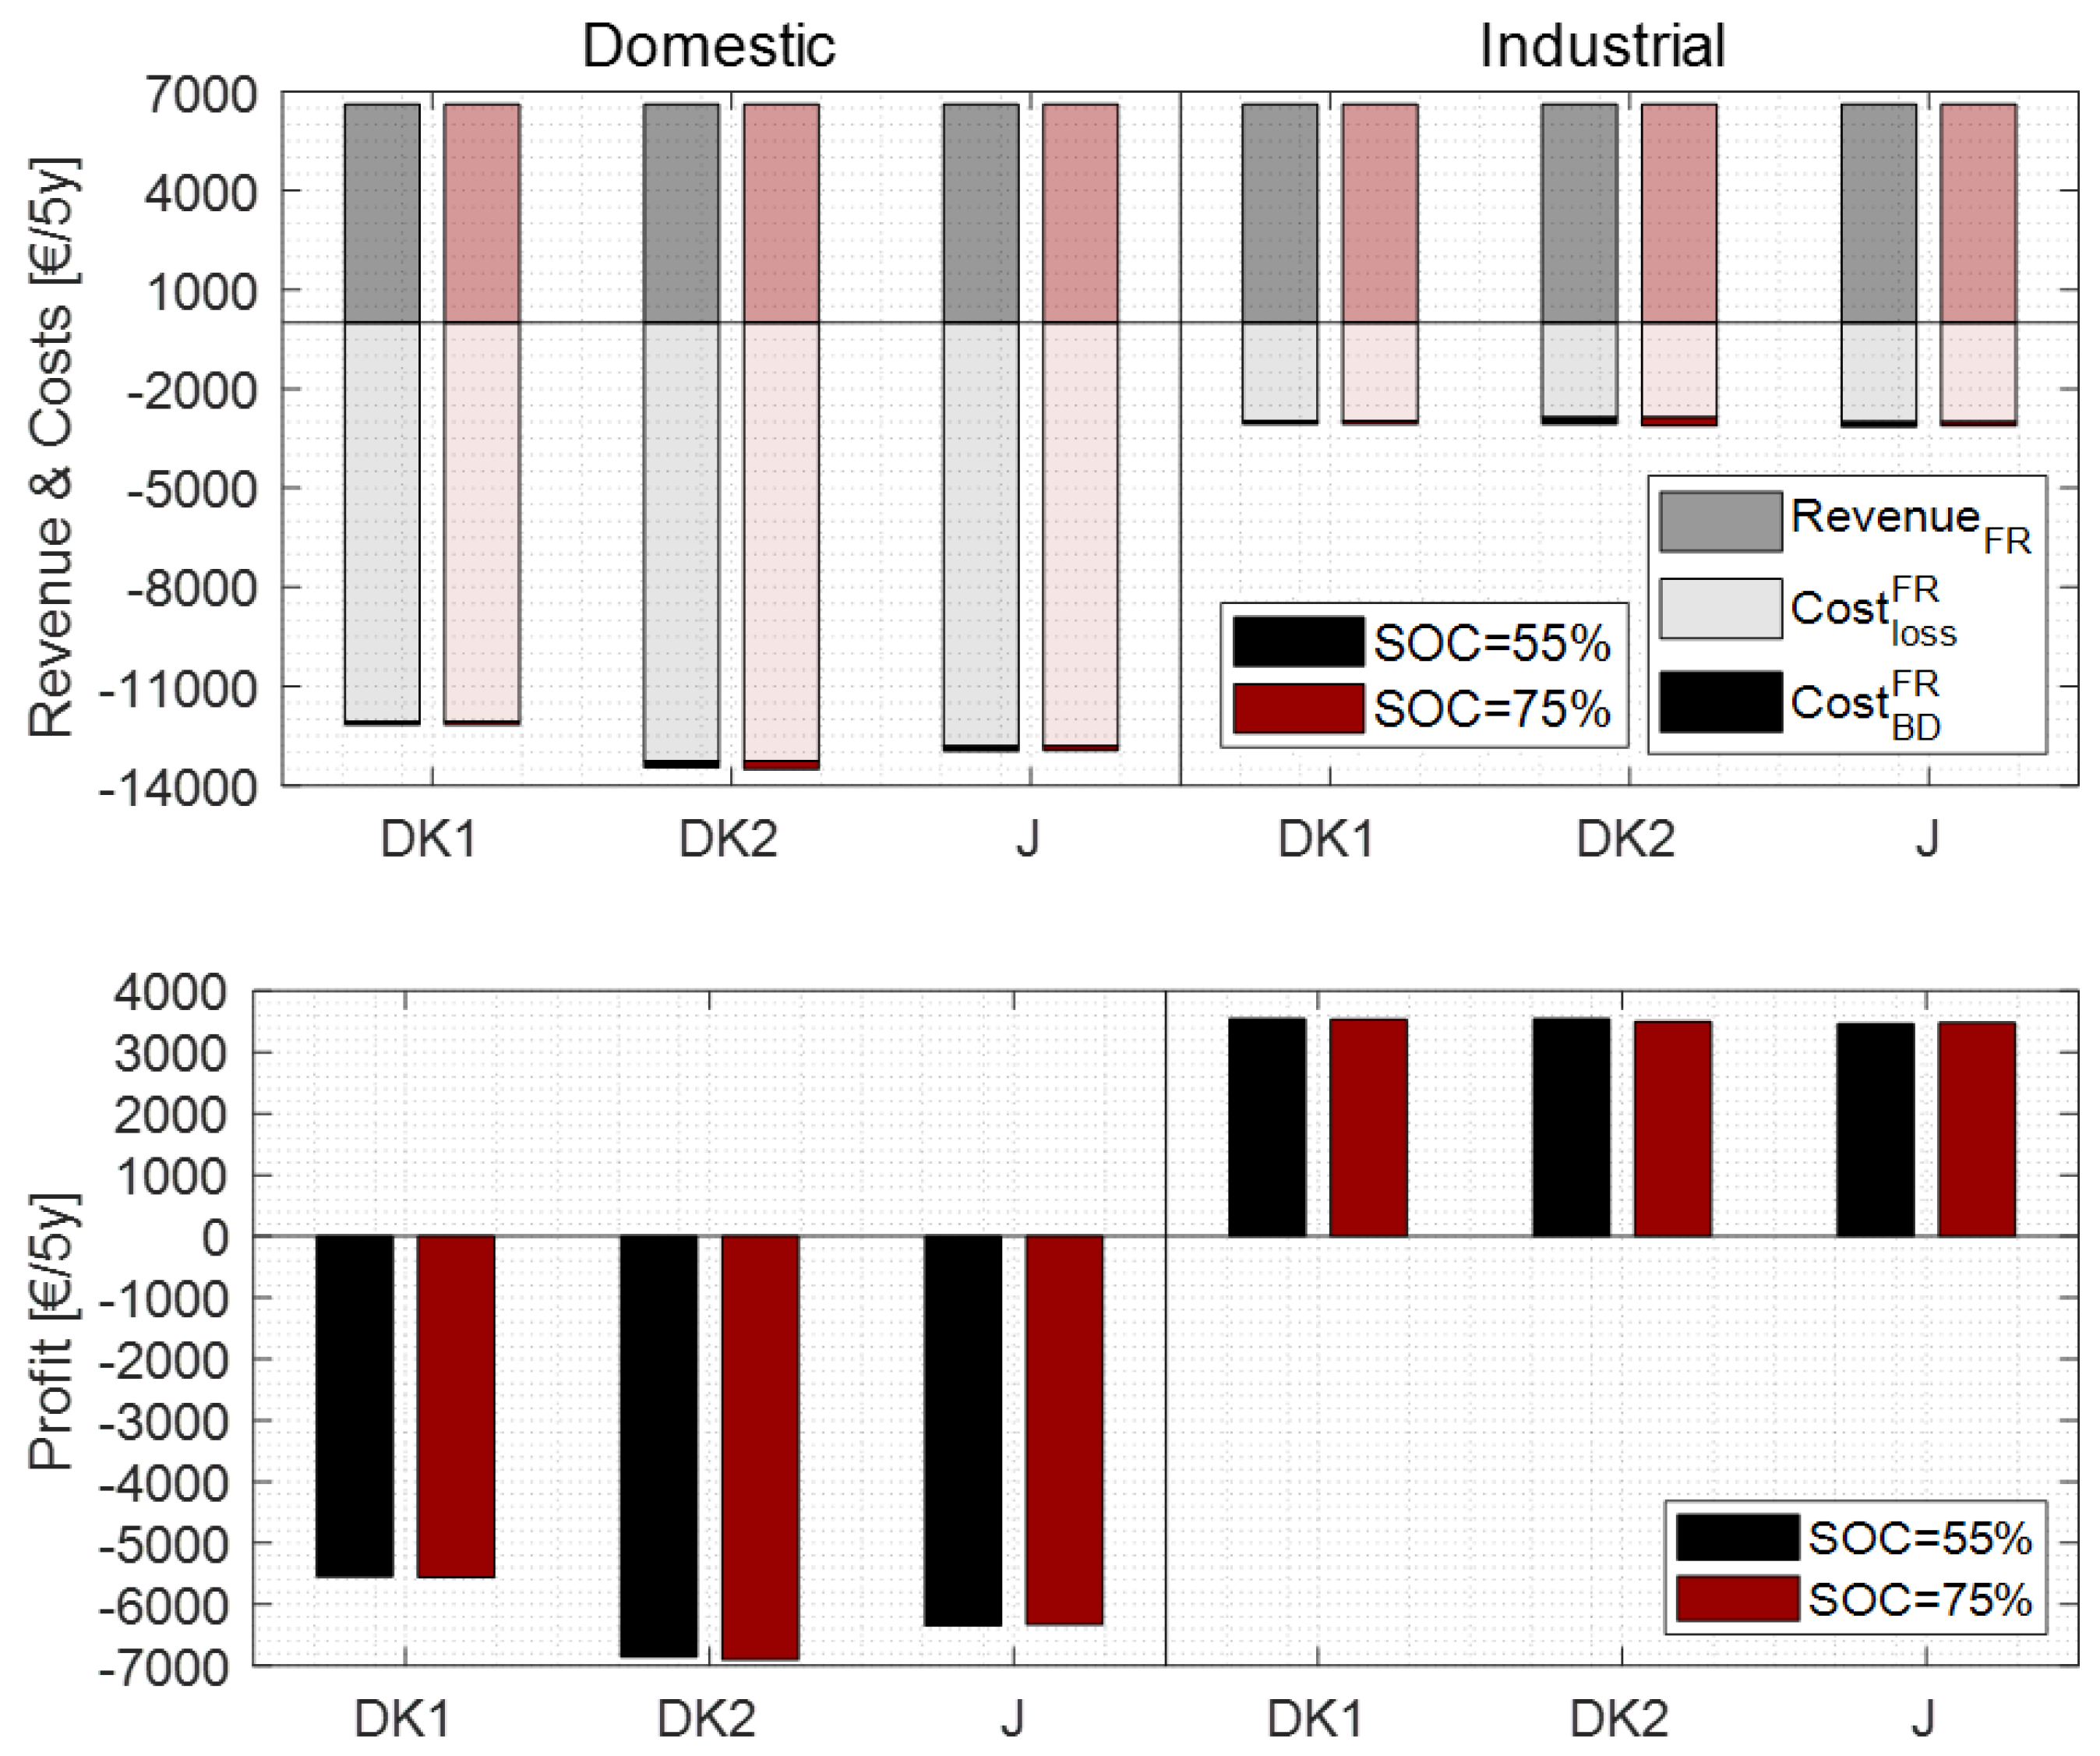
4.2. Economic Results
5. Sensitivity Analysis
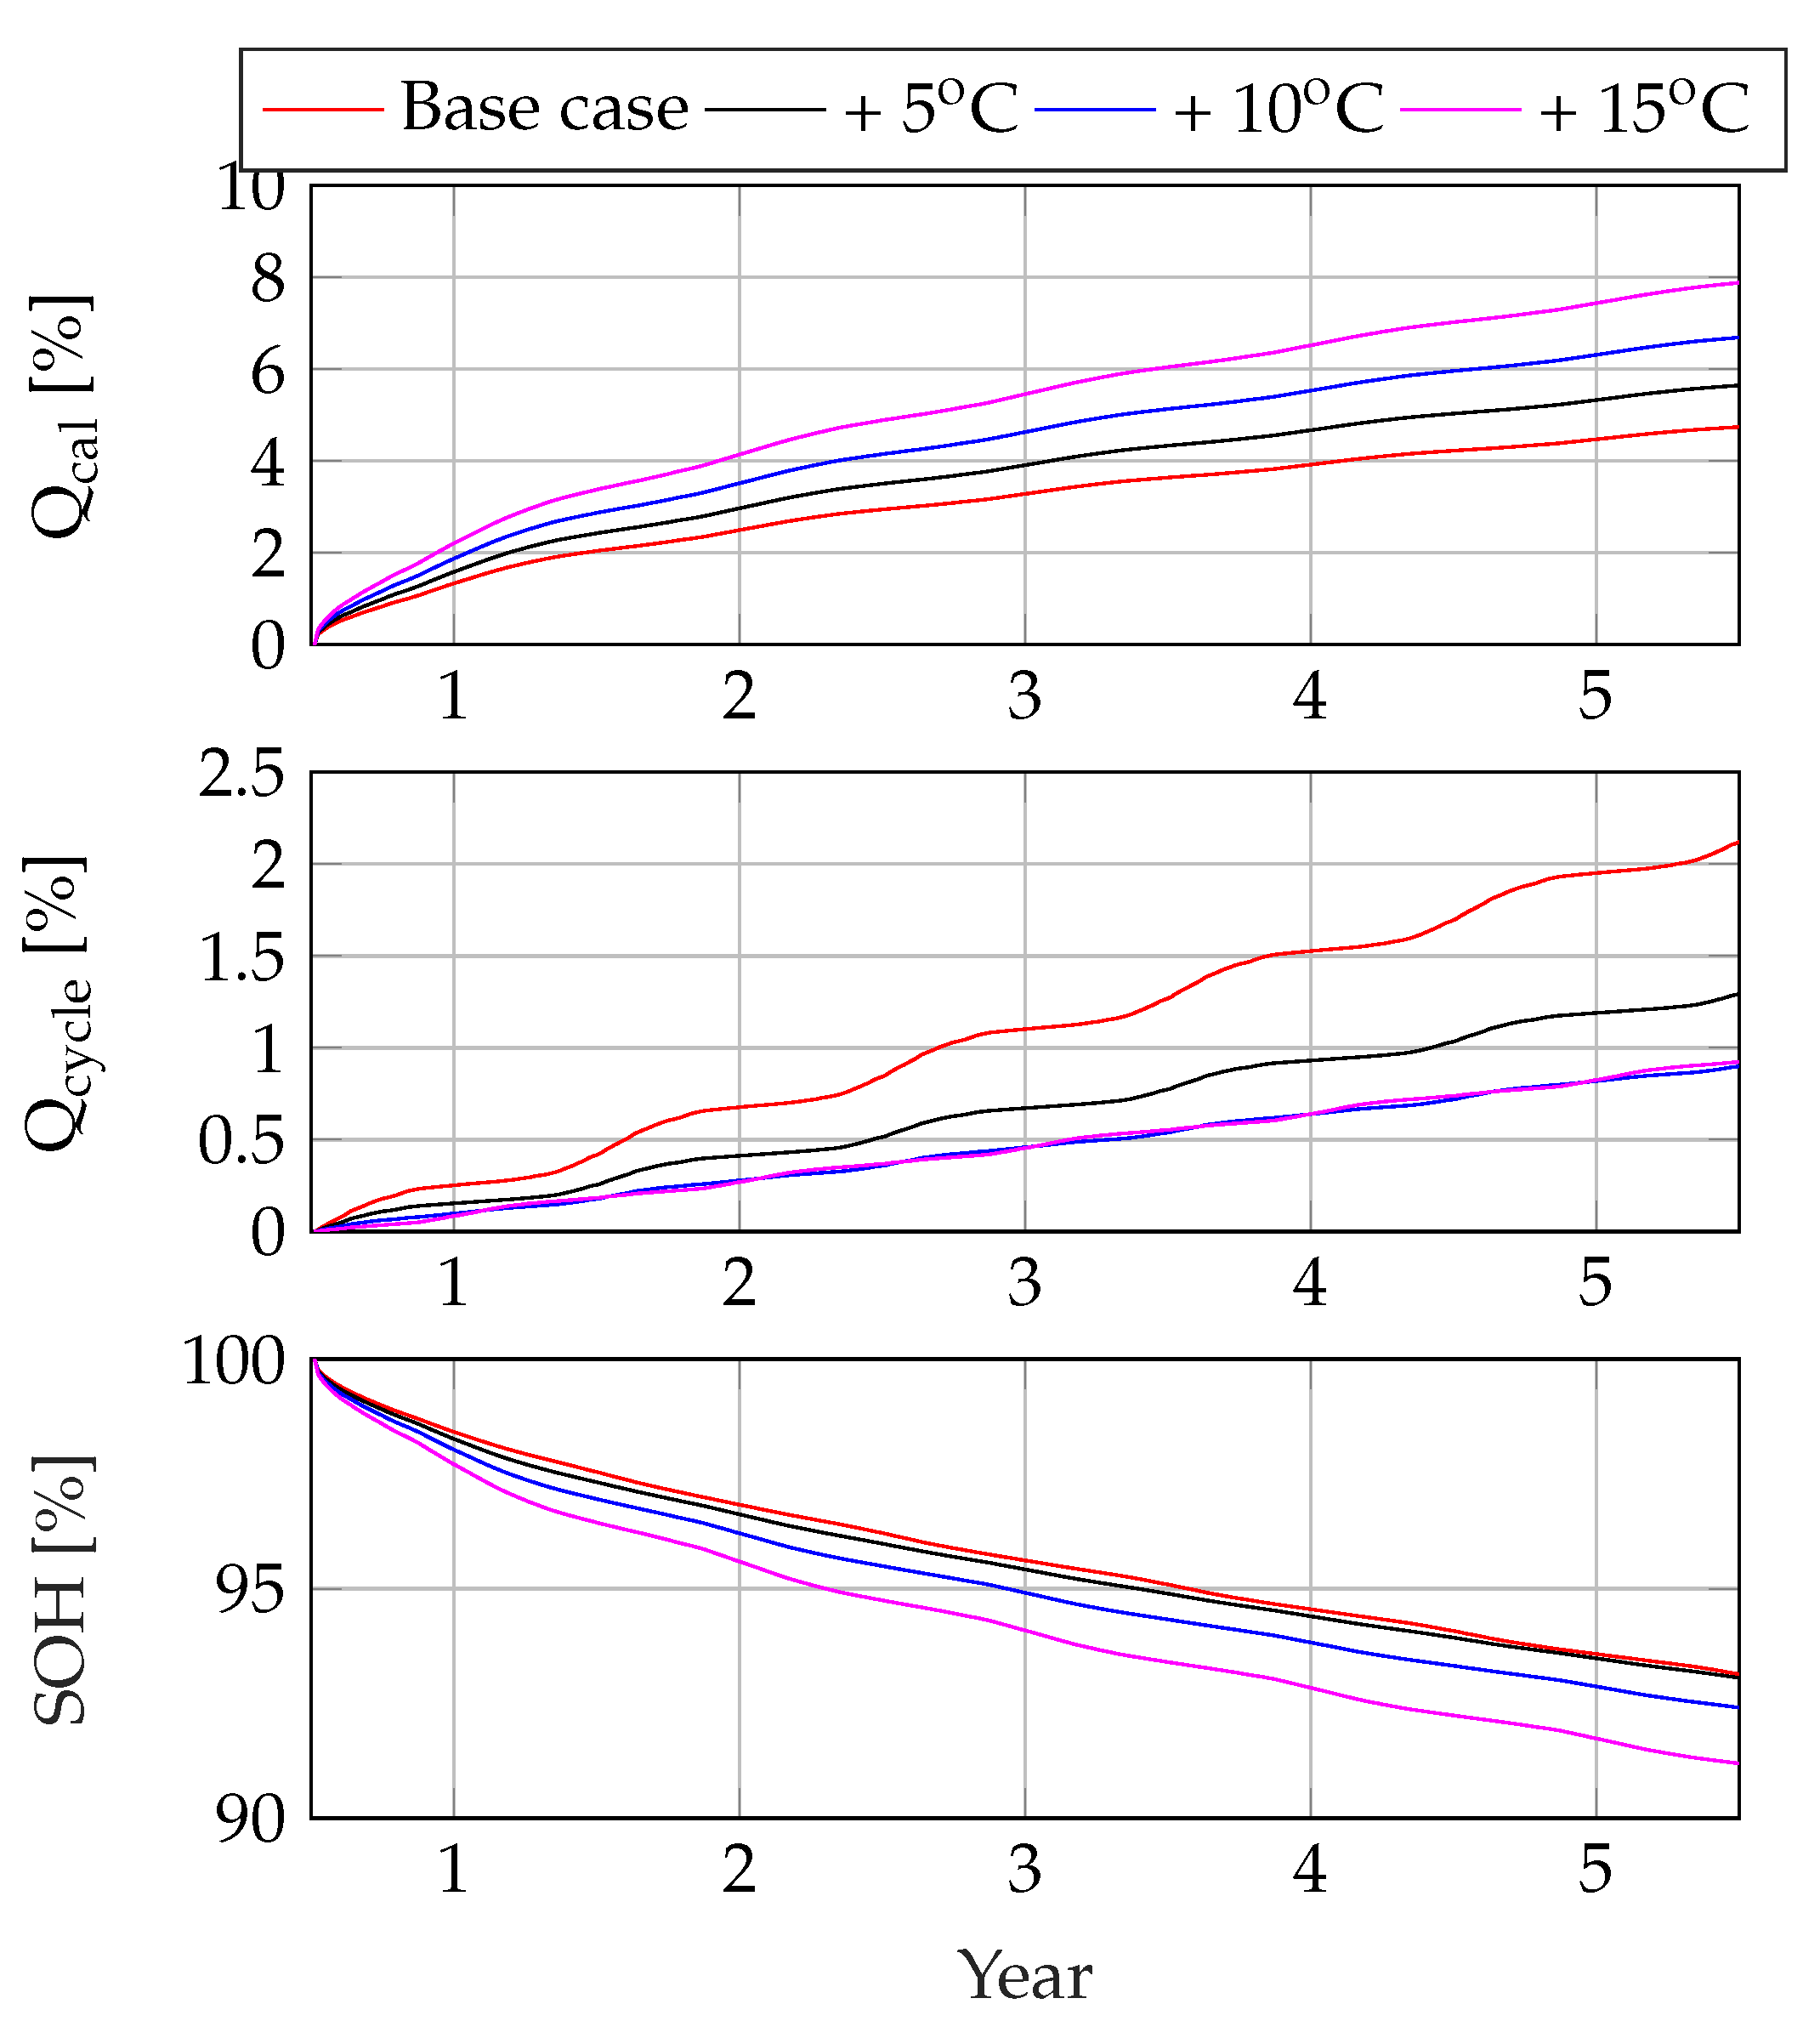
5.1. Outside Temperature
5.2. Used Capacity
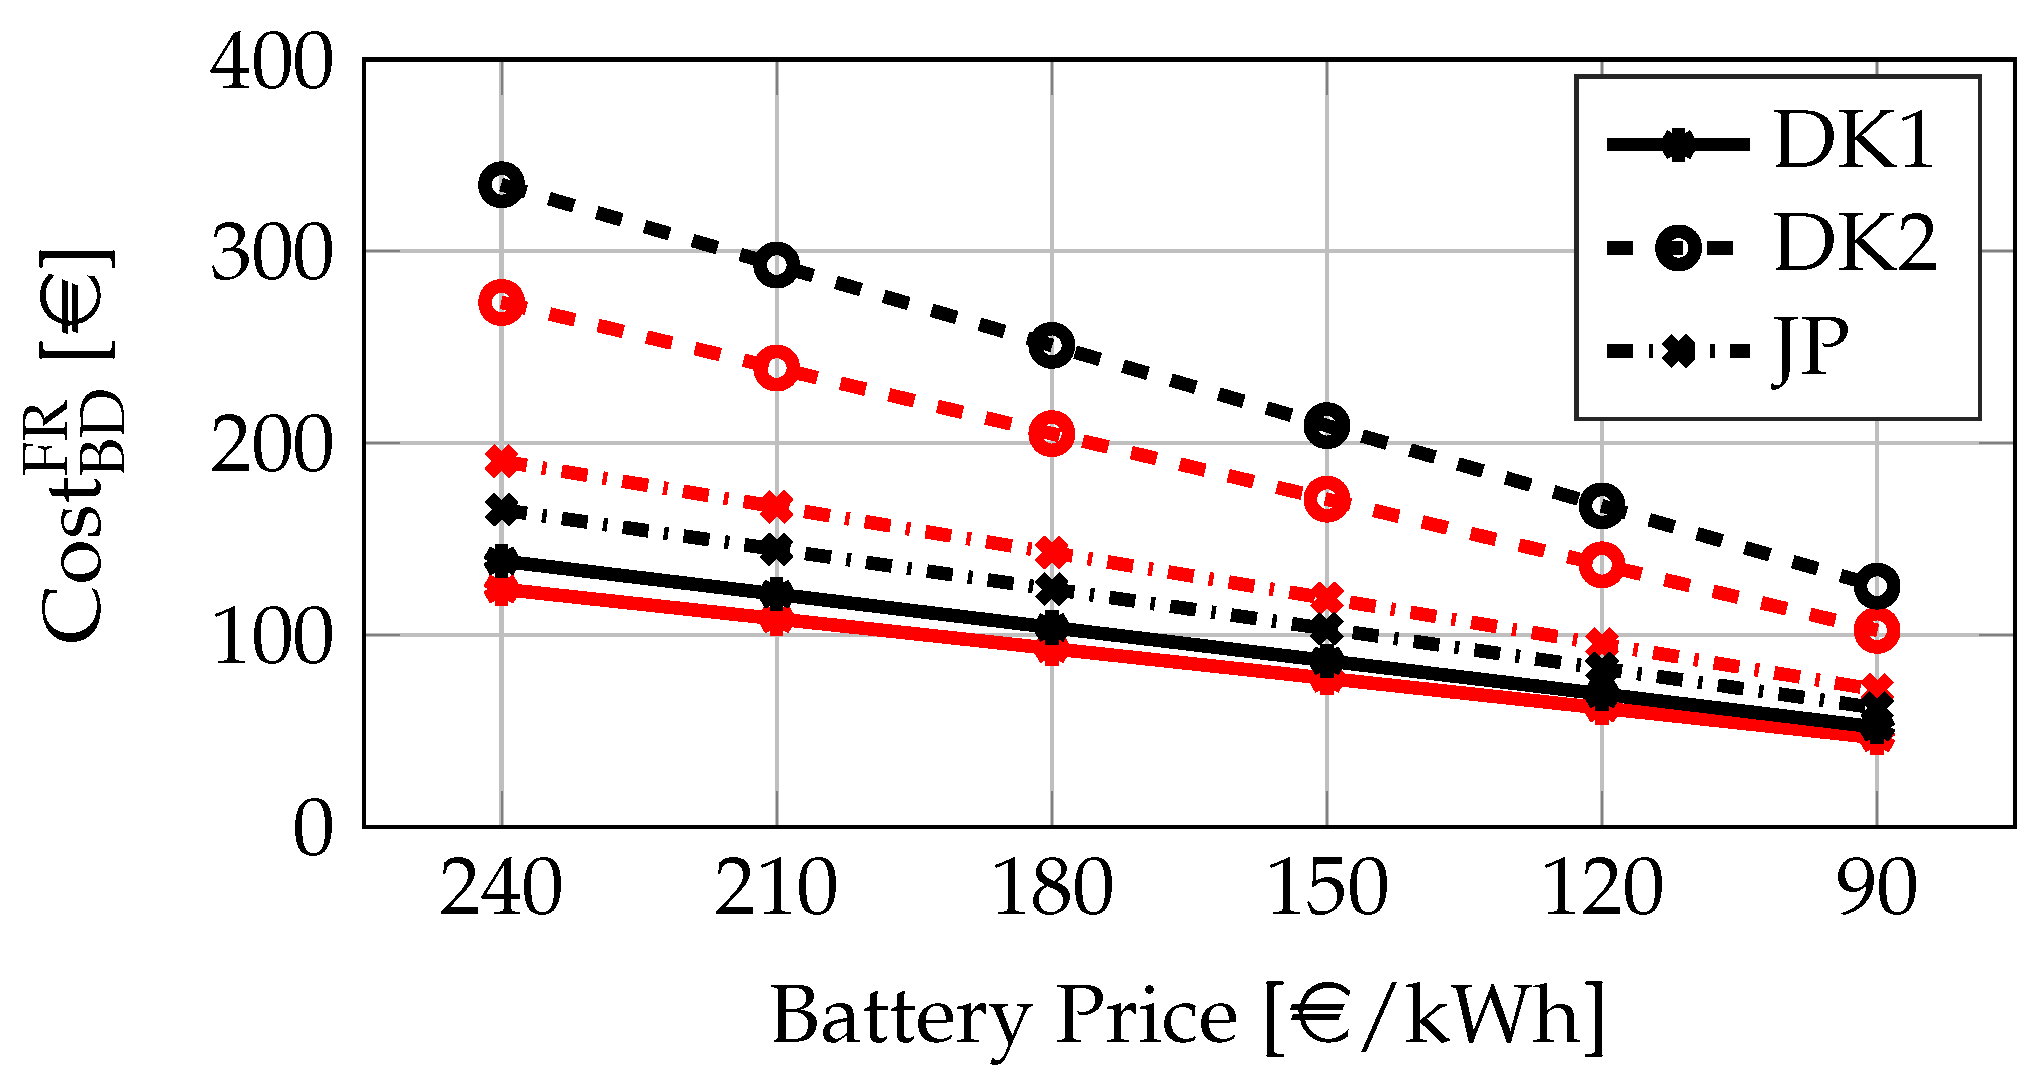
5.3. Battery Price
6. Conclusions
- charger efficiency: the charger losses of this analysis are based on the efficiency of a three years old charger. It is interesting to compare the charger efficiency of this charger with new and future chargers, which could have higher efficiency and thus lower costs [30].
- battery capacity: the considered battery has a 40 kWh capacity. Considering the same charging/discharging power profile, larger is the battery, lower is the amount of cycles the battery is exposed to. Thus, for smaller batteries the battery degradation is expected to be a larger component of the total amount of loss. For larger batteries, which are expected in the future, the degradation can be even lower, decreasing further the degradation costs. This would also give more flexibility on the charging power that can be used during the frequency regulation provision.
- Cost of electricity: in Europe it ranges around 0.21 €/kWh whereas in Denmark it is approx. 0.31 €/kWh, resulting on lower cost of electricity in most European countries.
- Vehicle driving pattern and annual distance: European countries have similar driving patterns, nevertheless distances ranges between 40 and 80 km/day depending on the considered country [31].
- Ambient temperature: European countries are characterized by wide variety of climate zones, meaning that the temperature behavior throughout the year can vary greatly.
Author Contributions
Funding
Conflicts of Interest
References
- Kempton, W.; Tomić, J. Vehicle-to-grid power fundamentals: Calculating capacity and net revenue. J. Power Sources 2005, 144, 268–279. [Google Scholar] [CrossRef]
- Andersen, P.B.; Sousa, T.; Thingvad, A.; Berthou, L.S.; Kulahci, M. Added Value of Individual Flexibility Profiles of Electric Vehicle Users for Ancillary Services. In Proceedings of the 2018 IEEE International Conference on Communications, Control, and Computing Technologies for Smart Grids, SmartGridComm 2018, Aalborg, Denmark, 29–31 October 2018. [Google Scholar] [CrossRef]
- Thompson, A.W. Economic implications of lithium ion battery degradation for Vehicle-to- Grid (V2X) services. J. Power Sources 2018, 396, 691–709. [Google Scholar] [CrossRef]
- Thompson, A.W.; Perez, Y. Vehicle-to-Everything (V2X) energy services, value streams, and regulatory policy implications. Energy Policy 2020, 137, 111136. [Google Scholar] [CrossRef]
- Thingvad, A.; Martinenas, S.; Andersen, P.B.; Marinelli, M.; Olesen, O.J.; Christensen, B.E. Economic comparison of electric vehicles performing unidirectional and bidirectional frequency control in Denmark with practical validation. In Proceedings of the 51st International Universities Power Engineering Conference, UPEC 2016, Coimbra, Portugal, 6–9 September 2017. [Google Scholar] [CrossRef]
- Codani, P.; Perez, Y.; Petit, M. Financial shortfall for electric vehicles: Economic impacts of Transmission System Operators market designs. Energy 2016, 113, 422–431. [Google Scholar] [CrossRef]
- Zecchino, A.; Thingvad, A.; Andersen, P.B.; Marinelli, M. Test and modelling of commercial V2G CHAdeMO chargers to assess the suitability for grid services. World Electr. Veh. J. 2019, 10, 21. [Google Scholar] [CrossRef]
- Thingvad, A.; Ziras, C.; Marinelli, M. Economic value of electric vehicle reserve provision in the Nordic countries under driving requirements and charger losses. J. Energy Storage 2019, 21, 826–834. [Google Scholar] [CrossRef]
- de la Prieta, F.; Escalona, M.J.; Corchuelo, R.; Mathieu, P.; Vale, Z.; Campbell, A.T.; Rossi, S.; Adam, E.; Jiménez-López, M.D.; Navarro, E.M.; et al. Trends in Practical Applications of Scalable Multi-Agent Systems, the PAAMS Collection; Springer International Publishing: Cham, Switzerland, 2016; Volume 473. [Google Scholar] [CrossRef]
- Thingvad, A.; Calearo, L.; Andersen, P.B.; Marinelli, M.; Neaimeh, M.; Suzuki, K.; Murai, K. Value of V2G Frequency Regulation in Great Britain Considering Real Driving Data. In Proceedings of the 2019 IEEE PES Innovative Smart Grid Technologies Europe, ISGT-Europe 2019, Bucharest, Romania, 29 September–2 October 2019; pp. 1–5. [Google Scholar] [CrossRef]
- Petit, M.; Perez, Y. Vehicle-to-grid in France: What revenues for participation in frequency control? In Proceedings of the International Conference on the European Energy Market, EEM, Stockholm, Sweden, 27–31 May 2013; pp. 1–7. [Google Scholar] [CrossRef]
- Dallinger, D.; Krampe, D.; Wietschel, M. Vehicle-to-grid regulation reserves based on a dynamic simulation of mobility behavior. IEEE Trans. Smart Grid 2011, 2, 302–313. [Google Scholar] [CrossRef]
- Smith, K.; Earleywine, M.; Wood, E.; Neubauer, J.; Pesaran, A. Comparison of plug-in hybrid electric vehicle battery life across geographies and drive cycles. SAE Tech. Pap. 2012. [Google Scholar] [CrossRef]
- Hicks-Garner, J.; Wang, J.; Soukazian, S.; Purewal, J.; Tataria, H.; Liu, P.; Sorenson, A.; Sherman, E.; Verbrugge, M.W.; Vu, L. Degradation of lithium ion batteries employing graphite negatives and nickel–cobalt–manganese oxide+spinel manganese oxide positives: Part 1, aging mechanisms and life estimation. J. Power Sources 2014, 269, 937–948. [Google Scholar] [CrossRef]
- Mathieu, R.; Baghdadi, I.; Briat, O.; Gyan, P.; Vinassa, J.M. D-optimal design of experiments applied to lithium battery for ageing model calibration. Energy 2017, 141, 2108–2119. [Google Scholar] [CrossRef]
- Calearo, L.; Thingvad, A.; Marinelli, M. Modeling of Battery Electric Vehicles for Degradation Studies. In Proceedings of the 54th International Universities Power Engineering Conference, UPEC 2019, Bucharest, Romania, 3–6 September 2019. [Google Scholar] [CrossRef]
- Thingvad, A.; Marinelli, M. Influence of V2G Frequency Services and Driving on Electric Vehicles Battery Degradation in the Nordic Countries Influence of V2G Frequency Services and Driving on Electric Vehicles Battery Degradation in the Nordic Countries. In Proceedings of the 31st International Electric Vehicles Symposium & Exhibition & International Electric Vehicle Technology Conference 2018, Kobe Convention Center, Kobe, Japan, 30 September–3 October 2018. [Google Scholar]
- Thingvad, M.; Calearo, L.; Thingvad, A.; Marinelli, M. Characterization of NMC Lithium-ion Battery Degradation for Improved Online Estimation. In Proceedings of the 55th International Universities Power Engineering Conference, UPEC2020, Torino, Italy, 1–4 September 2020. in press. [Google Scholar]
- ACES Project Website. Available online: https://www.aces-bornholm.eu/ (accessed on 1 July 2020).
- Wang, D.; Coignard, J.; Zeng, T.; Zhang, C.; Saxena, S. Quantifying electric vehicle battery degradation from driving vs. vehicle-to-grid services. J. Power Sources 2016, 332, 193–203. [Google Scholar] [CrossRef]
- Calearo, L.; Thingvad, A.; Marinelli, M. Experimental Validation of Lithium-ion Battery Model for Degradation Studies with no Direct Access to the Battery Pack. Unpublished work, 2020. [Google Scholar]
- Calearo, L.; Thingvad, A.; Suzuki, K.; Marinelli, M. Grid Loading Due to EV Charging Profiles Based on Pseudo-Real Driving Pattern and User Behavior. IEEE Trans. Transp. Electrif. 2019, 5, 683–694. [Google Scholar] [CrossRef]
- Thingvad, A.; Marinelli, M. Grid Frequency Measurements of the Nordic Power System during 2018. Dataset, 5 May 2020. [Google Scholar] [CrossRef]
- Frequency Containment Reserves (FCR). DK2. Available online: https://www.energidataservice.dk/ (accessed on 3 July 2019).
- Ropenus, S.; Jacobsen, H.K. A Snapshot of the Danish Energy Transition: Objectives, Markets, Grid, Support Schemes and Acceptance Study; Agora Energiewende: Berlin, Germany; DTU Management Engineering: Lyngby, Denmark, 2015. [Google Scholar]
- Electricity Price Statistics. Available online: https://ec.europa.eu/eurostat/statistics-explained/ (accessed on 3 June 2019).
- Wentker, M.; Greenwood, M.; Leker, J. A bottom-up approach to lithium-ion battery cost modeling with a focus on cathode active materials. Energies 2019, 12, 504. [Google Scholar] [CrossRef]
- Berckmans, G.; Messagie, M.; Smekens, J.; Omar, N.; Vanhaverbeke, L.; Mierlo, J.V. Cost projection of state of the art lithium-ion batteries for electric vehicles up to 2030. Energies 2017, 10, 1314. [Google Scholar] [CrossRef]
- Tsiropoulos, I.; Tarvydas, D.; Lebedeva, N. Li-Ion Batteries for Mobility and Stationary Storage Applications—Scenarios for Costs and Market Growth; EUR 29440 EN; Publications Office of the European Union: Luxembourg, 2018; ISBN 978-92-79-97254-6. [Google Scholar] [CrossRef]
- Genovese, A.; Ortenzi, F.; Villante, C. On the energy efficiency of quick DC vehicle battery charging. World Electr. Veh. J. 2015, 7, 570–576. [Google Scholar] [CrossRef]
- Pasaoglu, G.; Fiorello, D.; Martino, A.; Scarcella, G.; Alemanno, A.; Zubaryeva, A.; Thiel, C. Driving and Parking Patterns of European Car Drivers—A Mobility Survey; Publications Office of the European Union: Luxembourg, 2012; p. 112. [Google Scholar] [CrossRef]


| 0 | −0.78 | −0.91 | −1.15 | −1.49 | −1.99 | −2.63 | −3.67 | −4.68 | −5.94 | −6.9 | −7.97 | −9.09 | −10 | |
| 0.01 | 0.11 | 0.27 | 0.42 | 0.54 | 0.66 | 0.73 | 0.79 | 0.82 | 0.85 | 0.86 | 0.87 | 0.87 | 0.87 | |
| 0 | 0.17 | 0.33 | 0.59 | 0.92 | 1.29 | 1.87 | 2.42 | 3.27 | 4.25 | 5.27 | 6.08 | 7.49 | 8.71 | |
| 0.01 | 0.14 | 0.3 | 0.45 | 0.57 | 0.67 | 0.74 | 0.78 | 0.82 | 0.84 | 0.85 | 0.86 | 0.86 | 0.88 |
| Year | 2015 | 2016 | 2017 | 2018 | 2019 | mean |
| [€/y] | 667 | 1324 | 1226 | 1925 | 1466 | 1322 |
| [€/5 y] | 6608 | |||||
| Electricity Price | Domestic | Industrial | ||||
|---|---|---|---|---|---|---|
| Country | DK1 | DK2 | JP | DK1 | DK2 | JP |
| [€/5 y] | 12,065 | 13,260 | 12,815 | 2970 | 2860 | 3000 |
| Mean SOC | 55% | 75% | ||||
|---|---|---|---|---|---|---|
| Country | DK1 | DK2 | JP | DK1 | DK2 | JP |
| [€/5 y] | 876 | 1314 | ||||
| [€/5 y] | 968 | 1081 | 1019 | 1418 | 1565 | 1438 |
| [€/5 y] | 92 | 205 | 143 | 104 | 251 | 124 |
| Mean SOC | 55% | 75% | ||||
|---|---|---|---|---|---|---|
| Country | DK1 | DK2 | JP | DK1 | DK2 | JP |
| [€/5 y] | 230 | 513 | 358 | 260 | 628 | 310 |
| [€/5 y] | 92 | 205 | 143 | 104 | 251 | 124 |
© 2020 by the authors. Licensee MDPI, Basel, Switzerland. This article is an open access article distributed under the terms and conditions of the Creative Commons Attribution (CC BY) license (http://creativecommons.org/licenses/by/4.0/).
Share and Cite
Calearo, L.; Marinelli, M. Profitability of Frequency Regulation by Electric Vehicles in Denmark and Japan Considering Battery Degradation Costs. World Electr. Veh. J. 2020, 11, 48. https://doi.org/10.3390/wevj11030048
Calearo L, Marinelli M. Profitability of Frequency Regulation by Electric Vehicles in Denmark and Japan Considering Battery Degradation Costs. World Electric Vehicle Journal. 2020; 11(3):48. https://doi.org/10.3390/wevj11030048
Chicago/Turabian StyleCalearo, Lisa, and Mattia Marinelli. 2020. "Profitability of Frequency Regulation by Electric Vehicles in Denmark and Japan Considering Battery Degradation Costs" World Electric Vehicle Journal 11, no. 3: 48. https://doi.org/10.3390/wevj11030048
APA StyleCalearo, L., & Marinelli, M. (2020). Profitability of Frequency Regulation by Electric Vehicles in Denmark and Japan Considering Battery Degradation Costs. World Electric Vehicle Journal, 11(3), 48. https://doi.org/10.3390/wevj11030048