1. Introduction
Awareness of the environment from a demand perspective and stricter CO
standards [
1] from a supply perspective make electric mobility highly relevant to reduce CO
emissions from the transport sector and will change the composition of propulsion systems in the automotive market. Due to technical improvements, the electric range is today (2020) sufficient in most cases to achieve the required daily mileage for everyday travel. Furthermore, improvements in charging behavior (charging infrastructure and technologies) make the usability of battery electric vehicles (BEV)s nearly similar to conventional vehicles (CV)s with combustion engines. Two different sources can be used to monitor car usage.
The traditional approach is based on data from national household travel surveys (NHTS) with different emphasizes (Germany: German Mobility Panel (MOP) [
2], Mobility in Germany (MiD) [
3] or Mobility in Cities (SvR) [
4]; USA: U.S. National Household Travel Survey [
5], California Household Travel Survey [
6] or Puget Sound Regional Travel Study [
7]). An advantage of this active reported data is that general travel behavior is captured and sociodemographic information about the car users are included. The relevant disadvantage is that NHTS often only covers the travel behavior for one day. Therefore, NHTS do not allow a longitudinal observation of behavior and car utilization. However, longitudinally oriented NHTS such as MOP [
2] allow to capture representative car use over a longer period of time. Another characteristic and disadvantage in terms of usage of BEVs is that NHTS illustrate a representative population. As a consequence, the use of BEVs, which is not representative for a population, is still only poorly represented. Furthermore, a comparison of car usage between countries is not directly possible due to different survey methods (e.g., questionnaires) at national level. In addition, NHTS capture travel behavior of individuals and not from vehicles. To evaluate the suitability of BEVs, all users of a vehicle must be taken into account over a longer period of time. This needs additional assumptions for the transformation from individual to car level. An approach similar to traditional NHTS can be derived by diary studies covering car use. However, these studies are mostly not representative as they only cover small and specialized samples.
A novel approach is via large-scaled sensor data from vehicles. Data are automatically sent to a backend system where data can be processed and analyzed. A central advantage is that the storage of data takes place without interaction and without any subjectivity from the car user (passive reporting). Therefore, respondent burden or inaccuracies are widely excluded. Due to automatic data generation, sensor data can be scaled to any period of time and sample size across different countries. A disadvantage is that data are mainly only available for a specific fleet sample without information about sociodemographics or trip purposes and cannot be used for general statements.
In our study, we apply both to use advantages from both approaches:
Survey-based longitudinal modelled data of CVs from different NHTS, which have been processed to derive representative car usage in Germany and California.
Sensor-based longitudinal data to observe the specific usage from BEVs in Germany and California.
With these approaches, the focus of this study is in comparison of (1) BEVs with CVs and (2) BEVs in Germany with BEVs in California. Therefore, we want to answer the following research questions:
- 1.
To what extent are relevant use patterns of vehicles already today utilized by BEVs as upcoming technologies and can thus replace CVs with combustion engines?
- 2.
Does the usage of BEVs differ between Germany and California?
Scope of the Work
Nowadays (2020), the assumed suitable electric ranges of BEVs converging to the car user requirements of universally applicable CVs. Due to technical improvements the ranges can easily achieved with current BEVs on the market (e.g., Polestar 2 with a electric range of 500 km, Mercedes EQC with an electric range of 412 km, Audi e-tron with an electric range of 411 km). Electric range is calculated under Worldwide harmonized Light vehicles Test Procedure (WLTP). However, studies measure suitability mainly on objective electric range criteria derived by the actual usage of non-BEVs (see
Section 2). They neglect that it is much more interesting whether the BEV is accepted and used like CVs. Only if BEVs are used like CVs, BEVs will replace vehicles with traditional propulsion systems in the long term. Otherwise, BEVs will only remain a marginal phenomenon and will only be pushed into the market by temporary incentives (e.g., low parking fees for BEVs) or restrictions through driving bans for specific propulsion systems (e.g., Paris or London) or license caps (e.g., Beijing).
In our study, we use on one hand results of a car use model covering the period of one year based on survey data to observe a representative usage from CVs [
8]. Based on hierarchical clustering and k-Means eight car usage profiles were defined on the basis of CVs in a previous study [
9]. On the other hand, we use sensor-based data to observe the specific usage from BEVs in Germany and California. Germany and California are well-developed countries (respectively states) with high standards of living and comparable geographic sizes [
9,
10,
11]. In addition, the motorization rate is one of the highest in the world. Furthermore, both have an extensive network of limited access highways [
12]. However, they have also some differences like access to public transport and costs for different modes of transport (e.g., petrol prices) [
13]. Studying comparably of well-developed areas allows controlling for similarities, such as income or motorization, while accounting for differences, such as transport policies or spatial development patterns. Understanding differences in car usage in similarly wealthy areas with different car usage levels may help inform policy decision to make transport more sustainable [
9]. Germany and California are therefore good candidates of comparison since they are similar in their development (motorization rates, infrastructure) but differ in the use of means of transport, caused, for example, by pricing or attitude [
14,
15]. In order to analyze the similarities and differences in usage, the relative sizes of the car usage profiles of BEVs and CVs will be compared. To our knowledge, there are no studies available which compare the usage of BEVs with CVs.
The study is structured as follows: First, we will present an overview on previous approaches to measure suitability of BEVs. Second, we will describe the different data sources used. Third, we will introduce the underlying car usage profiles. Using the car usage profiles as a label of conventional vehicles, we trained a softmax regression (SR) model to combine the different data sources. Fourth, we will discuss the results. Finally, we will briefly summarize the results, give an outlook and present opportunities for further research.
2. Previous Approaches to Measure Suitability of BEVs
There exist several studies which make statements about how the usage of cars fit with the electric ranges to BEVs based on survey and sensor data. Some rather survey-based studies measure the suitability of BEVs with defined characteristics (range, charging time) based on thresholds concerning trip lengths or driven daily distances. Other studies aim at the frequencies of days not to be able to fulfill the observed range requirements. Weiss et al. (2014) [
16] defines three stages based on the MOP: (1) BEV suited without adjustments, (2) BEV suited, with slight adjustments, (3) Not BEV suited. A car is not BEV suited as soon the car exceeds a daily mileage of more than 100 km on at least 5 days per year. In the same year, an international comparable web-based travel diary questionnaire (covering a period of seven consecutive days) for Germany, Spain, France, Italy, Poland and the United Kingdom (UK) was conducted. An observed average daily mileage between 40 km in UK and 80 km in Poland reveals that most vehicles are within given electrical ranges. Furthermore, more than half of the trip chains are shorter than 50 km. Statements about whether the car is used as a first or second car in the household were not made [
17]. Jakobsson et al. (2016) [
18] analysed the technical and economical suitability of BEVs in a single- and multi-car households in Sweden (400 cars) and Germany (6300 cars) based on Swedish car movement data (SCMD) and MOP. Only cars from SCMD with at least 30 days of credible GPS measurements were included in the analysis. With an assumed electric range of 230 km, half of the vehicles could fulfill their daily driving distances with a BEV, based on the assumption that individuals will not change their driving behavior and charge their BEVs overnight. Based on the NHTS of 2009 from the United States, van Haaren (2011) [
19] shows that 99% of all trip lengths are below 70 miles. The same holds true for daily distances below 250 miles. The data of NHTS was collected with computer assisted telephone interviewing (CATI) technology and a one day travel diary. Kahn and Kockelman (2012) [
20] assume an electric range up to 120 miles. It shows, that nearly 95% of the observed single-vehicle households can switch to BEV on 95% of the observed days. In this study, unique data were available over an average observation period of 341 days for 445 vehicles (264 households) from Puget Sound Regional Council. The same data base was used in the work of Tamor and Milačić (2015) [
21]. Here, the study focus is on two-vehicle households and they seek that only a range of 60 miles is necessary to satisfy the car usage needs of 90% of two-car households. Another study identified that nearly 75% of the observed vehicles around Atlanta are suitable for BEVs with an electric range of 200 miles, if they make adaptations on six days a year [
22]. Data were generated by installing data acquisition hardware on vehicles. Data include 363 individual vehicles over a period of one to three years started around 2000 [
23]. In sum, there is no common understanding at which point BEVs fulfill car user’s requirements derived from their usage patterns.
3. Materials
For this study we use two data sources:
3.1. Sensor Data
Sensor data, which are available for BEVs in this study, are odometer based and transmitted automatically without any action from car users. For this process the car user has to agree the terms of use. Sensor data include the following informations:
To identify trustworthy data, we implemented following criteria:
BEVs must send data before the observation period starts.
All vehicles with an average trip length over 200 km were excluded. The reason for these high trip lengths could be an error in the data transmission or the inclusion of cars, which are used to transport passenger (e.g., taxis or rental cars). These vehicles are not focus of our research question, and thus we have excluded them from our study.
In total, data from 1073 BEVs with 66,672 trips in May 2018 from Germany and California were available for this study. In Germany we observed 716 BEVs with 38,330 trips. In California, we observed 357 BEVs with 28,342 trips.
3.2. Car Use Model Based on Survey Data
The model contains 1659 conventional cars with 1,207,115 trips in Germany and 1681 conventional vehicles with 2,084,508 trips in California over the course of one year. Car use model based on survey data was initially developed for Germany using two surveys as input data.
The MOP is a German NHTS which consists of the two parts ‘Everyday Mobility’ and ‘Fuel Consumption and Odometer Reading’. For a detailed description of the MOP, see [
2,
24].
In INVERMO participants were asked to report detailed information on their last three long-distance trips. For detailed description of INVERMO, see [
25].
Car usage over one year based on NHTS data in Germany and California [
8,
9,
10] was modelled by determining the (1) individual car travel data of survey participants during the week, (2) car usage for typical days of the year, (3) car usage per day during the period of the MOP survey, (4) car usage per day for the remaining days of the year. For a detailed description of the CUMILE algorithm, see [
8,
10]. For comparison of car usage between Germany and California, modelling concept for California is very similar to the original model in Germany. Therefore, they used California NHTS data from 2010 to 2012 [
9].
4. Method
In this section, we present the eight car usage profiles and their characteristics. Afterwards, we describe and formalize the algorithm used and assign BEVs into car usage profiles.
4.1. Car Usage Profiles
Eisenmann and Buehler (2018) [
9] were able to define eight car usage profiles (see
Table 1) with survey data from Germany and California based on a hierarchical clustering and k-Means approach:
Clustering approach based on four cluster forming variables: (1) Days without car use (Days0), (2) Daily mileage below 10 miles (Days10), (3) Daily mileage of more than 100 miles (Days100), (4) Share of workdays.
To compare the usage of sensor-based BEVs with survey-based CVs, we transformed the collected sensor data into the same four cluster forming variables. To consider that BEVs include only young cars (car age below three years), we decided to extend the feature space with an additional variable ‘Vehicle Kilometers Travelled (VKT)’. For this reason, it is not possible to reproduce the clustering model by using the same cluster method (hierarchical clustering and k-Means) and by assigning BEVs based on centroids. A further advantage is that VKT is not a modelled value from CUMILE but an input variable based on the surveys. To allocate the BEVs to the usage profiles, we had to train a new supervised allocation model. Therefore, we used a softmax regression (SR) model.
4.2. Assignment of Electric Vehicles to Car Usage Profiles
Due to the fact that CVs were observed over the course of one year and BEVs were observed over the course of one month, we standardized the variables to z-scores:
where
is a vector of the five input variables of conventional vehicle
i.
is the mean and
describes the standard deviation of each input factor. The resulting
has the same size as
with a mean of zero and a standard deviation of one. To assign BEVs to the eight existing car usage profiles, we used a SR. SR, where multiclassification problems can be solved, is a generalization of the well-known logistic regression [
26,
27,
28].
For every vehicle
i and for every car usage profile
k the SR calculates a score
. These scores are stored in a
matrix
s (
s =
).
is the standardized
matrix over all vehicles
n with the five input factors
m.
is the parameter vector for car usage profile
k. All vectors are stored in a
matrix
.
After all scores are computed for every car usage profile, we can estimate the probability
, that the vehicle belongs to a car usage profile
k. This is done by putting the scores
into the softmax function:
The softmax function normalize every score to a value between zero and one. High scores () will converge to one and low scores () will converge to zero. In other words, the values of will transformed to probabilities. Every vehicle receives a probability of assignment for every car usage profile. The sum of all probabilities of the eight car usage profiles is one (). K represents the eight car usage profiles. is the estimated probability that the vehicle belongs to car usage profile k, given the score of each car usage profile.
This is an advantage of SR compared to other supervised learning techniques, which only provide clear assignments. SR provides a probability of assignment for every class. Especially by using two different data sources, a probability of assignment is helpful to be able to assess the quality of classification for every BEV. This also enables us to identify vehicles that do not fit in one out of eight car usage profiles. To get a clear assignment, we take the car usage profile
k with the highest probability.
is the vector of car usage profiles with the highest probabilities. To optimize the model, we adjust the parameters
in order to minimize the cross entropy cost function
.
Due to the fact that
has no known closed-form equation, but is a convex function, we compute the global optimum by using stochastic average gradient (SAG). SAG is like the stochastic gradient descent optimization algorithm and records an average of its parameter vector over time. To calculate the SAG and update
, we need the cross entropy gradient vector of
with respect to
.
To validate our model and to guarantee generalization, we divided randomly the labeled dataset into a training (70%) and test (30%) set. In total, 91.21% of the predicted car usage profiles
matches with the true allocation
. The estimated parameters are listed in the
matrix
(see
Table 2).
Each row describes the decision function for the respective car usage profile k and each column describes the parameters for the respective input factors. We estimate the parameter for pooled data combining vehicles used in Germany and California to define the same criteria for assigning car usage profiles for BEVs regardless of the country. Through the matrix we see that car usage profiles are well represented by certain input factors. Days without driving (Days0) has the greatest positive influence (6.46069) on assigning to standing cars and the greatest negative influence (−6.43686) on assigning to day-to-day cars. Daily mileage below 10 miles (Days10) has a very strong influence (10.0783) on the assignment to short-distance cars. The additional cluster forming VKT also has an effect on allocation. This becomes relevant by assigning BEVs to the car usage profiles, even if the values are not that high for CVs.
To calculate the probabilities of each car usage profile k for every BEV, we used the same input facotrs , transformed them to z-scores , calculated the score based on the estimated matrix and transferred them into the softmax function to receive for every BEV and the respective car usage profiles k. Based on the probabilities, we can compute the clear assignment to a car usage profile. The approach was built by using Python and the related libraries (e.g., scikit-learn, Matplotlib).
5. Results
The following section is structured as follows: First, we will analyze the probability of allocation and its variance to identify the certainty of allocation. Based on the certainty of allocation, we will only focus on BEVs with a probability of assignment higher than 75% (BEV75). Then, we will compare the estimated clear assignments to one specific car usage profile with the assignments of conventional cars for Germany and California.
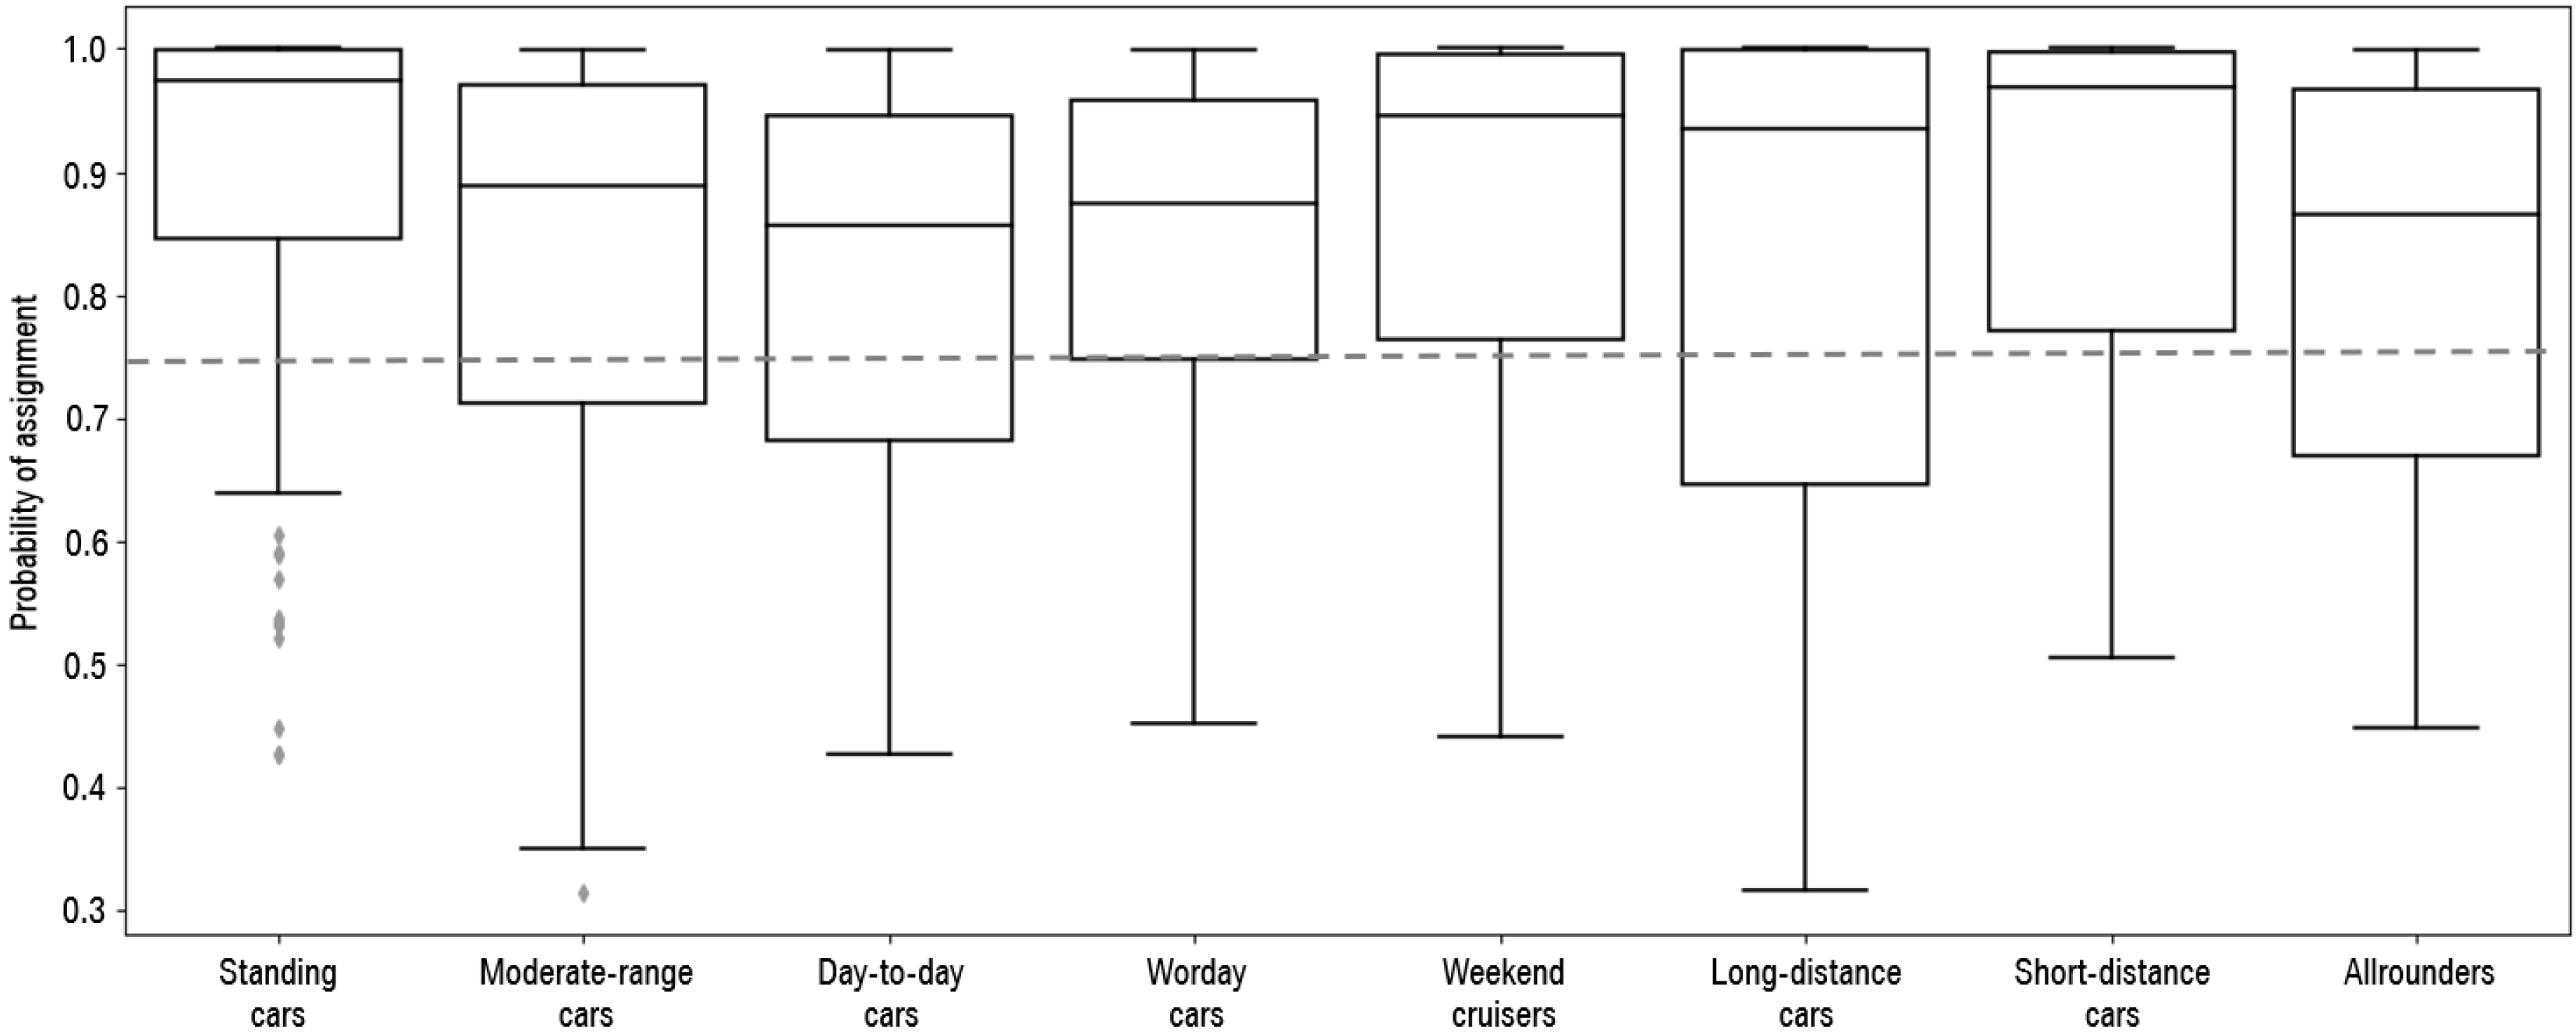
Due to the used softmax function, we are able to describe the median (med) probability and the variance (var) of assignment among the eight car usage profiles (
Figure 1). Based on these key indicators, we can determine how well the assigned usage profiles fit with the usage of the observed BEVs. The higher the probability, the more the usage of BEVs fits the respective usage profile. Furthermore, we can determine the distinctness of the usage profiles to the BEVs. The lower the variance of the usage profiles, the clearer the usage profiles are.
Standing cars (med: 97%, var: 2.1%), short-distance cars (med: 97%, var: 2.0%) and weekend cruiser (med: 95%, var: 2.4%) have a high average allocation probability and low variance. This indicates that the assignment of sensor-based BEVs to the survey-based usage profiles fits. Moderate-range cars (med: 89%, var: 2.9%) and long-distance cars (med: 93%, var: 4.2%) have still a high median, but the variance, especially for long-distance cars is twice as large as for standing cars. In other words, there are long-distance cars which can clearly assigned (based on high probability) to the usage profile, but there are also BEVs which have been assigned to the profile, but the assignment is not clear (based on low probability). Day-to-day cars have the lowest average probability of assignment (86%) and the second highest variance (2.8%). However, only 6% of 1073 BEVs were assigned to day-to-day cars, this low sample could bias the median and variance. Furthermore, day-to-day cars are primarily affected by the input factors ‘days without car use’ (−6.43686) and ‘share of workdays’ (−4.23679). These input factors are also relevant for other car usage profiles (e.g., Short-distance cars: −3.75175 (days0), weekend cruiser: −4.17534 (share of workdays)) leading to overlaps in car usage profiles. Workday cars (med: 87%, var: 2.0%) and allrounders (med: 87%, var: 2.8%) have a relative low average allocation probability, but a low variance. This could indicate that workday BEVs fit not perfectly to this usage profile, but it is still the best compared to the other usage profiles.
As only vehicles are compared whose usage fits well with the specified car usage profiles, we only consider BEVs with an assignment probability of greater than or equal to 75%. This reduced the sample from 1073 (BEV100) to 787 (BEV75) BEVs. The distribution among car usage profiles between BEV100 and BEV75 changed only slightly. The share of day-to-day cars, weekend cruiser and long-distance cars among the car usage profiles have the same size. Standing cars, moderate-range cars and short-distance cars slightly increased, while workday cars and allrounders slightly decreased.
5.1. Comparison of Conventional and Electric Vehicles within Germany and California
Table 3 presents the distribution of survey-based CVs and sensor-based BEV75 among the car usage profiles. In Germany the most remarkable factor is, that the relative size for short-distance cars for BEVs (2%) is lower compared to CVs (9%). BEVs were not used intensively for daily distances below 10 km. On the other hand, the share of long-distance cars for BEVs (5%) is higher compared to CVs (3%). This could indicate that BEVs are already accepted for daily distances above 100 km. In California we have an opposite picture, long-distance cars for BEVs (10%) are used less compared to CVs (14%). In California generally longer distances must be covered due to the topography. Vehicles were used more frequently in long-distance travel (daily distances over 100 km). Therefore, vehicles could cover distances beyond the electric range (200 km), which would explain the lower proportion of BEVs compared to CVs. The proportion for workday cars is nearly similar in Germany (CV: 14%, BEV: 13%) and equal in California (CV: 8%, BEV: 8%). This could indicate, that BEVs are used like CVs for commuting and business purposes. Looking at the shares of day-to-day cars (Germany: CV: 12%, BEV: 5%; California: CV: 18%, BEV: 7%) and weekend cruisers (Germany: CV: 15%, EV: 14%; California: CV: 16%, BEV:6%) confirms the assumption that BEVs are mostly used for specific purposes. Day-to-day cars and weekend cruisers must meet requirements for specific trip purposes (e.g., trunk size for bulk purchases). BEVs are mainly small vehicles, which makes it difficult to transport larger items. Overall, the share of day-to-day cars in both countries is very low compared to CVs. It is likely that many BEVs are second cars of a household or company cars and therefore less used in everyday travel. This can be assumed by reasons of the higher share of standing cars in Germany (CV: 16%, BEV: 22%). In California, the share for standings cars for BEVs (11%) is lower compared to CVs (13%). This could imply, that BEVs in California are more accepted for everyday travel of Californians compared to German households.
5.2. Comparison of Electric Vehicles between Germany and California
The most outstanding factor by comparison of BEVs between Germany and California is that the share of standing cars is in Germany (25%) significantly larger compared to California (11%). This could indicate that BEVs in Germany are often used for specific trip purposes (e.g., work). This is also confirmed by watching at the second highest probability of assignment. If the highest probability of assignment is a standing car, then the second highest probability is with 83% a workday car. This could also indicate that BEVs in Germany are mainly used as second car. Furthermore, an explanation for the lower share of standing cars in California can be the strong support through regulatory policy (e.g., using High Occupancy Vehicle (HOV) with BEVs, Clean Vehicle Rebate Program (CVRP)). As a result, the BEV is much more accepted in California and therefore used more. The share of long-distance cars (Germany: 5%; California: 10%) and moderate-range cars (Germany: 22%, California: 47%) is in California twice as much as in Germany. This can be explained by country-specific characteristic (e.g., topography) and the role of other modes of transport. In California, the car is the most popular mode of transport, which is why most of the journeys are made by vehicle. It is obviously that BEVs in California have found its role as a moderate-range car. Almost half of the BEVs can be assigned to this usage profile. The share of weekend cruisers in Germany (14%) is more than twice as large as in California (6%). This could indicate that for leisure trips (which are mainly done on weekend) non-BEVs are strongly preferred in California.
6. Discussion
In our study, we described an probabilistic approach to compare usage from CVs (from a car use model based on survey data) with BEVs (from sensor data) on car usage profile level. We transformed the sensor data from BEVs into the same data structure as how car usage profiles were defined. SR were used to calculate the probabilities of assignment for each BEV for every car usage profiles. Based on the probabilities we can observe the certainty of assignment. Therefore, we focused on BEVs with a high probability of assignment and compare it with already assigned CVs in Germany and California.
Comparison between BEVs and CVs reveal differences in usage. The major highlights are briefly summarized:
BEVs⋯
⋯ have more relevance in long-distance travel than CVs (BEV75: 3%, CV: 5% ) in Germany.
⋯ have a high share of standing cars in Germany.
⋯ are poorly used on weekends in California.
⋯ have almost no relevance in day-to-day usage in Germany and California.
⋯ have similar relevance for use on workdays as CVs in Germany and California.
⋯. have found their role as a car, which is used in a moderate range in California.
⋯ are not mainly used for short-distances (below 10 km) in Germany and California.
Especially the suitability of BEVs with specific electric ranges, which are intensively discussed in research, are confirmed by a surprising high share of long-distance cars. In other words, the acceptance to use BEVs over longer distances is given. However, the acceptance of using BEVs for all purposes (e.g., day-to-day cars), especially in Germany, is not as pronounced. Perhaps, BEVs are more suitable for carsharing concepts. Conversely, BEVs fulfill the necessary ranges so that they can also be used for longer distances. This could indicate that range anxiety [
29,
30] has been weakened over time.
Why BEVs are still not used by the mainstream for everyday travel like CVs can have several reasons. On the one hand, charging BEVs still takes longer compared to conventional refueling. Even if the charging time has shortened considerably over the past, this could still hinder the universal use of BEVs. On the other hand, trust in BEVs is not so common. Variations in the electrical range due to extreme temperatures and environmentally harmful production and recycling of batteries does not support a purchase of BEVs. Due to these uncertainties, individuals may still prefer conventional propulsion systems. Charging time will probably never be fully matched to the refuelling time. Car user must change their traditional behavior (e.g., charging overnight), when they want to use a BEV. The other mentioned points, however, could be settled by a transparent policy. A concrete commitment (e.g., better charging infrastructure) by the government to electric mobility would lead to more stability regarding the durability of BEVs. In California the state interventions (e.g., HOV lanes) already show a positive effect [
31,
32].
Furthermore, compared to traditional propulsion systems (petrol, diesel), the electric engine (and the associated charging technology) and the electrification of larger vehicles (e.g., large trunk space) is still under development. In future, these improvements will increase the acceptance of BEVs across the countries.
The focus of our study was in the comparison between BEVs and CVs on car usage profile level. The analysis of BEVs which were not assigned to a car usage profile due to low probability was not conducted. Further research could analyse these BEVs and identify new electric-specific car usage profiles. Furthermore, in this study we have applied on existing usage profiles to ensure comparability between representative car usage of CVs and the usage of BEVs. In further investigations, all vehicles (BEVs and CVs) could be clustered unsupervised to see how many BEVs and CVs end up in one cluster. Another approach to measure differences and similarities and their allocation to car usage profiles could be to estimate two softmax regressions for Germany and California (
,
) and compare the differences in weights. This study does not focus on cars used in the context of carsharing concepts. Further research could use a similar method to identify car usage profiles and analyse the suitability of BEVs in a carsharing context. In addition, the results gained could be used for existing studies [
33] to identify suitable car usage profiles for carsharing services and derive their potentials. Furthermore, the results can also be used in analysis to optimise carsharing fleets with different propulsion systems [
34].
In summary, we could identify differences and gather new insights (e.g., acceptance of BEVs in long-distance and everyday travel) in analysing the differences of usage between BEVs and CVs. Therefore, new implications to enhance the acceptance for the use of BEVs could be developed.


