Charge for Less: An Analysis of Hourly Electricity Pricing for Electric Vehicles

Abstract
1. Introduction
2. Materials and Methods
- DHC: Daily Hourly Charges ($): the dollar value of electric supply charges resulting from battery recharge under scenario and vehicle conditions using optimized hourly charging.
- VCR: Vehicle Charge Rate (kW): the maximum hourly charging rate for test vehicle.
- T: Charging Hours (H): the total number of hours required to recharge battery under test conditions, rounded to the next whole hour.
- CHR: Charge Required (kWh): the total amount of energy required to recharge battery under test conditions.
- LMPn: LMP during nth lowest ranked hour of day ($/kWh)
3. Results
4. Discussion
Author Contributions
Funding
Conflicts of Interest
References
- Bloomberg NEF, Electric Vehicle Outlook 2018. Available online: https://about.bnef.com/electric-vehicle-outlook/ (accessed on 17 October 2018).
- Mai, T.; Jadun, P.; Logan, J.; McMillan, C.; Muratori, M.; Steinberg, D.; Vimmerstedt, L.; Jones, R.; Haley, B.; Nelson, B. Electrification Futures Study: Scenarios of Electric Technology Adoption and Power Consumption for the United States; NREL/TP-6A20-71500; National Renewable Energy Laboratory: Golden, CO, USA, 2008. Available online: https://www.nrel.gov/docs/fy18osti/71500.pdf (accessed on 17 October 2018).
- Fitzgerald, G.; Nelder, C. From Gas to Grid: Building Charging Infrastructure to Power Electric Vehicle Demand. Rocky Mountain Institute. Available online: https://www.rmi.org/insight/from_gas_to_grid/ (accessed on 17 October 2018).
- Bradley, M.J.; Associates LLC. Regulatory Assistance Project and International Council on Clean Transportation. “Electric Vehicle Integration in the U.S., Europe, and China: Challenges and Choices for Electricity and Transportation Policy.”. 1 July 2013. Available online: https://www.theicct.org/sites/default/files/publications/EVpolicies_final_July11.pdf (accessed on 17 October 2018).
- Cohen, M. The ABCs of EVs: A Guide for Policy Makers and Consumer Advocates. Citizens Utility Board, 2017. Available online: https://citizensutilityboard.org/wp-content/uploads/2017/04/2017_The-ABCs-of-EVs-Report.pdf (accessed on 17 October 2018).
- Bin Humayd, A.; Bhattacharya, K. Design of Optimal Incentives for Smart Charging Considering Utility-Customer Interactions and Distribution Systems Impact. IEEE Trans. Smart Grid 2017. [Google Scholar] [CrossRef]
- Luo, C.; Huang, Y.-F.; Gupta, V. Stochastic Dynamic Pricing for EV Charging Stations with Renewable Integration and Energy Storage. IEEE Trans. Smart Grid 2018, 9, 1494–1505. [Google Scholar] [CrossRef]
- Liu, P.; Yu, J.; Mohammed, E. Decentralised PEV Charging Coordination to Absorb Surplus Wind Energy via Stochastically Staggered Dual-Tariff Schemes Considering Feeder- Level Regulations. IET Gener. Transm. Distrib. 2018, 12, 3655–3665. [Google Scholar] [CrossRef]
- Dallinger, D.; Wietschel, M.; Santini, D.J. Effect of demand response on the marginal electricity used by plug-in electric vehicles. World Electr. Veh. J. 2012, 5, 730–738. [Google Scholar] [CrossRef]
- Alexander, B. Smart Meters, Real Time Pricing, and Demand Response Programs: Implications for Low-Income Electric Customers; Purchase Order No. 4000049807; Oak Ridge National Laboratory UT-Battelle, LLC: Oak Ridge, TN, USA, 2007. [Google Scholar]
- 2018 Toyota Prius Prime Plug-In Hybrid. Available online: https://www.toyota.com/priusprime/ (accessed on 17 October 2018).
- 2018 Chevrolet Bolt EV Features, Specs, Trims and Dimensions. Available online: https://www.gmfleet.com/chevrolet/bolt-ev-electric-vehicle/features-specs-trims-dimensions (accessed on 17 October 2018).
- Tesla Model 3. Available online: https://www.tesla.com/model3 (accessed on 11 January 2019).
- CT4000 Level 2 Commercial Charging Station Specifications and Ordering Information. Available online: https://www.chargepoint.com/files/datasheets/ds-ct4000.pdf (accessed on 17 October 2018).
- Express 200 DC Commercial Charging Stations Specifications and Ordering Information. Available online: https://www.chargepoint.com/files/datasheets/ds-cpe200.pdf (accessed on 17 October 2018).
- Plotz, P.; Jakobsson, N.; Sprei, F. On the distribution of individual daily driving distances. Transp. Res. Part B 2017, 101, 213–227. Available online: https://doi.org/10.1016/j.trb.2017.04.008 (accessed on 17 October 2018). [CrossRef]
- New Study Reveals When, Where and How Much Motorists Drive. AAA. Available online: https://newsroom.aaa.com/2015/04/new-study-reveals-much-motorists-drive/ (accessed on 17 October 2018).
- Illinois Power Agency. Electricy Procurement Plan: 2018 Final Plan. 6 April 2017. Available online: https://www2.illinois.gov/sites/ipa/Documents/2018ProcurementPlan/2018-IPA-Procurement-Plan-20180406.pdf (accessed on 11 January 2019).
- ComEd’s Hourly Pricing Program. Available online: https://hourlypricing.comed.com/ (accessed on 17 October 2018).
- PJM Daily Real-Time LMP. Available online: http://www.pjm.com/markets-and-operations/energy/real-time/lmp.aspx (accessed on 17 October 2018).
- Walton, R. How Pepco Is Finding Ways to Shift Demand through Maryland EV Pilot Program. Utility Dive. 18 January 2017. Available online: http://www.utilitydive.com/news/how-pepco-is-finding-ways-to-shift-demand-through-maryland-ev-pilot-program/434156 (accessed on 17 October 2018).
- Zethmayr, J.; Kolata, D. The costs and benefits of real-time pricing: An empirical investigation into consumer bills using hourly energy data and pricing. Electr. J. 2018, 31, 50–57. [Google Scholar] [CrossRef]
- Zhang, J.; Markel, T. Charge Management Optimization for Future TOU Rates. World Electr. Veh. J. 2016, 8, 521. [Google Scholar] [CrossRef]


| Vehicle Model | Drive Type | Battery Size (kWh) | Max L2 A/C Charge Rate (kW) | Efficiency (kWh/100 mi) | Range (mi) |
|---|---|---|---|---|---|
| Prius Prime [11] | PHEV | 8.8 | 3.3 | 25.9 EV/1.38 Hybrid | 30 EV/640 Hybrid |
| Bolt [12] | EV | 60 | 7.7 | 28 | 230 |
| Tesla [13] | EV | 75 | 11.5 | 26 | 310 |
| Product | Charge Rate (kW/hour) |
|---|---|
| ChargePoint CT4000 L2 [14] | 7.2 |
| ChargePoint Express 200 L3 DC [15] | 50 |
| Vehicle | Light (15 mi) | Average (30 mi) | Heavy (50 mi) | Lyft/Uber (100 mi) |
|---|---|---|---|---|
| Prius | 3.9 | 7.8 | 8.8 | 8.8 |
| Bolt | 4.2 | 8.4 | 14 | 28 |
| Tesla | 3.9 | 7.8 | 13 | 26 |
| Hour | 10 July | 11 July | 12 July | 13 July | 14 July | 15 July | 16 July |
|---|---|---|---|---|---|---|---|
| 12 AM | $16.75 | $19.76 | $22.55 | $21.77 | $22.04 | $20.66 | $19.32 |
| 1 AM | $15.17 | $20.09 | $20.54 | $21.96 | $20.13 | $20.88 | $20.64 |
| 2 AM | $14.51 | $19.08 | $18.64 | $20.93 | $20.89 | $18.51 | $17.13 |
| 3 AM | $13.93 | $18.53 | $18.18 | $19.65 | $19.42 | $18.00 | $17.24 |
| 4 AM | $14.52 | $18.61 | $18.77 | $19.61 | $20.17 | $17.63 | $17.26 |
| 5 AM | $17.52 | $20.14 | $20.48 | $20.96 | $21.43 | $17.78 | $11.30 |
| 6 AM | $16.90 | $20.98 | $22.08 | $22.02 | $22.19 | $16.54 | $5.45 |
| 7 AM | $19.09 | $23.11 | $21.91 | $23.76 | $23.86 | $17.45 | $15.92 |
| 8 AM | $19.66 | $25.62 | $22.90 | $25.62 | $25.31 | $20.63 | $19.22 |
| 9 AM | $23.54 | $26.45 | $25.26 | $28.76 | $26.94 | $21.55 | $20.84 |
| 10 AM | $25.60 | $27.62 | $28.16 | $30.26 | $31.96 | $23.68 | $21.64 |
| 11 AM | $26.45 | $30.97 | $27.57 | $37.74 | $33.69 | $26.51 | $24.24 |
| 12 PM | $28.29 | $33.98 | $28.16 | $31.08 | $52.03 | $27.79 | $26.77 |
| 1 PM | $30.24 | $32.58 | $28.89 | $35.56 | $39.26 | $28.95 | $30.89 |
| 2 PM | $28.43 | $46.54 | $31.20 | $46.05 | $38.38 | $28.20 | $34.06 |
| 3 PM | $48.84 | $48.71 | $29.28 | $36.94 | $61.59 | $30.59 | $38.85 |
| 4 PM | $48.18 | $40.93 | $31.47 | $38.85 | $29.50 | $30.22 | $38.66 |
| 5 PM | $115.04 | $35.96 | $32.46 | $36.21 | $29.27 | $60.58 | $50.75 |
| 6 PM | $55.53 | $37.48 | $31.94 | $37.78 | $32.22 | $30.77 | $28.48 |
| 7 PM | $36.70 | $31.70 | $34.95 | $40.42 | $26.69 | $29.72 | $35.05 |
| 8 PM | $37.28 | $30.25 | $37.64 | $35.15 | $26.07 | $26.25 | $27.38 |
| 9 PM | $30.19 | $31.06 | $39.31 | $30.50 | $26.00 | $26.31 | $27.82 |
| 10 PM | $25.96 | $25.99 | $28.46 | $26.17 | $23.85 | $23.57 | $24.37 |
| 11 PM | $22.56 | $24.31 | $24.75 | $23.46 | $19.81 | $20.57 | $20.43 |
| Rank | 10 July | 11 July | 12 July | 13 July | 14 July | 15 July | 16 July |
|---|---|---|---|---|---|---|---|
| 1 | $13.93 | $18.53 | $18.18 | $19.61 | $19.42 | $16.54 | $5.45 |
| 2 | $14.51 | $18.61 | $18.64 | $19.65 | $19.81 | $17.45 | $11.30 |
| 3 | $14.52 | $19.08 | $18.77 | $20.93 | $20.13 | $17.63 | $15.92 |
| 4 | $15.17 | $19.76 | $20.48 | $20.96 | $20.17 | $17.78 | $17.13 |
| 5 | $16.75 | $20.09 | $20.54 | $21.77 | $20.89 | $18.00 | $17.24 |
| 6 | $16.90 | $20.14 | $21.91 | $21.96 | $21.43 | $18.51 | $17.26 |
| 7 | $17.52 | $20.98 | $22.08 | $22.02 | $22.04 | $20.57 | $19.22 |
| 8 | $19.09 | $23.11 | $22.55 | $23.46 | $22.19 | $20.63 | $19.32 |
| 9 | $19.66 | $24.31 | $22.90 | $23.76 | $23.85 | $20.66 | $20.43 |
| 10 | $22.56 | $25.62 | $24.75 | $25.62 | $23.86 | $20.88 | $20.64 |
| 11 | $23.54 | $25.99 | $25.26 | $26.17 | $25.31 | $21.55 | $20.84 |
| 12 | $25.60 | $26.45 | $27.57 | $28.76 | $26.00 | $23.57 | $21.64 |
| 13 | $25.96 | $27.62 | $28.16 | $30.26 | $26.07 | $23.68 | $24.24 |
| 14 | $26.45 | $30.25 | $28.16 | $30.50 | $26.69 | $26.25 | $24.37 |
| 15 | $28.29 | $30.97 | $28.46 | $31.08 | $26.94 | $26.31 | $26.77 |
| 16 | $28.43 | $31.06 | $28.89 | $35.15 | $29.27 | $26.51 | $27.38 |
| 17 | $30.19 | $31.70 | $29.28 | $35.56 | $29.50 | $27.79 | $27.82 |
| 18 | $30.24 | $32.58 | $31.20 | $36.21 | $31.96 | $28.20 | $28.48 |
| 19 | $36.70 | $33.98 | $31.47 | $36.94 | $32.22 | $28.95 | $30.89 |
| 20 | $37.28 | $35.96 | $31.94 | $37.74 | $33.69 | $29.72 | $34.06 |
| 21 | $48.18 | $37.48 | $32.46 | $37.78 | $38.38 | $30.22 | $35.05 |
| 22 | $48.84 | $40.93 | $34.95 | $38.85 | $39.26 | $30.59 | $38.66 |
| 23 | $55.53 | $46.54 | $37.64 | $40.42 | $52.03 | $30.77 | $38.85 |
| 24 | $115.04 | $48.71 | $39.31 | $46.05 | $61.59 | $60.58 | $50.75 |
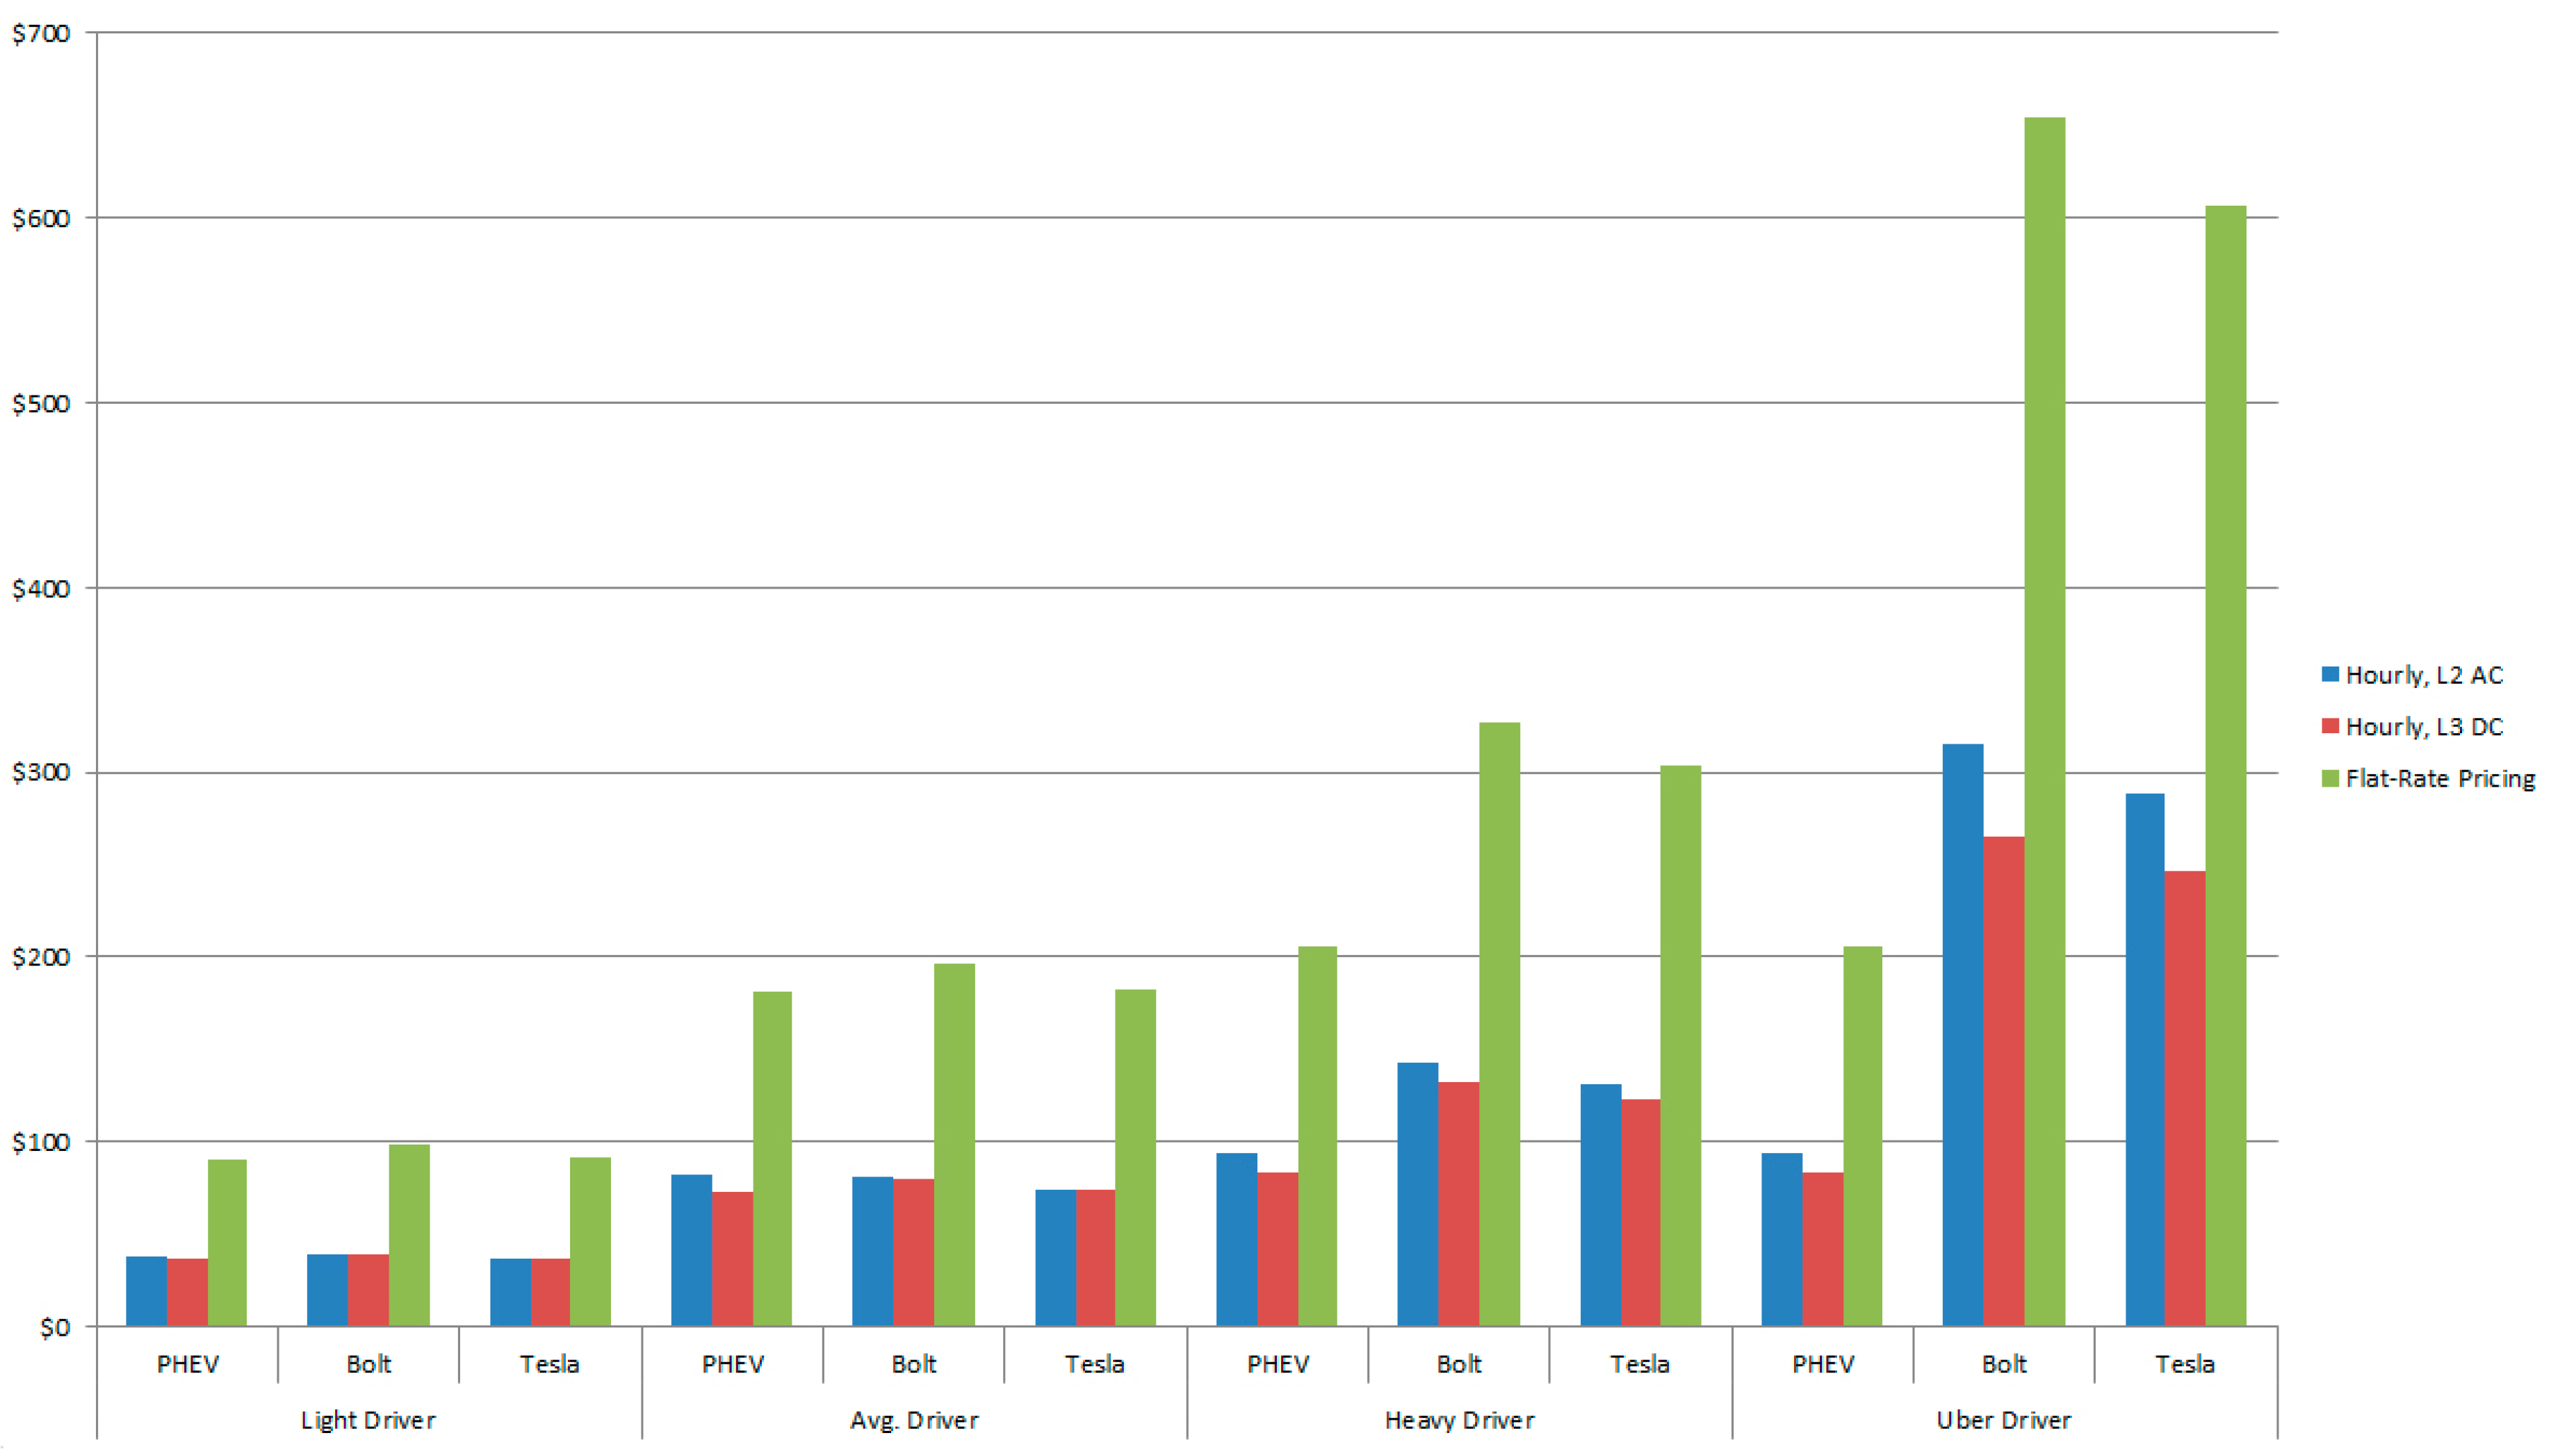
| Driver Profile | Vehicle | Hourly | Flat Rate | % Savings Hourly | $ Savings Hourly |
|---|---|---|---|---|---|
| Light Driver | Prius | $38 | $91 | 58% | $54 |
| Bolt | $40 | $98 | 59% | $58 | |
| Tesla | $37 | $91 | 59% | $54 | |
| Average Driver | Prius | $82 | $181 | 55% | $99 |
| Bolt | $81 | $196 | 59% | $115 | |
| Tesla | $74 | $182 | 59% | $108 | |
| Heavy Driver | Prius | $94 | $205 | 54% | $111 |
| Bolt | $143 | $327 | 56% | $184 | |
| Tesla | $132 | $303 | 57% | $172 | |
| Lyft/Uber | Prius | $94 | $205 | 54% | $111 |
| Bolt | $315 | $654 | 52% | $339 | |
| Tesla | $289 | $607 | 52% | $318 |
© 2019 by the authors. Licensee MDPI, Basel, Switzerland. This article is an open access article distributed under the terms and conditions of the Creative Commons Attribution (CC BY) license (http://creativecommons.org/licenses/by/4.0/).
Share and Cite
Zethmayr, J.; Kolata, D. Charge for Less: An Analysis of Hourly Electricity Pricing for Electric Vehicles. World Electr. Veh. J. 2019, 10, 6. https://doi.org/10.3390/wevj10010006
Zethmayr J, Kolata D. Charge for Less: An Analysis of Hourly Electricity Pricing for Electric Vehicles. World Electric Vehicle Journal. 2019; 10(1):6. https://doi.org/10.3390/wevj10010006
Chicago/Turabian StyleZethmayr, Jeff, and David Kolata. 2019. "Charge for Less: An Analysis of Hourly Electricity Pricing for Electric Vehicles" World Electric Vehicle Journal 10, no. 1: 6. https://doi.org/10.3390/wevj10010006
APA StyleZethmayr, J., & Kolata, D. (2019). Charge for Less: An Analysis of Hourly Electricity Pricing for Electric Vehicles. World Electric Vehicle Journal, 10(1), 6. https://doi.org/10.3390/wevj10010006